distributed spectrum occupancy measurements in the 0.15...
TRANSCRIPT

Institute of Industrial Information TechnologyProf. Dr.-Ing. habil. Klaus Dostert
Distributed Spectrum Occupancy Measurements in the0.15 - 10 MHz Band for LV PLC Networks9th Workshop on Power Line Communications | September 22, 2015Nico Otterbach
KIT – University of the State of Baden-Wuerttemberg and
National Laboratory of the Helmholtz Association
www.kit.edu

Motivation
(Usable) spectrum is a limitedressource
Idea: Dynamic Access⇒ Problem: Avoid interference
Source: brunel.ac.uk
ChallengesCo-existence with wireless systems⇒ Primary User (PU) Detection
Detect low noise frequency sections
Determine spectrum occupancy (noise & PUs)
=⇒ Dynamic Spectrum Access for Cognitive PLC systems
2/21 Distributed Spectrum Occupancy Measurements in the 0.15 - 10 MHz Band for LV PLC NetworksNico Otterbach
Institute of IndustrialInformation Technology

Service Survey
f / MHz1 2 3 4 5 6 7 8 9 100
civil and military broadcasting services
Civil services⇒ Broadcasting services
Military services
Combined services
(Various noise sources)
=⇒ Focus on broadcasting services
3/21 Distributed Spectrum Occupancy Measurements in the 0.15 - 10 MHz Band for LV PLC NetworksNico Otterbach
Institute of IndustrialInformation Technology
Outline
1. Motivation
2. Spectrum Estimation Method
3. Measurement SetupAutomated Measurement SystemCampaign Description
4. AnalysisLocation DiversityTime DiversityTime-Frequency AnalysisWired vs. Wireless
5. Summary
4/21 Distributed Spectrum Occupancy Measurements in the 0.15 - 10 MHz Band for LV PLC NetworksNico Otterbach
Institute of IndustrialInformation Technology
Outline
1. Motivation
2. Spectrum Estimation Method
3. Measurement SetupAutomated Measurement SystemCampaign Description
4. AnalysisLocation DiversityTime DiversityTime-Frequency AnalysisWired vs. Wireless
5. Summary
5/21 Distributed Spectrum Occupancy Measurements in the 0.15 - 10 MHz Band for LV PLC NetworksNico Otterbach
Institute of IndustrialInformation Technology

Spectrum Estimation Method
Energy Detection (ED) as promising approach for PLC systems⇒ Oberservations of the Power Spectral Density (PSD)
Welch’s methodAveraged periodogramsOverlapped blocks of samples
⇒ Consistent estimation⇒ Analysis of stationary random processes
Short-time analysis based on the Short-Time Fourier Transform (STFT)⇒ Basic cyclostationary analysis
=⇒ PSD as rough estimation of occupied spectrum (PUs & noise)
6/21 Distributed Spectrum Occupancy Measurements in the 0.15 - 10 MHz Band for LV PLC NetworksNico Otterbach
Institute of IndustrialInformation Technology

Spectrum Estimation Parameters
PSD parameters
Parameter ValueSample rate 25 MS/s (real-valued)
Number of samples 2,500,000 (5 mains periods)FFT size 4096 (∆f ≈ 6 kHz)Window HanningOverlap 50 %
STFT parameters
Parameter ValueSample rate 25 MS/s (real-valued)
Number of samples 1,000,000 (2 mains periods)DFT size 5000 (∆f = 5 kHz)Window HanningOverlap 50 %
∆t 200 µs
7/21 Distributed Spectrum Occupancy Measurements in the 0.15 - 10 MHz Band for LV PLC NetworksNico Otterbach
Institute of IndustrialInformation Technology

Outline
1. Motivation
2. Spectrum Estimation Method
3. Measurement SetupAutomated Measurement SystemCampaign Description
4. AnalysisLocation DiversityTime DiversityTime-Frequency AnalysisWired vs. Wireless
5. Summary
8/21 Distributed Spectrum Occupancy Measurements in the 0.15 - 10 MHz Band for LV PLC NetworksNico Otterbach
Institute of IndustrialInformation Technology

Automated Measurement System (AMS)
Live-USB Image
Based on SSH⇒ (W-)LAN, 3G/4G, VPN
Central repository
Central control unit
2 time modes (GPS,system time)
Modular design (GNURadio flowgraphs)
⇒ Uniform, automated measurement procedure
⇒ Systematic planning, „offline“ design
⇒ Reduced error probability
⇒ Consistent filing of measurement parameters, results and raw data
9/21 Distributed Spectrum Occupancy Measurements in the 0.15 - 10 MHz Band for LV PLC NetworksNico Otterbach
Institute of IndustrialInformation Technology

Campaign Description
RequirementsMultiple locationsSynchronous measurementsCentral control and monitoringUniform data structureWired/Wireless measurements
Source: google.com
Campaign detailsAll measurements taken at June 11th & 12th in Karlsruhe, Germany
4 Locations: Transformer station, garage, cellar & apartment building
24 hours observation: Every 15 minutes 5 seconds of raw data at 25 MS/s
Additionally 5 minutes of raw data every 6 hours at each location
10/21 Distributed Spectrum Occupancy Measurements in the 0.15 - 10 MHz Band for LV PLC NetworksNico Otterbach
Institute of IndustrialInformation Technology

Outline
1. Motivation
2. Spectrum Estimation Method
3. Measurement SetupAutomated Measurement SystemCampaign Description
4. AnalysisLocation DiversityTime DiversityTime-Frequency AnalysisWired vs. Wireless
5. Summary
11/21 Distributed Spectrum Occupancy Measurements in the 0.15 - 10 MHz Band for LV PLC NetworksNico Otterbach
Institute of IndustrialInformation Technology

Location Diversity
0.0Hz 2.0 MHz 4.0 MHz 6.0 MHz 8.0 MHz 10.0 MHzFrequency
−160
−140
−120
−100
−80
Sca
led
PS
D[V
2/
Hz]
apartment building
garage
cellar
transformer station
−160 −140 −120 −100 −80
Scaled PSD [V2/Hz]
0.00.20.40.60.81.01.21.41.6
Rel
ati
vefr
equ
ency
[%]
garage
apartment building
cellar
transformer station
12/21 Distributed Spectrum Occupancy Measurements in the 0.15 - 10 MHz Band for LV PLC NetworksNico Otterbach
Institute of IndustrialInformation Technology

Location Diversity
0.0Hz 200.0 kHz 400.0 kHz 600.0 kHz 800.0 kHz 1.0 MHzFrequency
−150
−140
−130
−120
−110
−100
−90
−80
−70
Sca
led
PS
D[V
2/
Hz]
apartment building
cellar
transformer station
=⇒ Common features, but highly location-dependent
13/21 Distributed Spectrum Occupancy Measurements in the 0.15 - 10 MHz Band for LV PLC NetworksNico Otterbach
Institute of IndustrialInformation Technology

Time Diversity – Garage, Cellar
PSD
Histogram
Garage Cellar
14/21 Distributed Spectrum Occupancy Measurements in the 0.15 - 10 MHz Band for LV PLC NetworksNico Otterbach
Institute of IndustrialInformation Technology

Time Diversity – Transformer, Apartment
PSD
Histogram
Transformer station Apartment building
15/21 Distributed Spectrum Occupancy Measurements in the 0.15 - 10 MHz Band for LV PLC NetworksNico Otterbach
Institute of IndustrialInformation Technology

STFT Analysis – Garage, Transformer
Garage
5.0 ms 10.0 ms 15.0 ms 20.0 ms 25.0 ms 30.0 ms 35.0 msTime
0.0Hz
2.0 MHz
4.0 MHz
6.0 MHz
8.0 MHz
10.0 MHz
Fre
qu
ency
−195
−180
−165
−150
−135
−120
−105
−90
−75
Sca
led
PS
D[d
BV
2/
Hz]
5.0 ms 10.0 ms 15.0 ms 20.0 ms 25.0 ms 30.0 ms 35.0 msTime
0.0Hz
2.0 MHz
4.0 MHz
6.0 MHz
8.0 MHz
10.0 MHz
Fre
qu
ency
−195
−180
−165
−150
−135
−120
−105
−90
−75
Sca
led
PS
D[d
BV
2/
Hz]
Transformer station
5.0 ms 10.0 ms 15.0 ms 20.0 ms 25.0 ms 30.0 ms 35.0 msTime
0.0Hz
2.0 MHz
4.0 MHz
6.0 MHz
8.0 MHz
10.0 MHz
Fre
qu
ency
−200
−180
−160
−140
−120
−100
−80
−60
Sca
led
PS
D[d
BV
2/
Hz]
5.0 ms 10.0 ms 15.0 ms 20.0 ms 25.0 ms 30.0 ms 35.0 msTime
0.0Hz
2.0 MHz
4.0 MHz
6.0 MHz
8.0 MHz
10.0 MHz
Fre
qu
ency
−200
−180
−160
−140
−120
−100
−80
−60
Sca
led
PS
D[d
BV
2/
Hz]
06/12 03:15 06/12 15:15
16/21 Distributed Spectrum Occupancy Measurements in the 0.15 - 10 MHz Band for LV PLC NetworksNico Otterbach
Institute of IndustrialInformation Technology
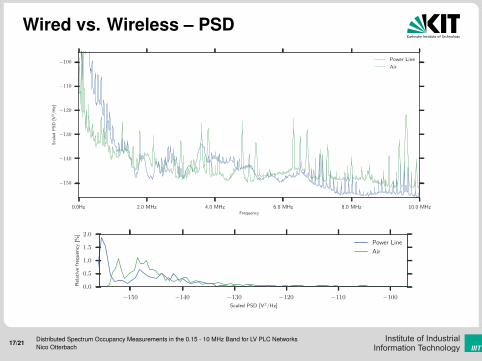
Wired vs. Wireless – PSD
0.0Hz 2.0 MHz 4.0 MHz 6.0 MHz 8.0 MHz 10.0 MHzFrequency
−150
−140
−130
−120
−110
−100
Sca
led
PS
D[V
2/
Hz]
Power Line
Air
−150 −140 −130 −120 −110 −100
Scaled PSD [V2/Hz]
0.0
0.5
1.0
1.5
2.0
Rel
ati
vefr
equ
ency
[%]
Power Line
Air
17/21 Distributed Spectrum Occupancy Measurements in the 0.15 - 10 MHz Band for LV PLC NetworksNico Otterbach
Institute of IndustrialInformation Technology

Wired vs. Wireless – Time Diversity
STFT
5.0 ms 10.0 ms 15.0 ms 20.0 ms 25.0 ms 30.0 ms 35.0 msTime
0.0Hz
2.0 MHz
4.0 MHz
6.0 MHz
8.0 MHz
10.0 MHz
Fre
qu
ency
−210
−195
−180
−165
−150
−135
−120
−105
Sca
led
PS
D[d
BV
2/
Hz]
5.0 ms 10.0 ms 15.0 ms 20.0 ms 25.0 ms 30.0 ms 35.0 msTime
0.0Hz
2.0 MHz
4.0 MHz
6.0 MHz
8.0 MHz
10.0 MHz
Fre
qu
ency
−195
−180
−165
−150
−135
−120
−105
Sca
led
PS
D[d
BV
2/
Hz]
06/12 03:15 06/12 15:15PSD & Histogram
18/21 Distributed Spectrum Occupancy Measurements in the 0.15 - 10 MHz Band for LV PLC NetworksNico Otterbach
Institute of IndustrialInformation Technology

Outline
1. Motivation
2. Spectrum Estimation Method
3. Measurement SetupAutomated Measurement SystemCampaign Description
4. AnalysisLocation DiversityTime DiversityTime-Frequency AnalysisWired vs. Wireless
5. Summary
19/21 Distributed Spectrum Occupancy Measurements in the 0.15 - 10 MHz Band for LV PLC NetworksNico Otterbach
Institute of IndustrialInformation Technology

Summary & Outlook
Basic Observations towards spectrum sensing & occupancy estimation
Novel, Software-Defined Radio based Automated Measurement System
Spectrum occupancy is highly dependent on the location⇒ Distributed, cooperative spectrum sensing
Spectrum occupancy is highly dependent on the (day) time⇒ Application of machine learning algorithms
(Centralized) Wireless measurements to enhance PU detection accuracy
Analysis still work in progress⇒ More sophisticated detection algorithms⇒ Dedicated detection of Primary User signals⇒ Occupancy evaluation divided into noise/PUs⇒ Define (frequency-dependent) occupancy levels/spectrum masks⇒ Duty cycle models
⇒ Distributed, adaptive sensing for DSA/Cognitve PLC systems
20/21 Distributed Spectrum Occupancy Measurements in the 0.15 - 10 MHz Band for LV PLC NetworksNico Otterbach
Institute of IndustrialInformation Technology

Questions?
Thank you for your attention!
21/21 Distributed Spectrum Occupancy Measurements in the 0.15 - 10 MHz Band for LV PLC NetworksNico Otterbach
Institute of IndustrialInformation Technology