distributed monitoring and analysis for telecom requirements · pdf filedistributed monitoring...
TRANSCRIPT

KDDI Research Inc. Proprietary and Confidential
Distributed Monitoring and Analysis for Telecom Requirements
Yuki Kasuya <[email protected]> KDDI Research
Ryota Mibu <[email protected]> NEC
Tomofumi Hayashi <[email protected]> RedHat

KDDI Research Inc. Proprietary and Confidential
Members

KDDI Research Inc. Proprietary and Confidential
Agenda
1
2
3
4
Goal
Requirements / Challenges
Solution / Architecture
Feasible Study
3
5 Conclusion

KDDI Research Inc. Proprietary and Confidential
1. Goal

KDDI Research Inc. Proprietary and Confidential
Telecom Operation Goal
n High Quality Network l High Speed l Low Latency l Not Congested l Wide Area l etc...
l NO Network Outage

KDDI Research Inc. Proprietary and Confidential
n Complex
l Massive Component
l Virtualisation Layer
6
How to Operate NFV

KDDI Research Inc. Proprietary and Confidential
Changing Operation Style
Reactive Operation
Periodic Operation
Proactive Operation
Cost Reduction
Agility
Proactive
Reactive
24/7 maintenance
9am - 5pm maintenance
7
before broken, do prevention

KDDI Research Inc. Proprietary and Confidential 8
3 Steps for Proactive Operation
Fault Detect Resolve Recover
time
Reactive
recover

KDDI Research Inc. Proprietary and Confidential 9
1st Step
Fault Detect Resolve Recover
time
Resolve
Reactive
Recover Fault Detect
recover

KDDI Research Inc. Proprietary and Confidential 10
2nd Step
Fault Detect Resolve Recover
time
Resolve
Reactive
Recover Fault Detect
recover

KDDI Research Inc. Proprietary and Confidential 11
3rd Step
Fault Detect Resolve Recover
time
Resolve
Reactive
Proactive
Recover Fault Detect
recover
KDDI Research Inc. Proprietary and Confidential 12
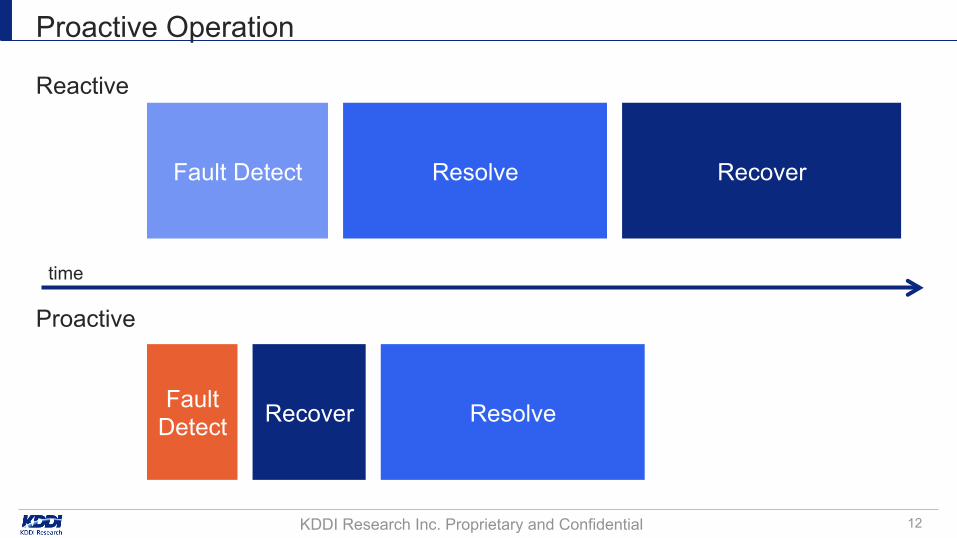
Proactive Operation
Fault Detect Resolve Recover
time
Resolve
Reactive
Proactive
Recover Fault Detect

KDDI Research Inc. Proprietary and Confidential
2. Requirements / Challenges

KDDI Research Inc. Proprietary and Confidential
n Remote Access l L2TP/IPSec, SSL-VPN
n Security l Firewall, URL Filtering, Antivirus, WAF, DPI, IPS/IDS
n Storage l NAS
n Traffic Control l DNS, Wi-Fi Control, LB
n And More... l IP-PBX, Traffic Optimizer, Content Cache, Content Compression
14
NFV Applications

KDDI Research Inc. Proprietary and Confidential
We need to adopt more advanced monitoring
n Increase Monitoring Targets
n Increase Monitoring Items
n Shorten Monitoring Interval
15
Requirements for Telecom’s Proactive Operation

KDDI Research Inc. Proprietary and Confidential
n Network functions (Firewall, DPI, LB, …) are provided as VMs
n Service function VMs are divided for various reasons l Performance l Security l APL Configuration
n Telecom needs to monitor a large number of targets
• 1000 – 10000 VMs
16
Increase Monitoring Targets
About 100 VMs per service
10-20 service function
Future vision: Service Function Chaining
VM VM VM
DPI VM
FW VM
LB VM
DPI VM
DPI VM
FW VM
LB VM
DPI VM
Thousands instances for monitor

KDDI Research Inc. Proprietary and Confidential
n General cloud monitoring l detect server stop
n Telecom’s monitoring l detect silent failure ⇒ Novel approaches like AI
l We want to use a large quantity data • About 100 - 1000 data /1 server • Performance
– CPU, Memory, Load, Swap, Network, Disk IO, ...
• Fault – Alarm, Error message, ...
17
Increase Monitoring Items Example: NEC's MasterScope Invariant Analyzer
Performance data of about 1000 items
per server
The more data, the more unknown failure AI can discover
CPU util
NW bandwidth
Learning
CPU is used for network processing
Analysis
CPU util is still high without network

KDDI Research Inc. Proprietary and Confidential
n Existing data for metering (Ceilometer etc.) l Collect data every
few minutes
n Telecom high availability l Service stop should be
less than 1 second l We aim for fault detection
in 0.1 second
n Metering data does not suit the purpose
18
Shorten Monitoring Interval
time time
Bandwidth Bandwidth
Recovery start is delayed
Fault detection is missed
If we use metering data for monitoring…

KDDI Research Inc. Proprietary and Confidential
n We need a architecture capable of collecting a large amount of data
n How do you collect these data?
19
Challenges
1000-10000 targets 100-1000 items 0.1 second interval

KDDI Research Inc. Proprietary and Confidential
3. Solution / Architecture

KDDI Research Inc. Proprietary and Confidential
n 1 Monitoring Function l 1000 Targets - 10000 Targets l * Items l * Interval
n Reduce Targets l 1 Monitoring Function manage
21
Limitation Monitoring Function
VM
VNF VNF
VM VM
VNF VNF
VM
DB analyzer
evaluator
collector
poller

KDDI Research Inc. Proprietary and Confidential
n Each Computing has Its Monitoring Function l Monitoring process is complete
in each computing node
n What is Good? l Real-time(Fine-grained) monitoring l Less Load l Scalable
DMA (Distributed Monitoring and Analysis )
VM analyzer
evaluator
collector
DB
analytics result
concise data
poller
22
VNF
VM analyzer
evaluator
collector
poller VNF

KDDI Research Inc. Proprietary and Confidential
DMA Architecture Detail
Poller/Notification
libvirt API
SNMP Get
SNMP Trap
Collector In-Memory
Meter Translator
Evaluator
Analytics Engine
Fault Detection
(Prediction)
Statistical Analysis
Alarm Correlation
Transmitter
Fault Alarm
Statistical Data
OpenStack API
...
Perf. Data (CPU/Memory...)
Guest.
(Alarm)
Fault data
Perf. data (CPU/Memory...)
Host.
(Alarm)
Fault data
Fault Data
...
A Computing Node
23
Perf. data

KDDI Research Inc. Proprietary and Confidential
Total Architecture
24
VNF VNF
DB
detail data
traffic data
VM VM
analyzer
evaluator
collector
poller
Data Analysis(ceilometer) Fault Management(DMA)
VM analyzer
evaluator
collector
DB
analytics result
concise data
poller VNF
VM analyzer
evaluator
collector
poller VNF
&

KDDI Research Inc. Proprietary and Confidential
4. Feasible Study

KDDI Research Inc. Proprietary and Confidential
DMA Architecture Detail
C
Poller/Notification
libvirt API
SNMP Get
SNMP Trap
Collector Database
Meter Translator
Evaluator
Analytics Engine
Fault Detection
(Prediction)
Statistical Analysis
Alarm Correlation
Transmitter
Fault Alarm
Statistical Data
OpenStack API
...
Perf. Data (CPU/Memory...)
Guest.
(Alarm)
Fault data
Perf. data (CPU/Memory...)
Host.
(Alarm)
Fault data
Fault Data
...
A Computing Node
26
Perf. data

KDDI Research Inc. Proprietary and Confidential
DMA Architecture Detail
C
Poller/Notification
libvirt API
SNMP Get
SNMP Trap
Collector Database
Meter Translator
Evaluator
Analytics Engine
Fault Detection
(Prediction)
Statistical Analysis
Alarm Correlation
Transmitter
Fault Alarm
Statistical Data
OpenStack API
...
Perf. Data (CPU/Memory...)
Guest.
(Alarm)
Fault data
Perf. data (CPU/Memory...)
Host.
(Alarm)
Fault data
Fault Data
...
A Computing Node
27
Perf. data

KDDI Research Inc. Proprietary and Confidential
What is the Goal?
28
n The Goal: Identify which framework can be suitable/feasible to our requirement on statistics collection l Scenario: Detect micro burst traffic?
l Key Metric: Less performance impact on scaling situation (VM and node) • CPU Usage on node
n Target Framework l Ceilometer l Collectd l Monasca
300sec
Burst Traffic UDP8kb x 1k pkt Usual Traffic
Total:1000sec

OpenStack Target Framework
Equipments
n Newton (RDO) l CentOS 7.3 l MariaDB 10.1.20-1.el7 l RabbitMQ
n Controller x 1 l CPU: Xeon E3-1230v5 3.40GHz 8core l Memory: 32G l NIC x 2 (IPMI,Mgmt / API,Tenant)
n Compute x 4 l CPU: Xeon E5-2420/E31240/X3450 l Memory: 24G/32G l NIC x 2 (IPMI,Mgmt / API,Tenant)
n Ceilometer 7.0.2
l Output: Gnocchi 3.0.5
n Collectd l Output: Redis 3.2.8-1.el7
n Monasca 1.3.1 l Agents are in compute node l Metrics DB: Influxdb 0.9.5-1
29

KDDI Research Inc. Proprietary and Confidential
n Environment l Micro burst traffic case (one VM in node does huge traffic in 1sec every 1min)
n Examination l Can Framework detect microburst? l How much CPU does the framework use?
n Target Process l Ceilometer
• api, collector, notification, polling, polling-central, gnocchi-api, gnocchi-metricd, gnocchi-statsd
l Collectd • collectd, redis
l Monasca • api, collector, forwarder, kafka, persister, storm-supervisor, supervisord, zookeeper
n Parameters l Interval to get metrics: 300 sec, 60 sec, 10 sec, 1 sec, 0.1 sec (collectd supports 0.1sec interval)
30
The Study Details

KDDI Research Inc. Proprietary and Confidential
Ceilometer (Rx Traffic)
31
0 10 20 30 40 50 60 70 80 90 100
0 200 400 600 800 1000
Received
Traffic [M
bps]
Time [second]
1sec
10sec
0 10 20 30 40 50 60 70 80 90 100
0 200 400 600 800 1000
Received
Traffic [M
bps]
Time [second]
60sec
300sec

KDDI Research Inc. Proprietary and Confidential
Collectd (Rx Traffic)
32
0
20
40
60
80
100
0 200 400 600 800 1000
Received
Traffic [M
bps]
Time [second]
0.1sec
0
10
20
30
40
50
60
70
80
90
100
0 200 400 600 800 1000
Received
Traffic [M
bps]
Time [second]
1sec
10sec
60sec
300sec

KDDI Research Inc. Proprietary and Confidential
Monasca (Rx Traffic)
33
0 10 20 30 40 50 60 70 80 90 100
0 200 400 600 800 1000
Received
Traffic [M
bps]
Time [second]
1sec
10sec
0 10 20 30 40 50 60 70 80 90 100
0 200 400 600 800 1000
Received
Traffic [M
bps]
Time [second]
60sec
300sec

KDDI Research Inc. Proprietary and Confidential
CPU Usage (Sum of each processes’ CPU%)
34
Sum of CPU% min max mean median
Ceilometer 1sec 16 493 234.4429371 226 10sec 11 286 65.4810989 24 60sec 10 409.32 48.07490509 18 300sec 9 479 44.21182817 17
collectd 0.1sec 3.97 121 30.30854146 7 1sec 0 104 8.273686314 1 10sec 0 104 5.763236763 0 60sec 0 105 5.66033966 0 300sec 0 101 6.524475524 0
monasca(controller) 1sec 0 30 3.424285714 3 10sec 0 29 3.29953047 3 60sec 0 64 3.554995005 3 300sec 0 19 3.743066933 3
monasca(compute) 1sec 0 205 133.8796004 148 10sec 0 6 0.635334665 0 60sec 0 6 0.375624376 0 300sec 0 6 0.356593407 0

KDDI Research Inc. Proprietary and Confidential
n Ceilometer (designed for telemetry) l Gnocchi is good performance l Gnocchi CLI shows the latest data after 1min l Shorter intervals make rabbitmq busy state
n Collectd l Good performance in short interval l Redis is feasible to our requirements in data storing point of view
• No need to store in long time (last 1 day is enough) • Need quick access (in-memory DB)
n Monasca (designed for centralized monitoring) l Current monasca-agent designed for 15sec/30sec interval, usually
• Less than 3sec interval, monasca-agent does not work (not supported?) • But it is reasonable interval for usual monitoring
l Asynchronous processing (to put DB) makes 1-3 sec delay to visible • Monasca-api receives the data but it is not appeared immediately • Kafka seems bulk/batch data
35
So what is learned?
KDDI Research Inc. Proprietary and Confidential
5. Conclusion

KDDI Research Inc. Proprietary and Confidential
n High Quality Network Service
n Proactive Operation
n Monitoring
n DMA
Conclusion
VM analyzer
evaluator
collector
DB
analytics result
concise data
poller VNF
VM analyzer
evaluator
collector
poller VNF

KDDI Research Inc. Proprietary and Confidential 38
Future Work
Poller/Notification
libvirt API
SNMP Get
SNMP Trap
Collector In-Memory
Meter Translator
Evaluator
Analytics Engine
Fault Detection
(Prediction)
Statistical Analysis
Alarm Correlation
Transmitter
Fault Alarm
Statistical Data
OpenStack API
...
Perf. Data (CPU/Memory...)
Guest.
(Alarm)
Fault data
Perf. data (CPU/Memory...)
Host.
(Alarm)
Fault data
Fault Data
...
A Computing Node
Perf. data

KDDI Research Inc. Proprietary and Confidential
n Appendix: http://goo.gl/oAeGC5 n Etherpad: https://etherpad.openstack.org/p/dma-discussion n Contact: [email protected]
Join us
39