distributed energy resources in nevada
TRANSCRIPT

April 28th, 2016
Evaluating the Economics of Distributed Energy Resources in Nevada
** Preliminary Results, Seeking Input**
SolarCity Confidential Slide 2 2
Agenda
•
•
•
SolarCity Confidential Slide 3 3
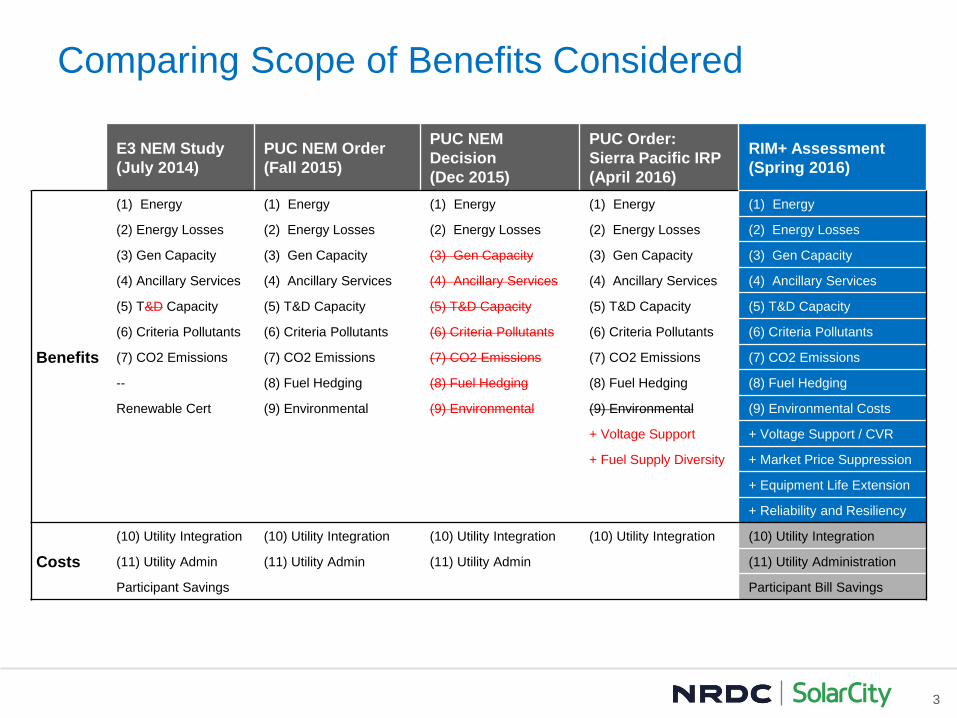
Comparing Scope of Benefits Considered
E3 NEM Study
(July 2014)
PUC NEM Order
(Fall 2015)
PUC NEM
Decision
(Dec 2015)
PUC Order:
Sierra Pacific IRP
(April 2016)
RIM+ Assessment
(Spring 2016)
Benefits
(1) Energy (1) Energy (1) Energy (1) Energy (1) Energy
(2) Energy Losses (2) Energy Losses (2) Energy Losses (2) Energy Losses (2) Energy Losses
(3) Gen Capacity (3) Gen Capacity (3) Gen Capacity (3) Gen Capacity (3) Gen Capacity
(4) Ancillary Services (4) Ancillary Services (4) Ancillary Services (4) Ancillary Services (4) Ancillary Services
(5) T&D Capacity (5) T&D Capacity (5) T&D Capacity (5) T&D Capacity (5) T&D Capacity
(6) Criteria Pollutants (6) Criteria Pollutants (6) Criteria Pollutants (6) Criteria Pollutants (6) Criteria Pollutants
(7) CO2 Emissions (7) CO2 Emissions (7) CO2 Emissions (7) CO2 Emissions (7) CO2 Emissions
-- (8) Fuel Hedging (8) Fuel Hedging (8) Fuel Hedging (8) Fuel Hedging
Renewable Cert (9) Environmental (9) Environmental (9) Environmental (9) Environmental Costs
+ Voltage Support + Voltage Support / CVR
+ Fuel Supply Diversity + Market Price Suppression
+ Equipment Life Extension
+ Reliability and Resiliency
Costs
(10) Utility Integration (10) Utility Integration (10) Utility Integration (10) Utility Integration (10) Utility Integration
(11) Utility Admin (11) Utility Admin (11) Utility Admin (11) Utility Administration
Participant Savings Participant Bill Savings

SolarCity Confidential Slide 4 4
Previous NEM Impacts Evaluation (2014) Study prepared for Nevada PUC by Energy+Environmental Economics
Study found a 4 cent/kwh net benefit to all customers
for NEM rooftop solar systems installed in 2014-2016
$0.00
$0.02
$0.04
$0.06
$0.08
$0.10
$0.12
$0.14
$0.16
$0.18
$0.20
Costs
$/k
wh
(L
ev
elized
2014$)
Utility Incentives
NEM Program Costs
Integration Costs
Participant Bill Savings
Avoided RPS
Avoided Carbon DioxideEmission Cost
Transmission and DistributionCapacity
Ancillary Services
Avoided Capacity
Energy Losses/Line Losses
Avoided Energy
Source:ttp://puc.nv.gov/uploadedFiles/pucnvgov/Content/About/M
edia_Outreach/Announcements/Announcements/E3%20PUCN%2
0NEM%20Report%202014.pdf?pdf=Net-Metering-Study
Benefits
Net Benefit
of 4c/kwh

SolarCity Confidential Slide 5 5
General Analytical Approach
E3 Nevada NEM Public Tool Updated Inputs for 2016+

SolarCity Confidential Slide 6 6
Scenarios Explored in Updated Analysis
Deployment Timeframe Policy Technology
2017-2019 Net Energy Metering PV + Smart Inverters
2020-2022 Net Energy Metering with
Mandatory TOU Rates
PV + Smarter Inverters +
Energy Storage + Load
Control

SolarCity Confidential Slide 7 7
Preliminary Results: NEM PV drives net benefits for
all Nevada customers
Energy
Gen Capacity
T&D Capacity
Environment
CO2 Emissions
Losses Ancillary Svcs
Voltage / CVR
Equipment Life
Integration Admin
Participant Bill Savings
$0.020
$0.030
$0.00
$0.02
$0.04
$0.06
$0.08
$0.10
$0.12
StandardBenefits
Costs Net Benefit AdditionalBenefits
Net Benefit
$/k
Wh
Net Benefits of NEM PV (2016)
Source: Analysis utilizing E3 Nevada Public Tool and specified inputs and methodologies
** Preliminary Results, Seeking Input**

SolarCity Confidential Slide 8 8
Preliminary Results
RIM+ Assessment
PV + Smart Inverters
(2017-2019)
+ Storage & Load Control
(2020-2022)
Benefits
(1) Energy 3.1 cents/kwh
(2) Energy Losses 0.5 cents/kwh
(3) Gen Capacity 2.6 cents/kwh +++
(4) Ancillary Services 0.1 cents/kwh
(5) T&D Capacity 2.8 cents/kwh +++
(6) Criteria Pollutants 0.1 cents/kwh
(7) CO2 Emissions 0.9 cents/kwh
(8) Fuel Hedging TBD
(9) Environmental costs 1.7 cents/kwh
+ Voltage Support / CVR 0.5 cents/kwh
+ Market Price Suppression TBD
+ Equipment Life Extension 0.5 cents/kwh
+ Reliability and Resiliency N/A ++
Costs
(10) Utility Integration 0.2 cents/kwh
(11) Utility Administration 0.1 cents/kwh
Participant Bill Savings 9.5 cents/kwh +
Net Benefit >3.0 cents/kwh TBD: Net Benefit
Source: Analysis utilizing E3 Nevada Public Tool and specified inputs and methodologies
** Preliminary Results,
Seeking Input**
SolarCity Confidential Slide 9 9
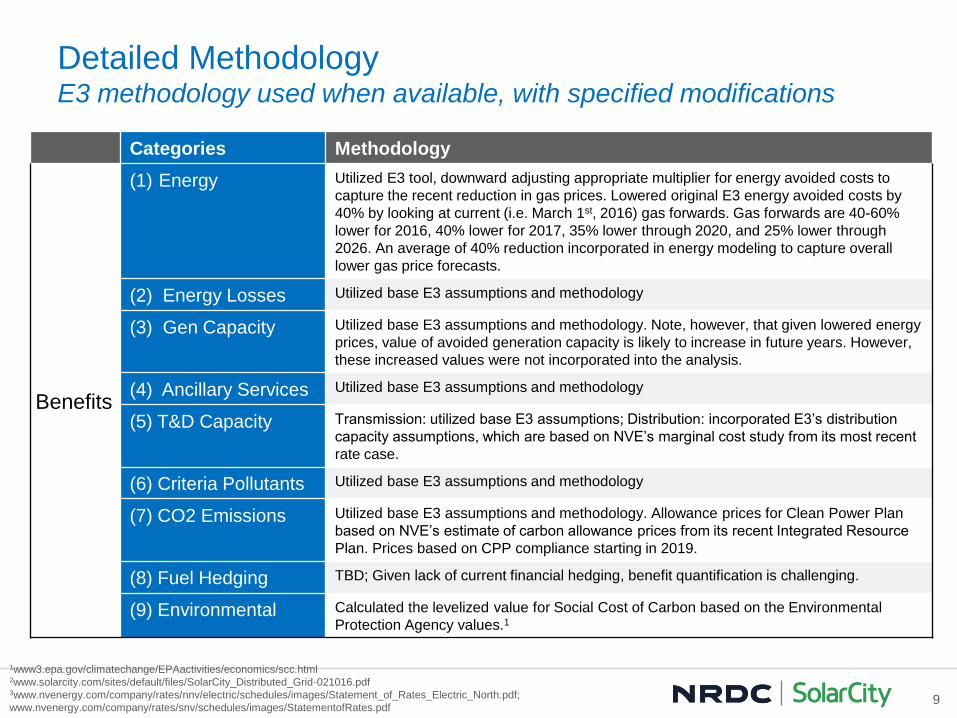
Detailed Methodology E3 methodology used when available, with specified modifications
Categories Methodology
Benefits
(1) Energy Utilized E3 tool, downward adjusting appropriate multiplier for energy avoided costs to
capture the recent reduction in gas prices. Lowered original E3 energy avoided costs by
40% by looking at current (i.e. March 1st, 2016) gas forwards. Gas forwards are 40-60%
lower for 2016, 40% lower for 2017, 35% lower through 2020, and 25% lower through
2026. An average of 40% reduction incorporated in energy modeling to capture overall
lower gas price forecasts.
(2) Energy Losses Utilized base E3 assumptions and methodology
(3) Gen Capacity Utilized base E3 assumptions and methodology. Note, however, that given lowered energy
prices, value of avoided generation capacity is likely to increase in future years. However,
these increased values were not incorporated into the analysis.
(4) Ancillary Services Utilized base E3 assumptions and methodology
(5) T&D Capacity Transmission: utilized base E3 assumptions; Distribution: incorporated E3’s distribution
capacity assumptions, which are based on NVE’s marginal cost study from its most recent
rate case.
(6) Criteria Pollutants Utilized base E3 assumptions and methodology
(7) CO2 Emissions Utilized base E3 assumptions and methodology. Allowance prices for Clean Power Plan
based on NVE’s estimate of carbon allowance prices from its recent Integrated Resource
Plan. Prices based on CPP compliance starting in 2019.
(8) Fuel Hedging TBD; Given lack of current financial hedging, benefit quantification is challenging.
(9) Environmental Calculated the levelized value for Social Cost of Carbon based on the Environmental
Protection Agency values.1
1www3.epa.gov/climatechange/EPAactivities/economics/scc.html 2www.solarcity.com/sites/default/files/SolarCity_Distributed_Grid-021016.pdf 3www.nvenergy.com/company/rates/nnv/electric/schedules/images/Statement_of_Rates_Electric_North.pdf;
www.nvenergy.com/company/rates/snv/schedules/images/StatementofRates.pdf

SolarCity Confidential Slide 10 10
Detailed Methodology E3 methodology used when available, with specified modifications
Categories Methodology
Benefits + Renewable
Certificates
Original E3 methodology included credits; however, solar costs have come down
significantly since 2014. Therefore, no incremental value for renewable energy certificates
was included.
+ Voltage Support /
CVR
Utilized voltage and consumption data related to demonstration projects to quantify the
value of the reduction of energy consumption and CO2 emissions from the use of PV smart
inverters within conservation voltage reduction schemes.
+ Market Price
Suppression
In the absence of hourly wholesale market price data, the potential avoided cost from
market price suppression is challenging to quantify. For reference, in California, the value
of market price suppression was quantified to be [$0.05 / kWh].2 Given lower energy
prices, the value of market price suppression is expected to be lower in Nevada albeit
above zero.
+ Equipment Life
Extension
Utilized IEEE C57.12.00-2000 standard per unit life calculation methodology to quantify the
increased life for medium to large liquid-filled transformers from typical load and DER
generation profiles.2
+ Reliability and
Resiliency
N/a: Reliability and resiliency benefits assumed to be realized from the addition of energy
storage.
Costs (10) Utility Integration Utilized base E3 assumptions and methodology
(11) Utility
Administration
Utilized base E3 assumptions and methodology
Participant Bill
Savings
Update to current NVE retail rates3. Utilize E3’s lowest scenario for rate escalation: 0.5%
escalation after 2019, instead of base assumption of 1.4%. 0.5% escalation is based on
NVE’s IRP projections through 2020.
1www3.epa.gov/climatechange/EPAactivities/economics/scc.html 2www.solarcity.com/sites/default/files/SolarCity_Distributed_Grid-021016.pdf 3www.nvenergy.com/company/rates/nnv/electric/schedules/images/Statement_of_Rates_Electric_North.pdf;
www.nvenergy.com/company/rates/snv/schedules/images/StatementofRates.pdf

SolarCity Confidential Slide 11 11
Next steps
•
•
•

SolarCity Confidential Slide 12 12
Thank you
SolarCity Confidential Slide 13 13
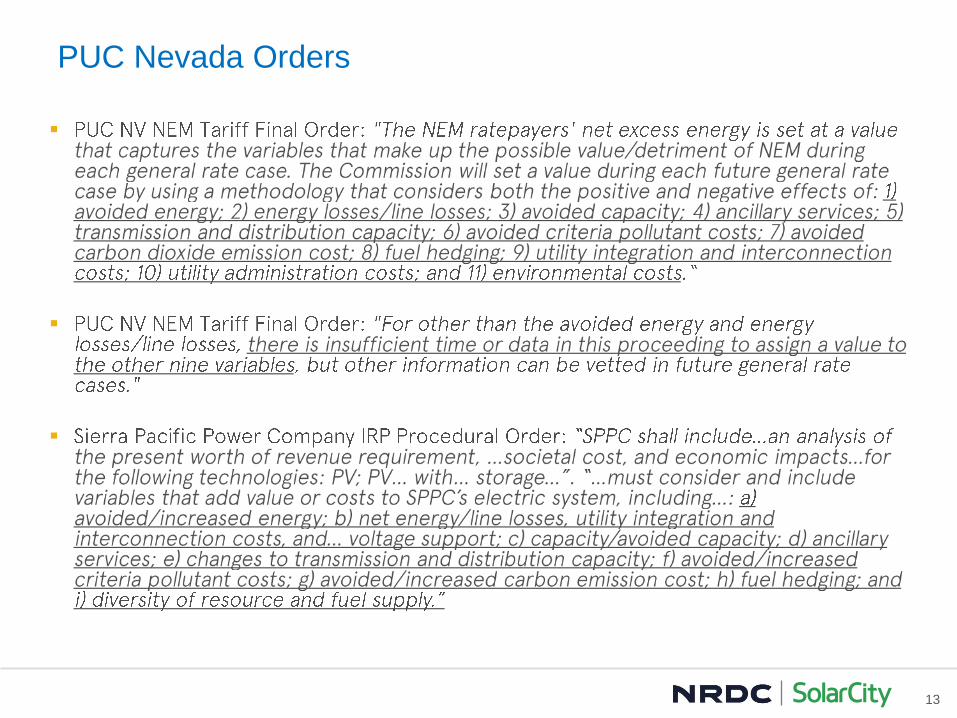
PUC Nevada Orders
SolarCity Confidential Slide 14 14
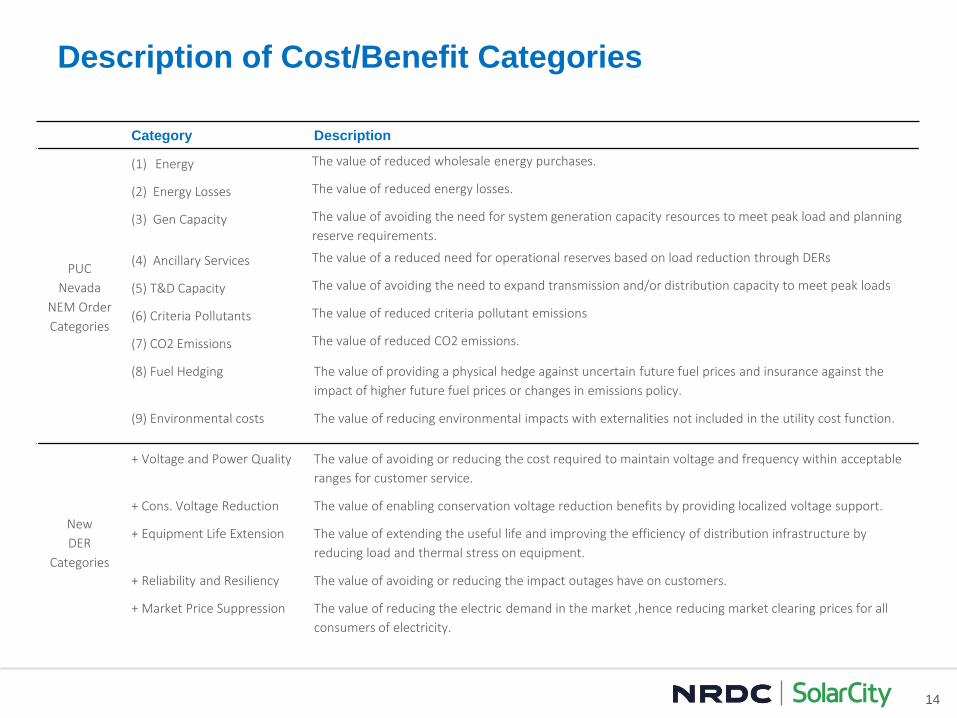
Description of Cost/Benefit Categories
Category Description
PUC
Nevada
NEM Order
Categories
(1) Energy The value of reduced wholesale energy purchases.
(2) Energy Losses The value of reduced energy losses.
(3) Gen Capacity The value of avoiding the need for system generation capacity resources to meet peak load and planning
reserve requirements.
(4) Ancillary Services The value of a reduced need for operational reserves based on load reduction through DERs
(5) T&D Capacity The value of avoiding the need to expand transmission and/or distribution capacity to meet peak loads
(6) Criteria Pollutants The value of reduced criteria pollutant emissions
(7) CO2 Emissions The value of reduced CO2 emissions.
(8) Fuel Hedging The value of providing a physical hedge against uncertain future fuel prices and insurance against the
impact of higher future fuel prices or changes in emissions policy.
(9) Environmental costs The value of reducing environmental impacts with externalities not included in the utility cost function.
New
DER
Categories
+ Voltage and Power Quality The value of avoiding or reducing the cost required to maintain voltage and frequency within acceptable
ranges for customer service.
+ Cons. Voltage Reduction The value of enabling conservation voltage reduction benefits by providing localized voltage support.
+ Equipment Life Extension The value of extending the useful life and improving the efficiency of distribution infrastructure by
reducing load and thermal stress on equipment.
+ Reliability and Resiliency The value of avoiding or reducing the impact outages have on customers.
+ Market Price Suppression The value of reducing the electric demand in the market ,hence reducing market clearing prices for all
consumers of electricity.
SolarCity Confidential Slide 15 15
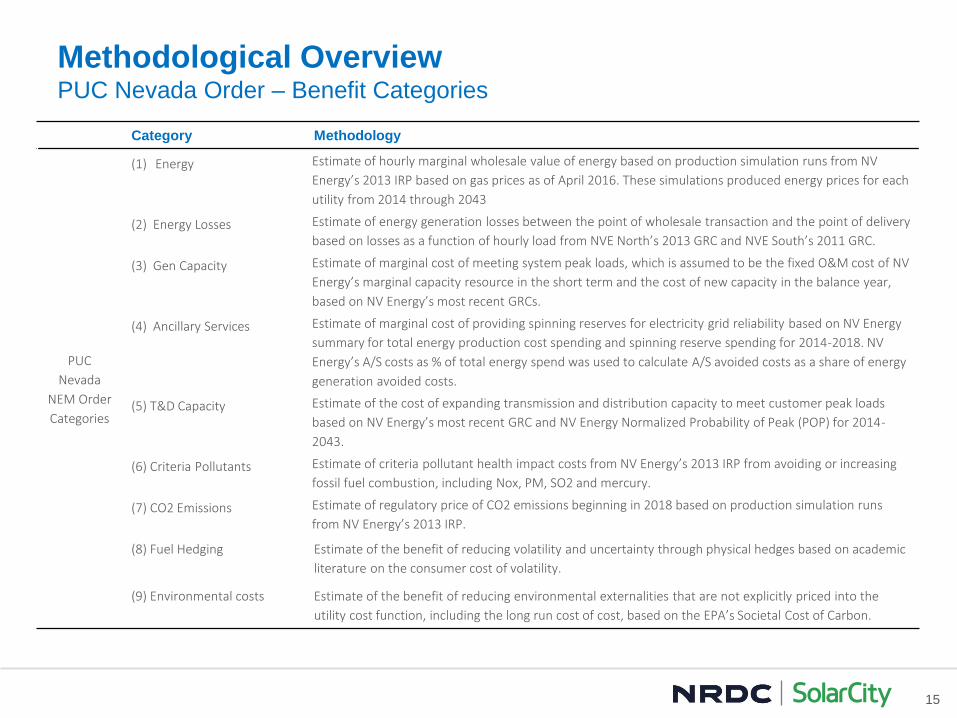
Methodological Overview PUC Nevada Order – Benefit Categories
Category Methodology
PUC
Nevada
NEM Order
Categories
(1) Energy Estimate of hourly marginal wholesale value of energy based on production simulation runs from NV
Energy’s 2013 IRP based on gas prices as of April 2016. These simulations produced energy prices for each
utility from 2014 through 2043
(2) Energy Losses Estimate of energy generation losses between the point of wholesale transaction and the point of delivery
based on losses as a function of hourly load from NVE North’s 2013 GRC and NVE South’s 2011 GRC.
(3) Gen Capacity Estimate of marginal cost of meeting system peak loads, which is assumed to be the fixed O&M cost of NV
Energy’s marginal capacity resource in the short term and the cost of new capacity in the balance year,
based on NV Energy’s most recent GRCs.
(4) Ancillary Services Estimate of marginal cost of providing spinning reserves for electricity grid reliability based on NV Energy
summary for total energy production cost spending and spinning reserve spending for 2014-2018. NV
Energy’s A/S costs as % of total energy spend was used to calculate A/S avoided costs as a share of energy
generation avoided costs.
(5) T&D Capacity Estimate of the cost of expanding transmission and distribution capacity to meet customer peak loads
based on NV Energy’s most recent GRC and NV Energy Normalized Probability of Peak (POP) for 2014-
2043.
(6) Criteria Pollutants Estimate of criteria pollutant health impact costs from NV Energy’s 2013 IRP from avoiding or increasing
fossil fuel combustion, including Nox, PM, SO2 and mercury.
(7) CO2 Emissions Estimate of regulatory price of CO2 emissions beginning in 2018 based on production simulation runs
from NV Energy’s 2013 IRP.
(8) Fuel Hedging Estimate of the benefit of reducing volatility and uncertainty through physical hedges based on academic
literature on the consumer cost of volatility.
(9) Environmental costs Estimate of the benefit of reducing environmental externalities that are not explicitly priced into the
utility cost function, including the long run cost of cost, based on the EPA’s Societal Cost of Carbon.

SolarCity Confidential Slide 16 16
Methodological Overview Additional DER Categories
Category Methodology
New
DER
Categories
+ Voltage and Power Quality Estimate of the utility equipment costs related to voltage and power quality that can be avoided by Smart
Inverters based on equipment costs provided by Black and Veatch for the WECC area.
+ Cons. Voltage Reduction Estimate of the incremental energy savings that can be enabled by Smart Inverters providing
conservation voltage reduction by reducing customer service voltages in order to achieve a
corresponding reduction in energy consumption.
+ Equipment Life Extension Estimate of the benefits of reducing peak and average load on transmission and distribution equipment
that reduces equipment degradation and correspondingly extends useful life based on IEEE thermal
degradation models.
+ Reliability and Resiliency Estimate of the value of customer outages that are avoided by DERs based on the Department of
Energy’s value of lost load (VOLL) ICE calculator.
+ Market Price Suppression Estimate of the value of reducing the electric demand in the market ,hence reducing market prices for all
consumers of electricity, based on hourly Long Term Procurement Plan (LTPP) production simulations for
the year 2024, NVE IRP filings and NYMEX forward gas prices.