distr.: general english only - unfcccunfccc.int/resource/docs/2015/arr/lux.pdf · the ert has not...
TRANSCRIPT

GE.15-09541 (E)
Report on the individual review of the annual submission of Luxembourg submitted in 2014*
* In the symbol for this document, 2014 refers to the year in which the inventory was submitted, and
not to the year of publication.
United Nations FCCC/ARR/2014/LUX
Distr.: General
12 May 2015
English only
FCCC/ARR/2014/LUX
2
Contents
Paragraphs Page
I. Introduction and summary ...................................................................................... 1–6 3
II. Technical assessment of the annual submission ...................................................... 7–103 4
A. Overview ........................................................................................................ 7–21 4
B. Energy ............................................................................................................. 22–36 10
C. Industrial processes and solvent and other product use .................................. 37–46 14
D. Agriculture ...................................................................................................... 47–54 16
E. Land use, land-use change and forestry .......................................................... 55–72 19
F. Waste .............................................................................................................. 73–80 23
G. Supplementary information required under
Article 7, paragraph 1, of the Kyoto Protocol ................................................. 81–103 25
III. Conclusions and recommendations ......................................................................... 104–105 30
A. Conclusions .................................................................................................... 104 30
B. Recommendations ........................................................................................... 105 32
IV. Questions of implementation .................................................................................. 106 36
Annexes
I. Information to be included in the compilation and accounting database ......................................... 37
II. Documents and information used during the review ........................................................................ 42
III. Acronyms and abbreviations ............................................................................................................ 44
FCCC/ARR/2014/LUX
3
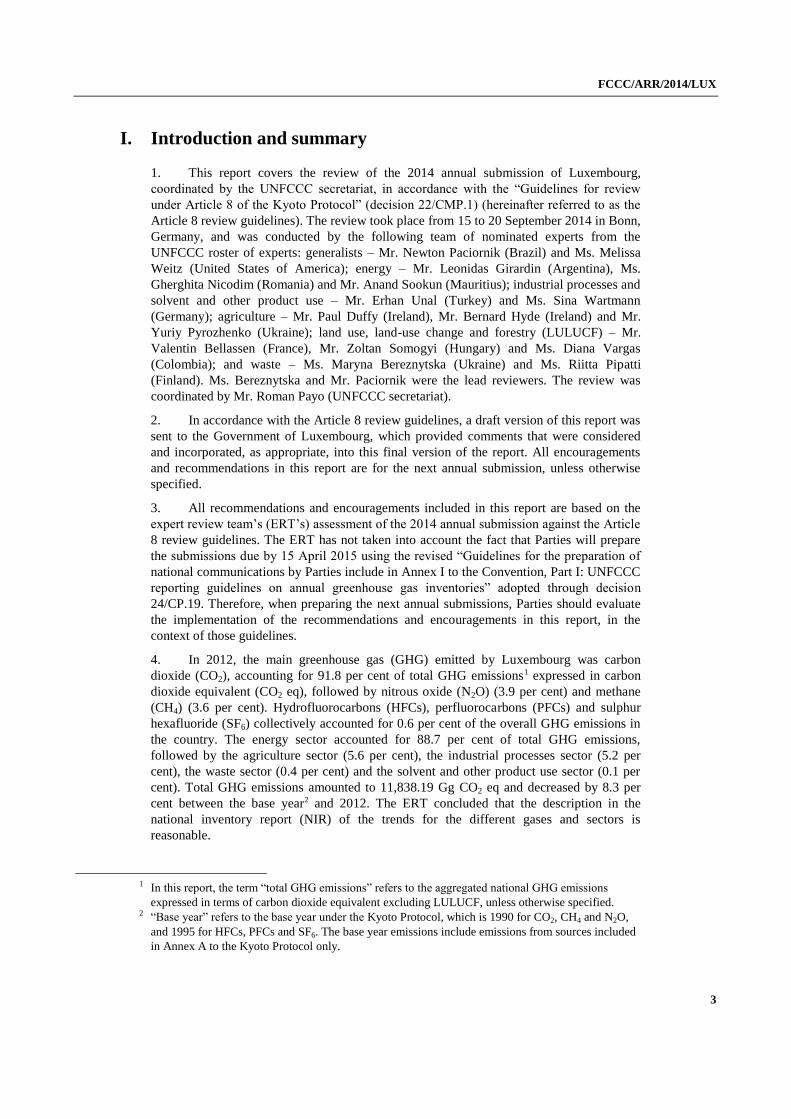
I. Introduction and summary
1. This report covers the review of the 2014 annual submission of Luxembourg,
coordinated by the UNFCCC secretariat, in accordance with the “Guidelines for review
under Article 8 of the Kyoto Protocol” (decision 22/CMP.1) (hereinafter referred to as the
Article 8 review guidelines). The review took place from 15 to 20 September 2014 in Bonn,
Germany, and was conducted by the following team of nominated experts from the
UNFCCC roster of experts: generalists – Mr. Newton Paciornik (Brazil) and Ms. Melissa
Weitz (United States of America); energy – Mr. Leonidas Girardin (Argentina), Ms.
Gherghita Nicodim (Romania) and Mr. Anand Sookun (Mauritius); industrial processes and
solvent and other product use – Mr. Erhan Unal (Turkey) and Ms. Sina Wartmann
(Germany); agriculture – Mr. Paul Duffy (Ireland), Mr. Bernard Hyde (Ireland) and Mr.
Yuriy Pyrozhenko (Ukraine); land use, land-use change and forestry (LULUCF) – Mr.
Valentin Bellassen (France), Mr. Zoltan Somogyi (Hungary) and Ms. Diana Vargas
(Colombia); and waste – Ms. Maryna Bereznytska (Ukraine) and Ms. Riitta Pipatti
(Finland). Ms. Bereznytska and Mr. Paciornik were the lead reviewers. The review was
coordinated by Mr. Roman Payo (UNFCCC secretariat).
2. In accordance with the Article 8 review guidelines, a draft version of this report was
sent to the Government of Luxembourg, which provided comments that were considered
and incorporated, as appropriate, into this final version of the report. All encouragements
and recommendations in this report are for the next annual submission, unless otherwise
specified.
3. All recommendations and encouragements included in this report are based on the
expert review team’s (ERT’s) assessment of the 2014 annual submission against the Article
8 review guidelines. The ERT has not taken into account the fact that Parties will prepare
the submissions due by 15 April 2015 using the revised “Guidelines for the preparation of
national communications by Parties include in Annex I to the Convention, Part I: UNFCCC
reporting guidelines on annual greenhouse gas inventories” adopted through decision
24/CP.19. Therefore, when preparing the next annual submissions, Parties should evaluate
the implementation of the recommendations and encouragements in this report, in the
context of those guidelines.
4. In 2012, the main greenhouse gas (GHG) emitted by Luxembourg was carbon
dioxide (CO2), accounting for 91.8 per cent of total GHG emissions1 expressed in carbon
dioxide equivalent (CO2 eq), followed by nitrous oxide (N2O) (3.9 per cent) and methane
(CH4) (3.6 per cent). Hydrofluorocarbons (HFCs), perfluorocarbons (PFCs) and sulphur
hexafluoride (SF6) collectively accounted for 0.6 per cent of the overall GHG emissions in
the country. The energy sector accounted for 88.7 per cent of total GHG emissions,
followed by the agriculture sector (5.6 per cent), the industrial processes sector (5.2 per
cent), the waste sector (0.4 per cent) and the solvent and other product use sector (0.1 per
cent). Total GHG emissions amounted to 11,838.19 Gg CO2 eq and decreased by 8.3 per
cent between the base year2 and 2012. The ERT concluded that the description in the
national inventory report (NIR) of the trends for the different gases and sectors is
reasonable.
1 In this report, the term “total GHG emissions” refers to the aggregated national GHG emissions
expressed in terms of carbon dioxide equivalent excluding LULUCF, unless otherwise specified.
2 “Base year” refers to the base year under the Kyoto Protocol, which is 1990 for CO2, CH4 and N2O,
and 1995 for HFCs, PFCs and SF6. The base year emissions include emissions from sources included
in Annex A to the Kyoto Protocol only.

FCCC/ARR/2014/LUX
4
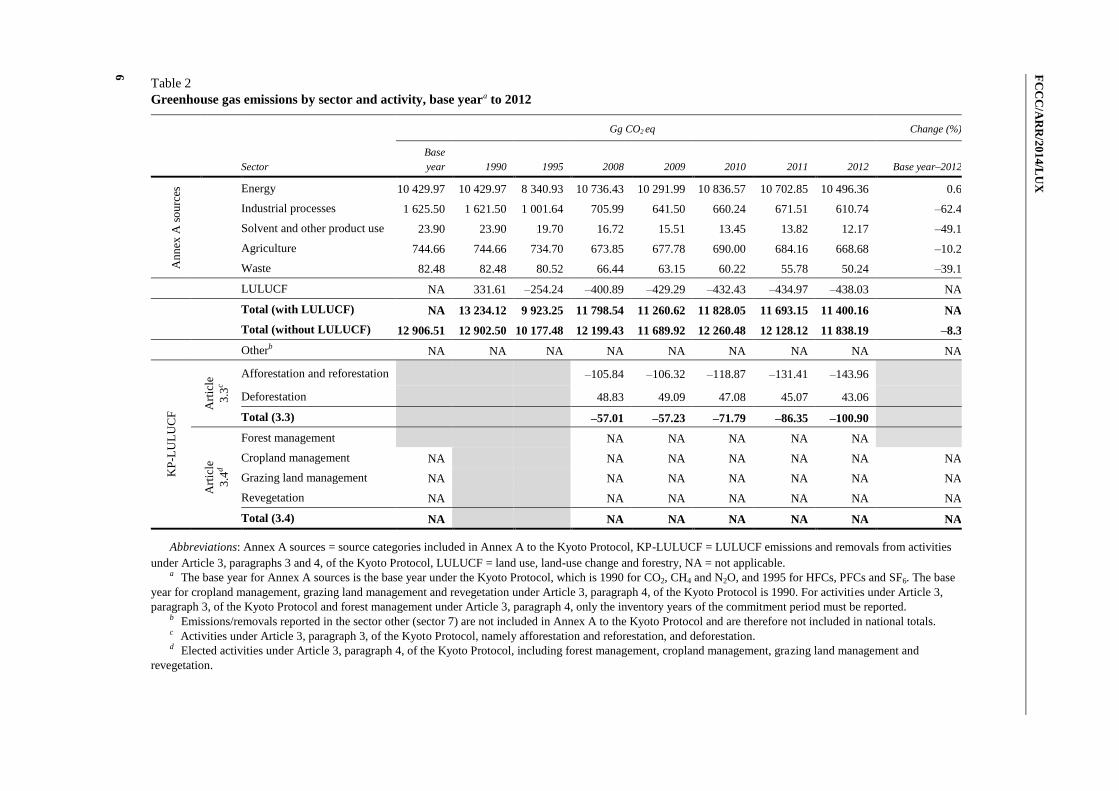
5. Tables 1 and 2 show GHG emissions from sources included in Annex A to the
Kyoto Protocol (hereinafter referred to as Annex A sources), emissions and removals from
the LULUCF sector under the Convention and emissions and removals from activities
under Article 3, paragraph 3, and, if any, elected activities under Article 3, paragraph 4, of
the Kyoto Protocol (KP-LULUCF), by gas and by sector and activity, respectively.
6. Information to be included in the compilation and accounting database can be found
in annex I to this report.
II. Technical assessment of the annual submission
A. Overview
1. Annual submission and other sources of information
7. The 2014 annual submission was submitted on 15 April 2014; it contains a complete
set of common reporting format (CRF) tables for the period 1990–2012 and an NIR.
Luxembourg submitted a revised NIR on 22 May 2014. Luxembourg also submitted the
information required under Article 7, paragraph 1, of the Kyoto Protocol, including
information on: activities under Article 3, paragraphs 3 and 4, of the Kyoto Protocol,
accounting of Kyoto Protocol units, changes in the national system and in the national
registry and the minimization of adverse impacts in accordance with Article 3, paragraph
14, of the Kyoto Protocol. The standard electronic format (SEF) tables were submitted on
15 April 2014. The annual submission was submitted in accordance with decision
15/CMP.1.
8. Luxembourg submitted revised emission estimates on 7 November 2014 and on 17
November 2014 in response to the list of potential problems and further questions raised by
the ERT (see paras. 49, 52 and 87–91 below). The values used in this report are those
submitted by Luxembourg on 17 November 2014.
9. The list of other materials used during the review is provided in annex II to this
report.
2. Questions of implementation raised in the 2013 annual review report
10. The ERT noted that no questions of implementation have been raised in the 2013
annual review report.

FC
CC
/AR
R/2
01
4/L
UX
5
Table 1
Greenhouse gas emissions from Annex A sources and emissions/removals from activities under Article 3, paragraphs 3 and 4, of
the Kyoto Protocol by gas, base yeara to 2012
Gg CO2 eq Change (%)
Greenhouse
gas Base year 1990 1995 2008 2009 2010 2011 2012 Base year–2012
An
nex
A s
ou
rces
CO2 11 950.29 11 950.29 9 210.08 11 207.20 10 703.32 11 255.14 11 138.34 10 870.11 –9.0
CH4 462.45 462.45 470.44 446.76 444.34 451.07 434.15 427.12 –7.6
N2O 476.62 476.62 479.83 475.19 469.58 480.22 480.68 465.39 –2.4
HFCs 15.59 12.01 15.59 63.46 65.47 66.47 67.01 67.26 331.5
PFCs NA, NO NA, NO NA, NO 0.24 0.22 0.20 0.18 0.16 NA
SF6 1.55 1.13 1.55 6.57 7.00 7.39 7.75 8.14 423.8
KP
-LU
LU
CF
Art
icle
3.3
b
CO2 –57.76 –57.99 –72.49 –86.99 –101.49
CH4 NO NO NO NO NO
N2O 0.75 0.76 0.70 0.64 0.58
Art
icle
3.4
c CO2 NA NA NA NA NA NA NA
CH4 NA NA NA NA NA NA NA
N2O NA
NA NA NA NA NA NA
Abbreviations: Annex A sources = source categories included in Annex A to the Kyoto Protocol, KP-LULUCF = land use, land-use change and forestry emissions
and removals from activities under Article 3, paragraphs 3 and 4, of the Kyoto Protocol, NA = not applicable, NO = not occurring. a The base year for Annex A sources refers to the base year under the Kyoto Protocol, which is 1990 for CO2, CH4 and N2O, and 1995 for HFCs, PFCs and SF6.
The base year for cropland management, grazing land management and revegetation under Article 3, paragraph 4, of the Kyoto Protocol is 1990. For activities under
Article 3, paragraph 3, of the Kyoto Protocol and forest management under Article 3, paragraph 4, only the inventory years of the commitment period must be reported. b Activities under Article 3, paragraph 3, of the Kyoto Protocol, namely afforestation and reforestation, and deforestation. c Elected activities under Article 3, paragraph 4, of the Kyoto Protocol, including forest management, cropland management, grazing land management and
revegetation.
FC
CC
/AR
R/2
01
4/L
UX
6
Table 2
Greenhouse gas emissions by sector and activity, base yeara to 2012
Gg CO2 eq Change (%)
Sector
Base
year 1990 1995 2008 2009 2010 2011 2012 Base year–2012
An
nex
A s
ou
rces
Energy 10 429.97 10 429.97 8 340.93 10 736.43 10 291.99 10 836.57 10 702.85 10 496.36 0.6
Industrial processes 1 625.50 1 621.50 1 001.64 705.99 641.50 660.24 671.51 610.74 –62.4
Solvent and other product use 23.90 23.90 19.70 16.72 15.51 13.45 13.82 12.17 –49.1
Agriculture 744.66 744.66 734.70 673.85 677.78 690.00 684.16 668.68 –10.2
Waste 82.48 82.48 80.52 66.44 63.15 60.22 55.78 50.24 –39.1
LULUCF NA 331.61 –254.24 –400.89 –429.29 –432.43 –434.97 –438.03 NA
Total (with LULUCF) NA 13 234.12 9 923.25 11 798.54 11 260.62 11 828.05 11 693.15 11 400.16 NA
Total (without LULUCF) 12 906.51 12 902.50 10 177.48 12 199.43 11 689.92 12 260.48 12 128.12 11 838.19 –8.3
Otherb NA NA NA NA NA NA NA NA NA
KP
-LU
LU
CF
Art
icle
3.3
c
Afforestation and reforestation –105.84 –106.32 –118.87 –131.41 –143.96
Deforestation 48.83 49.09 47.08 45.07 43.06
Total (3.3) –57.01 –57.23 –71.79 –86.35 –100.90
Art
icle
3.4
d
Forest management NA NA NA NA NA
Cropland management NA NA NA NA NA NA NA
Grazing land management NA NA NA NA NA NA NA
Revegetation NA NA NA NA NA NA NA
Total (3.4) NA NA NA NA NA NA NA
Abbreviations: Annex A sources = source categories included in Annex A to the Kyoto Protocol, KP-LULUCF = LULUCF emissions and removals from activities
under Article 3, paragraphs 3 and 4, of the Kyoto Protocol, LULUCF = land use, land-use change and forestry, NA = not applicable. a The base year for Annex A sources is the base year under the Kyoto Protocol, which is 1990 for CO2, CH4 and N2O, and 1995 for HFCs, PFCs and SF6. The base
year for cropland management, grazing land management and revegetation under Article 3, paragraph 4, of the Kyoto Protocol is 1990. For activities under Article 3,
paragraph 3, of the Kyoto Protocol and forest management under Article 3, paragraph 4, only the inventory years of the commitment period must be reported. b Emissions/removals reported in the sector other (sector 7) are not included in Annex A to the Kyoto Protocol and are therefore not included in national totals. c Activities under Article 3, paragraph 3, of the Kyoto Protocol, namely afforestation and reforestation, and deforestation. d Elected activities under Article 3, paragraph 4, of the Kyoto Protocol, including forest management, cropland management, grazing land management and
revegetation.

FCCC/ARR/2014/LUX
7
3. Overall assessment of the inventory
11. Table 3 contains the ERT’s overall assessment of the annual submission of
Luxembourg. For recommendations for improvements for specific categories, please see
the paragraphs cross-referenced in the table.
Table 3
The expert review team’s overall assessment of the annual submission
Issue ERT assessment General findings and recommendations
The ERT’s findings on completeness
Annex A sourcesa Complete Mandatory: none
Non-mandatory: “NE” is reported for potential emissions of
HFCs from refrigeration and air-conditioning equipment,
foam blowing and aerosols/metered dose inhalers; potential
emissions of SF6 from electrical equipment; CH4 emissions
from enteric fermentation – other (poultry); and CH4
emissions from direct soil emissions and indirect soil
emissions under agricultural soils
The ERT encourages Luxembourg to estimate and report
emissions from all non-mandatory categories
Land use, land-use change and
forestrya
Complete Mandatory: none
Non-mandatory: “NE” is reported for the carbon stock
changes in living biomass, dead organic matter and soils for
wetlands remaining wetlands and settlements remaining
settlements; CO2, CH4 and N2O emissions from biomass
burning on settlements; and CO2, CH4 and N2O emissions
from harvested wood products
The ERT encourages Luxembourg to estimate and report
emissions from all non-mandatory categories
KP-LULUCF Complete
The ERT’s findings on recalculations
and time-series consistency
Transparency of recalculations Sufficiently
transparent
Please see paragraphs 25 and 38 below for category-specific
findings
Time-series consistency Sufficiently
consistent
Please see paragraphs 40 and 46 below for category-specific
findings
The ERT’s findings on QA/QC
procedures
Sufficient Luxembourg has elaborated a QA/QC plan and has
implemented tier 1 QA/QC procedures in accordance with
that plan. Please see paragraphs 14, 26, 30, 38 and 59 below
for category-specific recommendations
The ERT’s findings on transparency Sufficiently
transparent
Please see paragraphs 25, 31, 33, 35, 43, 58, 60, 64, 83 and
86 below for category-specific recommendations

FCCC/ARR/2014/LUX
8
Abbreviations: Annex A sources = source categories included in Annex A to the Kyoto Protocol, ERT = expert review team,
KP-LULUCF = land use, land-use change and forestry emissions and removals from activities under Article 3, paragraphs 3 and
4, of the Kyoto Protocol, NE = not estimated, QA/QC = quality assurance/quality control. a The assessment of completeness by the ERT considers only the completeness of reporting of mandatory categories (i.e.
categories for which methods and default emission factors are provided in the Intergovernmental Panel on Climate Change
(IPCC) Revised 1996 IPCC Guidelines for National Greenhouse Gas Inventories, the IPCC Good Practice Guidance and
Uncertainty Management in National Greenhouse Gas Inventories or the IPCC Good Practice Guidance for Land Use, Land-Use
Change and Forestry).
4. Description of the institutional arrangements for inventory preparation, including the
legal and procedural arrangements for inventory planning, preparation and
management
Inventory planning
12. The NIR and additional information provided by Luxembourg during the review
described the national system for the preparation of the inventory. As indicated by
Luxembourg in its NIR, there were no changes to the inventory planning process. The
description of the inventory planning process, as contained in the report of the individual
review of the annual submission of Luxembourg submitted in 2013,3 remains relevant.
13. Luxembourg included an update in the NIR on its efforts to increase staffing for
inventory development. As stated in chapter 13 of the NIR (page 475), the inventory team
has been reinforced by two experts.
14. Luxembourg has elaborated a quality assurance/quality control (QA/QC) plan, and
has ensured capacity for timely performance of the QA/QC procedures. However, the ERT
identified several inconsistencies between the CRF tables and the NIR that indicate issues
with the QA/QC process. For example, solid waste disposal sites is listed as a key category
by trend assessment for 2012 in the NIR, but is not identified as such in the CRF tables.
The uncertainty values noted on page 81 of the NIR are incorrect and have not been
updated with the latest results for uncertainty. The ERT recommends that the Party address
these issues and improve the effectiveness of its QA/QC procedures.
Inventory preparation
15. Table 4 contains the ERT’s assessment of Luxembourg’s inventory preparation
process. For improvements related to specific categories, please see the paragraphs cross-
referenced in the table.
Table 4
Assessment of inventory preparation by Luxembourg
Issue ERT assessment ERT findings and recommendations
Key category analysis
Was the key category analysis performed in
accordance with the IPCC good practice guidance
and the IPCC good practice guidance for LULUCF?
Yes Level and trend analysis performed,
including and excluding LULUCF
Approach followed? Tier 1
Were additional key categories identified using a
qualitative approach?
No
3 FCCC/ARR/2013/LUX, paragraphs 10–11.
FCCC/ARR/2014/LUX
9
Issue ERT assessment ERT findings and recommendations
Has Luxembourg identified key categories for
activities under Article 3, paragraphs 3 and 4, of the
Kyoto Protocol following the guidance on
establishing the relationship between the activities
under the Kyoto Protocol and the associated key
categories in the UNFCCC inventory?
Yes Luxembourg followed the guidance. None
of the mandatory Article 3, paragraph 3,
activities Luxembourg opted for are
identified as key according to the
quantitative analysis
Does Luxembourg use the key category analysis to
prioritize inventory improvements?
Yes
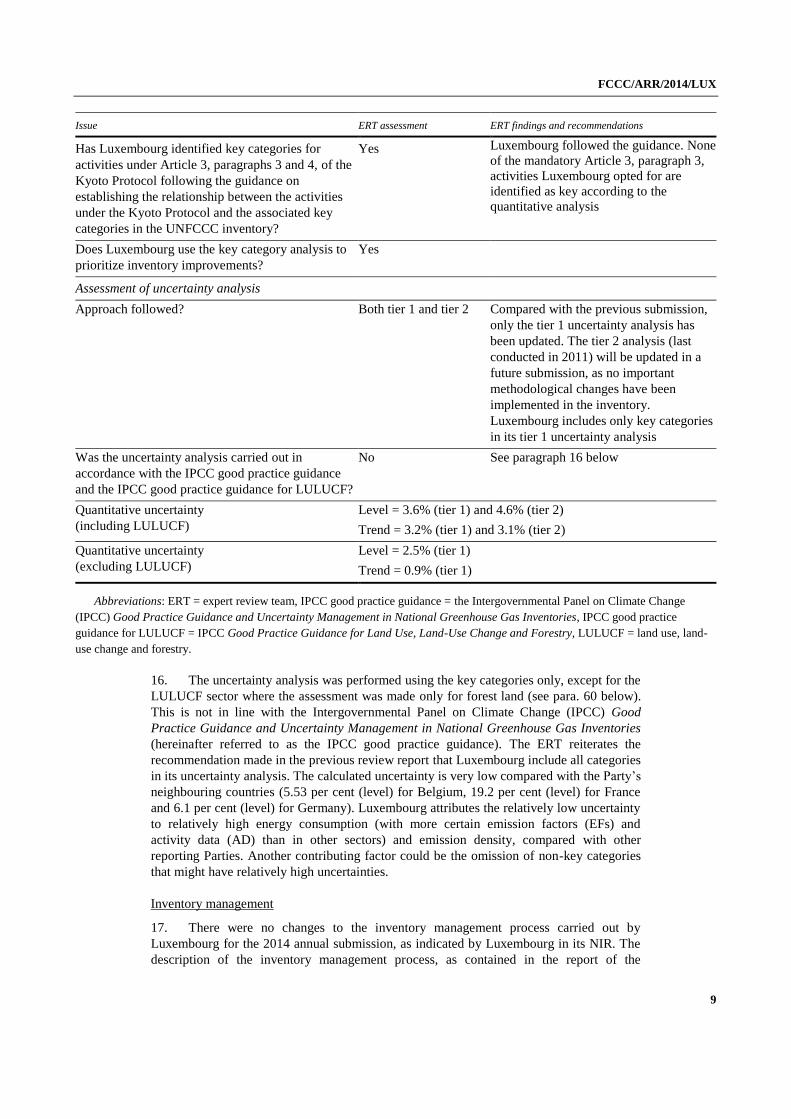
Assessment of uncertainty analysis
Approach followed? Both tier 1 and tier 2 Compared with the previous submission,
only the tier 1 uncertainty analysis has
been updated. The tier 2 analysis (last
conducted in 2011) will be updated in a
future submission, as no important
methodological changes have been
implemented in the inventory.
Luxembourg includes only key categories
in its tier 1 uncertainty analysis
Was the uncertainty analysis carried out in
accordance with the IPCC good practice guidance
and the IPCC good practice guidance for LULUCF?
No See paragraph 16 below
Quantitative uncertainty
(including LULUCF)
Level = 3.6% (tier 1) and 4.6% (tier 2)
Trend = 3.2% (tier 1) and 3.1% (tier 2)
Quantitative uncertainty
(excluding LULUCF)
Level = 2.5% (tier 1)
Trend = 0.9% (tier 1)
Abbreviations: ERT = expert review team, IPCC good practice guidance = the Intergovernmental Panel on Climate Change
(IPCC) Good Practice Guidance and Uncertainty Management in National Greenhouse Gas Inventories, IPCC good practice
guidance for LULUCF = IPCC Good Practice Guidance for Land Use, Land-Use Change and Forestry, LULUCF = land use, land-
use change and forestry.
16. The uncertainty analysis was performed using the key categories only, except for the
LULUCF sector where the assessment was made only for forest land (see para. 60 below).
This is not in line with the Intergovernmental Panel on Climate Change (IPCC) Good
Practice Guidance and Uncertainty Management in National Greenhouse Gas Inventories
(hereinafter referred to as the IPCC good practice guidance). The ERT reiterates the
recommendation made in the previous review report that Luxembourg include all categories
in its uncertainty analysis. The calculated uncertainty is very low compared with the Party’s
neighbouring countries (5.53 per cent (level) for Belgium, 19.2 per cent (level) for France
and 6.1 per cent (level) for Germany). Luxembourg attributes the relatively low uncertainty
to relatively high energy consumption (with more certain emission factors (EFs) and
activity data (AD) than in other sectors) and emission density, compared with other
reporting Parties. Another contributing factor could be the omission of non-key categories
that might have relatively high uncertainties.
Inventory management
17. There were no changes to the inventory management process carried out by
Luxembourg for the 2014 annual submission, as indicated by Luxembourg in its NIR. The
description of the inventory management process, as contained in the report of the

FCCC/ARR/2014/LUX
10
individual review of the annual submission of Luxembourg submitted in 2013,4 remains
relevant.
18. The 2014 annual submission notes that Luxembourg is in the process of switching to
a centralized database for the 2015 submission. Luxembourg provided an update during the
review, in response to questions raised by the ERT, noting that the database software is
already in place, and that Luxembourg is adapting the calculation sheets to the Extensible
Markup Language (XML) format which can be exported and imported directly into the new
web-based CRF Reporter to produce the official submissions for the European Union (EU)
and the UNFCCC. This software update will include an automated key category analysis,
which will extract the necessary data automatically from the database, minimizing the risk
of errors when transferring the data from the CRF Reporter to the Excel calculation file.
5. Follow-up to previous reviews
19. Luxembourg includes in its annual inventory a development schedule for the
consideration and implementation of recommendations made in previous review reports
and recommendations made in other reviews (e.g. internal audits and reviews organized by
the EU for EU member States). The QC procedures include checking that these
recommendations have been considered and implemented. The results include
improvements in the solvent and other product use sector to the data for the top-down
approach (production statistics, import and export data) and for the bottom-up approach
(revised AD provided by Luxembourg’s hospital federation, now covering all hospitals).
For the agriculture sector, the improvements include technical corrections.
20. The ERT noted that the previous review report included a recommendation that
Luxembourg include more detailed information on its uncertainty analysis and key category
analysis in the NIR. This recommendation was not implemented and the ERT therefore
reiterates the recommendation made in the previous review report that Luxembourg include
more detailed information on its uncertainty analysis and key category analysis in the NIR.
21. Recommendations made in previous review reports that have not yet been
implemented, as well as issues the ERT identified during the 2014 annual review, are
discussed in the relevant sectoral chapters of the report and in table 9 below.
B. Energy
1. Sector overview
22. The energy sector is the main sector in the GHG inventory of Luxembourg. In 2012,
emissions from the energy sector amounted to 10,496.36 Gg CO2 eq, or 88.7 per cent of
total GHG emissions. Since 1990, emissions have increased by 0.6 per cent. The key
drivers for this rise in emissions are population and economic growth. The population
growth was mainly attributed to immigration, and it resulted in increasing demand for
energy across many economic sectors (housing, offices, services and infrastructure). The
strong growth in cross-border commuting and the location of Luxembourg at the heart of
the main Western European transit routes for both goods and passengers led to an increase
in transport fuel consumption (fuel prices in Luxembourg are usually lower than in
neighbouring countries). The fastest growing subsectors in terms of GHG emissions were
therefore energy industries and transportation, which grew by 2,812.5 per cent and 139.5
per cent, respectively, between 1990 and 2012. As a result, the shares of these categories in
the energy sector emissions rose (from 0.3 per cent to 9.9 per cent for energy industries and
4 FCCC/ARR/2013/LUX, paragraph 17.

FCCC/ARR/2014/LUX
11
from 25.1 per cent to 62.1 per cent for transportation). Increases in emissions were,
however, offset by the decrease in emissions from manufacturing and construction, which
decreased by 79.7 per cent compared with the 1990 level. Emissions from the categories
other energy and fugitive emissions from solid fuels are reported as “NO” (not occurring).
23. Within the sector, 62.1 per cent of the emissions were from transport, followed by
15.5 per cent from other sectors, 12.2 per cent from manufacturing industries and
construction and 9.9 per cent from energy industries. The remaining 0.4 per cent was
fugitive emissions from fuels.
24. Luxembourg has made recalculations between the 2013 and 2014 annual
submissions for this sector. The most significant recalculations were in manufacturing
industries and construction, and transport.
25. The recalculations were made in response to recommendations in the 2013 annual
review report and changes in AD due to corrections in the national energy balance (updated
to make it consistent with the data submitted to the International Energy Agency
(IEA)).The ERT welcomes Luxembourg’s efforts to improve the accuracy of the
estimations and encourages the Party to continue its effort to achieve consistency with data
available from IEA and Eurostat. Compared with the 2013 annual submission, the
recalculations increased emissions in the energy sector for 2011 by 14.18 Gg CO2 eq (0.1
per cent), and increased total national emissions by 0.1 per cent. The recalculations were
adequately explained in the NIR (section 10). However, the ERT reiterates the
recommendation made in the 2012 review report that Luxembourg expand the recalculation
sections within each category and subcategory to include values recalculated and the impact
of the change, or include a cross-reference to section 10 from the energy sector of the NIR
to improve transparency.
26. The ERT noted that Luxembourg has implemented most of the recommendations
made in previous review reports regarding the correction of detected errors. However, the
ERT noted that there are other recommendations pending: review the possible double
counting of emissions from leisure boats reported under navigation; and collect country-
specific data for estimating CH4 emissions from natural gas distribution. In response to a
question raised by the ERT during the review, the Party stated that it will investigate these
issues and include specific checks for them in its QA/QC procedures. The ERT reiterates
the pending recommendations.
2. Reference and sectoral approaches
27. Table 5 provides a review of the information reported under the reference approach
and the sectoral approach, as well as comparisons with other sources of international data.
Issues identified in table 5 are more fully elaborated in paragraphs 28–33 below.
Table 5
Review of reference and sectoral approaches
Issue Expert review team assessment Paragraph cross-references
Difference between the reference approach
and the sectoral approach
Energy consumption:
–0.31 PJ, –0.2%
CO2 emissions:
–110.94 Gg CO2, –1.1%
Are differences between the reference
approach and the sectoral approach adequately
explained in the NIR and the CRF tables?
Yes See paragraphs 28–30 below

FCCC/ARR/2014/LUX
12
Are differences with international statistics
adequately explained?
Yes
Is reporting of bunker fuels in accordance with the
UNFCCC reporting guidelines?
Yes See paragraphs 31–32 below
Is reporting of feedstocks and non-energy use of
fuels in accordance with the UNFCCC reporting
guidelines?
Yes See paragraph 33 below
Abbreviations: CRF = common reporting format, NIR = national inventory report, UNFCCC reporting
guidelines = “Guidelines for the preparation of national communications by Parties included in Annex I to the
Convention, Part I: UNFCCC reporting guidelines on annual inventories”.
Comparison of the reference approach with the sectoral approach and international statistics
28. The ERT noted that the overall difference in the estimates of CO2 emissions between
the sectoral and reference approaches is less than 2.0 per cent for the entire time series,
except for the year 2002 in which it was –2.2 per cent. However, the ERT noted that the
difference in gaseous fuels between the sectoral and reference approaches is 3.9 per cent for
2011. In response to a question raised by the ERT during the review, Luxembourg clarified
that there is a discrepancy between the plant-specific AD (used in the sectoral approach)
and the AD from the energy balance (used in the reference approach). The plant-specific
AD are higher than the data in the energy balance and the data reported to IEA. The Party
explained that it is planning to provide a further quantitative assessment of the differences
between the sectoral and reference approaches; further investigation is currently under way,
and the Party indicated that there might be a fundamental inconsistency (e.g. that the energy
balance uses a different net calorific value (NCV) for natural gas to that used in the
inventory). The ERT recommends that the Party report and explain the differences between
the reference and sectoral approaches, including the NCV used in the inventory and in the
energy balance.
29. The ERT noted that Luxembourg has reported AD for lubricants as fuels as “NO” in
the reference approach (CRF table 1.A(b)) but reports CO2 emissions in the same table, and
the ERT also noted that the NIR (section 3.2.3.1) mentions that there are emissions. In
response to a question raised by the ERT during the review, the Party answered that a
problem in the CRF Reporter software is responsible for this problem with reporting AD.
The ERT recommends that the Party continue its efforts to fix this problem.
30. The ERT noted that, in the NIR (table 3.10, page 165), the Party mentions as a
planned improvement that fuels used in marine activities will be subtracted from the
reference approach where they are still included. The ERT reiterates the recommendation
made in the previous review report that Luxembourg enter all fuels used in the country in
the reference approach estimates, and improve its QC procedures.
International bunker fuels
31. As in previous review reports, the Party reported that there is only one airport for
commercial aviation in Luxembourg and that all flights are international. The Party reports
in its NIR 2014 (section 3.2.2.1, page 166) that all kerosene sales (for commercial flights)
and 10 per cent of the aviation gasoline sales (for non-commercial flights) and their related
emissions are allocated to international bunkers. As a planned improvement (NIR, page
169) the Party states its intention to analyse landing and take-off (LTO) data per aircraft
type from Eurostat in order to optimize the split between “international bunkers – aviation”
and “1A3a – civil aviation”. The Party also stated that these data have only been available
since 2004, and hence using these data for inventory purposes might be problematic
because of time-series consistency issues. The ERT considers that the split between
FCCC/ARR/2014/LUX
13
national and international aviation emissions is not adequately explained and that the Party
may be underestimating the emissions from international aviation (and therefore
overestimating the emissions from civil aviation). The ERT reiterates the recommendation
made in previous review reports that Luxembourg transparently describe the methodology
used to split national and international (bunker) fuel consumption to ensure that civil
aviation emissions are accurately estimated. The ERT notes that the IPCC good practice
guidance (section 7.3.2.2) includes guidance on alternative recalculation methods that can
also be used to obtain a consistent time series.
32. For marine bunkers, the NIR (section 3.2.8.5.2.2, page 220) mentions that 20 per
cent of the gas oil used in shipping corresponds to international journeys reported under
“international bunkers – marine”. However, the ERT noted that international bunkers are
reported as “NO” in CRF table 1.A(b) for gas/diesel oil. The ERT recommends that
Luxembourg report fuel consumption in marine bunkers and associated emissions in the
CRF tables.
Feedstocks and non-energy use of fuels
33. As in previous review reports, Luxembourg reported the fraction of carbon stored
from lubricants as 50 per cent in CRF table 1.A(d) and indicated in the NIR (page 170) that
the emissions from motor oil are reported under road transportation. In response to a
question raised by the ERT during the review, Luxembourg stated that it will improve the
transparency of section 3.2.3.1 of the NIR by adding a table listing AD, carbon stored and
emissions, as well as listing in which CRF category they are reported. The ERT welcomes
this planned improvement and recommends that Luxembourg implement it.
3. Key categories
Road transportation: liquid fuels – N2O
34. As indicated in the previous review report, there are large differences in the N2O
implied emission factor (IEF) for gasoline for different years (ranging from 2.25 to 6.85
kg/TJ). The previous review report stated that Luxembourg planned to conduct a study on
road transportation emissions. In the 2014 annual submission, Luxembourg reported N2O
IEFs for gasoline in NIR table 3–55 (page 217). However, there was no explanation for the
fluctuations or reference to any study. In response to a question raised by the ERT during
the review, the Party explained that the results of the above-mentioned study have not yet
been integrated in the inventory, and that this integration is now foreseen for the 2015
submission, for which the entire road transportation and off-road mobile machinery
categories will be revised. The ERT reiterates the recommendation made in the previous
review report that Luxembourg incorporate relevant findings from the study on road
transportation emissions into its inventory.
4. Non-key categories
Stationary combustion: liquid fuels – N2O
35. The previous ERT noted that the N2O IEF for liquid fuels for manufacturing
industries and construction was the highest among reporting Parties for 2011. The current
ERT noted that in the 2014 annual submission, the N2O IEF continues to be the highest
among reporting Parties for each year in the period 2000–2012 (the N2O IEF for
Luxembourg ranges from 9.71 kg/TJ to 24.24 kg/TJ, while for other reporting Parties it
ranges from 12.84 kg/TJ to 19.74 kg/TJ). In addition, the N2O IEFs for the subcategories
FCCC/ARR/2014/LUX
14
under manufacturing industries and construction are the highest among reporting Parties
except for non-ferrous metals.5 There are also significant inter-annual changes in the N2O
IEF for all of those subcategories.6 As indicated in the previous review report, the ERT
concluded that these subcategories mainly include emissions from off-road vehicles. In
response to questions raised by the current ERT, Luxembourg explained that in its 2015
submission it plans to reallocate emissions from off-road mobile machinery in industry to
the category mobile under other (fuel combustion) and to revise these emissions for off-
road mobile machinery in order to better estimate CH4 and N2O emissions based on a
higher-tier methodology. The Party also explained that this reallocation will induce a
discrepancy with the IEA sectoral figures, which do not make the split between mobile and
stationary combustion. The ERT welcomes the Party’s planned effort to improve the
transparency (through the reallocation) and accuracy of these emissions and reiterates the
recommendation made in the previous review report that the Party report emissions from
off-road vehicles under the category mobile under other (fuel combustion) and clearly
explain any reallocation and recalculation in its NIR.
Oil and natural gas: natural gas – CH4
36. As indicated in the previous review report, there is a significant inter-annual change
in CH4 emissions from natural gas distribution between 2010 (1.50 Gg CH4) and 2011 (1.30
Gg CH4) (Luxembourg has reported 1.33 Gg CH4 for 2012). The 2011 value is 13.3 per
cent lower than the 2010 value. The 2014 NIR states that in Luxembourg, a very small
country, fluctuations in the time series are influenced by the maintenance stoppages of a
single large industrial plant, the closure of an iron and steel production plant or colder
winters (NIR, page 237). The ERT commends the Party for this explanation.
C. Industrial processes and solvent and other product use
1. Sector overview
37. In 2012, emissions from the industrial processes sector amounted to 610.74 Gg CO2
eq, or 5.2 per cent of total GHG emissions, and emissions from the solvent and other
product use sector amounted to 12.17 Gg CO2 eq, or 0.1 per cent of total GHG emissions.
Since the base year, emissions have decreased by 62.4 per cent in the industrial processes
sector, and decreased by 49.1 per cent in the solvent and other product use sector. The key
driver for the fall in emissions in the industrial processes sector is the change in the
production process of steel from blast furnaces to electric arc furnaces between 1994 and
1998 (metal production constituted 60.7 per cent of emissions from this sector in 1990 but
its contribution decreased to 16.4 per cent in 2012). Within the industrial processes sector,
71.2 per cent of the emissions were from mineral products, followed by 16.4 per cent from
metal production and 12.4 per cent from consumption of halocarbons and SF6. Emissions
from the categories chemical industry, other production and production of halocarbons and
SF6 were reported as “NA” (not applicable) or “NO”.
38. Luxembourg has made a recalculation between the 2013 and 2014 annual
submissions for the industrial processes sector. The only recalculation was in consumption
of halocarbons and SF6 (the recalculation increased emissions for this category for 2011 by
5 The ranges for the N2O IEFs for Luxembourg are: iron and steel, 3.09–24.11 kg/TJ; chemicals, 2.25–
20.17 kg/TJ; pulp, paper and print, 13.77–26.10 kg/TJ; food processing, beverages and tobacco, 9.17–
23.51 kg/TJ; and other (manufacturing industries and construction), 11.17–24.58 kg/TJ.
6 The inter-annual ranges for the N2O IEFs are: iron and steel, –55.0 to 74.4 per cent; chemicals, –31.8
to 98.3 per cent; pulp, paper and print, –9.2 to 24.5 per cent; food processing, beverages and tobacco,
–33.2 to 29.8 per cent; and other (non-specified), –16.5 to 31.9 per cent.
FCCC/ARR/2014/LUX
15
0.02 per cent). Compared with the 2013 annual submission, the recalculation increased
emissions in the industrial processes sector by 0.02 Gg CO2 eq (0.003 per cent), and
increased total national emissions by 0.0001 per cent. However, the Party has not explained
this recalculation in its NIR. The ERT recommends that the Party explain every
recalculation in its NIR. Luxembourg has also recalculated the emissions from the solvent
and other product use sector (the recalculation decreased the emissions for 2011 by 12.4 per
cent) following an update of AD and EFs. The ERT noted that this recalculation is
mentioned in pages 296–297 of the NIR but is not sufficiently explained, especially the
change of EFs. The ERT also noted that the NIR (page 442) states incorrectly that no
recalculations have been implemented in the solvent and other product use sector. The ERT
recommends that the Party address this error and improve the QC procedures on the
reporting of recalculations.
39. The ERT noted that Luxembourg has reported actual emissions for HFCs, PFCs and
SF6 from consumption of halocarbons and SF6, but that potential emissions are reported as
“NE” (not estimated), “NA” or “NO” in CRF tables 2(I) and 2(II). The ERT noted that this
issue had been identified in previous review reports. The ERT reiterates the encouragement
made in previous review reports that Luxembourg estimate and report potential emissions
from consumption of halocarbons and SF6.
40. The ERT noted a recommendation made in the 2012 review report that Luxembourg
provide relevant explanations for the constant emissions for the period 1990–1995 for foam
blowing (HFC emissions) and electrical equipment (SF6 emissions). The emissions for the
1990–1995 period are still constant in the 2014 annual submission. In response to questions
raised by the ERT during the review, Luxembourg explained that there are no AD for this
period and that the emissions have been estimated by extrapolation, assuming the same
emissions for the years 1990–1994 as for 1995. The Party also explained that after re-
analysis of the available data, an extrapolation of the emission trend was considered the
most realistic approach and relevant recalculation and background data and emissions will
be reported in the next submission. The ERT recommends that Luxembourg revise its
estimates of HFC emissions from foam blowing and SF6 emissions from electrical
equipment for 1990–1995 to ensure time-series consistency of these categories in
accordance with the IPCC good practice guidance. The ERT notes that section 7.3.2.2 of
the IPCC good practice guidance includes alternative recalculation methods.
2. Key categories
Cement production – CO2
41. The CO2 IEF for the year 2012 shows a 7.4 per cent decrease compared with that for
2011, while it is stable for the period 1990–2011. The NIR states that the reason for the
decrease in the IEF (from 0.53 t CO2/t in 2011 to 0.49 t CO2/t in 2012) is a change in the
raw material consumption, so that it can no longer be assumed that all the calcium oxide
(CaO) and magnesium oxide (MgO) in the clinker are from carbonate sources. The ERT
commends Luxembourg for the information given in the NIR.
Consumption of halocarbons and SF6 – HFCs, PFCs and SF6
42. The ERT noted that Luxembourg has reported HFC and PFC emissions from
refrigeration and air-conditioning equipment and SF6 emissions from noise reduction
windows (reported under other (consumption of halocarbons and SF6)) in CRF tables 2(I)
and 2(II), but the Party has not reported AD, IEF or emissions in CRF table 2(II).F. The
ERT reiterates the recommendation made in previous review reports that Luxembourg
report AD, IEF and emissions from refrigeration and air-conditioning equipment and noise
reduction windows in CRF table 2(II).F to improve the consistency of its reporting.

FCCC/ARR/2014/LUX
16
43. In response to recommendations made in the previous review report, Luxembourg
has included estimates of SF6 emissions from electrical equipment using a country-specific
method based on the installed capacity with the total nameplate capacity from the largest
operator (80 per cent coverage). The yearly emissions are assumed to vary between 0.1 per
cent and 0.9 per cent, depending on the type of switchgear. The EFs are those used in the
inventory of Germany. In response to a question raised by the ERT during the review, the
Party indicated that it used a tier 2a method from the IPCC good practice guidance for the
calculation of SF6 emissions from electrical equipment. However, information in the NIR is
not sufficient to evaluate and verify the estimations. The ERT reiterates the
recommendation in the previous report that Luxembourg provide a more detailed
explanation in the NIR of the methodologies and AD used to estimate SF6 emissions from
electrical equipment in order to increase the transparency of its reporting.
44. The ERT notes that Luxembourg reports estimates for actual PFC emissions from
refrigeration and air-conditioning equipment in CRF table 2(I), but the Party continues to
use the notation key “NO” to report potential emissions. The ERT reiterates the
recommendation made in the previous review report that the Party replace the notation key
“NO” with either a value or the notation key “NE”.
45. The ERT noted that Luxembourg continues to estimate HFC and PFC emissions
from transport refrigeration, foam blowing and aerosol/metered dose inhalers using per
capita emissions from Belgium and Germany (NIR, page 265). In response to questions
raised by the ERT during the review, Luxembourg explained that it will be able to estimate
the emissions from transport refrigeration using country-specific data in the 2015
submission. Regarding foam blowing and aerosol/metered dose inhalers, the Party
explained that Luxembourg relies entirely on imports and, owing to the lack of import data
in the national statistics, major importers were (and are) contacted in order to obtain
information on sales data and product specifications. The ERT appreciates Luxembourg’s
efforts and encourages the Party to estimate these emissions using country-specific AD.
3. Non–key categories
Solvent and other product use – N2O
46. N2O emissions from anaesthesia have been estimated for the period 1990–2002 by
combining per capita N2O emissions from Germany with the population in Luxembourg
because there are no country-specific data available. For the period 2003–2012, emissions
have been estimated using country-specific data collected from hospitals in Luxembourg. In
response to a question raised by the ERT during review, the Party explained that it used
N2O emissions per capita from Germany because of the similar national circumstances in
terms of the ratio of commuters and the rate of hospitalization abroad as well as a
comparable health system between the two countries. The ERT noted that the N2O
emissions per capita in Germany in 2002 and in Luxembourg in 2003 are similar (39.42 g
N2O per capita and 38.11 g N2O per capita, respectively), but this does not constitute a
confirmation that the time series is consistent. The ERT reiterates the recommendation
made in previous review reports that the Party demonstrate the consistency of the time
series or collect country-specific data for the entire time series.
D. Agriculture
1. Sector overview
47. In 2012, emissions from the agriculture sector amounted to 668.68 Gg CO2 eq, or
5.6 per cent of total GHG emissions. Since 1990, emissions have decreased by 10.2 per
cent. The key drivers for the fall in emissions are the decreasing livestock numbers, in

FCCC/ARR/2014/LUX
17
particular mature dairy cattle, and the decrease in the use of synthetic fertilizers applied to
soils. Within the sector, 45.3 per cent of the emissions were from agricultural soils,
followed by 35.8 from enteric fermentation and 18.9 per cent from manure management.
Luxembourg reported emissions from rice cultivation, prescribed burning of savannahs,
field burning of agricultural residues and other (agriculture) as “NA” or “NO”.
48. Luxembourg has made two recalculations between the 2013 and 2014 annual
submissions for this sector. The two recalculations were in manure management (emissions
increased by 5.4 per cent and 0.9 per cent for 2011 and 1990, respectively) and agricultural
soils (emissions increased by 4.7 per cent and 0.1 per cent for 2011 and 1990, respectively).
The recalculations were made in manure management to reflect revised manure allocations
in animal waste management systems (AWMS) from 2005 to 2011 and revised nitrogen
excretion (Nex) rates for horses in 2010 and 2011. Recalculations were also made in
agricultural soils to reflect updates in provisional fertilizer applied to soils and crop data
(e.g. peas and other tubers and roots) as well as following the revisions in manure
management. In addition, N2O emissions from manure management and from agricultural
soils and CH4 emissions from manure management (from other AWMS) were resubmitted
in response to the list of potential problems and further questions raised by the ERT during
the review (see paras. 49, 51, 52 and 54 below). Compared with the 2013 annual
submission, the recalculations increased emissions in the agriculture sector for 2011 by
20.50 Gg CO2 eq (3.1 per cent) and increased total national emissions by 0.2 per cent. The
recalculations were well described in sections 6.3.5 and 6.5.4 and tables 6-37 and 6-36 of
the NIR and in CRF table 8(b).
2. Key categories
Manure management – CH4 and N2O
49. Luxembourg allocated manure from several livestock categories to the subcategory
“other (animal waste management systems)” in 2012 (mature dairy cattle (6.99 per cent),
mature non-dairy cattle (1.65 per cent), young cattle (3.62 per cent), swine (5.00 per cent)
and poultry (25.00 per cent)) as indicated in CRF table 4.B(a). Other AWMS in
Luxembourg are anaerobic digesters at farms or municipal installations. In its submission
of 15 April 2014, Luxembourg used a methane conversion factor (MCF) of 0.0 per cent
(zero) for manure allocated to this manure management system, stating in the NIR (page
323) that “it is a conservative estimate reducing/limiting our emissions for the base year”.
The ERT considers that a zero MCF is also potentially underestimating CH4 emissions from
the subcategory “other (animal waste management systems)” for all other years in the time
series 1990–2012. In addition, the ERT notes that the same issue was raised in the previous
review report.7 In response to a question raised by the ERT during the review, Luxembourg
replied that the MCF in the 2014 submission is the same as in the previous submission
(zero). This issue was included in the list of potential problems and further questions raised
by the ERT. In its response to this list, Luxembourg submitted revised estimates for CH4
emissions from manure management for the entire time series 1990–2012 on 17 November
2014, using an MCF of 13.0 per cent for manure managed in anaerobic digesters (i.e. for
other AWMS) based on information provided by Mr. P. Delfosse and Mr. Hoffmann in
2014.8 The ERT considers that the revised estimates resolved the potential underestimation.
Compared with the estimates submitted in April 2014, the revised estimates submitted on
17 November 2014 increased CH4 emissions from manure management by 4.9 per cent for
7 FCCC/ARR/2013/LUX, paragraph 48.
8 Mr. Philippe Delfosse (Project Leader in Bioenergy, Centre de Recherche Public – Gabriel
Lippmann) and Mr. Hoffmann, personal communication, November 2014.

FCCC/ARR/2014/LUX
18
2012, or 4.40 Gg CO2 eq. The ERT recommends that the Party describe these changes in its
NIR.
50. Luxembourg estimates CH4 emissions from manure management from swine using a
tier 1 method and IPCC default EF (using equation 4.17 of the IPCC good practice
guidance and default parameters from the Revised 1996 IPCC Guidelines for National
Greenhouse Gas Inventories (hereinafter referred to as the Revised 1996 IPCC Guidelines)
for gross energy intake (GE), digestible energy (DE), ash content of manure (ASH), volatile
solids (VS) and methane producing potential (Bo)). The ERT notes that swine is a
significant species for the Party, accounting for 41.2 per cent of CH4 emissions from
manure management in 2012. The ERT also notes the recommendations made in previous
review reports that Luxembourg develop and apply higher-tier methods for the estimation
of CH4 emissions from manure management for swine.9 In response to a question raised by
the ERT during the review, Luxembourg stated that it was not possible to implement a tier
2 method for this submission but that it will be implemented in the 2015 submission. The
ERT reiterates the recommendations made in previous review reports that Luxembourg
implement a higher-tier method for manure management from swine.
51. Luxembourg estimates N2O emissions from manure management for all livestock
categories using a tier 1 method. In the estimations submitted in April 2014, Luxembourg
used three different Nex rates for mature dairy cattle. The Nex rates are estimated based on
the milk yield. The three different Nex rates are: 85.00 kg N/head/year for a milk yield
lower than 5,500 kg/head/year; 93.50 kg N/head/year for a milk yield between 5,500
kg/head/year and 6,500 kg/head/year; and 102.00 kg N/head/year for a milk yield higher
than 6,500 kg/head/year. The ERT notes that the milk production for 2012 reported in CRF
table 4.A is 7,260 kg/head/year (reported as 19.88 kg/day), 11.7 per cent higher than 6,500
kg/head/year.
52. The ERT considers that the Nex rate used by Luxembourg for mature dairy cattle
with a milk yield higher than 6,500 kg/head/year (102.00 kg N/head/year) is too low, given
the current milk yield of 7,260 kg/head/year. The ERT notes that the same issue was raised
in the previous review report.10 In response to a question raised by the ERT during the
review, Luxembourg explained that the Nex rate used in the 2014 submission is the same as
in the previous submission. The ERT considers that by using the Nex value of 102.00 kg
N/head/year, Luxembourg is potentially underestimating the N2O emissions from manure
management and agricultural soils (for subcategories direct soil emissions, pasture, range
and paddock manure, and indirect emissions; see para. 54 below). This issue was included
in the list of potential problems and further questions raised by the ERT. In its response to
this list, Luxembourg submitted revised estimates on 17 November 2014 for the entire time
series using Nex rates derived from an equation from a study by Steinwidder and
Guggenberger (2003) based on milk yield.11 For example, for the milk yield in 2012, the
corresponding Nex rate used in the revised estimates is 107.89 kg N/head/year. The ERT
considers that the revised estimates resolved the issue. The revised estimates increased N2O
emissions from manure management by 0.6 per cent in 2012 or 0.19 Gg CO2 eq. The ERT
recommends that the Party describe these changes in its NIR.
Agricultural soils – N2O
53. Luxembourg estimates N2O emissions from agricultural soils using tier 1 methods
from the IPCC good practice guidance. This category has been identified as a key category.
9 FCCC/ARR/2013/LUX, paragraph 50.
10 FCCC/ARR/2013/LUX, paragraph 49.
11 Nex (kg N/head/year) = 0.009 × kg milk yield (kg/year) + 42.5.
FCCC/ARR/2014/LUX
19
The ERT noted that the decision tree in the IPCC good practice guidance (page 4.55)
indicates that a Party can estimate emissions using default volatilization fractions, FracGASF
and FracGASM, even for a key category (where FracGASF is the fraction of synthetic fertilizer
nitrogen (N) applied to soils that volatilizes as ammonia (NH3) and nitrogen oxides (NOX)
and FracGASM is the fraction of livestock N excretion that volatilizes as NH3 and NOX). The
IPCC good practice guidance (page 4.61) also encourages Parties to use appropriately
documented loss rates for synthetic fertilizer and animal manures applied to soils. The ERT
encourages Luxembourg to develop country-specific parameters volatilization fractions
from fertilizers and animal manures (FracGASF and FracGASM) for this key category.
54. The ERT noted that N2O emissions from agricultural soils were included in the list
of potential problems and further questions raised by the ERT and that Luxembourg
submitted revised estimates on 17 November 2014 that solved the potential underestimation
(see paras. 51 and 52 above). Luxembourg, in its revised estimates, also revised: the
amount of synthetic fertilizer applied to soils for the years 2008–2012 to reflect final data
instead of previously submitted provisional data; AD for peas, carrots and leaks for 2012;
and the amount of sewage sludge applied to soils for 2012. The overall effect of these
revisions on total direct and indirect N2O from agricultural soils was to reduce emissions of
N2O in 2012 by 1.8 per cent or 5.70 Gg CO2 eq. However, the total cumulative emissions of
N2O from 2008 to 2012 increased by 7.64 Gg CO2 eq (or 0.5 per cent) as a result of this
resubmission. The ERT recommends that the Party transparently describe the methodology
used to estimate these emissions in its NIR.
E. Land use, land-use change and forestry
1. Sector overview
55. In 2012, net removals from the LULUCF sector amounted to 438.03 Gg CO2 eq.
Since 1990, the LULUCF sector has changed from a net source (emissions of 331.61 Gg
CO2 eq) to a net sink. The key driver is the recovery of forest land remaining forest land
following major disturbances in 1990. Within the sector, 514.80 Gg CO2 eq of net removals
were from forest land, followed by 46.14 Gg CO2 eq from grassland. Net emissions were
reported from settlements (78.80 Gg CO2 eq), cropland (37.12 Gg CO2 eq), wetlands (6.62
Gg CO2 eq) and other land (0.37 Gg CO2 eq).
56. Luxembourg has made recalculations between the 2013 and 2014 annual
submissions for all categories in this sector. The most significant recalculations were in the
following categories:
(a) Forest land: net removals for 2011 increased by 9.4 per cent and net
emissions for 1990 decreased by 35.8 per cent;
(b) Cropland: net emissions for 2011 and 1990 increased by 42.4 per cent and
36.1 per cent, respectively;
(c) Grassland: for 2011, net emissions (31.19 Gg CO2 eq) became net removals
(49.00 Gg CO2 eq) and net emissions for 1990 increased by 9.6 per cent;
(d) Settlements: net emissions for 2011 decreased by 23.4 per cent and for 1990
increased by 7.9 per cent.
57. The recalculations were made following changes in AD, namely land-use change
areas, arising from the availability of new data for the period 2008–2012. Compared with
the 2013 annual submission, the recalculations increased net removals in the LULUCF
sector for 2011 by 140.77 Gg CO2 eq (47.8 per cent). The recalculations were adequately
explained. The ERT commends Luxembourg for the clarity of the description of the
recalculations.
FCCC/ARR/2014/LUX
20
58. References for EFs and AD were not provided in a systematic manner (e.g. the
meaning of “IFL1” in the NIR, page 367; the soil carbon content of various land uses; the
country-specific value for carbon stock of forest land biomass before conversion; the
annual volume increment of species other than spruce, Douglas fir, beech and oak). In
response to questions raised by the ERT during the review, Luxembourg was able to clarify
most of the references and, where necessary, provide copies of these references to the ERT.
In some cases, Luxembourg identified errors and explained that the EFs were based on
expert judgement rather than the originally quoted reference (e.g. annual volume increment
for spruce and Douglas fir in the NIR, page 370). The ERT reiterates the recommendation
made in the previous review report that Luxembourg improve the transparency of its
reporting by providing references for the LULUCF and KP-LULUCF sectors in a
systematic and comprehensive adequate and exhaustive manner in its NIR.
59. Luxembourg reported that checking whether a complete set of references is provided
for EFs and AD is part of its QC procedures. However, in view of the multiple missing
references (see para. 58 above), the ERT concluded that the relevant QC procedures had not
been thoroughly conducted. In addition, inconsistencies were detected between the NIR and
the CRF tables (see para. 68 below). The ERT reiterates the recommendation made in the
previous review report that Luxembourg improve its QC procedures, in particular regarding
references for EFs and AD, and regarding consistency between the NIR and the CRF tables.
60. The results of the uncertainty analysis for the LULUCF sector were only reported
for forest land (NIR, table 1-10). This partial reporting is not in line with the IPCC Good
Practice Guidance for Land Use, Land-Use Change and Forestry (hereinafter referred to as
the IPCC good practice guidance for LULUCF) (see para. 16 above). In response to a
question raised by the ERT during the review on the source of information for the reported
values, Luxembourg provided a study conducted in 2011 which calculated uncertainties of
20 per cent for the annual volume increment and between 12.5 per cent and 25 per cent for
harvested volume. However, Luxembourg was not able to clarify how this assessment
resulted in the reported values of 57 per cent for AD (area of land converted to forest land)
and 10 per cent for EF (carbon stock change per hectare). Luxembourg explained that the
publication of its second national forest inventory (NFI) (published in March 2014) would
enable it to revise these estimates for the 2015 annual submission. The ERT recommends
that Luxembourg report its uncertainty analysis for LULUCF in accordance with the IPCC
good practice guidance for LULUCF and transparently describe the method used to
estimate the uncertainty.
2. Key categories
Forest land remaining forest land – CO2
61. Luxembourg estimates carbon stock changes in living biomass using the “default
method” as defined by the IPCC good practice guidance for LULUCF (page 3.24). Harvest
statistics strongly influence this type of estimate, but the ERT notes that these are not
reproduced in the NIR. In response to a question raised by the ERT during the review,
Luxembourg provided harvest statistics for the period 1990–2012 sourced from national
statistics (STATEC). The ERT noted that despite a 45 per cent increase in harvest between
2009 and 2010 (STATEC), the carbon stock in living biomass from forest land remaining
forest land increases at relatively stable rate: annual values ranged within 10 per cent of the
2006–2012 average of 107.47 Gg carbon (C) per year. The ERT would have expected the
large 2010 harvest increase to be reflected in a large drop in carbon stock change for living
biomass. In addition, the ERT noted discrepancies of up to 87 per cent (for 2010) between
the harvest data used in the inventory (STATEC) and the data provided by Luxembourg to
the Food and Agriculture Organization of the United Nations database (FAOSTAT). The
ERT recommends that Luxembourg:
FCCC/ARR/2014/LUX
21
(a) Reproduce the entire time series of harvest statistics;
(b) Provide an explanation for the inconsistency between harvesting trends and
carbon stock changes in living biomass;
(c) Investigate the discrepancy between STATEC and FAOSTAT data on
harvest.
62. Forest land remaining forest land is the category with the largest contribution to
removals in the LULUCF sector. During the previous review, Luxembourg informed the
ERT that the results of the second NFI would be available in 2013 and that there were plans
to recalculate the emission/removal estimates based on those results. In response to the
request for a progress update raised by the ERT during the current review, Luxembourg
informed the ERT that some delays had occurred, but that the results of the second NFI had
been officially validated in March 2014. Luxembourg provided these results to the ERT and
confirmed that they would be used in the 2015 submission. The ERT therefore reiterates the
recommendation made in the previous review report that Luxembourg use the results from
the second NFI to recalculate the emission/removal estimates from forest land remaining
forest land and all categories involving forest land.
63. As noted in previous review reports, the area of forest land in 2011 reported in CRF
table 5.A is 95.8 kha compared with 87 kha reported to FAOSTAT. In response to a
question raised by the ERT during the review, Luxembourg indicated that this difference
needs to be reviewed with the ministry responsible for communicating data to FAOSTAT.
The ERT noted that this response from Luxembourg is the same as responses to similar
questions raised during previous reviews. The ERT recognizes that there may be reasons
for the different areas of forest reported to the different organizations (e.g. because of
different definitions), but reiterates the encouragement that the Party transparently discuss
in the NIR why such differences may arise.
Land converted to forest land – CO2
64. Luxembourg does not explain the method used to estimate the increment of species
other than beech, oak, spruce and Douglas fir. In response to a question raised by the ERT
during the review, Luxembourg was able to provide the references for these increment
values and to clarify how harvest was accounted for. In addition, Luxembourg explained
that the publication of its second NFI would enable it to revise these estimates in its 2015
annual submission, using more recent and relevant values for both increment and harvests.
The ERT welcomes these planned improvements and recommends that Luxembourg
transparently describe them.
65. Luxembourg does not explicitly report its method for calculating carbon stock
changes for conversions to forest land from wetlands, settlements and other land. In
response to a question raised by the ERT during the review, Luxembourg clarified that the
method was the same as that for conversions from grassland, except that the carbon stocks
before land-use change were those reported in the relevant section of the NIR (wetland,
settlements and other land). The ERT welcomes this clarification and recommends that
Luxembourg include this information in its NIR.
Land converted to grassland – CO2
66. The area converted annually from forest land to grassland strongly decreased from
212 ha/year over the period 2000–2007 to 14 ha/year over the period 2008–2012. The
methodology used to estimate these areas is in line with the IPCC good practice guidance
for LULUCF. In response to a question raised by the ERT during the review on the drivers
for this important decrease, Luxembourg explained that the accuracy of the 2000–2007
values was being assessed in view of the new AD for 2008–2012, recalculated based on
FCCC/ARR/2014/LUX
22
remote sensing imagery for 2012. The ERT commends Luxembourg for conducting this
assessment. The ERT recommends that in doing this assessment, Luxembourg pay
particular attention to areas that may have undergone a back-and-forth classification from
and to forest land, because these may have remained forest land all along. The ERT
recommends that Luxembourg report on the results of this investigation.
67. Luxembourg reports in its NIR that “the areas with more than one land use change
within 20 years are taken into account as LUC [land-use change] areas, whereas, according
to the IPCC good practice guidance for LULUCF, they should stay in their main category”
(page 363). Accordingly, Luxembourg corrects the raw data from its land identification
method and only reports a fraction (269 ha/year in 2012) of cropland converted to grassland
in the category land converted to grassland. The rest of the area identified as cropland
converted to grassland is reported in the grassland remaining grassland category. In
response to a question raised by the ERT during the review, Luxembourg was not able to
clarify which part of the IPCC good practice guidance for LULUCF allowed for reporting
cropland converted to grassland in the grassland remaining grassland category. The ERT
recommends that Luxembourg report all areas of cropland converted to grassland in the
category land converted to grassland.
3. Non-key categories
Cropland remaining cropland – CO2
68. The ERT noted that there were inconsistencies in the reporting of emissions and
removals between the NIR and CRF table 5.B. For example, for 2012, Luxembourg
reported emissions of 3.92 Gg CO2 eq for cropland remaining cropland in NIR table 7-13
(page 375) but emissions of 5.28 Gg CO2 eq in CRF table 5.B in its submission on 15 April
2014. In response to a question raised by the ERT during the review, Luxembourg
acknowledged the issue and identified the NIR values as the correct ones. However, the
ERT notes that the revised estimates submitted by the Party on 17 November 2014 were
still inconsistent between the NIR and the CRF table values for the entire time series 1990–
2012 (e.g. for 2012, 3.24 Gg CO2 eq is reported in CRF table 5). The initial inconsistency
had been corrected but another, different, inconsistency had arisen after the revision of
estimates for soil carbon changes. The ERT recommends that the Party correct its NIR to
ensure consistency between the NIR and the CRF tables.
69. Luxembourg has reported carbon stock changes in living biomass from perennial
crops to annual crops using the tier 1 method (i.e. using a default EF of 63 Mg C/ha/year
from table 3.3.2 in the IPCC good practice guidance for LULUCF). This estimate is in line
with the IPCC good practice guidance for LULUCF. However, in response to a question
raised by the ERT during the review, Luxembourg informed the ERT that vineyards
constitute the vast majority of perennial crops in Luxembourg, accounting for 1,294 ha of
1,438 ha. The ERT notes that the default EF in the IPCC good practice guidance for
LULUCF is representative of tree crops such as orchards, and considering that the living
biomass of vineyards is probably smaller than that of orchards, the ERT encourages
Luxembourg to develop a country-specific EF, for example by considering the EF used by
neighbouring countries with vineyards covering large areas of land.
Land converted to wetlands – CO2 and CH4
70. Luxembourg has reported soil carbon stock losses of 3.77 Mg C/ha/year from
cropland converted to wetlands and soil carbon stock losses of 5.08 Mg C/ha/year from
grassland converted to wetlands in 2012 (CRF table 5.D). The Party has assumed that these
losses are emitted as CO2. The IPCC good practice guidance for LULUCF does not provide
a method to estimate these emissions. However, appendix 3a.3 of the IPCC good practice

FCCC/ARR/2014/LUX
23
guidance for LULUCF provides a method whereby part of the soil carbon stock losses is
emitted as CH4 as a result of anaerobic respiration. In response to a question raised by the
ERT during the review, Luxembourg acknowledged that appendix 3a.3 may be considered
but pointed out that this category was a minor source of emissions and therefore not a
priority for improvement. The ERT agrees with Luxembourg that improving this estimate
may not be a priority. Nevertheless, the ERT encourages Luxembourg to list this issue in its
improvement plan.
Direct N2O emissions from nitrogen fertilization of forest land and other – N2O
71. The previous review report recommended that Luxembourg provide verification that
forest fertilization does not occur. In its NIR, Luxembourg explains that forest fertilization
is not practised in Luxembourg. The ERT noted that the entire amount of fertilizer sold in
Luxembourg is reported as applied on cropland (NIR, page 340) and the associated N2O
emissions reported in the agriculture sector, and considers that this is satisfactory evidence
that forest fertilization is not occurring. The ERT recommends that Luxembourg explicitly
explain this in its NIR.
Biomass burning – CH4 and N2O
72. The previous review report recommended that Luxembourg provide verification that
the practice of biomass burning is not occurring on cropland and grassland. In its NIR,
Luxembourg states that biomass burning is not practised in Luxembourg. The ERT is
satisfied with the information reported by the Party. The ERT recommends that
Luxembourg explicitly provide this explanation in its NIR.
F. Waste
1. Sector overview
73. In 2012, emissions from the waste sector amounted to 50.24 Gg CO2 eq, or 0.4 per
cent of total GHG emissions. Since 1990, emissions have decreased by 39.1 per cent. The
key drivers for the fall in emissions are reduced emissions from solid waste disposal sites
(SWDS) and from the treatment of wastewater. The declining trend in emissions from
SWDS can be attributed to increased recycling, mechanical–biological (MB) pre-treatment
of the collected waste before disposal and increased landfill gas recovery. Increased and
enhanced treatment of wastewater has decreased emissions from this category. Within the
sector, 51.7 per cent of the emissions were from solid waste disposal on land, followed by
27.6 per cent from other (waste) and 20.6 per cent from wastewater handling. Emissions
from waste incineration were reported as “IE” (included elsewhere).
74. Luxembourg has made recalculations between the 2013 and 2014 annual
submissions for this sector. The most significant recalculation was in the category other
(waste), where GHG emissions from compost production for 2011 decreased by 16.8 per
cent (emissions are reported as “NO” for 1990). This recalculation was made to replace
provisional AD with final AD. Compared with the 2013 annual submission, the
recalculations decreased emissions in the waste sector for 2011 by 2.55 Gg CO2 eq (4.4 per
cent) and decreased total national emissions by 0.02 per cent. The recalculations were
adequately explained.
FCCC/ARR/2014/LUX
24
2. Key categories
Solid waste disposal on land – CH4
75. Luxembourg estimates the CH4 emissions from solid waste disposal on land based
on the tier 2 methodology in the 2006 IPCC Guidelines (volume 5, section 3.2.1). Part of
the solid waste is pre-treated mechanically and aerobically before disposal. The MB pre-
treatment reduces the volume of and degradable organic matter in the waste. Luxembourg
assumes that the methane correction factor value for pre-treated waste is reduced from 1 to
0.1 based on the 2006 IPCC Guidelines, which state that MB-treated waste will produce up
to 95 per cent less CH4 than untreated waste when disposed in SWDS (2006 IPCC
Guidelines, volume 5, section 4.1, page 4.4). The ERT notes that the 2006 IPCC Guidelines
also state that practical reductions have been smaller and depend on the type and duration
of MB treatments. The ERT recommends that Luxembourg assess whether the assumption
of the 90 per cent reduction is valid for its national circumstances and provide the results of
this assessment. The ERT also notes that the 2006 IPCC Guidelines give a method to
estimate the fugitive CH4 and N2O emissions from the MB treatment; Luxembourg has not
included these emissions in its 2013 inventory submission.
3. Non–key categories
Wastewater handling – N2O
76. Luxembourg estimates N2O emissions from wastewater treatment using a country-
specific methodology based on the methodology in the 2006 IPCC Guidelines (see para. 77
below). The N2O emissions are estimated separately for uncollected wastewater and for
wastewater treatment plants with and without significant denitrification. The N2O emissions
from human sewage as well as those from commercial and industrial wastewater are
included in these emissions.
77. The N2O emissions from uncollected wastewater are estimated using the default
method for N2O emissions from wastewater effluent in the 2006 IPCC Guidelines (volume
5, section 6.3.1, equation 6.8, page 6.25). The country-specific methodology to estimate
N2O emissions from wastewater treatment plants is a combination of the method given in
the 2006 IPCC Guidelines (volume 4, section 6.3.1, box 6.1, page 6.26) and a country-
specific method. The IPCC methodology applies to N2O emissions from advanced
centralized wastewater treatment plants with controlled denitrification and nitrification. The
IPCC default factor for these plants is very low (3.2 g N2O/person/year). Luxembourg
applies this method for plants with biological wastewater treatment with significant
denitrification rates (approximately 75 per cent) of the incoming N load. The country-
specific method is based on the denitrification rate at other types of wastewater treatment
plants, for which an average denitrification rate of 35 per cent is assumed. For these plants,
1 per cent of the N denitrified is assumed to be emitted as N2O. The ERT considers that the
use of a country-specific EF for plants without significant denitrification, which is higher
than the EF used for plants with significant denitrification (for which the 2006 IPCC default
EF, much lower, is used), is inconsistent with the fact that increased denitrification usually
leads to increased N2O emissions. The ERT recommends that Luxembourg review the N2O
EF for plants with significant denitrification and use a consistent methodology to estimate
these emissions, for example by also using the country-specific method for wastewater
treatment plants with significant denitrification.
78. Luxembourg has applied a method from the 2006 IPCC Guidelines for N2O
emissions from wastewater effluent (volume 5, section 6.3.1.1) only to the wastewater
which is not collected. For collected wastewater, N2O emissions from treatment at the
plants have been estimated, but not N2O emissions from the effluent discharged from the

FCCC/ARR/2014/LUX
25
plants. The ERT recommends that Luxembourg review the estimations from all discharges
of wastewater, including those from wastewater plants, to confirm that all N2O emissions
are estimated. The N removal at these plants should be considered in the estimates.
79. The ERT also noted that Luxembourg includes N2O emissions from sludge
spreading under the agriculture sector, but that it has not subtracted the corresponding
amount of N from the wastewater emission calculations. The ERT recommends that
Luxembourg take into account the N removed in the sludge spread on agricultural fields
when estimating the N2O emission from wastewater in order to avoid double counting. The
ERT also recommends that Luxembourg revise its method to estimate the N2O emissions
from wastewater handling, taking into account all the above-mentioned inconsistencies and
omissions (see paras. 77 and 78 above).
Other (waste) – CH4 and N2O
80. Luxembourg reports CH4 and N2O emissions from compost production under this
category using the tier 1 (default) methodology and EFs from the 2006 IPCC Guidelines
(volume 5, section 4.1). The ERT commends the Party for estimating these emissions for
which the Revised 1996 IPCC Guidelines and the IPCC good practice guidance do not have
a methodology. Luxembourg also reports that MB treatment takes place before disposal of
solid waste (see para. 75 above) but has not clarified further the MB treatment in the NIR.
As both composting and anaerobic digestion may be part of MB pre-treatment of waste, the
ERT encourages Luxembourg to provide further information on the MB treatment in the
NIR, and complement its reporting by covering all emissions from biological treatment, as
appropriate.
G. Supplementary information required under Article 7, paragraph 1, of
the Kyoto Protocol
1. Information on activities under Article 3, paragraphs 3 and 4, of the Kyoto Protocol
Overview
81. Table 6 provides an overview of the information reported and parameters selected
by Luxembourg under Article 3, paragraphs 3 and 4, of the Kyoto Protocol.
Table 6
Supplementary information reported under Article 3, paragraphs 3 and 4, of the Kyoto Protocol
Issue
Expert review team assessment,
if applicable Findings and recommendations
Assessment of Luxembourg’s reporting in
accordance with the requirements in paragraphs
5–9 of the annex to decision 15/CMP.1
Sufficient
Activities elected under Article 3, paragraph 4, of
the Kyoto Protocol
Activities elected: none
Period of accounting Commitment period
Luxembourg’s ability to identify areas of land
and areas of land-use change in accordance with
paragraph 20 of the annex to decision 16/CMP.1
Sufficient
FCCC/ARR/2014/LUX
26
82. Section G.1 includes the ERT’s assessment of the 2014 annual submission against
the Article 8 review guidelines and decisions 15/CMP.1 and 16/CMP.1. In accordance with
decision 6/CMP.9, Parties will begin reporting of KP-LULUCF activities in the
submissions due by 15 April 2015 using revised CRF tables, as contained in the annex to
decision 6/CMP.9. Owing to this change in the CRF tables for KP-LULUCF activities and
the change from the first commitment period to the second commitment period, paragraphs
83–91 below contain the ERT’s assessment of Luxembourg’s adherence to the current
guidelines for reporting and do not provide specific recommendations for reporting these
activities for the 2015 annual submission.
83. Luxembourg has reported in its NIR (page 402) that tree species are identified from
satellite images. In response to a question raised by the ERT during the review,
Luxembourg clarified that only a distinction between coniferous and broadleaf species
could be obtained from satellite images, thanks to the lower reflection of coniferous trees in
visible and infrared wavelengths. Further disaggregation into species is obtained from NFI
data averages for the 0–20 years age class. The ERT commends Luxembourg for its
rigorous use of reporting method 2 for lands subject to activities under Article 3, paragraph
3, of the Kyoto Protocol and welcomes the clarification on species mix estimation. The
ERT recommends that Luxembourg improve the transparency of its reporting by including
this explanation in its NIR.
84. Luxembourg reports in its NIR (page 53) that the categories land converted to forest
land and land converted to settlements are identified as key categories. According to the
IPCC good practice guidance for LULUCF, this means that afforestation and reforestation,
and deforestation activities under Article 3, paragraph 3, of the Kyoto Protocol, are also key
categories. In response to a question raised by the ERT during the review, Luxembourg
acknowledged this conclusion. The ERT recommends that Luxembourg classify
afforestation and reforestation, and deforestation as key categories if the aforementioned
Convention categories are identified as key categories.
85. For both afforestation and reforestation, and deforestation activities, Luxembourg
reports carbon stock changes in below-ground biomass and litter as “IE” (they are reported
under above-ground biomass and soil carbon, respectively). In response to a question raised
by the ERT during the review, Luxembourg explained that separate reporting of these pools
only became possible in March 2014 with the publication of the second NFI. Luxembourg
further clarified that it would report these pools separately in its 2015 annual submission.
The ERT reiterates the recommendation made in the previous review report that
Luxembourg separately report carbon stock changes in below-ground biomass and litter for
the KP-LULUCF categories.
Activities under Article 3, paragraph 3, of the Kyoto Protocol
Afforestation and reforestation – CO2
86. The ERT notes that Luxembourg reported the carbon stock changes in the below-
ground living biomass pool as included elsewhere (“IE”) in the CRF tables and reported
them together with the above-ground pool (see para. 85 above). The Party explains in its
NIR that the carbon stock changes in below-ground biomass are included in the above-
ground biomass. However, the ERT noted that decision 16/CMP.1, annex, paragraph 21,
specifies that carbon stock changes in five pools must be accounted for (or transparent and
verifiable information that the pool is not a source must be provided), namely: above-
ground biomass, below-ground biomass, dead wood, litter and soil organic carbon. The
ERT also noted that there is information already available to report the carbon stock
changes for below-ground biomass separately (NIR, page 371). In response to a question
raised by the ERT during the review, the Party explained that this issue had not been
assigned a high priority within the improvement plan. While acknowledging that reporting
FCCC/ARR/2014/LUX
27
the pools separately is not strictly speaking mandatory, the ERT reiterates the
recommendation made in the previous review report that Luxembourg improve the
transparency of its reporting under the Kyoto Protocol and separately report the carbon
stock changes for the living biomass pools (above-ground and below-ground) using the
information already available within its national inventory system.
87. The ERT noted that in order to ensure consistency with the revisions made for
deforestation in response to the list of potential problems and further questions raised by the
ERT during the review (see paras. 88–91 below), Luxembourg revised the estimates for
afforestation and reforestation.
Deforestation – CO2
88. In order to estimate changes in mineral soil organic carbon stock (SOC) in
deforestation due to the conversion of forest to grassland, Luxembourg uses a country-
specific IEF of –0.35 t C/ha/year (NIR, page 387). This IEF derives from applying equation
3.4.8 of the IPCC good practice guidance for LULUCF ((SOCforest land – SOCgrassland)/20),
with:
(a) SOCforest land = SOCref × Fforest land × FMG × FI = 85 t C/ha (NIR, page 373),
where FMG is the stock change factor for the management regime, FI is the stock change
factor for input of organic matter and SOCref is the reference soil organic carbon stock;
(b) SOCgrassland = SOCref × Fgrassland × FMG × FI = 92 t C/ha (NIR, page 373);
(c) SOCref = 92 t C/ha, Fgrassland = FMG = FI = 1.
89. To obtain Fforest land, Luxembourg uses the ratio between the average values for forest
land (85 t C/ha) and grassland (92 t C/ha) from its national soil inventory, and
consequently, Fforest land = SOCforest land/SOCref = 85/92 = 0.92. The use of average values
from a soil inventory is not in line with the IPCC good practice guidance for LULUCF.
Indeed, when using country-specific values for stock change factor for land use or land-use
change type (FLU) (here Fforest land), the IPCC good practice guidance for LULUCF (page
3.130) states that “estimation of country-specific stock change factors for land-use
conversion to grassland will typically be based on paired-plot comparisons representing
converted and unconverted lands, where all factors other than land-use history are as
similar as possible”. The ERT noted that discarding the country-specific value of Fforest land
and reverting to the default value of 1 (IPCC good practice guidance for LULUCF, page
3.128) would result in a higher IEF than 0 t C/ha/year (zero). Therefore, the ERT considers
that CO2 emissions from deforestation are potentially underestimated and included this
issue in the list of potential problems and further questions raised by the ERT during the
review.
90. In its response to the list of potential problems and further questions raised by the
ERT, Luxembourg submitted revised estimates on 17 November 2014 by:
(a) Calculating a specific IEF for each of the twelve land-use transitions and for
each of the 10 soil types existing in Luxembourg (12 × 10 = 120 IEFs) based on figures
from a recently published study by Stevens et al. (2014);
(b) Calculating a weighted average IEF for each land-use transition based on the
area of each soil type;
(c) Applying these IEFs to the area undergoing the relevant land-use transition.
91. This approach implicitly assumes that soil type is an acceptable proxy for “all
factors other than land-use history”, which the ERT considers reasonable given the relative
homogeneity of climatic conditions in Luxembourg. It also implicitly assumes that
afforestation and reforestation, and deforestation activities are homogeneously distributed

FCCC/ARR/2014/LUX
28
throughout Luxembourg, which was stated by Luxembourg during the review. For these
reasons, the ERT considers that the revised estimates submitted on 17 November 2014 are
in line with the IPCC good practice guidance for LULUCF and that the issue has been
resolved. The ERT commends Luxembourg for this revision and recommends that the Party
explain the revisions in its NIR.
2. Information on Kyoto Protocol units
92. Luxembourg has reported information on its accounting of Kyoto Protocol units in
the required SEF tables, as required by decisions 15/CMP.1 and 14/CMP.1. The ERT took
note of the findings and recommendations included in the SIAR on the SEF tables and the
SEF comparison report.12 The SIAR was forwarded to the ERT prior to the review,
pursuant to decision 16/CP.10. The ERT reiterated the main findings and recommendations
contained in the SIAR.
93. Information on the accounting of Kyoto Protocol units has been prepared and
reported in accordance with decision 15/CMP.1, annex, chapter I.E, and reported in
accordance with decision 14/CMP.1 using the SEF tables. This information is consistent
with that contained in the national registry and with the records of the international
transaction log (ITL) and the clean development mechanism registry and meets the
requirements referred to in decision 22/CMP.1, annex, paragraph 88(a–j). The transactions
of Kyoto Protocol units initiated by the national registry are in accordance with the
requirements of the annex to decision 5/CMP.1 and the annex to decision 13/CMP.1. No
discrepancy has been identified by the ITL and no non-replacement has occurred. The
national registry has adequate procedures in place to minimize discrepancies.
Accounting of activities under Article 3, paragraph 3, of the Kyoto Protocol and any elected
activities under Article 3, paragraph 4, of the Kyoto Protocol
94. Luxembourg has reported information on its accounting of KP-LULUCF in the
accounting table, as included in the annex to decision 6/CMP.3. Information on the
accounting of KP-LULUCF has been prepared and reported in accordance with decisions
16/CMP.1 and 6/CMP.3.
95. Table 7 shows the accounting quantities for KP-LULUCF as reported by
Luxembourg and the final values after the review.
Table 7
Accounting quantities for activities under Article 3, paragraph 3, and, if any, activities under
Article 3, paragraph 4, of the Kyoto Protocol, in t CO2 eq
2014 annual submissiona
As reported Revised estimates Final accounting quantityb
Afforestation and reforestation
Non-harvested land –482 221 –606 405 –606 405
Harvested land NO NO
Deforestation 129 577 233 126 233 126
12 The SEF comparison report is prepared by the international transaction log (ITL) administrator and
provides information on the outcome of the comparison of data contained in the Party’s SEF tables
with corresponding records contained in the ITL.
FCCC/ARR/2014/LUX
29
2014 annual submissiona
As reported Revised estimates Final accounting quantityb
Forest management NA NA
Article 3.3 offsetc NA NA
Forest management capd NA NA
Cropland management NA NA
Grazing land management NA NA
Revegetation NA NA
Abbreviations: CRF = common reporting format, KP-LULUCF = land use, land-use change and forestry
emissions and removals from activities under Article 3, paragraphs 3 and 4, of the Kyoto Protocol, NA = not
applicable, NO = not occurring. a The values included under the 2014 annual submission are the cumulative accounting values for 2008, 2009,
2010, 2011 and 2012, as reported in the accounting table of the KP-LULUCF CRF tables for the inventory year 2012. b The “final accounting quantity” is the quantity of Kyoto Protocol units that the Party shall issue or cancel under
each activity under Article 3, paragraph 3, and paragraph 4, if relevant, based on the final accounting quantity in the
2014 annual submission. c “Article 3.3 offset”: for the first commitment period, a Party included in Annex I to the Convention that incurs
a net source of emissions under the provisions of Article 3, paragraph 3, of the Kyoto Protocol may account for
anthropogenic greenhouse gas emissions by sources and removals by sinks in areas under forest management under
Article 3, paragraph 4, up to a level that is equal to the net source of emissions under the provisions of Article 3,
paragraph 3, but not greater than 9.0 megatonnes of carbon times five, if the total anthropogenic greenhouse gas
emissions by sources and removals by sinks in the managed forest since 1990 is equal to, or larger than, the net
source of emissions incurred under Article 3, paragraph 3. d In accordance with decision 16/CMP.1, annex, paragraph 11, for the first commitment period only, additions to
and subtractions from the assigned amount of a Party resulting from forest management under Article 3, paragraph 4,
of the Kyoto Protocol after the application of decision 16/CMP.1, annex, paragraph 10, and resulting from forest
management project activities undertaken under Article 6, shall not exceed the value inscribed in the appendix of the
annex to decision 16/CMP.1, times five.
96. Based on the information provided in table 7 for the activity afforestation and
reforestation, Luxembourg shall: for non-harvested land, issue 606,405 removal units
(RMUs) in its national registry; for harvested land, neither issue nor cancel any units in its
national registry.
97. Based on the information provided in table 7 for the activity deforestation,
Luxembourg shall cancel 233,126 assigned amount units, emission reduction units,
certified emission reduction units and/or RMUs in its national registry.
Calculation of the commitment period reserve
98. Luxembourg has reported its commitment period reserve in its 2014 annual
submission. Luxembourg reported that its commitment period reserve has not changed
since the initial report review (42,662,696 t CO2 eq) as it is based on the assigned amount
and not the most recently reviewed inventory (NIR, page 474). However, the ERT noted
that while the result of the calculation of the commitment period reserve is correct, the
calculation process is incorrect: Luxembourg has compared 90 per cent of the value of the
assigned amount with five times the GHG emissions in 2011, but it should have compared
it with five times the GHG emissions for 2012. The ERT recommends that the Party use the
correct calculation process for the commitment period reserve and provide details in its
NIR.
FCCC/ARR/2014/LUX
30
3. Changes to the national system
99. Luxembourg reported that there are no changes in its national system since the
previous annual submission. The ERT concluded that Luxembourg’s national system
continues to be in accordance with the requirements of national systems outlined in
decision 19/CMP.1.
4. Changes to the national registry
100. Luxembourg reported that there are changes in its national registry since the
previous annual submission. Luxembourg described in its NIR the change to the database
structure and the capacity of the national registry, the change regarding conformance to
technical standards, the change to the list of publicly available information and the change
regarding test results. The ERT concluded that, taking into account the confirmed changes
in the national registry, Luxembourg’s national registry continues to perform the functions
set out in the annex to decision 13/CMP.1 and the annex to decision 5/CMP.1 and
continues to adhere to the technical standards for data exchange between registry systems in
accordance with relevant decisions of the Conference of the Parties serving as the meeting
of the Parties to the Kyoto Protocol (CMP).
5. Minimization of adverse impacts in accordance with Article 3, paragraph 14, of the
Kyoto Protocol
101. Consistent with paragraph 23 of the annex to decision 15/CMP.1, Luxembourg
provided information relating to how it is striving, under Article 3, paragraph 14, of the
Kyoto Protocol, to implement its commitments in such a way as to minimize adverse social,
environmental and economic impacts on developing country Parties, particularly those
identified in Article 4, paragraphs 8 and 9, of the Convention.
102. Luxembourg notes that by implementing the features of the Kyoto Protocol,
Luxembourg is working to minimize not only adverse effects of climate change but also
any adverse effects due to the reduction of GHGs. Further, Luxembourg is strongly
promoting long-term sustainable development, and notes in the NIR that it has reformed its
energy markets to a large extent to reduce market imperfections.
103. Luxembourg reported that there are no changes in its reporting of the minimization
of adverse impacts in accordance with Article 3, paragraph 14, since the previous annual
submission. The ERT concluded that the information provided continues to be complete
and transparent.
III. Conclusions and recommendations
A. Conclusions
104. Table 8 summarizes the ERT’s conclusions on the 2014 annual submission of
Luxembourg, in accordance with the Article 8 review guidelines.
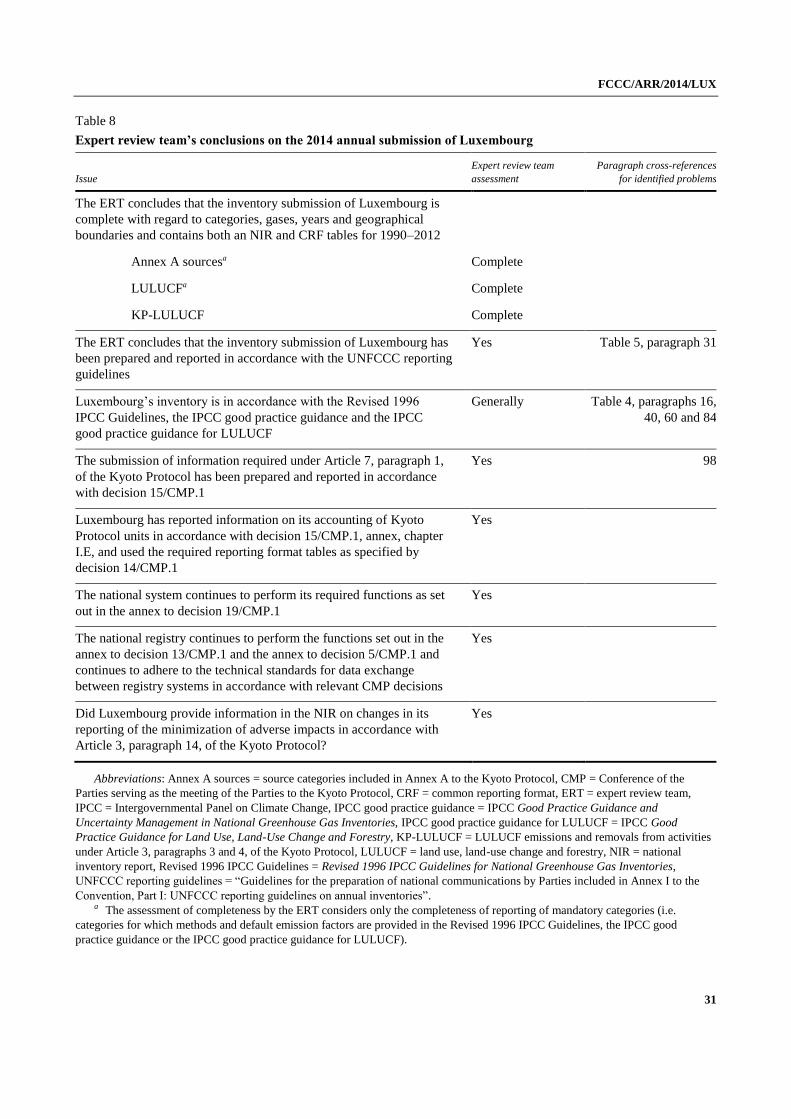
FCCC/ARR/2014/LUX
31
Table 8
Expert review team’s conclusions on the 2014 annual submission of Luxembourg
Issue
Expert review team
assessment
Paragraph cross-references
for identified problems
The ERT concludes that the inventory submission of Luxembourg is
complete with regard to categories, gases, years and geographical
boundaries and contains both an NIR and CRF tables for 1990–2012
Annex A sourcesa Complete
LULUCFa Complete
KP-LULUCF Complete
The ERT concludes that the inventory submission of Luxembourg has
been prepared and reported in accordance with the UNFCCC reporting
guidelines
Yes Table 5, paragraph 31
Luxembourg’s inventory is in accordance with the Revised 1996
IPCC Guidelines, the IPCC good practice guidance and the IPCC
good practice guidance for LULUCF
Generally Table 4, paragraphs 16,
40, 60 and 84
The submission of information required under Article 7, paragraph 1,
of the Kyoto Protocol has been prepared and reported in accordance
with decision 15/CMP.1
Yes 98
Luxembourg has reported information on its accounting of Kyoto
Protocol units in accordance with decision 15/CMP.1, annex, chapter
I.E, and used the required reporting format tables as specified by
decision 14/CMP.1
Yes
The national system continues to perform its required functions as set
out in the annex to decision 19/CMP.1
Yes
The national registry continues to perform the functions set out in the
annex to decision 13/CMP.1 and the annex to decision 5/CMP.1 and
continues to adhere to the technical standards for data exchange
between registry systems in accordance with relevant CMP decisions
Yes
Did Luxembourg provide information in the NIR on changes in its
reporting of the minimization of adverse impacts in accordance with
Article 3, paragraph 14, of the Kyoto Protocol?
Yes
Abbreviations: Annex A sources = source categories included in Annex A to the Kyoto Protocol, CMP = Conference of the
Parties serving as the meeting of the Parties to the Kyoto Protocol, CRF = common reporting format, ERT = expert review team,
IPCC = Intergovernmental Panel on Climate Change, IPCC good practice guidance = IPCC Good Practice Guidance and
Uncertainty Management in National Greenhouse Gas Inventories, IPCC good practice guidance for LULUCF = IPCC Good
Practice Guidance for Land Use, Land-Use Change and Forestry, KP-LULUCF = LULUCF emissions and removals from activities
under Article 3, paragraphs 3 and 4, of the Kyoto Protocol, LULUCF = land use, land-use change and forestry, NIR = national
inventory report, Revised 1996 IPCC Guidelines = Revised 1996 IPCC Guidelines for National Greenhouse Gas Inventories,
UNFCCC reporting guidelines = “Guidelines for the preparation of national communications by Parties included in Annex I to the
Convention, Part I: UNFCCC reporting guidelines on annual inventories”. a The assessment of completeness by the ERT considers only the completeness of reporting of mandatory categories (i.e.
categories for which methods and default emission factors are provided in the Revised 1996 IPCC Guidelines, the IPCC good
practice guidance or the IPCC good practice guidance for LULUCF).
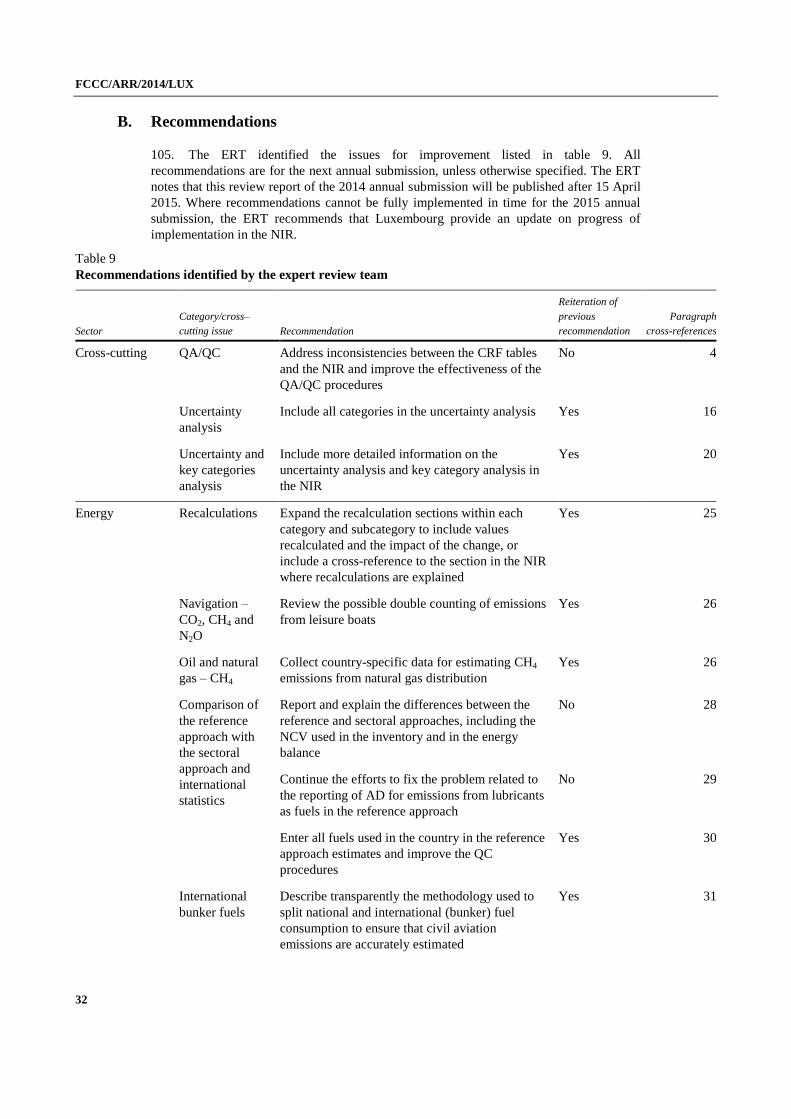
FCCC/ARR/2014/LUX
32
B. Recommendations
105. The ERT identified the issues for improvement listed in table 9. All
recommendations are for the next annual submission, unless otherwise specified. The ERT
notes that this review report of the 2014 annual submission will be published after 15 April
2015. Where recommendations cannot be fully implemented in time for the 2015 annual
submission, the ERT recommends that Luxembourg provide an update on progress of
implementation in the NIR.
Table 9
Recommendations identified by the expert review team
Sector
Category/cross–
cutting issue Recommendation
Reiteration of
previous
recommendation
Paragraph
cross-references
Cross-cutting QA/QC Address inconsistencies between the CRF tables
and the NIR and improve the effectiveness of the
QA/QC procedures
No 4
Uncertainty
analysis
Include all categories in the uncertainty analysis Yes 16
Uncertainty and
key categories
analysis
Include more detailed information on the
uncertainty analysis and key category analysis in
the NIR
Yes 20
Energy Recalculations Expand the recalculation sections within each
category and subcategory to include values
recalculated and the impact of the change, or
include a cross-reference to the section in the NIR
where recalculations are explained
Yes 25
Navigation –
CO2, CH4 and
N2O
Review the possible double counting of emissions
from leisure boats
Yes 26
Oil and natural
gas – CH4
Collect country-specific data for estimating CH4
emissions from natural gas distribution
Yes 26
Comparison of
the reference
approach with
the sectoral
approach and
international
statistics
Report and explain the differences between the
reference and sectoral approaches, including the
NCV used in the inventory and in the energy
balance
No 28
Continue the efforts to fix the problem related to
the reporting of AD for emissions from lubricants
as fuels in the reference approach
No 29
Enter all fuels used in the country in the reference
approach estimates and improve the QC
procedures
Yes 30
International
bunker fuels
Describe transparently the methodology used to
split national and international (bunker) fuel
consumption to ensure that civil aviation
emissions are accurately estimated
Yes 31
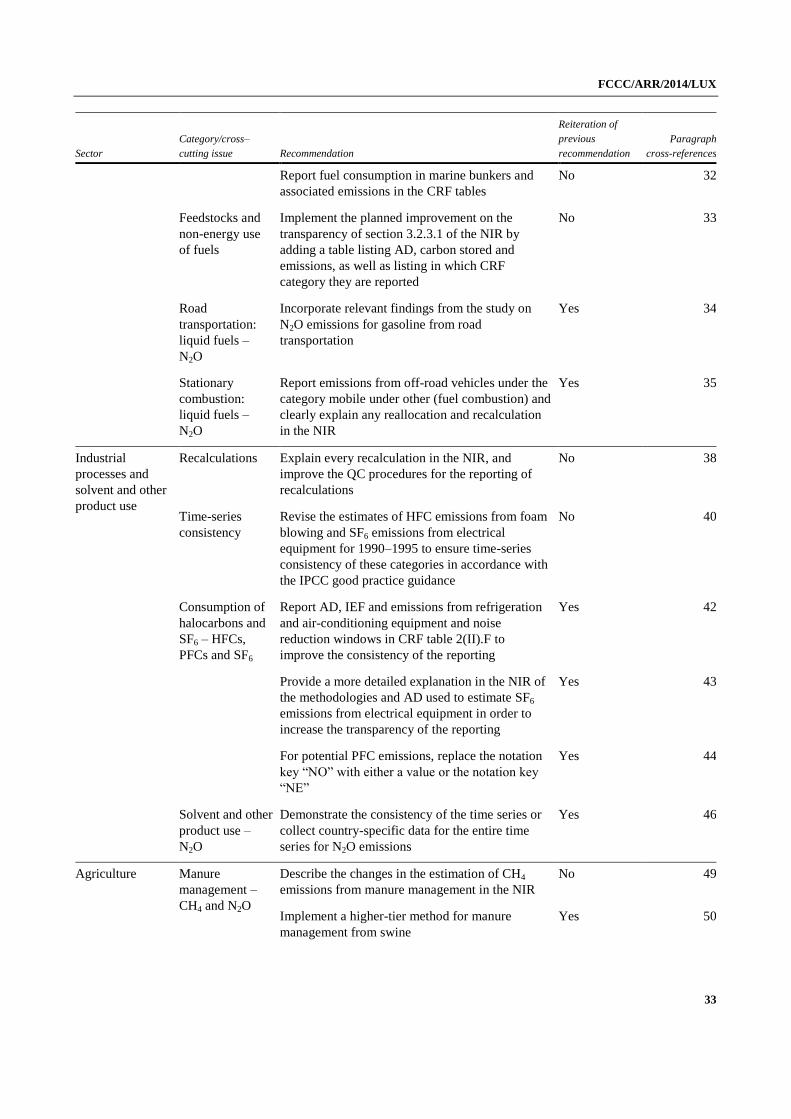
FCCC/ARR/2014/LUX
33
Sector
Category/cross–
cutting issue Recommendation
Reiteration of
previous
recommendation
Paragraph
cross-references
Report fuel consumption in marine bunkers and
associated emissions in the CRF tables
No 32
Feedstocks and
non-energy use
of fuels
Implement the planned improvement on the
transparency of section 3.2.3.1 of the NIR by
adding a table listing AD, carbon stored and
emissions, as well as listing in which CRF
category they are reported
No 33
Road
transportation:
liquid fuels –
N2O
Incorporate relevant findings from the study on
N2O emissions for gasoline from road
transportation
Yes 34
Stationary
combustion:
liquid fuels –
N2O
Report emissions from off-road vehicles under the
category mobile under other (fuel combustion) and
clearly explain any reallocation and recalculation
in the NIR
Yes 35
Industrial
processes and
solvent and other
product use
Recalculations Explain every recalculation in the NIR, and
improve the QC procedures for the reporting of
recalculations
No 38
Time-series
consistency
Revise the estimates of HFC emissions from foam
blowing and SF6 emissions from electrical
equipment for 1990–1995 to ensure time-series
consistency of these categories in accordance with
the IPCC good practice guidance
No 40
Consumption of
halocarbons and
SF6 – HFCs,
PFCs and SF6
Report AD, IEF and emissions from refrigeration
and air-conditioning equipment and noise
reduction windows in CRF table 2(II).F to
improve the consistency of the reporting
Yes 42
Provide a more detailed explanation in the NIR of
the methodologies and AD used to estimate SF6
emissions from electrical equipment in order to
increase the transparency of the reporting
Yes 43
For potential PFC emissions, replace the notation
key “NO” with either a value or the notation key
“NE”
Yes 44
Solvent and other
product use –
N2O
Demonstrate the consistency of the time series or
collect country-specific data for the entire time
series for N2O emissions
Yes 46
Agriculture Manure
management –
CH4 and N2O
Describe the changes in the estimation of CH4
emissions from manure management in the NIR
No 49
Implement a higher-tier method for manure
management from swine
Yes 50

FCCC/ARR/2014/LUX
34
Sector
Category/cross–
cutting issue Recommendation
Reiteration of
previous
recommendation
Paragraph
cross-references
Describe the changes in the estimation of Nex
used for mature dairy cattle in the NIR
No 52
Describe transparently the methodology to
estimate N2O emissions from agricultural soils in
the NIR
No 54
LULUCF Transparency Improve the transparency of the reporting by
providing references for the LULUCF and KP-
LULUCF sectors in a systematic and
comprehensive manner in the NIR
Yes 58
QA/QC Improve the QC procedures, in particular
regarding references for EFs and AD, and
regarding consistency between the NIR and the
CRF tables
Yes 59
Uncertainty
analysis
Report the uncertainty analysis for LULUCF in
accordance with the IPCC good practice guidance
for LULUCF and transparently describe the
method used to estimate the uncertainty
No 60
Forest land
remaining forest
land – CO2
Reproduce the entire time series of harvest
statistics, provide an explanation for the
inconsistency between harvesting trends and
carbon stock changes in living biomass and
investigate the discrepancy between STATEC
and FAOSTAT data on harvest
No 61
Use the results from the second NFI to recalculate
the emission/removal estimates from forest land
remaining forest land and all categories involving
forest land
Yes 62
Land converted to
forest land – CO2
Describe transparently the planned improvements
to estimate the increment and harvest for species
other than beech, oak, spruce and Douglas fir
No 64
Include clarification on the method for
calculating carbon stock changes for conversions
to forest land from wetlands, settlements and
other land in the NIR
No 65
Land converted to
grassland – CO2
Report on the results of the investigation into the
accuracy of the 2000–2007 values of the areas in
view of the new AD for 2008–2012, paying
particular attention to areas that may have
undergone a back-and-forth classification from
and to forest land
No 66
Report all areas of cropland converted to
grassland in the category land converted to
grassland
No 67
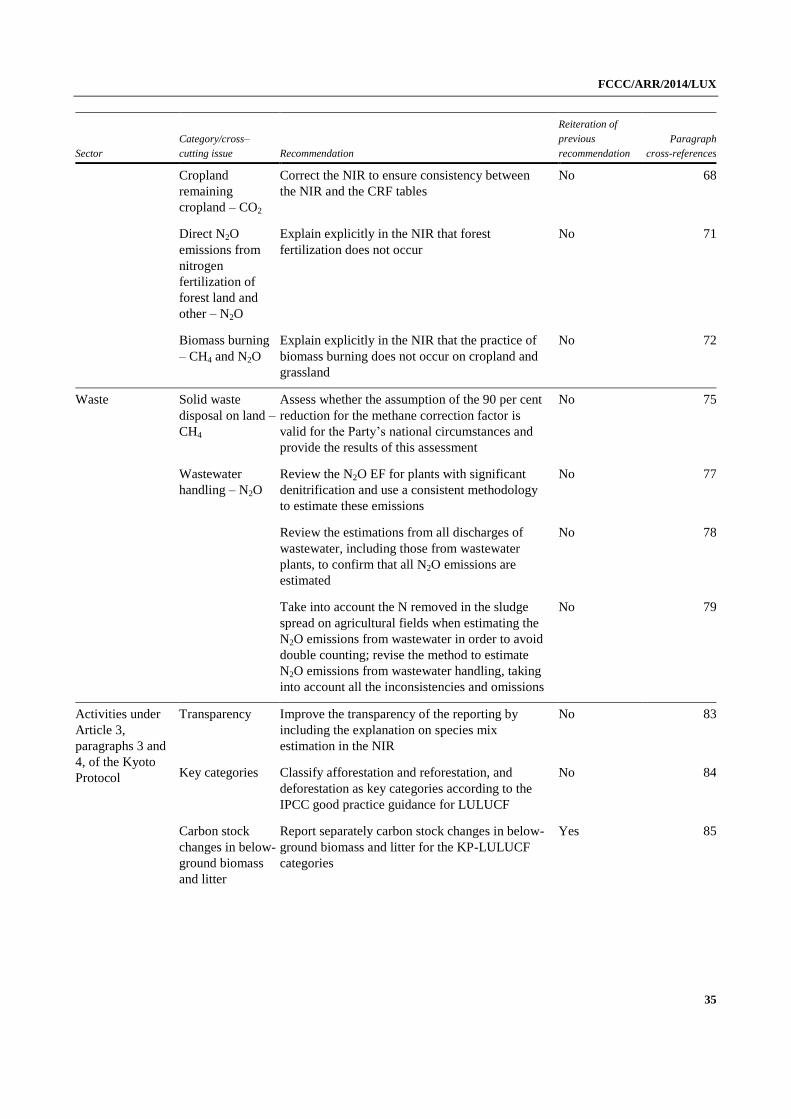
FCCC/ARR/2014/LUX
35
Sector
Category/cross–
cutting issue Recommendation
Reiteration of
previous
recommendation
Paragraph
cross-references
Cropland
remaining
cropland – CO2
Correct the NIR to ensure consistency between
the NIR and the CRF tables
No 68
Direct N2O
emissions from
nitrogen
fertilization of
forest land and
other – N2O
Explain explicitly in the NIR that forest
fertilization does not occur
No 71
Biomass burning
– CH4 and N2O
Explain explicitly in the NIR that the practice of
biomass burning does not occur on cropland and
grassland
No 72
Waste Solid waste
disposal on land –
CH4
Assess whether the assumption of the 90 per cent
reduction for the methane correction factor is
valid for the Party’s national circumstances and
provide the results of this assessment
No 75
Wastewater
handling – N2O
Review the N2O EF for plants with significant
denitrification and use a consistent methodology
to estimate these emissions
No 77
Review the estimations from all discharges of
wastewater, including those from wastewater
plants, to confirm that all N2O emissions are
estimated
No 78
Take into account the N removed in the sludge
spread on agricultural fields when estimating the
N2O emissions from wastewater in order to avoid
double counting; revise the method to estimate
N2O emissions from wastewater handling, taking
into account all the inconsistencies and omissions
No 79
Activities under
Article 3,
paragraphs 3 and
4, of the Kyoto
Protocol
Transparency Improve the transparency of the reporting by
including the explanation on species mix
estimation in the NIR
No 83
Key categories Classify afforestation and reforestation, and
deforestation as key categories according to the
IPCC good practice guidance for LULUCF
No 84
Carbon stock
changes in below-
ground biomass
and litter
Report separately carbon stock changes in below-
ground biomass and litter for the KP-LULUCF
categories
Yes 85
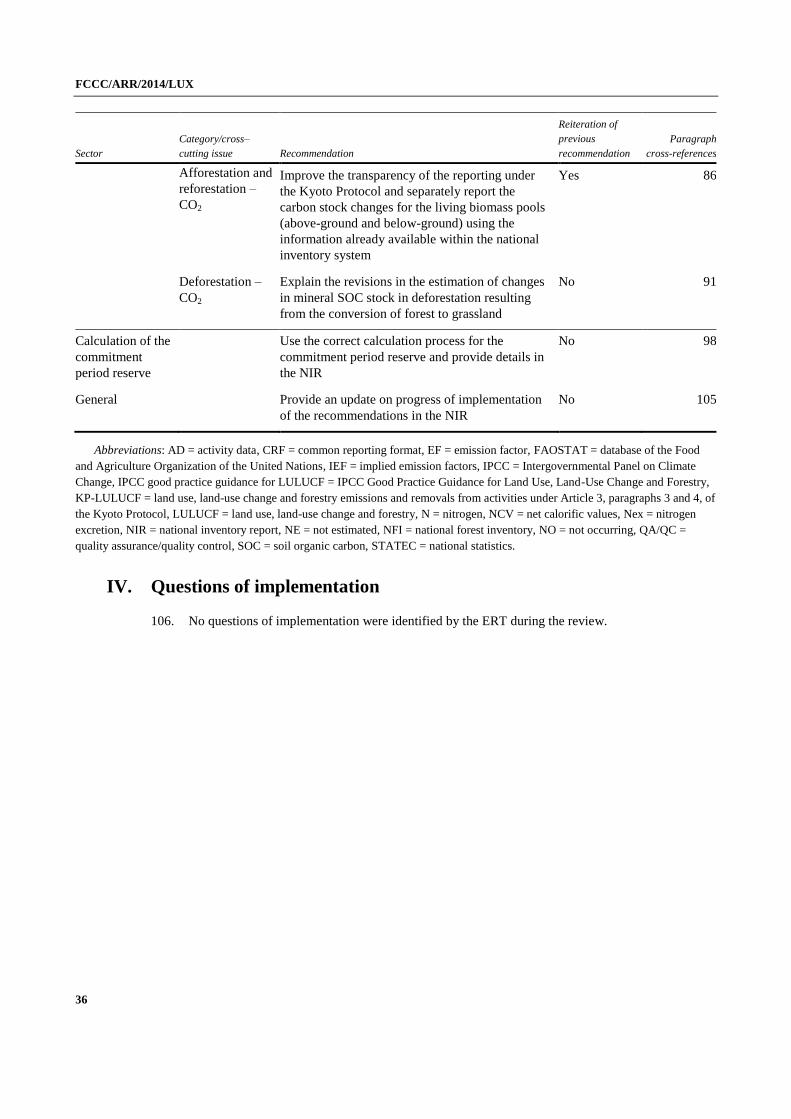
FCCC/ARR/2014/LUX
36
Sector
Category/cross–
cutting issue Recommendation
Reiteration of
previous
recommendation
Paragraph
cross-references
Afforestation and
reforestation –
CO2
Improve the transparency of the reporting under
the Kyoto Protocol and separately report the
carbon stock changes for the living biomass pools
(above-ground and below-ground) using the
information already available within the national
inventory system
Yes 86
Deforestation –
CO2
Explain the revisions in the estimation of changes
in mineral SOC stock in deforestation resulting
from the conversion of forest to grassland
No 91
Calculation of the
commitment
period reserve
Use the correct calculation process for the
commitment period reserve and provide details in
the NIR
No 98
General Provide an update on progress of implementation
of the recommendations in the NIR
No 105
Abbreviations: AD = activity data, CRF = common reporting format, EF = emission factor, FAOSTAT = database of the Food
and Agriculture Organization of the United Nations, IEF = implied emission factors, IPCC = Intergovernmental Panel on Climate
Change, IPCC good practice guidance for LULUCF = IPCC Good Practice Guidance for Land Use, Land-Use Change and Forestry,
KP-LULUCF = land use, land-use change and forestry emissions and removals from activities under Article 3, paragraphs 3 and 4, of
the Kyoto Protocol, LULUCF = land use, land-use change and forestry, N = nitrogen, NCV = net calorific values, Nex = nitrogen
excretion, NIR = national inventory report, NE = not estimated, NFI = national forest inventory, NO = not occurring, QA/QC =
quality assurance/quality control, SOC = soil organic carbon, STATEC = national statistics.
IV. Questions of implementation
106. No questions of implementation were identified by the ERT during the review.

FCCC/ARR/2014/LUX
37
Annex I
Information to be included in the compilation and accounting database
Table 10
Information to be included in the compilation and accounting database in t CO2 eq for 2012, including the
commitment period reserve
As reported Revised estimates Adjustmenta Final
b
Commitment period reserve 42 662 696 42 662 696
Annex A emissions for 2012
CO2 10 870 108 10 870 108
CH4 422 671 427 121 427 121
N2O 470 892 465 389 465 389
HFCs 67 262 67 262
PFCs 164 164
SF6 8 143 8 143
Total Annex A sourcesc 11 839 241 11 838 188 11 838 188
Activities under Article 3, paragraph 3, for 2012
3.3 Afforestation and reforestation on non-harvested
land for 2012
–122 868 –143 963 –143 963
3.3 Afforestation and reforestation on harvested land
for 2012
NO NO
3.3 Deforestation for 2012 24 699 43 060 43 060
Activities under Article 3, paragraph 4, for 2012d
3.4 Forest management for 2012
3.4 Cropland management for 2012
3.4 Cropland management for the base year
3.4 Grazing land management for 2012
3.4 Grazing land management for the base year
3.4 Revegetation for 2012
3.4 Revegetation for the base year
Abbreviations: Annex A sources = source categories included in Annex A to the Kyoto Protocol, NO = not occurring. a “Adjustment” is relevant only for Parties for which the expert review team has calculated one or more adjustments. b “Final” includes revised estimates, if any, and/or adjustments, if any. c The values for “Total Annex A sources” in the columns “As reported”, “Revised estimates” and “Final” may not equal the
sum of the values for the gases in those columns owing to rounding. d Activities under Article 3, paragraph 4, are relevant only for Parties that elected one or more such activities.

FCCC/ARR/2014/LUX
38
Table 11
Information to be included in the compilation and accounting database in t CO2 eq for 2011
As reported Revised estimates Adjustmenta Final
b
Annex A emissions for 2011
CO2 11 138 341 11 138 341
CH4 429 761 434 149 434 149
N2O 481 879 480 680 480 680
HFCs 67 013 67 013
PFCs 180 180
SF6 7 754 7 754
Total Annex A sourcesc 12 124 928 12 128 117 12 128 117
Activities under Article 3, paragraph 3, for 2011
3.3 Afforestation and reforestation on non–harvested
land for 2011
–108 223 –131 415 –131 415
3.3 Afforestation and reforestation on harvested land
for 2011
NO NO
3.3 Deforestation for 2011 25 387 45 069 45 069
Activities under Article 3, paragraph 4, for 2011d
3.4 Forest management for 2011
3.4 Cropland management for 2011
3.4 Cropland management for the base year
3.4 Grazing land management for 2011
3.4 Grazing land management for the base year
3.4 Revegetation for 2011
3.4 Revegetation for the base year
Abbreviations: Annex A sources = source categories included in Annex A to the Kyoto Protocol, NO = not occurring. a “Adjustment” is relevant only for Parties for which the expert review team has calculated one or more adjustments. b “Final” includes revised estimates, if any, and/or adjustments, if any. c The values for “Total Annex A sources” in the columns “As reported”, “Revised estimates” and “Final” may not equal the
sum of the values for the gases in those columns owing to rounding. d Activities under Article 3, paragraph 4, are relevant only for Parties that elected one or more such activities.
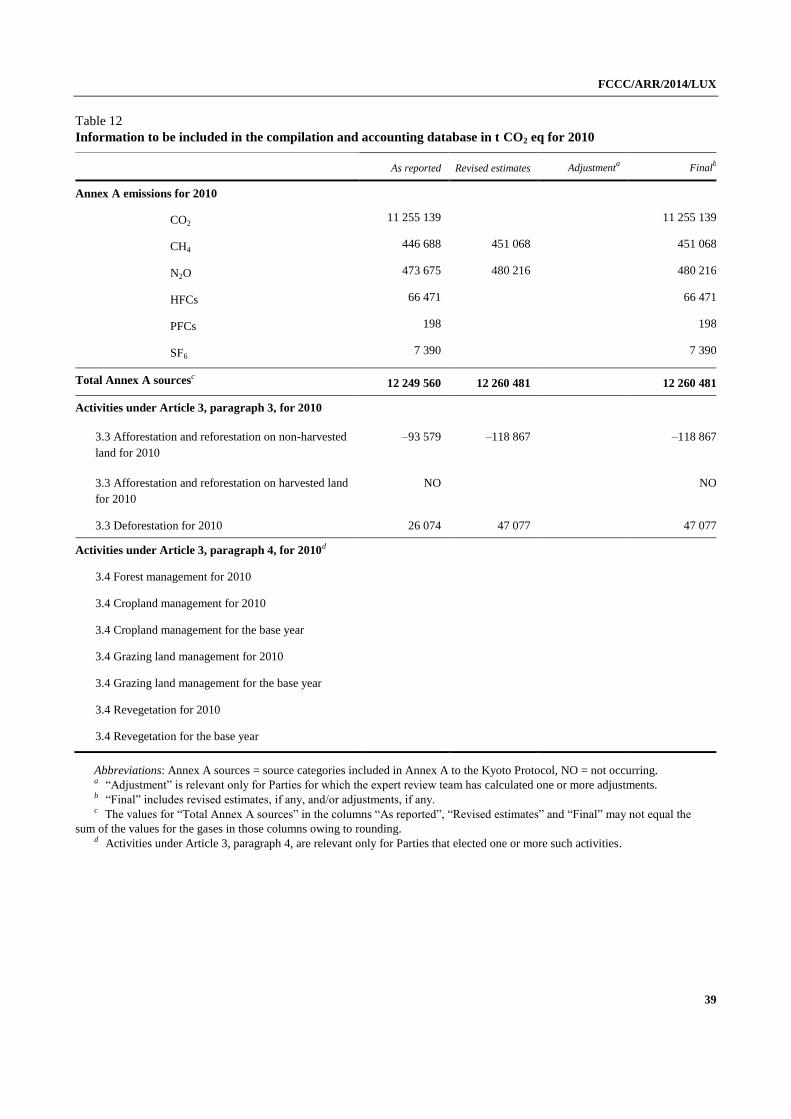
FCCC/ARR/2014/LUX
39
Table 12
Information to be included in the compilation and accounting database in t CO2 eq for 2010
As reported Revised estimates Adjustmenta Final
b
Annex A emissions for 2010
CO2 11 255 139 11 255 139
CH4 446 688 451 068 451 068
N2O 473 675 480 216 480 216
HFCs 66 471 66 471
PFCs 198 198
SF6 7 390 7 390
Total Annex A sourcesc 12 249 560 12 260 481 12 260 481
Activities under Article 3, paragraph 3, for 2010
3.3 Afforestation and reforestation on non-harvested
land for 2010
–93 579 –118 867 –118 867
3.3 Afforestation and reforestation on harvested land
for 2010
NO NO
3.3 Deforestation for 2010 26 074 47 077 47 077
Activities under Article 3, paragraph 4, for 2010d
3.4 Forest management for 2010
3.4 Cropland management for 2010
3.4 Cropland management for the base year
3.4 Grazing land management for 2010
3.4 Grazing land management for the base year
3.4 Revegetation for 2010
3.4 Revegetation for the base year
Abbreviations: Annex A sources = source categories included in Annex A to the Kyoto Protocol, NO = not occurring. a “Adjustment” is relevant only for Parties for which the expert review team has calculated one or more adjustments. b “Final” includes revised estimates, if any, and/or adjustments, if any. c The values for “Total Annex A sources” in the columns “As reported”, “Revised estimates” and “Final” may not equal the
sum of the values for the gases in those columns owing to rounding. d Activities under Article 3, paragraph 4, are relevant only for Parties that elected one or more such activities.

FCCC/ARR/2014/LUX
40
Table 13
Information to be included in the compilation and accounting database in t CO2 eq for 2009
As reported Revised estimates Adjustmenta Final
b
Annex A emissions for 2009
CO2 10 703 315 10 703 315
CH4 440 034 444 337 444 337
N2O 467 814 469 580 469 580
HFCs 65 466 65 466
PFCs 218 218
SF6 6 999 6 999
Total Annex A sourcesc 11 683 847 11 689 916 11 689 916
Activities under Article 3, paragraph 3, for 2009
3.3 Afforestation and reforestation on non-harvested
land for 2009
–78 934 –106 319 –106 319
3.3 Afforestation and reforestation on harvested land
for 2009
NO NO
3.3 Deforestation for 2009 26 762 49 086 49 086
Activities under Article 3, paragraph 4, for 2009d
3.4 Forest management for 2009
3.4 Cropland management for 2009
3.4 Cropland management for the base year
3.4 Grazing land management for 2009
3.4 Grazing land management for the base year
3.4 Revegetation for 2009
3.4 Revegetation for the base year
Abbreviations: Annex A sources = source categories included in Annex A to the Kyoto Protocol, NO = not occurring. a “Adjustment” is relevant only for Parties for which the expert review team has calculated one or more adjustments. b “Final” includes revised estimates, if any, and/or adjustments, if any. c The values for “Total Annex A sources” in the columns “As reported”, “Revised estimates” and “Final” may not equal the
sum of the values for the gases in those columns owing to rounding. d Activities under Article 3, paragraph 4, are relevant only for Parties that elected one or more such activities.
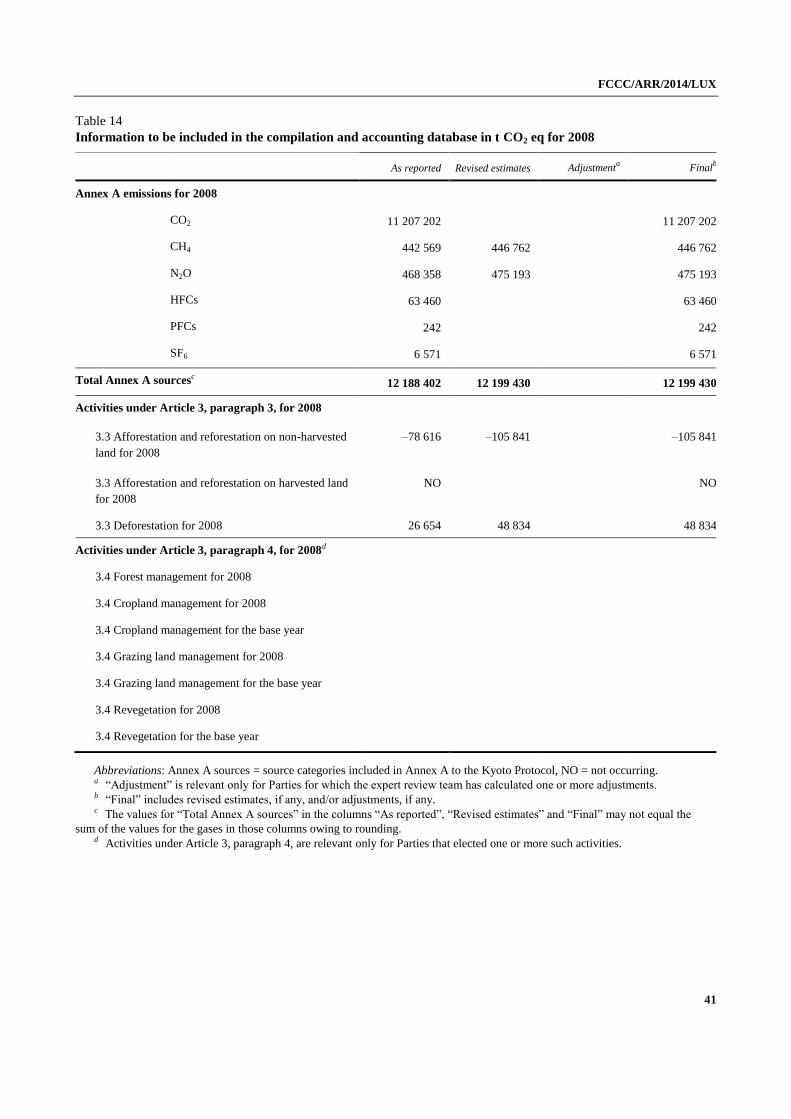
FCCC/ARR/2014/LUX
41
Table 14
Information to be included in the compilation and accounting database in t CO2 eq for 2008
As reported Revised estimates Adjustmenta Final
b
Annex A emissions for 2008
CO2 11 207 202 11 207 202
CH4 442 569 446 762 446 762
N2O 468 358 475 193 475 193
HFCs 63 460 63 460
PFCs 242 242
SF6 6 571 6 571
Total Annex A sourcesc 12 188 402 12 199 430 12 199 430
Activities under Article 3, paragraph 3, for 2008
3.3 Afforestation and reforestation on non-harvested
land for 2008
–78 616 –105 841 –105 841
3.3 Afforestation and reforestation on harvested land
for 2008
NO NO
3.3 Deforestation for 2008 26 654 48 834 48 834
Activities under Article 3, paragraph 4, for 2008d
3.4 Forest management for 2008
3.4 Cropland management for 2008
3.4 Cropland management for the base year
3.4 Grazing land management for 2008
3.4 Grazing land management for the base year
3.4 Revegetation for 2008
3.4 Revegetation for the base year
Abbreviations: Annex A sources = source categories included in Annex A to the Kyoto Protocol, NO = not occurring. a “Adjustment” is relevant only for Parties for which the expert review team has calculated one or more adjustments. b “Final” includes revised estimates, if any, and/or adjustments, if any. c The values for “Total Annex A sources” in the columns “As reported”, “Revised estimates” and “Final” may not equal the
sum of the values for the gases in those columns owing to rounding. d Activities under Article 3, paragraph 4, are relevant only for Parties that elected one or more such activities.
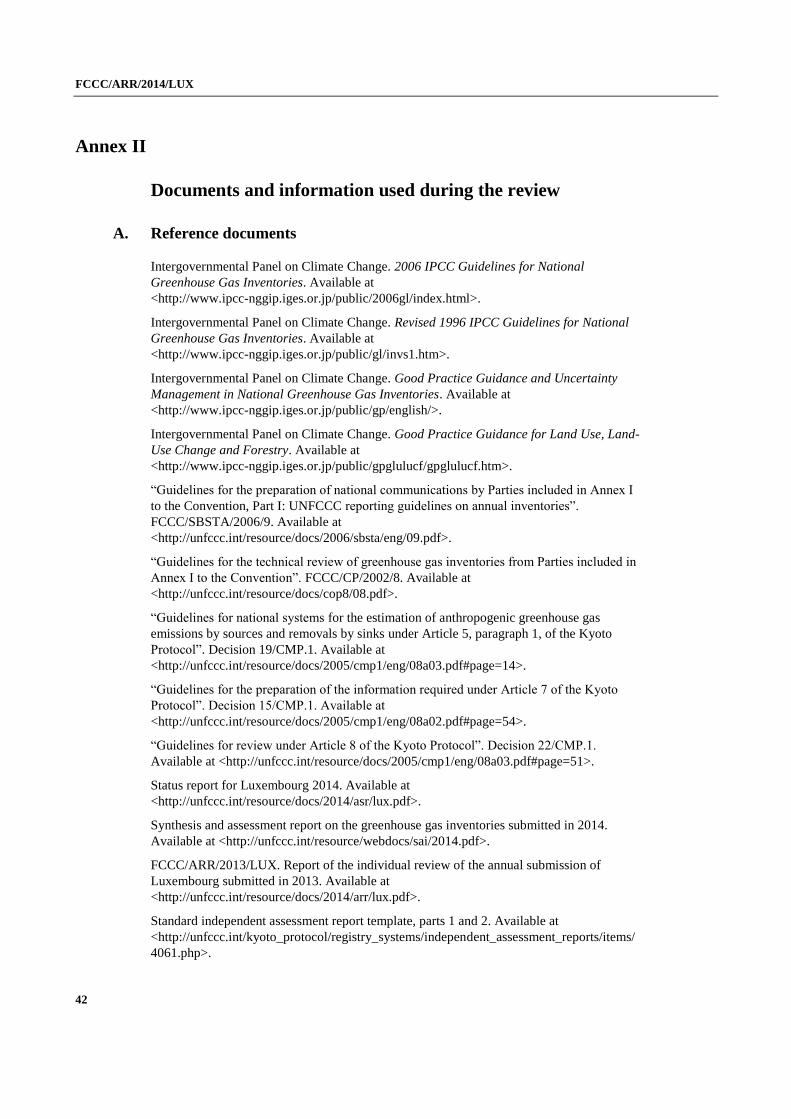
FCCC/ARR/2014/LUX
42
Annex II
Documents and information used during the review
A. Reference documents
Intergovernmental Panel on Climate Change. 2006 IPCC Guidelines for National
Greenhouse Gas Inventories. Available at
<http://www.ipcc-nggip.iges.or.jp/public/2006gl/index.html>.
Intergovernmental Panel on Climate Change. Revised 1996 IPCC Guidelines for National
Greenhouse Gas Inventories. Available at
<http://www.ipcc-nggip.iges.or.jp/public/gl/invs1.htm>.
Intergovernmental Panel on Climate Change. Good Practice Guidance and Uncertainty
Management in National Greenhouse Gas Inventories. Available at
<http://www.ipcc-nggip.iges.or.jp/public/gp/english/>.
Intergovernmental Panel on Climate Change. Good Practice Guidance for Land Use, Land-
Use Change and Forestry. Available at
<http://www.ipcc-nggip.iges.or.jp/public/gpglulucf/gpglulucf.htm>.
“Guidelines for the preparation of national communications by Parties included in Annex I
to the Convention, Part I: UNFCCC reporting guidelines on annual inventories”.
FCCC/SBSTA/2006/9. Available at
<http://unfccc.int/resource/docs/2006/sbsta/eng/09.pdf>.
“Guidelines for the technical review of greenhouse gas inventories from Parties included in
Annex I to the Convention”. FCCC/CP/2002/8. Available at
<http://unfccc.int/resource/docs/cop8/08.pdf>.
“Guidelines for national systems for the estimation of anthropogenic greenhouse gas
emissions by sources and removals by sinks under Article 5, paragraph 1, of the Kyoto
Protocol”. Decision 19/CMP.1. Available at
<http://unfccc.int/resource/docs/2005/cmp1/eng/08a03.pdf#page=14>.
“Guidelines for the preparation of the information required under Article 7 of the Kyoto
Protocol”. Decision 15/CMP.1. Available at
<http://unfccc.int/resource/docs/2005/cmp1/eng/08a02.pdf#page=54>.
“Guidelines for review under Article 8 of the Kyoto Protocol”. Decision 22/CMP.1.
Available at <http://unfccc.int/resource/docs/2005/cmp1/eng/08a03.pdf#page=51>.
Status report for Luxembourg 2014. Available at
<http://unfccc.int/resource/docs/2014/asr/lux.pdf>.
Synthesis and assessment report on the greenhouse gas inventories submitted in 2014.
Available at <http://unfccc.int/resource/webdocs/sai/2014.pdf>.
FCCC/ARR/2013/LUX. Report of the individual review of the annual submission of
Luxembourg submitted in 2013. Available at
<http://unfccc.int/resource/docs/2014/arr/lux.pdf>.
Standard independent assessment report template, parts 1 and 2. Available at
<http://unfccc.int/kyoto_protocol/registry_systems/independent_assessment_reports/items/
4061.php>.

FCCC/ARR/2014/LUX
43
B. Additional information provided by Luxembourg
Responses to questions during the review were received from Mr. Marc Schuman
(Environment Agency), including additional material on the methodology and assumptions
used. The following documents1 were also provided by Luxembourg:
Gruber L and Pötsch EM. 2006. Calculation of nitrogen excretion of dairy cows in Austria.
Die Bodenkultur. 57(2): pp. 65–72.
Steinwidder A and Guggenberger T. 2003. Erhebungen zur Futteraufnahme und
Nährstoffversorgung von Milchkühen sowie Nährstoffbilanzierung auf Grünlandbetrieben
in Österreich. [Investigations on feed intake and nutrient supply of dairy cows as well as
nutrient balance studies on farms in grassland regions of Austria]. Die Bodenkultur. 54(1):
pp. 49–66.
Stevens A, van Wesemael B, Marx S and Leydet L. 2014. Mapping Topsoil Organic
Carbon Stocks in Grand-Duchy of Luxembourg. Catholic University of Louvain (Belgium)
and Luxembourg’s Ministry of Agriculture, Wine Production and Consumer Protection. 16
pp.
1 Reproduced as received from Luxembourg.
FCCC/ARR/2014/LUX
44
Annex III
Acronyms and abbreviations
AD activity data
AWMS animal waste management system
C carbon
CH4 methane
CMP Conference of the Parties serving as the meeting of the Parties to the Kyoto Protocol
CO2 carbon dioxide
CO2 eq carbon dioxide equivalent
CRF common reporting format
EF emission factor
ERT expert review team
EU European Union
FAOSTAT database of the Food and Agriculture Organization of the United Nations
FracGASF the fraction of synthetic fertilizer nitrogen applied to soils that volatilizes as ammonia and
nitrogen oxides
FracGASM the fraction of livestock nitrogen excretion that volatilizes as ammonia and nitrogen oxides
GHG greenhouse gas; unless indicated otherwise, GHG emissions are the sum of CO2, CH4, N2O,
HFCs, PFCs and SF6 without GHG emissions and removals from LULUCF
HFCs hydrofluorocarbons
IE included elsewhere
IEA International Energy Agency
IEF implied emission factor
IPCC Intergovernmental Panel on Climate Change
ITL international transaction log
kg kilogram (1 kg = 1,000 grams)
kha kilohectare
KP-LULUCF land use, land-use change and forestry emissions and removals from activities under
Article 3, paragraphs 3 and 4, of the Kyoto Protocol
LULUCF land use, land-use change and forestry
MB mechanical–biological
MCF methane conversion factor
Mg megagram (1 Mg = 1 tonne)
N2O nitrous oxide
N nitrogen
NA not applicable
NCV net calorific value
NE not estimated
Nex nitrogen excretion
NFI national forest inventory
NIR national inventory report
NO not occurring
PFCs perfluorocarbons
PJ petajoule (1 PJ = 1015
joule)
QA/QC quality assurance/quality control
RMU removal unit
SEF standard electronic format
SF6 sulphur hexafluoride
SIAR standard independent assessment report
FCCC/ARR/2014/LUX
45
SOC soil organic carbon
STATEC national statistics
SWDS solid waste disposal sites
TJ terajoule (1 TJ = 1012
joule)
UNFCCC United Nations Framework Convention on Climate Change