distinct subtypes of polycystic ovary syndrome with novel
TRANSCRIPT

RESEARCH ARTICLE
Distinct subtypes of polycystic ovary
syndrome with novel genetic associations: An
unsupervised, phenotypic clustering analysis
Matthew DapasID1, Frederick T. J. LinID
1, Girish N. NadkarniID2, Ryan SiskID
1, Richard
S. Legro3, Margrit Urbanek1,4,5, M. Geoffrey HayesID1,4,6‡, Andrea DunaifID
7‡*
1 Division of Endocrinology, Metabolism, and Molecular Medicine, Department of Medicine, Northwestern
University Feinberg School of Medicine, Chicago, Illinois, United States of America, 2 Division of Nephrology,
Icahn School of Medicine at Mount Sinai, New York, New York, United States of America, 3 Department of
Obstetrics and Gynecology, Penn State College of Medicine, Hershey, Pennsylvania, United States of
America, 4 Center for Genetic Medicine, Northwestern University Feinberg School of Medicine, Chicago,
Illinois, United States of America, 5 Center for Reproductive Science, Northwestern University Feinberg
School of Medicine, Chicago, Illinois, United States of America, 6 Department of Anthropology, Northwestern
University, Evanston, Illinois, United States of America, 7 Division of Endocrinology, Diabetes and Bone
Disease, Icahn School of Medicine at Mount Sinai, New York, New York, United States of America
‡ These authors jointly supervised this work.
Abstract
Background
Polycystic ovary syndrome (PCOS) is a common, complex genetic disorder affecting up to
15% of reproductive-age women worldwide, depending on the diagnostic criteria applied.
These diagnostic criteria are based on expert opinion and have been the subject of consid-
erable controversy. The phenotypic variation observed in PCOS is suggestive of an underly-
ing genetic heterogeneity, but a recent meta-analysis of European ancestry PCOS cases
found that the genetic architecture of PCOS defined by different diagnostic criteria was gen-
erally similar, suggesting that the criteria do not identify biologically distinct disease sub-
types. We performed this study to test the hypothesis that there are biologically relevant
subtypes of PCOS.
Methods and findings
Using biochemical and genotype data from a previously published PCOS genome-wide
association study (GWAS), we investigated whether there were reproducible phenotypic
subtypes of PCOS with subtype-specific genetic associations. Unsupervised hierarchical
cluster analysis was performed on quantitative anthropometric, reproductive, and metabolic
traits in a genotyped cohort of 893 PCOS cases (median and interquartile range [IQR]: age
= 28 [25–32], body mass index [BMI] = 35.4 [28.2–41.5]). The clusters were replicated in an
independent, ungenotyped cohort of 263 PCOS cases (median and IQR: age = 28 [24–33],
BMI = 35.7 [28.4–42.3]). The clustering revealed 2 distinct PCOS subtypes: a “reproductive”
group (21%–23%), characterized by higher luteinizing hormone (LH) and sex hormone bind-
ing globulin (SHBG) levels with relatively low BMI and insulin levels, and a “metabolic” group
PLOS MEDICINE
PLOS Medicine | https://doi.org/10.1371/journal.pmed.1003132 June 23, 2020 1 / 28
a1111111111
a1111111111
a1111111111
a1111111111
a1111111111
OPEN ACCESS
Citation: Dapas M, Lin FTJ, Nadkarni GN, Sisk R,
Legro RS, Urbanek M, et al. (2020) Distinct
subtypes of polycystic ovary syndrome with novel
genetic associations: An unsupervised, phenotypic
clustering analysis. PLoS Med 17(6): e1003132.
https://doi.org/10.1371/journal.pmed.1003132
Academic Editor: Jenny E. Myers, University of
Manchester, UNITED KINGDOM
Received: August 22, 2019
Accepted: May 13, 2020
Published: June 23, 2020
Peer Review History: PLOS recognizes the
benefits of transparency in the peer review
process; therefore, we enable the publication of
all of the content of peer review and author
responses alongside final, published articles. The
editorial history of this article is available here:
https://doi.org/10.1371/journal.pmed.1003132
Copyright: © 2020 Dapas et al. This is an open
access article distributed under the terms of the
Creative Commons Attribution License, which
permits unrestricted use, distribution, and
reproduction in any medium, provided the original
author and source are credited.
Data Availability Statement: This study used data
that we collected previously for our PCOS GWAS
(Hayes and Urbanek et al. Nat Commun 6:7502,
2015) [19]. Stage 1 genotype data have been

(37%–39%), characterized by higher BMI, glucose, and insulin levels with lower SHBG and
LH levels. We performed a GWAS on the genotyped cohort, limiting the cases to either the
reproductive or metabolic subtypes. We identified alleles in 4 loci that were associated with
the reproductive subtype at genome-wide significance (PRDM2/KAZN, P = 2.2 × 10⁻¹⁰;
IQCA1, P = 2.8 × 10⁻⁹; BMPR1B/UNC5C, P = 9.7 × 10⁻⁹; CDH10, P = 1.2 × 10⁻⁸) and one
locus that was significantly associated with the metabolic subtype (KCNH7/FIGN, P = 1.0 ×10⁻⁸). We developed a predictive model to classify a separate, family-based cohort of 73
women with PCOS (median and IQR: age = 28 [25–33], BMI = 34.3 [27.8–42.3]) and found
that the subtypes tended to cluster in families and that carriers of previously reported rare
variants in DENND1A, a gene that regulates androgen biosynthesis, were significantly more
likely to have the reproductive subtype of PCOS. Limitations of our study were that only
PCOS cases of European ancestry diagnosed by National Institutes of Health (NIH) criteria
were included, the sample sizes for the subtype GWAS were small, and the GWAS findings
were not replicated.
Conclusions
In conclusion, we have found reproducible reproductive and metabolic subtypes of PCOS.
Furthermore, these subtypes were associated with novel, to our knowledge, susceptibility
loci. Our results suggest that these subtypes are biologically relevant because they appear
to have distinct genetic architecture. This study demonstrates how phenotypic subtyping
can be used to gain additional insights from GWAS data.
Author summary
Why was this study done?
• Polycystic ovary syndrome (PCOS) is one of the most common endocrine disorders in
women of reproductive age.
• The signs and symptoms of PCOS are heterogeneous, which suggests that the etiology
may differ among subsets of women with PCOS.
• Elucidating the genetic mechanisms of PCOS could result in improved diagnosis and
treatment.
What did the researchers do and find?
• A clustering analysis of 893 women with PCOS, using reproductive and metabolic quan-
titative traits, was performed to identify subsets of affected women with similar hor-
monal profiles.
• There were distinct reproductive and metabolic “subtypes” of women with PCOS.
• Novel genetic variants were uniquely associated with each of the PCOS subtypes.
PLOS MEDICINE Phenotypic clustering reveals distinct subtypes of PCOS with novel genetic associations
PLOS Medicine | https://doi.org/10.1371/journal.pmed.1003132 June 23, 2020 2 / 28
deposited in the database of Genotypes and
Phenotypes (dbGaP) under the accession code
phs000368.v1.p1 (https://www.ncbi.nlm.nih.gov/
projects/gap/cgi-bin/study.cgi?study_id=
phs000368.v1.p1). The following variables are
provided along with the genotype data: SUBJID
(de-identified), Case_Control (disease status), Sex,
Age, Height, Weight, BMI, Race, Ethnicity. Subtype
classifications for these subjects are provided in S5
Table. This study used additional array and whole-
genome sequencing data from human subjects.
The majority of study subjects were enrolled prior
to the implementation of the NIH Genomic Data
Sharing Policy in January 25, 2015. Consequently,
none of the consent forms directly addressed the
broad sharing of participants’ data nor the risks
associated with broad data sharing of these data.
Further, consent forms limited the use of the DNA
samples from PCOS cases to genetic analyses of
this disorder. Therefore, individual-level data
cannot be shared through NIH-designated
repositories without approval of the Institutional
Review Boards (IRBs) where the cohort was
originally studied. Access to aggregate data must
be limited to genetic analyses of PCOS and require
approval of all relevant IRBs. Investigators may
contact individual site PIs from Hayes & Urbanek
et al. [19] or Kelly Brewer at kelly.brewer@mssm.
edu if they are interested in collaborating on a
project that requires use of quantitative trait data.
The R code used to perform the clustering and
subsequent family cohort classification have been
uploaded to the following public GitHub repository:
github.com/mdapas/PCOS_phenotype_clustering.
Funding: This study was supported by National
Institutes of Health (NIH) Grants P50 HD044405
(AD), R01 HD057223 (AD), and R01 HD085227
(AD). MD was supported by a Ruth L. Kirschstein
National Research Service Award Institutional
Research Training Grant, T32 DK007169.
Competing interests: I have read the journal’s
policy and the authors of this manuscript have the
following competing interests: GNN owns equity in
RenalytixAI, Inc., and receives financial
compensation as a consultant and advisory board
member for RenalytixAI. GNN has received
operational funding from Goldfinch Bio and
consulting fees from BioVie Inc. and GLG
consulting in the past three years. GNN is a former
member of the advisory board of PulseData and
received consulting fees for their services and
continues to hold equity interests in PulseData.
Abbreviations: ACKR3, atypical chemokine
receptor 3; AGMAT, agmatinase; ALK6, activin
receptor-like kinase 6; AMH, anti-Mullerian
hormone; ARL14EP, ADP ribosylation factor like

What do these findings mean?
• Our results suggest that there are distinct forms of PCOS that are associated with differ-
ent underlying biological mechanisms.
• Women with PCOS may be poorly served by being grouped under a single diagnosis
because PCOS subtypes may differ in responses to therapy and in long-term outcomes.
Introduction
Understanding the genetic architecture of complex diseases is a central challenge in human
genetics [1–3]. Often defined according to arbitrary diagnostic criteria, complex diseases can
represent the phenotypic convergence of numerous genetic etiologies under the same clinical
diagnosis [4–8]. Recent studies in type 2 diabetes (T2D) support the concept that there are dis-
ease subtypes with distinct genetic architecture [7,8]. Identifying and addressing genetic het-
erogeneity in complex diseases could increase power to detect causal variants and improve
treatment efficacy [9].
Polycystic ovary syndrome (PCOS) is a highly heritable, complex genetic disorder affecting
up to 15% of reproductive-age women worldwide, depending on the diagnostic criteria applied
[10]. It is characterized by a variable constellation of reproductive and metabolic abnormalities
[11–13]. It is the leading cause of anovulatory infertility and a major risk factor for T2D in
young women [14]. Despite these substantial morbidities, the etiology (or etiologies) of PCOS
remains unknown [15]. Accordingly, the commonly used diagnostic criteria for PCOS, the
National Institutes of Health (NIH) criteria [16] and the Rotterdam criteria [17,18], are based
on expert opinion rather than mechanistic insights and are designed to account for the diverse
phenotypic presentations of PCOS. The NIH criteria require the presence of hyperandrogen-
ism (HA) and chronic oligo/anovulation or ovulatory dysfunction (OD) [16]. The Rotterdam
criteria include polycystic ovarian morphology (PCOM) and require the presence of at least 2
of these 3 key reproductive traits, resulting in 3 different affected phenotypes: HA and OD
with or without PCOM, also known as NIH PCOS, as well as 2 additional non-NIH Rotterdam
phenotypes, HA and PCOM and OD and PCOM.
Genome-wide association studies (GWAS) have considerably advanced our understanding
of the pathophysiology of PCOS. These studies have implicated gonadotropin secretion [19]
and action [20,21], androgen biosynthesis [20–22], metabolic regulation [22,23], and ovarian
aging [23] in PCOS pathogenesis. A recent meta-analysis [22] of GWAS was the first study to
investigate the genetic architecture of the diagnostic criteria. Only one of 14 PCOS susceptibil-
ity loci identified was significantly more strongly associated with the NIH phenotype com-
pared to non-NIH Rotterdam phenotypes or to self-reported PCOS. These findings suggested
that the genetic architecture of the phenotypes defined by the different PCOS diagnostic crite-
ria were generally similar. Therefore, the current diagnostic criteria do not appear to identify
genetically distinct disease subtypes.
It is possible to identify physiologically relevant complex disease subtypes through cluster
analysis of phenotypic traits [8,24,25]. Indeed, there have been previous efforts to subtype
PCOS using unsupervised cluster analysis of its hormonal and anthropometric traits [26–29].
However, there has been no validation that the resulting PCOS subtypes were biologically
meaningful by testing their association with genetic variants, with other independent
PLOS MEDICINE Phenotypic clustering reveals distinct subtypes of PCOS with novel genetic associations
PLOS Medicine | https://doi.org/10.1371/journal.pmed.1003132 June 23, 2020 3 / 28
GTPase 14 effector protein; AS1, antisense RNA 1;
BMI, body mass index; BMPR1B, bone
morphogenetic protein receptor type IB; CASP9,
caspase 9; CDH10, cadherin 10; CELA2,
chymotrypsin like elastase 2; CI, confidence
interval; COBLL1, cordon-bleu WH2 repeat protein
like 1; CTRC, chymotrypsin C; C1orf195,
chromosome 1 open reading frame 195; dbGaP,
database of Genotypes and Phenotypes; DDI2,
DNA damage inducible 1 homolog 2; DENND1A,
DENN domain containing 1A; DHEAS,
dehydroepiandrosterone sulfate; DNAJC16, DnaJ
heat shock protein family (Hsp40) member C16;
DPP4, dipeptidyl peptidase 4; EAF, effect allele
frequency; EFHD2, EF-hand domain family member
D2; ERG3, early growth response protein 3; ERα,
estrogen receptor α; FAP, fibroblast activation
protein alpha; FBLIM1, filamin binding LIM protein
1; FHAD1, forkhead associated phosphopeptide
binding domain 1; FIGN, fidgetin; FLJ37453,
uncharacterized LOC729614; FSH, follicle-
stimulating hormone; FSHB, follicle stimulating
hormone subunit beta; GCA, grancalcin; GCG,
glucagon; Glu0, fasting glucose; GMM, Gaussian
mixed model; GnRH, gonadotropin-releasing
hormone; GRB14, growth factor receptor bound
protein 14; GWAS, genome-wide association
study; HA, hyperandrogenism; Hi-C, chromatin
conformation capture; IFIH1, interferon induced
with helicase C domain 1; Ins0, fasting insulin;
IQCA1, IQ motif containing with AAA domain 1;
IQR, interquartile range; KAZN, kazrin, periplakin
interacting protein; KCNH7, potassium voltage-
gated channel subfamily H member 7; LD, linkage
disequilibrium; LH, luteinizing hormone; LOC,
uncharacterized non-coding RNA; LRRC38, leucine
rich repeat containing 38; MAC, minor allele count;
MAF, minor allele frequency; MIR5096, microRNA
5096; MPPED2, metallophosphoesterase domain
containing 2; NIH, National Institutes of Health; OD,
ovulatory dysfunction; OR, odds ratio; PC, principal
component; PCA, principal component analysis;
PCOM, polycystic ovarian morphology; PCOS,
polycystic ovary syndrome; PDPN, podoplanin;
PLEKHM2, pleckstrin homology and RUN domain
containing M2; PPCOSII, Pregnancy in PCOS II;
PRAMEF, preferentially expressed antigen in
melanoma family member; PRDM2, PR/SET
domain 2; PRDM9, PR/SET domain 9; QDA,
quadratic discriminant analysis; RF, random forest;
RSC1A1, regulator of solute carriers 1; SHBG, sex
hormone binding globulin; SLC25A34, solute
carrier family 25 member 34; SLC38A11, solute
carrier family 38 member 11; SNORA70F, small
nucleolar RNA, H/ACA box 70F; SNP, single
nucleotide polymorphism; SPEN, spen family
transcriptional repressor; STREGA, Strengthening

biomarkers, or with outcomes such as therapeutic responses. In this study, we sought to 1)
identify phenotypic subtypes of PCOS using an unsupervised clustering approach on repro-
ductive and metabolic quantitative traits from a large cohort of women with PCOS, 2) validate
those subtypes in an independent cohort, and 3) test whether the subtypes thus identified were
associated with distinct common genetic variants. As an additional validation, we investigated
the association of the subtypes with rare genetic variants we recently identified in a family-
based PCOS cohort [30].
Methods
Subjects
This study used biochemical and genotype data from our previously published PCOS GWAS,
Hayes and Urbanek and colleagues [19], in which a discovery sample (Stage 1) of 984 unrelated
PCOS cases and 2,964 population controls was studied, followed by a replication sample (Stage
2) of 1,799 PCOS cases and 1,231 phenotyped reproductively normal control women. All cases
were of European ancestry. The present study began as an exploratory analysis to test the
hypothesis that subtypes existed within the PCOS GWAS cohorts. Further analyses were per-
formed once subtypes were identified. This study is reported according to the Strengthening
the Reporting of Genetic Association Studies (STREGA) guideline (S1 Checklist). The study
was approved by the Institutional Review Board of Northwestern University Feinberg School
of Medicine, and each subject provided written informed consent prior to the study [19].
All PCOS cases were aged 13–45 years and were diagnosed according to the NIH criteria
[10] of hyperandrogenism and chronic anovulation (8 or fewer menses per year), excluding
specific disorders of the adrenal glands, ovaries, or pituitary gland [31]. Cases fulfilling the
NIH criteria also meet the Rotterdam criteria for PCOS [10]. The GWAS cohorts included in
the cluster analysis, the PCOS Family Study and Pregnancy in PCOS II (PPCOSII) study [19]
(S1 Table), had complete data for the following traits: body mass index (BMI), testosterone
(T), sex hormone binding globulin (SHBG), dehydroepiandrosterone sulfate (DHEAS), lutein-
izing hormone (LH), follicle-stimulating hormone (FSH), fasting insulin (Ins0), and fasting
glucose (Glu0). Complete data for these quantitative traits were not available in the other
GWAS cohorts because of differences in phenotyping protocols [19] (S1 Table). Two addi-
tional NIH PCOS cohorts with complete quantitative trait data were included in the present
study. An ungenotyped cohort of 263 cases was used for clustering replication. A family-based
whole-genome sequencing cohort of 73 PCOS cases was investigated to assess subtype cluster-
ing in families and for rare variant analysis [30].
Contraceptive steroids had been stopped at least 3 months prior to screening for the PCOS
Family Study, ungenotyped, and whole-genome sequencing PCOS cohorts. Elevated T, non-
SHBG bound T, and/or DHEAS levels were documented in all PCOS cases prior to enrollment
in these cohorts. PPCOSII was a randomized clinical trial of letrozole versus clomiphene cit-
rate for infertility in PCOS [32]. The PCOS cases in this study had contraceptive steroids dis-
continued at least 2 months prior to their baseline phenotyping visit. Since the PCOS women
in this trial were seeking fertility, the majority were not on recent contraceptive steroid ther-
apy. Therefore, it is unlikely that recent contraceptive steroid use altered T or SHBG levels in
the PCOS cases included in the cluster analysis.
All subjects included in the cluster analysis were from US-based study sites. The GWAS
Stage 2 replication included 2 cohorts from Europe in addition to US-based cohorts [19]. Nei-
ther European cohort was included in the cluster analysis because of incomplete quantitative
trait data. We compared age and BMI in the cohorts included in the cluster analysis of cases
with complete quantitative trait data versus cases from the same cohort not included because
PLOS MEDICINE Phenotypic clustering reveals distinct subtypes of PCOS with novel genetic associations
PLOS Medicine | https://doi.org/10.1371/journal.pmed.1003132 June 23, 2020 4 / 28
the Reporting of Genetic Association Studies; SVM,
support vector machine; T, testosterone; TAD,
topologically associating domain; TGF-β,
transforming growth factor beta; TMEM,
transmembrane protein; T2D, type 2 diabetes;
UNC5C, unc-5 netrin receptor C; UQCRHL,
ubiquinol-cytochrome c reductase hinge protein
like.

of missing data. There were no significant differences in these parameters, suggesting that the
included cases were similar to those excluded because of missing data (S2 Table).
Population-based control DNA samples for the GWAS Stage 1 sample were obtained from
the NUgene biobank [33] from women of European ancestry, aged 18–97 years. Control
women in the Stage 2 sample were phenotyped reproductively normal women of European
ancestry, aged 15–45 years, with regular menses and normal T levels, and who were not receiv-
ing contraceptive steroids for at least 3 months prior to study [19]. T, DHEAS, SHBG, LH,
FSH, Glu0, and Ins0 levels were measured as previously reported [19].
Clustering
Clustering was performed in PCOS cases on 8 adjusted quantitative traits: BMI, T, DHEAS,
Ins0, Glu0, SHBG, LH, and FSH. There were 893 combined cases from the GWAS samples
with complete quantitative trait data available for clustering. Quantitative trait values were first
loge-normalized and adjusted for age and assay method, which varied according to the differ-
ent study sites where samples were collected [19], using a linear regression. An inverse normal
transformation was then applied for each trait to ensure equal scaling. The normalized trait
residuals were clustered using unsupervised, agglomerative, hierarchical clustering according
to a generalization of Ward’s minimum variance method [34,35] on Manhattan distances
between trait values. Differences in adjusted, normalized trait values between subtypes were
assessed using Kruskal–Wallis and unpaired Wilcoxon rank–sum tests corrected for multiple
testing (Bonferroni). Cluster stability was assessed by computing the mean Jaccard coefficient
from a repeated nonparametric bootstrap resampling (n = 1,000) of the dissimilarity matrix
[36]. Jaccard coefficients below 0.5 indicate that a cluster does not capture any discernable pat-
tern within the data, while a mean coefficient above 0.6 indicates that the cluster reflects a real
pattern within the data [36]. Cluster reproducibility was further assessed by repeating the clus-
tering procedure in an independent cohort of 263 PCOS cases.
Association testing
Stage 1 samples were genotyped using the Illumina OmniExpress (HumanOmniExpress-
12v1_C; San Diego, CA, USA) single nucleotide polymorphism (SNP) array. Stage 2 samples
were genotyped using the Metabochip [37] with added custom variant content based on ancil-
lary studies and the discovery results [19]. The Stage 2 association replication in this study was
therefore limited; many of the loci from Stage 1 were therefore not characterized in Stage 2.
Low-quality genotypic data were removed as described previously [19]. SNPs were filtered
according to minor allele frequency (MAF� 0.01), Hardy–Weinberg equilibrium (P� 1 ×10⁻⁶), call rate (�0.99), minor allele count (MAC > 5), mendelian concordance, and duplicate
sample concordance. Only autosomal SNPs were considered. Ancestry was evaluated using a
principal component analysis (PCA) [38] on 76,602 linkage disequilibrium (LD)-pruned SNPs
[19]. Samples with values>3 standard deviations from the median for either of the first 2 prin-
cipal components (PCs) were excluded (34 in discovery; 37 in replication). Genotype data
were phased using ShapeIT (v2.r790) [39] and then imputed to the 1000 Genomes reference
panel (Phase3 v5) [40] using Minimac3 via the Michigan Imputation Server [41]. Imputed
SNPs with an allelic r2 below 0.8 were removed from analysis [42].
Association testing was performed separately for Stage 1 and Stage 2 samples. Of the 893
combined cases from both stages included in the clustering analysis, 555 were from the Stage 1
sample, and 338 were from the Stage 2 sample. In Stage 1, 2,964 normal controls were used,
and 1,134 were used in Stage 2. Logistic regressions were performed using SNPTEST [43] for
case–control status under an additive genetic model, adjusting for BMI and first 3 PCs of
PLOS MEDICINE Phenotypic clustering reveals distinct subtypes of PCOS with novel genetic associations
PLOS Medicine | https://doi.org/10.1371/journal.pmed.1003132 June 23, 2020 5 / 28

ancestry. P-values are reported as P1 and P2 for Stage 1 and Stage 2, respectively. Cases were
limited to specific subtypes selected from clustering results. The betas and standard errors
were combined across Stage 1 and Stage 2 samples for each subtype under a fixed meta-analy-
sis model weighting each strata by sample size [44]. Association test outputs were aligned to
the same reference alleles and weighted z-scores were computed for each SNP. The square
roots of each sample size were used as the proportional weights. Meta-analysis P-values (Pmeta)
were adjusted for genomic inflation. Associations with P-values < 1.67 × 10⁻⁸ were considered
statistically significant, based on the standard P< 5 × 10⁻⁸ used in conventional GWAS
adjusted for the 3 independent association tests performed.
Chromatin interactions
Neighboring chromatin interactions were investigated in intergenic loci using high-through-
put chromatin conformation capture (Hi-C) data from the 3DIV database [45]. Topologically
associating domains (TADs) were identified using TopDom [46] with a window size of 20.
Identifying subtypes in PCOS families
Quantitative trait data from the affected women (n = 73) in the family-sequencing cohort [30]
were adjusted and normalized as described above. Subtype classifiers were modeled on the
adjusted trait values and cluster assignments from the genotyped clustering cohort. Several
classification methods were compared using 10-fold cross-validation, including support vector
machine (SVM), random forest (RF), Gaussian mixed model (GMM), and quadratic discrimi-
nant analysis (QDA) [47]. The classifier with the lowest error rate was then applied to the
affected women in the family-sequencing cohort to identify subtypes of PCOS in the family
data. Some of the probands from the family-based cohort were included in our previous
GWAS [19]. Therefore, there was some sample overlap between the training and test data: of
the 893 genotyped women used to identify the original subtype clusters, 47 were also probands
in the family-based cohort. Differences between subtypes in the proportion of women with
DENND1A rare variants were tested using the chi-square test of independence.
Results
PCOS subtypes
Clustering was first performed in a cohort of 893 genotyped PCOS cases (Table 1, S3 Table).
The clustering revealed 2 distinct phenotypic subtypes: 1) a group (23%, 207/893) character-
ized by higher LH and SHBG levels with relatively low BMI and Ins0 levels, which we desig-
nated “reproductive,” and 2) a group (37%, 329/893) characterized by higher BMI and Glu0
and Ins0 levels with relatively low SHBG and LH levels, which we designated “metabolic” (Fig
1). The key traits distinguishing the reproductive and metabolic subtypes were BMI, insulin,
SHBG, glucose, LH, and FSH, in order of importance according to relative unpaired Wilcoxon
rank–sum test statistics (Fig 2). The remaining cases (40%, 357/893) demonstrated no distin-
guishable pattern regarding their relative phenotypic trait distributions and were designated
“indeterminate” (S4 Table, S5 Table). The reproductive and metabolic subtypes clustered
along opposite ends of the SHBG versus Ins0/BMI axis, which was highly correlated with the
first PC of the adjusted quantitative traits (Fig 3). The reproductive subtype was the most stable
cluster, with a mean bootstrapped Jaccard coefficient (�gC) of 0.61, followed by the metabolic
subtype with �gC = 0.55. The indeterminate group did not appear to capture any discernable
pattern within the data (�gC = 0.41) and was both overlapping and intermediate between the
reproductive and metabolic subtypes on the SHBG versus Ins0/BMI axis.
PLOS MEDICINE Phenotypic clustering reveals distinct subtypes of PCOS with novel genetic associations
PLOS Medicine | https://doi.org/10.1371/journal.pmed.1003132 June 23, 2020 6 / 28

The clustering procedure was then repeated in an independent, ungenotyped cohort of 263
NIH PCOS cases diagnosed according to the same criteria as the genotyped clustering cohort
(Table 1). The clustering yielded similar results, with a comparable distribution of reproduc-
tive (26%, 68/263, �gC = 0.57), metabolic (39%, 104/263, �gC = 0.46), and indeterminate clusters
(35%, 91/263, �gC = 0.40) (Fig 4).
Subtype genetic associations
Genome-wide association testing was performed for each of the 3 subtypes: reproductive, met-
abolic, and indeterminate (Table 2). We identified alleles in 4 novel, to our knowledge, loci
Table 1. Quantitative traits in cluster analysis PCOS cohorts by assay method.
Genotyped Ungenotyped Family Sequencing
Trait and Assay Method N Median (25–75) N Median (25–75) N Median (25–75)
Age (y) 893 28 (25–32) 263 28 (24–33) 73 28 (25–33)
BMI (kg/m2) 893 35.4 (28.2–41.5) 263 35.7 (28.4–42.3) 73 34.3 (27.8–42.3)
T (ng/dL)
Method 1 620 72 (60–91) 180 72 (61–95) 73 73 (64–89)
Method 2 273 52 (38–69) 83 65 (50–80) – –
SHBG (nmol/L)
Method 1 554 54 (34–81) 176 55 (34–82) 72 57 (38–96)
Method 2 40 34 (22–49) 4 32 (18–54) 1 37 (37–37)
Method 3 26 28 (18–41) – – – –
Method 4 273 30 (21–43) 83 29 (22–48) – –
DHEAS (ng/mL)
Method 1 620 2,114 (1,513–2,886) 180 2,190 (1,644–3,004) 73 2,095 (1,509–2,774)
Method 2 273 1,570 (1,024–2,250) 83 1,955 (1,040–2,685) – –
Glu0 (mg/dL)
Method 1 192 90 (84–96) 84 92 (88–100) 8 91(87–95)
Method 2 351 88 (83–95) 136 89 (84–95) 48 91 (85–96)
Method 3 238 85 (77–91) 23 83 (72–89) – –
Method 4 112 87 (81.5–93) 20 79 (77–88) 17 82 (73–88)
Ins0 (μU/mL)
Method 1 5 19 (15–19) 8 21 (11–57) – –
Method 2 614 22 (15–34) 173 23 (16–37) 73 21 (15–30)
Method 3 238 13 (4–21) 23 13 (7–22) – –
Method 4 36 22 (15.5–30.5) 59 21 (15–35) – –
LH (mIU/mL)
Method 1 515 12 (8–18) 173 12 (7–19) 70 12 (6–18)
Method 2 73 13 (9–17) 7 11 (5–15) 3 15 (12–23)
Method 3 32 9 (6–15) – – – –
Method 4 273 10 (7–14) 83 10 (7–14) – –
FSH (mIU/mL)
Method 1 515 9 (7–11) 173 10 (8–11) 70 9 (8–11)
Method 2 73 3 (3–4) 7 4 (2–5) 3 3 (3–4)
Method 3 32 2.4 (2–3) – – – –
Method 4 273 6 (5–7) 83 6 (5–7) – –
Median trait values are shown with 25th and 75th percentiles for each clustering cohort. Details for each assay method are provided in S3 Table. Abbreviations: BMI,
body mass index; DHEAS, dehydroepiandrosterone sulfate; FSH, follicle-stimulating hormone; Glu0, fasting glucose; Ins0, fasting insulin; LH, luteinizing hormone; N,
total number; PCOS, polycystic ovary syndrome; SHBG, sex hormone binding globulin; T, testosterone.
https://doi.org/10.1371/journal.pmed.1003132.t001
PLOS MEDICINE Phenotypic clustering reveals distinct subtypes of PCOS with novel genetic associations
PLOS Medicine | https://doi.org/10.1371/journal.pmed.1003132 June 23, 2020 7 / 28

that were associated with the reproductive PCOS subtype at genome-wide significance (chro-
mosome [chr]1 p36.21 PRDM2/KAZN, P = 2.23 × 10⁻¹⁰; chr2 q37.3 IQCA1, P = 2.76 × 10⁻⁹;
chr4 q22.3 BMPR1B/UNC5C, P = 9.71 × 10⁻⁹; chr5 p14.2–p14.1 CDH10, P = 1.17 × 10⁻⁸) and
one novel, to our knowledge, locus that was significantly associated with the metabolic subtype
(chr2 q24.2–q24.3 KCNH7/FIGN, P = 1.03 × 10⁻⁸). Association testing on the indeterminate
subtype replicated the 11p14.1 FSHB locus from our original GWAS [19] (Table 3; Figs 5
and 6).
The strongest association signal with the reproductive subtype appeared in an intergenic
region of 1p36.21 579 kb downstream of the PRMD2 gene and 194 kb upstream from the
KAZN gene (Fig 7A). The lead SNP in the locus (rs78025940; odds ratio [OR] = 4.75, 2.82–
7.98 95% confidence interval [CI], P1 = 2.16 × 10⁻¹⁰, Pmeta = 2.23 × 10⁻¹⁰) was imputed (r2 =
0.91) in Stage 1 only. The SNP was not genotyped in Stage 2. The lead genotyped SNP in the
locus (rs16850259) was also associated with the reproductive subtype with genome-wide sig-
nificance (Pmeta = 2.14 × 10⁻⁹) and was genotyped only in Stage 1 (OR = 5.57, 3.24–9.56 95%
CI, P1 = 2.08 × 10⁻⁹). In ovarian tissue, the SNPs appear to be centrally located within a large 2
Mb TAD stretching from the FHAD1 gene to upstream of the PDPN gene (Fig 8).
The 2q37.3 locus spanned a 50-kb region of strong LD overlapping the 50 end and promoter
region of the IQCA1 gene (Fig 7B). The SNP rs76182733 had the strongest association in this
Fig 1. Hierarchical clustering of genotyped PCOS clustering cohort. Hierarchical clustering of 893 genotyped PCOS
cases according to adjusted quantitative traits revealed 2 distinct phenotypic subtypes, a “reproductive” cluster, and a
“metabolic” cluster; the remaining cases were designated as “indeterminate.” The reproductive, metabolic, and
indeterminate clusters are shown in the color bar as dark blue, dark red, and gray, respectively. Heatmap colors
correspond to trait z-scores, as shown in the frequency histogram in which red indicates high values and blue indicates
low values for each trait. The row-based dendrogram represents relative distances between trait distributions and was
calculated using the same approach as the subject-based clustering. BMI, body mass index; DHEAS,
dehydroepiandrosterone sulfate; FSH, follicle-stimulating hormone; Glu0, fasting glucose; Ins0, fasting insulin; LH,
luteinizing hormone; PCOS, polycystic ovary syndrome; SHBG, sex hormone binding globulin; T, testosterone.
https://doi.org/10.1371/journal.pmed.1003132.g001
PLOS MEDICINE Phenotypic clustering reveals distinct subtypes of PCOS with novel genetic associations
PLOS Medicine | https://doi.org/10.1371/journal.pmed.1003132 June 23, 2020 8 / 28

locus (Pmeta = 2.76 × 10⁻⁹) with the reproductive subtype. The signal was genotyped only in
Stage 1 (OR = 5.68, 3.00–10.78 95% CI, P1 = 2.69 × 10⁻⁹) and was imputed with an imputation
r2 value of 0.84.
The 4q22.3 locus spanned a 500-kb region of LD, including the 30 ends of both the
BMPR1B and UNC5C genes (Fig 7C). The most strongly associated SNP (rs17023134; Pmeta =
9.71 × 10⁻⁹) in the locus was within an intronic region of UNC5C and was associated with the
reproductive subtype in the Stage 1 discovery sample with genome-wide significance
(OR = 3.02, 2.06–4.42 95% CI, P1 = 1.40 × 10⁻⁸) but was not significantly associated in the
Stage 2 replication analysis (OR = 1.71, 0.98–2.99 95% CI, P2 = 7.8 × 10⁻²). The SNP was
imputed with an r2 of 0.87 and 0.83 in the Stage 1 and Stage 2 analyses, respectively. The most
strongly associated genotyped SNP in the locus (rs10516957) was also genome-wide significant
(Pmeta = 1.46 × 10⁻⁸) and was located in an intronic region of BMPR1B. The genotyped SNP
was nominally associated with the reproductive subtype in both the Stage 1 (OR = 2.42, 1.66–
3.52 95% CI, P1 = 6.72 × 10⁻⁶) and Stage 2 (OR = 2.40, 1.51–3.82 95% CI, P2 = 4.7 × 10⁻⁴) anal-
yses with nearly identical effect sizes.
In the 5p14.2–p14.1 locus, 83 kb upstream of the CDH10 gene (Fig 7D), 2 adjacent SNPs
(rs7735176, rs16893866) in perfect LD were equally associated with the reproductive subtype
with genome-wide significance (Pmeta = 1.17 × 10⁻⁸). The SNPs were imputed in Stage 1
(OR = 5.09, 2.62–9.86 95% CI, P1 = 1.14 × 10⁻⁸) with an imputation r2 of 0.93.
The single locus containing genome-wide significant associations with the metabolic sub-
type was in an intergenic region of 2q24.2–q24.3 roughly 200 kb downstream from FIGN and
500 kb upstream from KCNH7 (Fig 7E). The lead SNP, rs55762028, was imputed in Stage 1
only (OR = 1.86, 0.92–3.75 95% CI, P1 = 9.17 × 10⁻⁹, Pmeta = 1.03 × 10⁻⁸). In pancreatic tissue,
the lead SNPs appear to be located terminally within a 1.3-Mb TAD encompassing the FIGNgene and reaching upstream to the GRB14 gene (Fig 9).
Fig 2. Phenotypic trait distributions in reproductive and metabolic subtypes. Median and IQRs are shown for
normalized, adjusted quantitative trait distributions of genotyped PCOS cases with reproductive or metabolic subtype.
The figure illustrates the traits for which the subtypes differ significantly with an asterisk (�Bonferroni adjusted
Wilcoxon, Padj < 0.05): Ins0, BMI, Glu0, FSH, LH, and SHBG. BMI, body mass index; DHEAS,
dehydroepiandrosterone sulfate; FSH, follicle-stimulating hormone; Glu0, fasting glucose; Ins0, fasting insulin; IQR,
interquartile range; LH, luteinizing hormone; PCOS, polycystic ovary syndrome; SHBG, sex hormone binding
globulin; T, testosterone.
https://doi.org/10.1371/journal.pmed.1003132.g002
PLOS MEDICINE Phenotypic clustering reveals distinct subtypes of PCOS with novel genetic associations
PLOS Medicine | https://doi.org/10.1371/journal.pmed.1003132 June 23, 2020 9 / 28

Association testing on the indeterminate cases replicated the genome-wide significant asso-
ciation in the 11p14.1 FSHB locus (Fig 7F) identified in our original GWAS (14). The lead SNP
(rs10835638; Pmeta = 4.94 × 10⁻¹²) and lead genotyped SNP (rs10835646; Pmeta = 2.75 × 10⁻¹¹)
in this locus differed from the index SNPs identified in our original GWAS (rs11031006) and
in the PCOS meta-analysis (rs11031005), but both of the previously identified index SNPs
were also associated with the indeterminate subgroup with genome-wide significance in this
study (rs11031006: Pmeta = 2.96 × 10⁻¹⁰; rs11031005: Pmeta = 2.91 × 10⁻¹⁰) and are in LD with
the lead SNP rs10835638 (r2 = 0.59) [40]. The other significant signals from our original
GWAS [19] were not reproduced in any of the subtype association tests performed in this
study (Table 4).
Subtypes in PCOS families
The RF classifier yielded the lowest mean subtype misclassification rate (13.2%) compared to
the SVM (13.6%), GMM (17.0%), and QDA (18.1%) models, according to 10-fold cross-valida-
tion of the genotyped clustering cohort. Affected women from the family-based cohort were
classified accordingly using an RF model. Seventy-three daughters of the 83 affected women
from the family-based cohort had complete quantitative trait data available for subtype classifi-
cation. Seventeen (23.3%) were classified as having the reproductive subtype of PCOS, and 22
(30.1%) were classified as having the metabolic subtype. Of 14 subtyped sibling pairs, only 8
Fig 3. PCA plot of quantitative traits for genotyped PCOS clustering cohort. Genotyped PCOS cases are plotted on
the first 2 PCs of the adjusted quantitative trait data and colored according to their identified subtype. Subtype clusters
are shown as 95% concentration ellipses, assuming bivariate normal distributions. The relative magnitude and
direction of trait correlations with the PCs are shown with black arrows. BMI, body mass index; DHEAS,
dehydroepiandrosterone sulfate; FSH, follicle-stimulating hormone; Glu0, fasting glucose; Ins0, fasting insulin; LH,
luteinizing hormone; PC, principal component; PCA, principal component analysis; PCOS, polycystic ovary
syndrome; SHBG, sex hormone binding globulin; T, testosterone.
https://doi.org/10.1371/journal.pmed.1003132.g003
PLOS MEDICINE Phenotypic clustering reveals distinct subtypes of PCOS with novel genetic associations
PLOS Medicine | https://doi.org/10.1371/journal.pmed.1003132 June 23, 2020 10 / 28

Fig 4. Clustering of ungenotyped PCOS clustering cohort. (a) Hierarchical clustering of 263 ungenotyped PCOS
cases according to adjusted quantitative traits replicate reproductive (blue), metabolic (red), and unclassified (gray)
clusters. Heatmap colors correspond to trait z-scores. (b) PCA plot of ungenotyped PCOS cases replicate results from
genotyped cases. (a) Hierarchical clustering of 263 ungenotyped PCOS cases according to adjusted quantitative traits
replicate reproductive (blue), metabolic (red), and indeterminate (gray) clusters. Heatmap colors correspond to trait z-
scores. (b) PCA plot of ungenotyped PCOS cases replicate results from genotyped cases. BMI, body mass index;
DHEAS, dehydroepiandrosterone sulfate; FSH, follicle-stimulating hormone; Glu0, fasting glucose; Ins0, fasting
insulin; LH, luteinizing hormone; PC, principal component; PCA, principal component analysis; PCOS, polycystic
ovary syndrome; SHBG, sex hormone binding globulin; T, testosterone.
https://doi.org/10.1371/journal.pmed.1003132.g004
PLOS MEDICINE Phenotypic clustering reveals distinct subtypes of PCOS with novel genetic associations
PLOS Medicine | https://doi.org/10.1371/journal.pmed.1003132 June 23, 2020 11 / 28

were concordantly classified (57.1%); however, there was only one instance of the reproductive
subtype and metabolic subtype occurring within the same nuclear family because the remain-
ing discordant pairs each featured one indeterminate member. The proportion of affected
women with one or more of the previously identified [30] deleterious, rare variants in
DENND1A varied by subtype. Women classified as having the reproductive subtype of PCOS
were significantly more likely to carry one or more of the DENND1A rare variants compared
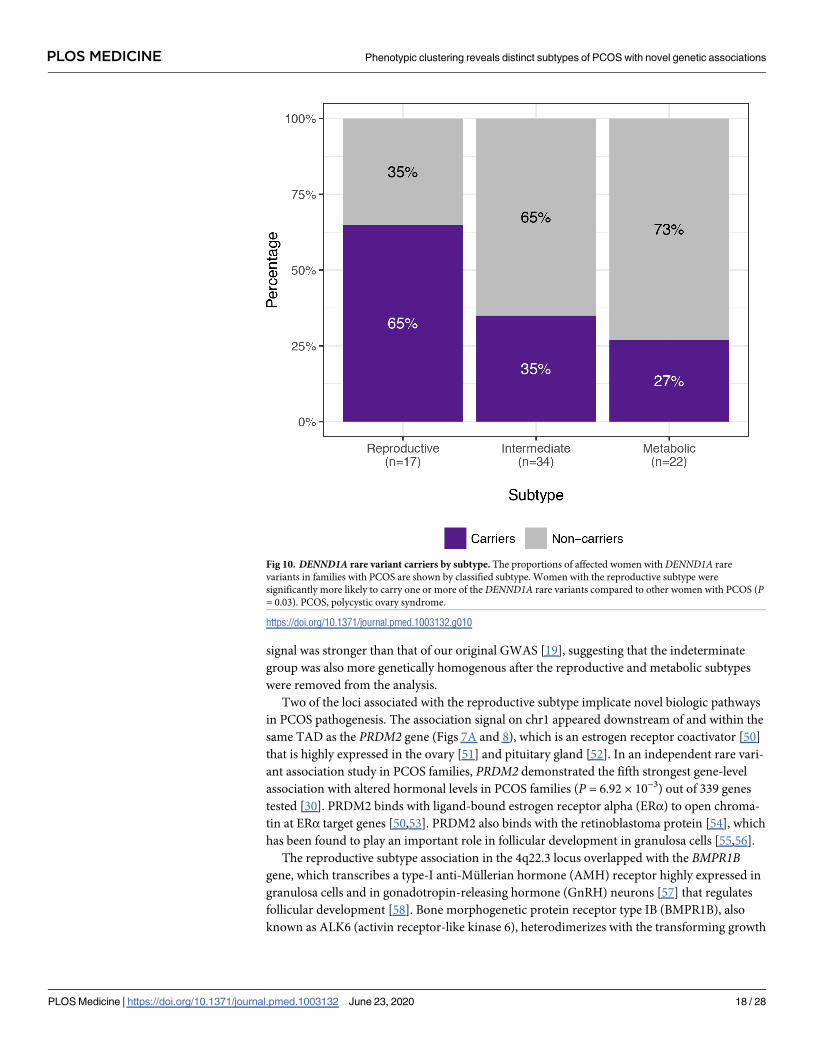
to other women with PCOS (P = 0.03; Fig 10). The distribution of affected women and
DENND1A rare variant carriers are shown relative to the adjusted quantitative trait PCs in
Fig 11.
Discussion
It is becoming increasingly clear that common, complex traits such as T2D are a heteroge-
neous collection of disease subtypes [8,25,48,49]. There is emerging evidence that these sub-
types have different genetic architecture [7,8,25]. Consistent with these concepts, we identified
reproductive and metabolic subtypes of PCOS by unsupervised hierarchical cluster analysis of
quantitative hormonal traits and BMI and found novel, to our knowledge, loci uniquely
Table 2. Demographic characteristics of GWAS subtypes and controls.
Reproductive Metabolic Indeterminate Controls
N 207 329 357 4,098
Age 28 28 28 40
(24–31) (25–32) (25–32) (30–53)
BMI 25.0 41.1 35.3 25.0
(22.1–28.0) (36.4–46.1) (30.9–39.5) (21.9–30.3)
Abbreviations: BMI, body mass index; GWAS, genome-wide association study; IQR, interquartile range; N, total number. Data for age and BMI are expressed as
median (25th–75th IQR).
https://doi.org/10.1371/journal.pmed.1003132.t002
Table 3. Genome-wide significant associations with PCOS subtypes.
Chr Mb Variant Gene(s) EA Stage 1 (Discovery) Stage 2 (Replication) Pmeta
EAF β OR 95% CI P Imp r2 EAF β OR 95% CI P Imp r2
1 14.7 rs78025940 PRDM2/KAZN A 0.02 3.02 4.75 2.82–7.98 2.16 × 10⁻¹⁰ 0.91 – – – – – – 2.23 × 10⁻¹⁰
2 237.4 rs76182733 IQCA1 G 0.01 3.79 5.68 3.00–
10.78
2.67 × 10⁻⁹ 0.84 – – – – – – 2.76 × 10⁻⁹
4 96.1 rs17023134 BMPR1B/
UNC5CG 0.05 1.62 3.02 2.06–4.42 1.40 × 10⁻⁸ 0.87 0.06 0.61 1.71 0.98–
2.99
7.81 × 10⁻² 0.83 9.71 × 10⁻⁹
5 24.7 rs7735176 CDH10 A 0.01 3.80 5.09 2.62–9.86 1.14 × 10⁻⁸ 0.93 – – – – – – 1.17 × 10⁻⁸
2 164.2 rs55762028 KCNH7/FIGN C 0.01 5.05 1.86 0.92–3.75 9.17 × 10⁻⁹ 0.96 – – – – – – 1.03 × 10⁻⁸
11 30.3 rs10835638 FSHB T 0.16 0.78 1.81 1.44–2.27 3.13 × 10⁻⁸ 0.98 0.17 0.77 2.01 1.49–
2.70
2.67 × 10⁻⁵ 0.97 4.94 × 10⁻¹²
Variant information and association statistics are shown for the most strongly associated SNP in each significant locus. Reproductive subtype loci are highlighted in
blue, metabolic loci in red, indeterminate loci in gray. Abbreviations: Chr, chromosome; CI, confidence interval; EA, effect allele; EAF, effect allele frequency in cases
and controls combined; Imp r2, imputation r2 for imputed SNPs; Mb, megabase position on chromosome; OR, odds ratio; P, stage-specific significance as assessed by
logistic regression; PCOS, polycystic ovary syndrome; Pmeta, significance as assessed by sample-size–weighted two-strata meta-analysis, adjusted for genomic inflation
factor; SNP, single nucleotide polymorphism; β, effect size from association regression. Cases and controls by stage: Stage 1 = 201 metabolic, 123 reproductive, 231
indeterminate, 2,964 controls; Stage 2 = 128 metabolic, 84 reproductive, 126 indeterminate, 1,134 controls. NOTE: Not all SNPs were genotyped or imputed in both
stages.
https://doi.org/10.1371/journal.pmed.1003132.t003
PLOS MEDICINE Phenotypic clustering reveals distinct subtypes of PCOS with novel genetic associations
PLOS Medicine | https://doi.org/10.1371/journal.pmed.1003132 June 23, 2020 12 / 28

associated with these subtypes with substantially larger effect sizes than those associated with
PCOS disease status in GWAS [19–23]. We also found that a significantly greater prevalence
of women classified with the reproductive subtype of PCOS carried at least one of the previ-
ously reported deleterious DENND1A rare variants [30] compared with those with other
PCOS subtypes. These findings suggest that these subtypes are both genetically distinct as well
as more etiologically homogenous [9]. Our findings are in contrast to the recent PCOS GWAS
meta-analysis [22] that found that only one of 14 loci was uniquely associated with the NIH
phenotype compared to non-NIH Rotterdam phenotypes. These latter findings suggest that
Fig 5. Genome-wide association results. Manhattan plots for (a) reproductive, (b) metabolic, and (c) indeterminate PCOS subtypes. The red horizontal line indicates
genome-wide significance (P� 1.67 × 10⁻⁸). Genome-wide significant loci are colored in green and labeled according to nearby gene(s). Quantile–quantile plots with
genomic inflation factor, λGC, are shown adjacent to corresponding Manhattan plots. PCOS, polycystic ovary syndrome.
https://doi.org/10.1371/journal.pmed.1003132.g005
PLOS MEDICINE Phenotypic clustering reveals distinct subtypes of PCOS with novel genetic associations
PLOS Medicine | https://doi.org/10.1371/journal.pmed.1003132 June 23, 2020 13 / 28

the NIH and Rotterdam diagnostic criteria do not identify biologically distinct subtypes of
PCOS. There have been previous efforts to subtype PCOS using unsupervised clustering [26–
29], but no subsequent investigation into the biologic relevance of the resulting subtypes using
genetic association analyses.
The key traits driving the subtypes were BMI, insulin, SHBG, glucose, LH, and FSH levels.
The reproductive subtype was characterized by higher LH and SHBG levels with lower BMI
and blood glucose and insulin levels. The metabolic subtype was characterized by higher BMI
and glucose and insulin levels with relatively low SHBG and LH levels. The remaining 40% of
cases had no distinguishable cluster-wide characteristics, and the mean trait values were
between those of the reproductive and metabolic subtypes. The relative trait distributions and
results of the PCAs (Figs 2, 3 and 4B) showed the reproductive and metabolic subtypes as col-
lections of subjects on opposite ends of a phenotypic spectrum with the remaining indetermi-
nate subjects scattered between the two. Bootstrapping and clustering in an independent
cohort revealed that the reproductive and metabolic subtypes were stable and reproducible.
Fig 6. Risk allele ORs in PCOS and PCOS subtypes. ORs with 95% CIs and association P-values from the Stage 1 discovery sample are shown for each subtype-
specific risk allele identified in this study relative to the corresponding values for the other subtypes and for PCOS disease status in general (includes all subtypes).
Some SNPs were not characterized in certain subtypes because of low allele counts or low imputation confidence. CI, confidence interval; OR, odds ratio; PCOS,
polycystic ovary syndrome; SNP, single nucleotide polymorphism.
https://doi.org/10.1371/journal.pmed.1003132.g006
PLOS MEDICINE Phenotypic clustering reveals distinct subtypes of PCOS with novel genetic associations
PLOS Medicine | https://doi.org/10.1371/journal.pmed.1003132 June 23, 2020 14 / 28

PLOS MEDICINE Phenotypic clustering reveals distinct subtypes of PCOS with novel genetic associations
PLOS Medicine | https://doi.org/10.1371/journal.pmed.1003132 June 23, 2020 15 / 28

When the GWAS was repeated, different susceptibility loci were associated with the reproduc-
tive and metabolic subtypes, suggesting that they had distinct genetic architecture. The inde-
terminate PCOS cases were associated with the reported locus at FSHB, but the association
Fig 7. Regional association plots of genome-wide significant loci. Regional plots of association (left y-axis) and recombination rates (right y-axis) for the
chromosomes (a) 1p36.21, (b) 2q37.3, (c) 4q22.3, (d) 5p14.2–p14.1, (e) 2p24.2–q24.3, and (f) 1p14.1 loci after imputation. The lead SNP in each locus is labeled and
marked in purple. All other SNPs are color coded according to the strength of LD with the top SNP (as measured by r2 in the European 1000 Genomes data). Imputed
SNPs are plotted as circles and genotyped SNPs as squares. LD, linkage disequilibrium; SNP, single nucleotide polymorphism.
https://doi.org/10.1371/journal.pmed.1003132.g007
Fig 8. Chromatin interaction map of PRDM2/KAZN locus. (A) Shown is the interaction frequency heatmap from chr1:13,300,000–16,200,000 in ovarian tissue.
The color of the heatmap indicates the level of normalized interaction frequencies with blue triangles indicating topological association domains. (B) One-to-all
interaction plots are shown for the lead SNP (rs78025940; shown in red) and lead genotyped SNP (rs16850259; shown in blue) as bait. Y-axes on the left and the
right measure bias-removed interaction frequency (red and blue bar graphs) and distance-normalized interaction frequency (magenta dots), respectively. (C) The
arc representation of significant interactions for distance-normalized interaction frequencies� 2 is displayed relative to the RefSeq-annotated genes in the locus.
chr, chromosome; SNP, single nucleotide polymorphism.
https://doi.org/10.1371/journal.pmed.1003132.g008
PLOS MEDICINE Phenotypic clustering reveals distinct subtypes of PCOS with novel genetic associations
PLOS Medicine | https://doi.org/10.1371/journal.pmed.1003132 June 23, 2020 16 / 28

Fig 9. Chromatin interaction map of KCHN7/FIGN locus. (A) Shown is the interaction frequency heatmap from chr2:162,660,000 to 165,860,000 in pancreatic
tissue. The color of the heatmap indicates the level of normalized interaction frequencies with blue triangles indicating topological association domains. (B) One-
to-all interaction plots are shown for the lead SNP (rs13401392; shown in blue) and second-leading SNP (rs1394240; shown in red) as bait. Y-axes on the left and
the right measure bias-removed interaction frequency (blue and red bar graphs) and distance-normalized interaction frequency (magenta dots), respectively. (C)
The arc representation of significant interactions for distance-normalized interaction frequencies� 2 is displayed relative to the RefSeq-annotated genes in the
locus. chr, chromosome; SNP, single nucleotide polymorphism.
https://doi.org/10.1371/journal.pmed.1003132.g009
Table 4. Previous GWAS association signals in PCOS subtypes.
Variant Locus PCOS Reproductive Metabolic Indeterminate
rs804279 GATA4/NEIL2 P = 8.0 × 10⁻¹⁰ P = 2.4 × 10⁻³ P = 9.9 × 10⁻² P = 3.1 × 10⁻³
rs10993397 C9orf3 P = 4.6 × 10⁻¹³ P = 2.3 × 10⁻⁴ P = 6.9 × 10⁻⁵ P = 1.1 × 10⁻⁵
rs11031006 FSHB P = 1.9 × 10⁻⁸ P = 8.8 × 10⁻⁶ P = 6.6 × 10⁻¹ P = 3.0 × 10⁻¹⁰
Subtype-specific association statistics are shown for each of the SNPs that were significantly associated with PCOS in Hayes and Urbanek and colleagues [19]. P =significance as assessed by sample-size–weighted two-strata meta-analysis, adjusted for genomic inflation. Abbreviations: GWAS, genome-wide association study;
PCOS, polycystic ovary syndrome.
https://doi.org/10.1371/journal.pmed.1003132.t004
PLOS MEDICINE Phenotypic clustering reveals distinct subtypes of PCOS with novel genetic associations
PLOS Medicine | https://doi.org/10.1371/journal.pmed.1003132 June 23, 2020 17 / 28
signal was stronger than that of our original GWAS [19], suggesting that the indeterminate
group was also more genetically homogenous after the reproductive and metabolic subtypes
were removed from the analysis.
Two of the loci associated with the reproductive subtype implicate novel biologic pathways
in PCOS pathogenesis. The association signal on chr1 appeared downstream of and within the
same TAD as the PRDM2 gene (Figs 7A and 8), which is an estrogen receptor coactivator [50]
that is highly expressed in the ovary [51] and pituitary gland [52]. In an independent rare vari-
ant association study in PCOS families, PRDM2 demonstrated the fifth strongest gene-level
association with altered hormonal levels in PCOS families (P = 6.92 × 10⁻³) out of 339 genes
tested [30]. PRDM2 binds with ligand-bound estrogen receptor alpha (ERα) to open chroma-
tin at ERα target genes [50,53]. PRDM2 also binds with the retinoblastoma protein [54], which
has been found to play an important role in follicular development in granulosa cells [55,56].
The reproductive subtype association in the 4q22.3 locus overlapped with the BMPR1Bgene, which transcribes a type-I anti-Mullerian hormone (AMH) receptor highly expressed in
granulosa cells and in gonadotropin-releasing hormone (GnRH) neurons [57] that regulates
follicular development [58]. Bone morphogenetic protein receptor type IB (BMPR1B), also
known as ALK6 (activin receptor-like kinase 6), heterodimerizes with the transforming growth
Fig 10. DENND1A rare variant carriers by subtype. The proportions of affected women with DENND1A rare
variants in families with PCOS are shown by classified subtype. Women with the reproductive subtype were
significantly more likely to carry one or more of the DENND1A rare variants compared to other women with PCOS (P= 0.03). PCOS, polycystic ovary syndrome.
https://doi.org/10.1371/journal.pmed.1003132.g010
PLOS MEDICINE Phenotypic clustering reveals distinct subtypes of PCOS with novel genetic associations
PLOS Medicine | https://doi.org/10.1371/journal.pmed.1003132 June 23, 2020 18 / 28

factor beta (TGF-β) type-II receptors, including AMH receptor type 2 (AMHR2), and binds
AMH and other BMP ligands to initialize TGF-β signaling via the Smad proteins 1, 5, and 8
[59]. BMPR1B has been found to mediate the AMH response in ovine granulosa cells [60], and
BMPR1B-deficient mice are infertile and suffer from a variety of functional defects in the
ovary [61,62]. One of the BMPR1B ligand genes, BMP6, had the third-strongest gene-level
association with altered hormonal levels (P = 4.00 × 10⁻³) out of 339 genes tested in our rare
variant association study in PCOS families [30]. Collectively, these results make BMPR1B a
compelling candidate gene in PCOS pathogenesis. These findings also support our sequencing
studies that have implicated pathogenic variants in the AMH signaling pathway in PCOS
[63,64].
The nature of the potential involvement in PCOS is less clear for the other loci associated
with the reproductive subtype. The 2q37.3 locus overlapped with the promoter region of the
IQCA1 gene. Its function in humans is not well characterized, but IQCA1 is highly expressed
in the pituitary gland [52]. The 5p14.2–p14.1 locus overlapped the promoter region of the
CDH10 gene. CDH10 is almost exclusively expressed in the brain [51] and is putatively
involved in synaptic adhesions, axon outgrowth, and guidance [65].
The lone significant association signal with the metabolic subtype was located in an inter-
genic region 200–280 kb downstream of the FIGN gene, 490–570 kb upstream of KCNH7.
KCNH7 encodes a voltage-gated potassium channel (subfamily H member 7, alias ERG3 [early
Fig 11. PCA of affected women in PCOS families showing DENND1A rare variant carriers. Affected women in
PCOS families are plotted on the first 2 PCs of the adjusted quantitative trait data and colored according to their
classified subtype. Markers outlined in bold represent DENND1A rare variant carriers. Subtype clusters are shown as
95% concentration ellipses, assuming bivariate normal distributions. The relative magnitude and direction of trait
correlations with the PCs are shown with black arrows. BMI, body mass index; DHEAS, dehydroepiandrosterone
sulfate; FSH, follicle-stimulating hormone; Glu0, fasting glucose; Ins0, fasting insulin; LH, luteinizing hormone; PC,
principal component; PCA, principal component analysis; PCOS, polycystic ovary syndrome; SHBG, sex hormone
binding globulin; T, testosterone.
https://doi.org/10.1371/journal.pmed.1003132.g011
PLOS MEDICINE Phenotypic clustering reveals distinct subtypes of PCOS with novel genetic associations
PLOS Medicine | https://doi.org/10.1371/journal.pmed.1003132 June 23, 2020 19 / 28

growth response protein 3]). KCNH7 is primarily expressed in the nervous system [66] but has
been found in murine islet cells [67,68]. FIGN encodes fidgetin, a microtubule-severing
enzyme most highly expressed in the pituitary gland and ovary [51]. A genetic variant in FIGNwas found to reduce the risk of congenital heart disease in Han Chinese by modulating trans-
membrane folate transport [69,70]. The TAD encompassing the association signal in this locus
includes FIGN and extends upstream to the GRB14 gene (Fig 8). GRB14 plays an important
role in insulin receptor signaling [71,72] and has been associated with T2D in GWAS [73].
Given the various metabolic associations for the genes in this chromosomal region, it is plausi-
ble that causal variants in this locus could impact a combination of these genes.
Despite evidence linking neighboring genes to PCOS pathways in each of the aforemen-
tioned loci, it remains possible, of course, that other, more distant genes in LD underlie the
association signals. Causal variants are often up to 2 Mb away from the associated SNP, not
necessarily in the closest gene [74]. Fine-mapping and functional studies are needed in order
to confirm the causal variants in each of these loci. In addition, the sample sizes for the subtype
GWAS were small, some of the associations were based only on imputed SNPs in Stage 1, and
a replication association study has not yet been performed. However, the aforementioned
functional evidence for several of the loci—particularly for PRDM2 and BMPR1B—support
the validity of their associations. Further, the fact that one of the genes associated with the
reproductive subtype, PRDM2, was associated with PCOS quantitative traits in our family-
based analysis [30] does represent a replication of this signal by an independent analytical
approach. Nevertheless, our genetic association results should be considered preliminary.
The effect sizes of the subtype alleles, particularly those associated with the reproductive
subtype (OR 3.02–5.68) (Table 3), were substantially greater than the effects (OR 0.70–1.51)
observed for alleles associated with PCOS diagnosis in previous GWAS [19–23]. In general,
there is an inverse relationship between allele frequency and effect size [1] because alleles with
larger phenotypic effects are subject to purifying selection and, therefore, occur less frequently
in the population [75,76]. Accordingly, in contrast to the common variants (effect allele fre-
quency [EAF] > 0.05) associated with PCOS in previous GWAS [19–23], the alleles associated
with the subtypes were all of low frequency (EAF 0.01–0.05; Table 3). However, given the lim-
ited cohort sizes in this study, the subtype association testing did not have adequate power to
detect associations with more modest effect sizes, such as those from our previous GWAS [19].
It is also possible that the large effect sizes were somewhat inflated by the so-called “winner’s
curse” [77,78], but they nonetheless suggest that the subtypes were more genetically homoge-
neous than PCOS diagnosis in general.
In applying a subtype classifier to our family-based cohort, we found 12 affected sibling
pairs in which at least one of the daughters was classified with the reproductive or metabolic
subtype. Six of these sibling pairs were classified with the same subtype. There was only one
discordant pairing of the reproductive subtype with the metabolic subtype. This further sug-
gests that the reproductive and metabolic subtypes are genetically distinct in their origins. The
greater prevalence of DENND1A rare variant carriers observed in women with the reproduc-
tive subtype in the family-based cohort implicates this gene in the pathogenesis of this subtype.
DENND1A is known to regulate androgen biosynthesis in the ovary [79,80]; therefore, we
would expect DENND1A-mediated PCOS to be more closely associated with the reproductive
subtype of PCOS. However, we did not find an association between any DENND1A alleles and
the reproductive subtype in the subtype GWAS, perhaps because of allelic heterogeneity or our
limited power to detect associations with more modest effect sizes.
We only studied women with PCOS as defined by the NIH diagnostic criteria. Future stud-
ies will investigate whether similar reproductive and metabolic clusters are present in non-
NIH Rotterdam PCOS cases. In particular, it is possible that there will be no metabolic subtype
PLOS MEDICINE Phenotypic clustering reveals distinct subtypes of PCOS with novel genetic associations
PLOS Medicine | https://doi.org/10.1371/journal.pmed.1003132 June 23, 2020 20 / 28

in non-NIH Rotterdam PCOS cases because these phenotypes have minimal metabolic risk
[81,82]. Indeed, in a previous effort to identify phenotypic subtypes in Rotterdam PCOS cases
[29], the cluster that most closely resembled the reproductive subtype represented the largest
proportion of PCOS women at 44%, of whom only 78% met the NIH criteria for PCOS,
whereas the cluster that most closely resembled the metabolic subtype constituted only 12% of
the total sample, but 98% met the NIH diagnostic criteria. Furthermore, trait distributions
may vary among women with PCOS from different geographic locations, such as in some of
the sites excluded from our analysis because of incomplete quantitative trait data. For example,
European PCOS cases have a lower prevalence of obesity compared to US PCOS cases [83].
Because of the within-cohort normalization of quantitative traits prior to clustering, our
method is well-suited for identifying subsets of cases within populations, but therefore, it may
not be suitable for directly comparing subtype membership between populations.
Our clustering cohorts included only US-based women of European ancestry. It will be of
considerable importance to investigate whether subtypes are present in women with PCOS of
other ancestries and geographic regions. Women with PCOS of diverse races and ethnicities
have similar reproductive and metabolic features [84–86]. However, there are differences in
the severity of the metabolic defects due to differences in the prevalence of obesity [83], as well
as to racial/ethnic differences in insulin sensitivity [87,88]. Furthermore, the susceptibility loci
associated with subtypes in other ancestry groups may differ because the low frequency and
large effect size of the variants associated with the reproductive subtype in our European
cohort suggests these variants are of relatively recent origin and therefore may be population-
specific [1,89,90].
While the bootstrapping and clustering in an independent cohort demonstrated that the
subtypes were reproducible, the Jaccard scores were relatively modest, with only the reproduc-
tive subtype yielding a mean Jaccard coefficient �gC > 0.6. At least part of this outcome was
likely due to the fact that all traits were fitted to a normal distribution using an inverse normal
transformation prior to clustering. This transformation was done in order to prevent outliers
from dictating cluster formations but also likely resulted in greater cluster overlap. Conse-
quently, the metabolic and reproductive clusters we identified appear to represent opposite
ends of a phenotypic spectrum with imperfect delineation. This spectrum, however, aligns
with the known pathophysiology of PCOS and is bolstered by our genetic association findings.
Our approach, therefore, appears to be a more reliable way of identifying subgroups of PCOS
cases who have been noted in the literature [91] but have previously been defined using only a
single trait like BMI [92–95] or by diagnostic criteria that do not reflect the genetic heterogene-
ity of the disorder [22]. Perhaps future studies that use clustering to identify reproductive and
metabolic subtypes in PCOS can omit nondistinguishing traits such as DHEAS and T in an
effort to reduce noise and improve subtype delineation and reproducibility.
Our study provides support for the hypothesis that PCOS is in fact a heterogeneous disor-
der with different underlying biological mechanisms. As a consequence, grouping women
with PCOS under a single diagnosis may be counterproductive because distinct disease sub-
types will likely benefit from different interventions.
In conclusion, using an unsupervised clustering approach featuring quantitative hormonal
and anthropometric data, we identified reproductive and metabolic subtypes of PCOS that
appeared to have distinct genetic architecture. The genomic loci that were significantly associ-
ated with either of these subtypes include a number of new, to our knowledge, highly plausible
PCOS candidate genes. Moreover, our results demonstrate that precise phenotypic delinea-
tion, resulting in more homogeneous subsets of affected individuals, can be more powerful
and informative than increases in sample size for genetic association studies. Our findings
PLOS MEDICINE Phenotypic clustering reveals distinct subtypes of PCOS with novel genetic associations
PLOS Medicine | https://doi.org/10.1371/journal.pmed.1003132 June 23, 2020 21 / 28

indicate that further study into the genetic heterogeneity of PCOS is warranted and could lead
to a transformation in the way PCOS is classified, studied, and treated.
Supporting information
S1 Checklist. STREGA checklist.
(DOCX)
S1 Table. GWAS cohorts used in cluster analysis. The cohorts from the Hayes, Urbanek, and
colleagues PCOS GWAS and corresponding numbers of samples that were included in the
clustering analysis are shown by GWAS cohort, adapted from Hayes, Urbanek, and colleagues.
[19]: Table 1 and Supplemental Data Tables 9 and 10. GWAS, genome-wide association study;
PCOS, polycystic ovary syndrome.
(DOCX)
S2 Table. Age and BMI distributions for subjects excluded from cluster analysis. Median
age and BMI values are shown with the 25th and 75th percentiles for the subjects included in
the cluster analysis and for those from the same GWAS cohorts who were excluded because of
missing quantitative trait data. Distributions were compared using unpaired Wilcoxon rank–
sum tests. P-values are unadjusted. BMI, body mass index; GWAS, genome-wide association
study.
(XLSX)
S3 Table. Assays used to measure quantitative traits. Assays used to measure quantitative
trait levels are listed by trait, then by site and methodology combination. Unless otherwise
noted, kits were used per the manufacturer’s instructions. �Calibrated to WHO 1st Interna-
tional Standard #95/560. aDiagnostic Products Corporation (DPC) (Los Angeles, CA, USA)
[Note: In April 2006, DPC was acquired by Siemens Medical Solutions USA, Inc. (Malvern,
PA, USA)]. bDiagnostic Systems Laboratories, Inc. (DSL) (Webster, TX, USA) [Note: In Octo-
ber 2005, DSL was acquired by Beckman Coulter (Brea, CA, USA)]. cSiemens Medical Solu-
tions USA, Inc. (Malvern, PA, USA). dBeckman Coulter, Inc. (Brea, CA, USA) [Note: In June
2011, Beckman Coulter was acquired by Danaher Corporation (Washington, DC, USA)].eAnalox Instruments Ltd. (London, UK). fLinco Research, Inc. (St. Charles, MO, USA).gAmerican Laboratory Products Company (ALPCO) (Salem, NH, USA). BWH, Brigham and
Women’s Hospital; DHEAS, dehydroepiandrosterone sulfate; ELISA, enzyme-linked immu-
nosorbent assay; FSH, follicle-stimulating hormone; GO, Glucose; G0, fasting glucose; HMC,
Pennsylvania State Milton S. Hershey Medical Center; IRMA, immunoradiometric assay; I0,
fasting insulin; LH, luteinizing hormone; NU, Northwestern University; RIA, radioimmunoas-
say; SHBG, sex hormone binding globulin; T, testosterone; UVA, University of Virginia.
(XLSX)
S4 Table. Quantitative traits in genotyped PCOS cohort by cluster. Median trait values are
shown with 25th and 75th percentiles for each clustering subtype. Details for each assay
method are provided in S3 Table. BMI, body mass index; DHEAS, dehydroepiandrosterone
sulfate; FSH, follicle-stimulating hormone; G0, fasting glucose; I0, fasting insulin; LH, luteiniz-
ing hormone; N, total number; PCOS, polycystic ovary syndrome; SHBG, sex hormone-bind-
ing globulin; T, testosterone.
(XLSX)
S5 Table. Subtypes of Stage 1 GWAS samples. Subtypes are provided for each of the 555
Stage 1 GWAS samples included in the clustering analysis according to their dbGaP SUBJIDs.
dbGaP, database of Genotypes and Phenotypes; GWAS, genome-wide association study;
PLOS MEDICINE Phenotypic clustering reveals distinct subtypes of PCOS with novel genetic associations
PLOS Medicine | https://doi.org/10.1371/journal.pmed.1003132 June 23, 2020 22 / 28

SUBJID, subject ID.
(TXT)
Acknowledgments
We thank the NIH Cooperative Multicenter Reproductive Medicine Network (https://www.
nichd.nih.gov/research/supported/rmn) for recruiting some of the women with PCOS who
participated who participated in the GWAS of Hayes and Urbanek and colleagues [19] and
whose genotype data were used in this study. We also thank the following investigators for
recruiting some of the control women who participated in the GWAS of Hayes and Urbanek
and colleagues [19] and whose genotype data were used in this study: Dimitrios Panidis, MD,
PHD (Aristotle University of Thessaloniki, Greece); Mark O. Goodarzi (Cedars-Sinai Medical
Center, Los Angeles, CA, USA); Corrine K. Welt, MD (University of Utah School of Medicine,
Salt Lake City, UT, USA; formerly of Massachusetts General Hospital, Boston, MA, USA);
Ahmed H. Kissebah (deceased, Medical College of Wisconsin, Milwaukee, WI, USA); Ricardo
Azziz, MD (State University of New York, NY, USA; formerly of University of Alabama at Bir-
mingham, AL, USA); and Evanthia Diamanti-Kandarakis, MD, PhD (University of Athens
Medical School, Greece).
Author Contributions
Conceptualization: Matthew Dapas, M. Geoffrey Hayes, Andrea Dunaif.
Data curation: Matthew Dapas, Frederick T. J. Lin, Ryan Sisk.
Formal analysis: Matthew Dapas, Frederick T. J. Lin, Ryan Sisk.
Funding acquisition: Andrea Dunaif.
Investigation: Matthew Dapas, Richard S. Legro.
Methodology: Matthew Dapas, Girish N. Nadkarni.
Project administration: Ryan Sisk, Andrea Dunaif.
Resources: Richard S. Legro.
Software: Matthew Dapas.
Supervision: Margrit Urbanek, M. Geoffrey Hayes, Andrea Dunaif.
Validation: Matthew Dapas.
Visualization: Matthew Dapas.
Writing – original draft: Matthew Dapas.
Writing – review & editing: Matthew Dapas, Girish N. Nadkarni, Margrit Urbanek, M. Geof-
frey Hayes, Andrea Dunaif.
References1. Manolio TA, Collins FS, Cox NJ, Goldstein DB, Hindorff LA, Hunter DJ, et al. Finding the missing herita-
bility of complex diseases. Nature. 2009; 461(7265): 747–53. https://doi.org/10.1038/nature08494
PMID: 19812666
2. Boyle EA, Li YI, Pritchard JK. An expanded view of complex traits: From polygenic to omnigenic. Cell.
2017; 169(7): 1177–86. https://doi.org/10.1016/j.cell.2017.05.038 PMID: 28622505
PLOS MEDICINE Phenotypic clustering reveals distinct subtypes of PCOS with novel genetic associations
PLOS Medicine | https://doi.org/10.1371/journal.pmed.1003132 June 23, 2020 23 / 28

3. Wray NR, Wijmenga C, Sullivan PF, Yang J, Visscher PM. Common Disease Is More Complex Than
Implied by the Core Gene Omnigenic Model. Cell. 2018; 173(7): 1573–80. https://doi.org/10.1016/j.cell.
2018.05.051 PMID: 29906445
4. Ringman JM, Goate A, Masters CL, Cairns NJ, Danek A, Graff-Radford N, et al. Genetic heterogeneity
in Alzheimer disease and implications for treatment strategies. Curr Neurol Neurosci Rep. 2014; 14(11):
499. https://doi.org/10.1007/s11910-014-0499-8 PMID: 25217249
5. Flint J, Kendler KS. The genetics of major depression. Neuron. 2014; 81(3): 484–503. https://doi.org/
10.1016/j.neuron.2014.01.027 PMID: 24507187
6. von Coelln R, Shulman LM. Clinical subtypes and genetic heterogeneity: of lumping and splitting in Par-
kinson disease. Curr Opin Neurol. 2016; 29(6): 727–34. https://doi.org/10.1097/WCO.
0000000000000384 PMID: 27749396
7. Udler MS, Kim J, von Grotthuss M, Bonas-Guarch S, Cole JB, Chiou J, et al. Type 2 diabetes genetic
loci informed by multi-trait associations point to disease mechanisms and subtypes: A soft clustering
analysis. PLoS Med. 2018; 15(9): e1002654. https://doi.org/10.1371/journal.pmed.1002654 PMID:
30240442
8. Ahlqvist E, Storm P, Karajamaki A, Martinell M, Dorkhan M, Carlsson A, et al. Novel subgroups of adult-
onset diabetes and their association with outcomes: a data-driven cluster analysis of six variables. Lan-
cet Diabetes Endocrinol. 2018; 6(5): 361–9. https://doi.org/10.1016/S2213-8587(18)30051-2 PMID:
29503172
9. Saria S, Goldenberg A. Subtyping: What it is and its role in precision medicine. IEEE Intelligent Sys-
tems. 2015; 30(4): 70–5.
10. Diamanti-Kandarakis E, Dunaif A. Insulin resistance and the polycystic ovary syndrome revisited: an
update on mechanisms and implications. Endocr Rev. 2012; 33(6): 981–1030. https://doi.org/10.1210/
er.2011-1034 PMID: 23065822
11. Dumesic DA, Oberfield SE, Stener-Victorin E, Marshall JC, Laven JS, Legro RS. Scientific Statement
on the Diagnostic Criteria, Epidemiology, Pathophysiology, and Molecular Genetics of Polycystic Ovary
Syndrome. Endocr Rev. 2015; 36(5): 487–525. https://doi.org/10.1210/er.2015-1018 PMID: 26426951
12. Witchel SF, Oberfield SE, Pena AS. Polycystic Ovary Syndrome: Pathophysiology, Presentation, and
Treatment With Emphasis on Adolescent Girls. J Endocr Soc. 2019; 3(8): 1545–73. https://doi.org/10.
1210/js.2019-00078 PMID: 31384717
13. Sanchez-Garrido MA, Tena-Sempere M. Metabolic dysfunction in polycystic ovary syndrome: Patho-
genic role of androgen excess and potential therapeutic strategies. Mol Metab. 2020; 35: 100937.
https://doi.org/10.1016/j.molmet.2020.01.001 PMID: 32244180
14. Rubin KH, Glintborg D, Nybo M, Abrahamsen B, Andersen M. Development and risk factors of type 2
diabetes in a nationwide population of women with polycystic ovary syndrome. J Clin Endocrinol Metab.
2017; 102(10): 3848–57. https://doi.org/10.1210/jc.2017-01354 PMID: 28938447
15. Dunaif A. Perspectives in polycystic ovary syndrome: From hair to eternity. J Clin Endocrinol Metab.
2016; 101(3): 759–68. https://doi.org/10.1210/jc.2015-3780 PMID: 26908109
16. Zawadski JKD A. Diagnostic criteria for polycystic ovary syndrome; towards a rational approach. In:
Dunaif A, Givens JR, Haseltine FP, Merriam GR, editors. Polycystic Ovary Syndrome. Boston, Massa-
chusetts: Blackwell Scientific; 1992. pp. 377–84.
17. Rotterdam EA-SPcwg. Revised 2003 consensus on diagnostic criteria and long-term health risks
related to polycystic ovary syndrome (PCOS). Hum Reprod. 2004; 19(1): 41–7. https://doi.org/10.1093/
humrep/deh098 PMID: 14688154
18. Rotterdam EA-SPCWG. Revised 2003 consensus on diagnostic criteria and long-term health risks
related to polycystic ovary syndrome. Fertil Steril. 2004; 81(1): 19–25. https://doi.org/10.1016/j.
fertnstert.2003.10.004 PMID: 14711538
19. Hayes MG, Urbanek M, Ehrmann DA, Armstrong LL, Lee JY, Sisk R, et al. Genome-wide association of
polycystic ovary syndrome implicates alterations in gonadotropin secretion in European ancestry popu-
lations. Nat Commun. 2015; 6: 7502. https://doi.org/10.1038/ncomms8502 PMID: 26284813
20. Chen ZJ, Zhao H, He L, Shi Y, Qin Y, Shi Y, et al. Genome-wide association study identifies susceptibil-
ity loci for polycystic ovary syndrome on chromosome 2p16.3, 2p21 and 9q33.3. Nat Genet. 2011; 43
(1): 55–9. https://doi.org/10.1038/ng.732 PMID: 21151128
21. Shi Y, Zhao H, Shi Y, Cao Y, Yang D, Li Z, et al. Genome-wide association study identifies eight new
risk loci for polycystic ovary syndrome. Nat Genet. 2012; 44(9): 1020–5. https://doi.org/10.1038/ng.
2384 PMID: 22885925
22. Day F, Karaderi T, Jones MR, Meun C, He C, Drong A, et al. Large-scale genome-wide meta-analysis
of polycystic ovary syndrome suggests shared genetic architecture for different diagnosis criteria. PLoS
Genet. 2018; 14(12): e1007813. https://doi.org/10.1371/journal.pgen.1007813 PMID: 30566500
PLOS MEDICINE Phenotypic clustering reveals distinct subtypes of PCOS with novel genetic associations
PLOS Medicine | https://doi.org/10.1371/journal.pmed.1003132 June 23, 2020 24 / 28

23. Day FR, Hinds DA, Tung JY, Stolk L, Styrkarsdottir U, Saxena R, et al. Causal mechanisms and balanc-
ing selection inferred from genetic associations with polycystic ovary syndrome. Nat Commun. 2015; 6:
8464. https://doi.org/10.1038/ncomms9464 PMID: 26416764
24. Castaldi PJ, Dy J, Ross J, Chang Y, Washko GR, Curran-Everett D, et al. Cluster analysis in the COPD-
Gene study identifies subtypes of smokers with distinct patterns of airway disease and emphysema.
Thorax. 2014; 69(5): 415–22. https://doi.org/10.1136/thoraxjnl-2013-203601 PMID: 24563194
25. Li L, Cheng WY, Glicksberg BS, Gottesman O, Tamler R, Chen R, et al. Identification of type 2 diabetes
subgroups through topological analysis of patient similarity. Sci Transl Med. 2015; 7(311): 311ra174.
https://doi.org/10.1126/scitranslmed.aaa9364 PMID: 26511511
26. Tzeng CR, Chang YC, Chang YC, Wang CW, Chen CH, Hsu MI. Cluster analysis of cardiovascular and
metabolic risk factors in women of reproductive age. Fertil Steril. 2014; 101(5): 1404–10. https://doi.org/
10.1016/j.fertnstert.2014.01.023 PMID: 24534286
27. Dewailly D, Alebic MS, Duhamel A, Stojanovic N. Using cluster analysis to identify a homogeneous sub-
population of women with polycystic ovarian morphology in a population of non-hyperandrogenic
women with regular menstrual cycles. Hum Reprod. 2014; 29(11): 2536–43. https://doi.org/10.1093/
humrep/deu242 PMID: 25267785
28. Daan NM, Koster MP, de Wilde MA, Dalmeijer GW, Evelein AM, Fauser BC, et al. Biomarker profiles in
women with PCOS and PCOS offspring; A pilot study. PLoS ONE. 2016; 11(11): e0165033. https://doi.
org/10.1371/journal.pone.0165033 PMID: 27806063
29. Huang CC, Tien YJ, Chen MJ, Chen CH, Ho HN, Yang YS. Symptom patterns and phenotypic sub-
grouping of women with polycystic ovary syndrome: association between endocrine characteristics and
metabolic aberrations. Hum Reprod. 2015; 30(4): 937–46. https://doi.org/10.1093/humrep/dev010
PMID: 25662806
30. Dapas M, Sisk R, Legro RS, Urbanek M, Dunaif A, Hayes MG. Family-based quantitative trait meta-
analysis implicates rare noncoding variants in DENND1A in polycystic ovary syndrome. J Clin Endocri-
nol Metab. 2019. Forthcoming 2020. https://doi.org/10.1210/jc.2018-02496 PMID: 31038695
31. Legro RS, Driscoll D, Strauss JF 3rd, Fox J, Dunaif A. Evidence for a genetic basis for hyperandrogen-
emia in polycystic ovary syndrome. Proc Natl Acad Sci U S A. 1998; 95(25): 14956–60. https://doi.org/
10.1073/pnas.95.25.14956 PMID: 9843997
32. Legro RS, Brzyski RG, Diamond MP, Coutifaris C, Schlaff WD, Casson P, et al. Letrozole versus clomi-
phene for infertility in the polycystic ovary syndrome. N Engl J Med. 2014; 371(2): 119–29. https://doi.
org/10.1056/NEJMoa1313517 PMID: 25006718
33. McCarty CA, Chisholm RL, Chute CG, Kullo IJ, Jarvik GP, Larson EB, et al. The eMERGE Network: a
consortium of biorepositories linked to electronic medical records data for conducting genomic studies.
BMC Med Genomics. 2011; 4: 13. https://doi.org/10.1186/1755-8794-4-13 PMID: 21269473
34. Murtagh F, Legendre P. Ward’s Hierarchical Agglomerative Clustering Method: Which Algorithms
Implement Ward’s Criterion? J Classif. 2014; 31(3): 274–95.
35. Strauss T, von Maltitz MJ. Generalising Ward’s Method for Use with Manhattan Distances. PLoS ONE.
2017; 12(1): e0168288. https://doi.org/10.1371/journal.pone.0168288 PMID: 28085891
36. Hennig C. Cluster-wise assessment of cluster stability. Comput Stat Data An. 2007; 52(1): 258–71.
37. Voight BF, Kang HM, Ding J, Palmer CD, Sidore C, Chines PS, et al. The metabochip, a custom geno-
typing array for genetic studies of metabolic, cardiovascular, and anthropometric traits. PLoS Genet.
2012; 8(8): e1002793. https://doi.org/10.1371/journal.pgen.1002793 PMID: 22876189
38. Price AL, Patterson NJ, Plenge RM, Weinblatt ME, Shadick NA, Reich D. Principal components analy-
sis corrects for stratification in genome-wide association studies. Nat Genet. 2006; 38(8): 904–9.
https://doi.org/10.1038/ng1847 PMID: 16862161
39. O’Connell J, Gurdasani D, Delaneau O, Pirastu N, Ulivi S, Cocca M, et al. A general approach for haplo-
type phasing across the full spectrum of relatedness. PLoS Genet. 2014; 10(4): e1004234. https://doi.
org/10.1371/journal.pgen.1004234 PMID: 24743097
40. Genomes Project C, Auton A, Brooks LD, Durbin RM, Garrison EP, Kang HM, et al. A global reference
for human genetic variation. Nature. 2015; 526(7571): 68–74. https://doi.org/10.1038/nature15393
PMID: 26432245
41. Das S, Forer L, Schonherr S, Sidore C, Locke AE, Kwong A, et al. Next-generation genotype imputation
service and methods. Nat Genet. 2016; 48(10): 1284–7. https://doi.org/10.1038/ng.3656 PMID:
27571263
42. Iglesias AI, van der Lee SJ, Bonnemaijer PWM, Hohn R, Nag A, Gharahkhani P, et al. Haplotype refer-
ence consortium panel: Practical implications of imputations with large reference panels. Hum Mutat.
2017; 38(8): 1025–32. https://doi.org/10.1002/humu.23247 PMID: 28493391
PLOS MEDICINE Phenotypic clustering reveals distinct subtypes of PCOS with novel genetic associations
PLOS Medicine | https://doi.org/10.1371/journal.pmed.1003132 June 23, 2020 25 / 28

43. Marchini J, Howie B, Myers S, McVean G, Donnelly P. A new multipoint method for genome-wide asso-
ciation studies by imputation of genotypes. Nat Genet. 2007; 39(7): 906–13. https://doi.org/10.1038/
ng2088 PMID: 17572673
44. Willer CJ, Li Y, Abecasis GR. METAL: Fast and efficient meta-analysis of genomewide association
scans. Bioinformatics. 2010; 26(17): 2190–1. https://doi.org/10.1093/bioinformatics/btq340 PMID:
20616382
45. Yang D, Jang I, Choi J, Kim MS, Lee AJ, Kim H, et al. 3DIV: A 3D-genome Interaction Viewer and data-
base. Nucleic Acids Res. 2018; 46(D1): D52–D7. https://doi.org/10.1093/nar/gkx1017 PMID: 29106613
46. Shin H, Shi Y, Dai C, Tjong H, Gong K, Alber F, et al. TopDom: an efficient and deterministic method for
identifying topological domains in genomes. Nucleic Acids Res. 2016; 44(7): e70. https://doi.org/10.
1093/nar/gkv1505 PMID: 26704975
47. Venables WN, Ripley BD. Modern Applied Statistics with S. 4th ed. Hardle WK, editor. New York:
Springer-Verlag; 2002.
48. Tuomi T, Santoro N, Caprio S, Cai M, Weng J, Groop L. The many faces of diabetes: a disease with
increasing heterogeneity. Lancet. 2014; 383(9922): 1084–94. https://doi.org/10.1016/S0140-6736(13)
62219-9 PMID: 24315621
49. Skyler JS, Bakris GL, Bonifacio E, Darsow T, Eckel RH, Groop L, et al. Differentiation of diabetes by
pathophysiology, natural history, and prognosis. Diabetes. 2017; 66(2): 241–55. https://doi.org/10.
2337/db16-0806 PMID: 27980006
50. Di Zazzo E, De Rosa C, Abbondanza C, Moncharmont B. PRDM proteins: Molecular mechanisms in
signal transduction and transcriptional regulation. Biology (Basel). 2013; 2(1): 107–41. https://doi.org/
10.3390/biology2010107 PMID: 24832654
51. Consortium GT. The Genotype-Tissue Expression (GTEx) project. Nat Genet. 2013; 45(6): 580–5.
https://doi.org/10.1038/ng.2653 PMID: 23715323
52. Consortium F, the RP, Clst, Forrest AR, Kawaji H, Rehli M, et al. A promoter-level mammalian expres-
sion atlas. Nature. 2014; 507(7493): 462–70. https://doi.org/10.1038/nature13182 PMID: 24670764
53. Carling T, Kim KC, Yang XH, Gu J, Zhang XK, Huang S. A histone methyltransferase is required for
maximal response to female sex hormones. Mol Cell Biol. 2004; 24(16): 7032–42. https://doi.org/10.
1128/MCB.24.16.7032-7042.2004 PMID: 15282304
54. Liu L, Shao G, Steele-Perkins G, Huang S. The retinoblastoma interacting zinc finger gene RIZ pro-
duces a PR domain-lacking product through an internal promoter. J Biol Chem. 1997; 272(5): 2984–91.
https://doi.org/10.1074/jbc.272.5.2984 PMID: 9006946
55. Andreu-Vieyra C, Chen R, Matzuk MM. Conditional deletion of the retinoblastoma (Rb) gene in ovarian
granulosa cells leads to premature ovarian failure. Mol Endocrinol. 2008; 22(9): 2141–61. https://doi.
org/10.1210/me.2008-0033 PMID: 18599617
56. Yang QE, Nagaoka SI, Gwost I, Hunt PA, Oatley JM. Inactivation of Retinoblastoma Protein (Rb1) in
the Oocyte: Evidence That Dysregulated Follicle Growth Drives Ovarian Teratoma Formation in Mice.
PLoS Genet. 2015; 11(7): e1005355. https://doi.org/10.1371/journal.pgen.1005355 PMID: 26176933
57. Cimino I, Casoni F, Liu X, Messina A, Parkash J, Jamin SP, et al. Novel role for anti-Mullerian hormone
in the regulation of GnRH neuron excitability and hormone secretion. Nat Commun. 2016; 7: 10055.
https://doi.org/10.1038/ncomms10055 PMID: 26753790
58. Reader KL, Haydon LJ, Littlejohn RP, Juengel JL, McNatty KP. Booroola BMPR1B mutation alters early
follicular development and oocyte ultrastructure in sheep. Reprod Fertil Dev. 2012; 24(2): 353–61.
https://doi.org/10.1071/RD11095 PMID: 22281082
59. Shimasaki S, Moore RK, Otsuka F, Erickson GF. The bone morphogenetic protein system in mamma-
lian reproduction. Endocr Rev. 2004; 25(1): 72–101. https://doi.org/10.1210/er.2003-0007 PMID:
14769828
60. Estienne A, Pierre A, di Clemente N, Picard JY, Jarrier P, Mansanet C, et al. Anti-Mullerian hormone
regulation by the bone morphogenetic proteins in the sheep ovary: deciphering a direct regulatory path-
way. Endocrinology. 2015; 156(1): 301–13. https://doi.org/10.1210/en.2014-1551 PMID: 25322464
61. Yi SE, LaPolt PS, Yoon BS, Chen JY, Lu JK, Lyons KM. The type I BMP receptor BmprIB is essential
for female reproductive function. Proc Natl Acad Sci U S A. 2001; 98(14): 7994–9. https://doi.org/10.
1073/pnas.141002798 PMID: 11416163
62. Sugiura K, Su YQ, Eppig JJ. Does bone morphogenetic protein 6 (BMP6) affect female fertility in the
mouse? Biol Reprod. 2010; 83(6): 997–1004. https://doi.org/10.1095/biolreprod.110.086777 PMID:
20702851
63. Gorsic LK, Kosova G, Werstein B, Sisk R, Legro RS, Hayes MG, et al. Pathogenic anti-Mullerian hor-
mone variants in polycystic ovary syndrome. J Clin Endocrinol Metab. 2017; 102(8): 2862–72. https://
doi.org/10.1210/jc.2017-00612 PMID: 28505284
PLOS MEDICINE Phenotypic clustering reveals distinct subtypes of PCOS with novel genetic associations
PLOS Medicine | https://doi.org/10.1371/journal.pmed.1003132 June 23, 2020 26 / 28

64. Gorsic LK, Dapas M, Legro RS, Hayes MG, Urbanek M. Functional Genetic Variation in the Anti-Mulle-
rian Hormone Pathway in Women With Polycystic Ovary Syndrome. J Clin Endocrinol Metab. 2019;
104(7): 2855–74. https://doi.org/10.1210/jc.2018-02178 PMID: 30786001
65. Pruitt KD, Tatusova T, Maglott DR. NCBI Reference Sequence (RefSeq): a curated non-redundant
sequence database of genomes, transcripts and proteins. Nucleic Acids Res. 2005; 33(Database
issue): D501–4. https://doi.org/10.1093/nar/gki025 PMID: 15608248
66. Shi W, Wymore RS, Wang HS, Pan Z, Cohen IS, McKinnon D, et al. Identification of two nervous sys-
tem-specific members of the erg potassium channel gene family. J Neurosci. 1997; 17(24): 9423–32.
https://doi.org/10.1523/JNEUROSCI.17-24-09423.1997 PMID: 9390998
67. Hardy AB, Fox JE, Giglou PR, Wijesekara N, Bhattacharjee A, Sultan S, et al. Characterization of Erg K
+ channels in alpha- and beta-cells of mouse and human islets. J Biol Chem. 2009; 284(44): 30441–52.
https://doi.org/10.1074/jbc.M109.040659 PMID: 19690348
68. Muhlbauer E, Bazwinsky I, Wolgast S, Klemenz A, Peschke E. Circadian changes of ether-a-go-go-
related-gene (Erg) potassium channel transcripts in the rat pancreas and beta-cell. Cell Mol Life Sci.
2007; 64(6): 768–80. https://doi.org/10.1007/s00018-007-6478-3 PMID: 17322986
69. Wang D, Chu M, Wang F, Zhou A, Ruan M, Chen Y. A Genetic Variant in FIGN Gene Reduces the Risk
of Congenital Heart Disease in Han Chinese Populations. Pediatr Cardiol. 2017; 38(6): 1169–74.
https://doi.org/10.1007/s00246-017-1636-3 PMID: 28534241
70. Wang D, Wang F, Shi KH, Tao H, Li Y, Zhao R, et al. Lower Circulating Folate Induced by a Fidgetin
Intronic Variant Is Associated With Reduced Congenital Heart Disease Susceptibility. Circulation. 2017;
135(18): 1733–48. https://doi.org/10.1161/CIRCULATIONAHA.116.025164 PMID: 28302752
71. Desbuquois B, Carre N, Burnol AF. Regulation of insulin and type 1 insulin-like growth factor signaling
and action by the Grb10/14 and SH2B1/B2 adaptor proteins. FEBS J. 2013; 280(3): 794–816. https://
doi.org/10.1111/febs.12080 PMID: 23190452
72. Kasus-Jacobi A, Perdereau D, Auzan C, Clauser E, Van Obberghen E, Mauvais-Jarvis F, et al. Identifi-
cation of the rat adapter Grb14 as an inhibitor of insulin actions. J Biol Chem. 1998; 273(40): 26026–35.
https://doi.org/10.1074/jbc.273.40.26026 PMID: 9748281
73. Zhao W, Rasheed A, Tikkanen E, Lee JJ, Butterworth AS, Howson JMM, et al. Identification of new sus-
ceptibility loci for type 2 diabetes and shared etiological pathways with coronary heart disease. Nat
Genet. 2017; 49(10): 1450–7. https://doi.org/10.1038/ng.3943 PMID: 28869590
74. Brodie A, Azaria JR, Ofran Y. How far from the SNP may the causative genes be? Nucleic Acids Res.
2016; 44(13): 6046–54. https://doi.org/10.1093/nar/gkw500 PMID: 27269582
75. Maher MC, Uricchio LH, Torgerson DG, Hernandez RD. Population genetics of rare variants and com-
plex diseases. Hum Hered. 2012; 74(3–4): 118–28. https://doi.org/10.1159/000346826 PMID:
23594490
76. Park JH, Gail MH, Weinberg CR, Carroll RJ, Chung CC, Wang Z, et al. Distribution of allele frequencies
and effect sizes and their interrelationships for common genetic susceptibility variants. Proc Natl Acad
Sci U S A. 2011; 108(44): 18026–31. https://doi.org/10.1073/pnas.1114759108 PMID: 22003128
77. Goring HH, Terwilliger JD, Blangero J. Large upward bias in estimation of locus-specific effects from
genomewide scans. Am J Hum Genet. 2001; 69(6): 1357–69. https://doi.org/10.1086/324471 PMID:
11593451
78. Kraft P. Curses—winner’s and otherwise—in genetic epidemiology. Epidemiology. 2008; 19(5): 649–
51. https://doi.org/10.1097/EDE.0b013e318181b865 PMID: 18703928
79. McAllister JM, Modi B, Miller BA, Biegler J, Bruggeman R, Legro RS, et al. Overexpression of a
DENND1A isoform produces a polycystic ovary syndrome theca phenotype. Proc Natl Acad Sci U S A.
2014; 111(15): E1519–27. https://doi.org/10.1073/pnas.1400574111 PMID: 24706793
80. Tee MK, Speek M, Legeza B, Modi B, Teves ME, McAllister JM, et al. Alternative splicing of DENND1A,
a PCOS candidate gene, generates variant 2. Mol Cell Endocrinol. 2016; 434: 25–35. https://doi.org/10.
1016/j.mce.2016.06.011 PMID: 27297658
81. Moran L, Teede H. Metabolic features of the reproductive phenotypes of polycystic ovary syndrome.
Hum Reprod Update. 2009; 15(4): 477–88. https://doi.org/10.1093/humupd/dmp008 PMID: 19279045
82. Fauser BC, Tarlatzis BC, Rebar RW, Legro RS, Balen AH, Lobo R, et al. Consensus on women’s health
aspects of polycystic ovary syndrome (PCOS): the Amsterdam ESHRE/ASRM-Sponsored 3rd PCOS
Consensus Workshop Group. Fertil Steril. 2012; 97(1): 28–38 e25. https://doi.org/10.1016/j.fertnstert.
2011.09.024 PMID: 22153789
83. Essah PA, Nestler JE, Carmina E. Differences in dyslipidemia between American and Italian women
with polycystic ovary syndrome. J Endocrinol Invest. 2008; 31(1): 35–41. https://doi.org/10.1007/
BF03345564 PMID: 18296903
PLOS MEDICINE Phenotypic clustering reveals distinct subtypes of PCOS with novel genetic associations
PLOS Medicine | https://doi.org/10.1371/journal.pmed.1003132 June 23, 2020 27 / 28

84. Carmina E, Koyama T, Chang L, Stanczyk FZ, Lobo RA. Does ethnicity influence the prevalence of
adrenal hyperandrogenism and insulin resistance in polycystic ovary syndrome? Am J Obstet Gynecol.
1992; 167(6): 1807–12. https://doi.org/10.1016/0002-9378(92)91779-a PMID: 1471702
85. Guo M, Chen ZJ, Eijkemans MJ, Goverde AJ, Fauser BC, Macklon NS. Comparison of the phenotype
of Chinese versus Dutch Caucasian women presenting with polycystic ovary syndrome and oligo/ame-
norrhoea. Hum Reprod. 2012; 27(5): 1481–8. https://doi.org/10.1093/humrep/des018 PMID: 22402209
86. Louwers YV, Lao O, Fauser BC, Kayser M, Laven JS. The impact of self-reported ethnicity versus
genetic ancestry on phenotypic characteristics of polycystic ovary syndrome (PCOS). J Clin Endocrinol
Metab. 2014; 99(10): E2107–16. https://doi.org/10.1210/jc.2014-1084 PMID: 24960542
87. Dunaif A, Sorbara L, Delson R, Green G. Ethnicity and polycystic ovary syndrome are associated with
independent and additive decreases in insulin action in Caribbean-Hispanic women. Diabetes. 1993; 42
(10): 1462–8. https://doi.org/10.2337/diab.42.10.1462 PMID: 8375585
88. Engmann L, Jin S, Sun F, Legro RS, Polotsky AJ, Hansen KR, et al. Racial and ethnic differences in the
polycystic ovary syndrome metabolic phenotype. Am J Obstet Gynecol. 2017; 216(5): 493 e1–e13.
89. Zhang W, Collins A, Gibson J, Tapper WJ, Hunt S, Deloukas P, et al. Impact of population structure,
effective bottleneck time, and allele frequency on linkage disequilibrium maps. Proc Natl Acad Sci U S
A. 2004; 101(52): 18075–80. https://doi.org/10.1073/pnas.0408251102 PMID: 15604137
90. McCarthy MI. The importance of global studies of the genetics of type 2 diabetes. Diabetes Metab J.
2011; 35(2): 91–100. https://doi.org/10.4093/dmj.2011.35.2.91 PMID: 21738890
91. Goyal M, Dawood AS. Debates Regarding Lean Patients with Polycystic Ovary Syndrome: A Narrative
Review. J Hum Reprod Sci. 2017; 10(3): 154–61. https://doi.org/10.4103/jhrs.JHRS_77_17 PMID:
29142442
92. Stovall DW, Bailey AP, Pastore LM. Assessment of insulin resistance and impaired glucose tolerance in
lean women with polycystic ovary syndrome. J Womens Health (Larchmt). 2011; 20(1): 37–43.
93. Caglar GS, Kahyaoglu I, Pabuccu R, Demirtas S, Seker R. Anti-Mullerian hormone and insulin resis-
tance in classic phenotype lean PCOS. Arch Gynecol Obstet. 2013; 288(4): 905–10. https://doi.org/10.
1007/s00404-013-2833-9 PMID: 23553200
94. Keskin Kurt R, Okyay AG, Hakverdi AU, Gungoren A, Dolapcioglu KS, Karateke A, et al. The effect of
obesity on inflammatory markers in patients with PCOS: a BMI-matched case-control study. Arch Gyne-
col Obstet. 2014; 290(2): 315–9. https://doi.org/10.1007/s00404-014-3199-3 PMID: 24643802
95. Morciano A, Romani F, Sagnella F, Scarinci E, Palla C, Moro F, et al. Assessment of insulin resistance
in lean women with polycystic ovary syndrome. Fertil Steril. 2014; 102(1): 250–6 e3. https://doi.org/10.
1016/j.fertnstert.2014.04.004 PMID: 24825420
PLOS MEDICINE Phenotypic clustering reveals distinct subtypes of PCOS with novel genetic associations
PLOS Medicine | https://doi.org/10.1371/journal.pmed.1003132 June 23, 2020 28 / 28