distinct characteristics of rye and wheat breads impact on
TRANSCRIPT
foods
Article
Distinct Characteristics of Rye and Wheat BreadsImpact on Their in Vitro Gastric Disintegration andin Vivo Glucose and Insulin Responses
Emilia Nordlund 1,*, Kati Katina 2, Hannu Mykkänen 3 and Kaisa Poutanen 1,3
1 VTT Technical Research Centre of Finland Ltd, 02150 Espoo, Finland; [email protected] Department of Food and Environmental sciences, University of Helsinki, 00014 Helsinki, Finland;
[email protected] Department of Clinical Nutrition, Food and Health Research Centre, School of Public Health and
Clinical Nutrition, University of Eastern Finland, 70211 Kuopio, Finland; [email protected]* Correspondence: [email protected]; Tel.: +358-405-042-963
Academic Editor: Anthony FardetReceived: 2 December 2015; Accepted: 22 March 2016; Published: 25 March 2016
Abstract: Disintegration of rye and wheat breads during in vitro gastric digestion and its relationto the postprandial glucose and insulin responses of the breads was studied. Breads with distinctcomposition and texture characteristics were prepared with refined or wholegrain wheat and ryeflour by using either straight dough or sourdough process. After chewing and gastric digestionin vitro, 100% wholemeal and refined rye breads prepared by sourdough method were disintegratedto a much lower extent than the wheat breads, having more bread digesta particles with size over2 or 3 mm. Microstructure of the digesta particles of rye sourdough bread revealed more aggregatedand less degraded starch granules when compared to refined wheat bread. The postprandial insulinresponses, but not those of glucose, to the 100% rye breads made with sourdough method were lowerthan the responses to the refined wheat bread. Addition of gluten or bran in rye sourdough breadincreased insulin response. PCA (Principal Component Analysis) analysis confirmed that the insulinresponse had a negative correlation with the number of larger particles after in vitro digestion as wellas amount of soluble fiber and sourdough process. Since the high relative proportion of large sizedparticles after chewing and in vitro gastric digestion was associated with low postprandial insulinresponses, the analysis of structural disintegration in vitro is proposed as a complementary tool inpredicting postprandial physiology.
Keywords: rye; wheat; bread; sourdough; in vitro digestion; particle size; insulin response;glucose response
1. Introduction
Diets containing rapidly absorbing carbohydrates and low in dietary fiber (DF) are associatedwith increased risk of type 2 diabetes [1,2], whereas consumption of whole grain cereal foods reducesthe risk of type 2 diabetes and heart disease, possibly partly via the effects on insulin metabolism [3,4].Starchy foods like breakfast cereals, standard wheat breads and potato products result in high glycemicresponses, whereas intact cereal grains, pasta and dense breads produce lower responses [5,6]. Thus theform of cereal-based starch-rich food products is important for their postprandial responses.
Cereal products have unique solid foam structure, which is formed during processing [7]. Regularrefined wheat flour based solid foam structures (e.g., bread) have very porous structure and thuslow density, while acidic or fiber enriched solid foam structures (typical, e.g., for rye products) havehigh density [8]. Wheat based solid foams, such as bread, are based on continuous gluten network,
Foods 2016, 5, 24; doi:10.3390/foods5020024 www.mdpi.com/journal/foods

Foods 2016, 5, 24 2 of 13
which provides viscoelastic network trapping gas inside the product. Presence of non-digestiblecarbohydrates, especially soluble arabinoxylan and beta-glucan, results in higher viscosity, macrodensity and hardness. In 100% rye bread, protein cannot form a continuous network and elasticdough similar to wheat protein [9], and arabinoxylan is the main water-binding substance havinglarger effect than protein on dough rheology and gas holding properties. Besides compositionaldifferences of wheat and rye flour, lactic acid bacteria fermentation process generally used inrye bread making results in dense structure and altered starch properties and a high number ofstarch-protein interactions [10]. The distinct structures of rye and wheat breads have been relatedto starch digestibility and postprandial glucose metabolism [11]. In refined wheat bread, highlygelatinized starch and porous structure are predicted to result in rapid degradation of starch inthe small intestine and rapid rise of blood glucose and insulin levels. Rye and also wheat-basedbread prepared by fermentation with lactic acid bacteria, i.e., sourdough technology, have reportedto show reduced GI values [12]. The reduced postprandial responses of rye sourdough breads areexpected to be attributed to biochemical factors of rye [13–15] and acidity induced solubilization ofDF, acidity-mediated reduction of starch digestion and stepwise degradation of protein phase of thefoam [10–12], but the mechanisms are not completely revealed.
To predict the postprandial glucose metabolism of cereal products, the rate of starch digestion hasbeen investigated by in vitro hydrolysis using alimentary amylolytic enzymes [10,12,16–18]. However,none of these in vitro methods took into account the disintegration and particle size of the productsduring gastric digestion, which is known to influence the rate of gastric emptying in vivo [19,20].Hernot et al. [20] studied the influence of dough processing step of whole meal flours on in vitrodigestion of starch, but the impact of end product structure was not examined. Hence, the role offood disintegration during gastric digestion in regulating postprandial glycemia is not known. In thepresent work the target was to show how different bread types disintegrate during oral and simulatedgastric phase, and whether the particle size after gastric phase simulation can in part predict glycemicand insulinemic responses in vivo. For that, mechanical, structural and biochemical properties ofvarious types of rye and wheat breads, their particle size after the in vitro gastric digestion, and in vivoglucose and insulin responses were analyzed. A multivariate analysis method was applied to study therelationships between bread characteristics, gastric phase particle size and in vivo responses of breads.
2. Materials and Methods
2.1. Breads
Commercial wholemeal wheat flour (ash content 1.8% d.w), wholemeal rye flour, refined wheatflour (ash content 0.6% d.w), refined rye flour, wheat and rye bran (Melia Ltd, Raisio, Finland) wereused for baking the breads. The commercial coarse wheat bran was further ground to obtain fineparticle size (6% >750, 47% >355, and 78% >132 µm).
The reference bread (Bread 1) was a commercial refined wheat bread (Table 1). Bread 2 was acommercial wholemeal sour rye bread made with finely milled flour. These breads, commonly usedin Finland, were received from two Finnish bakeries (Fazer Bakeries Ltd and Vaasan & Vaasan Oy).The experimental breads baked for the study were: Bread 3, 100% wholemeal rye bread made withsourdough method; Bread 4, 70%:30% wholemeal rye bread with rye bran (70%:30% flour:bran ratio)made with sourdough method; Breads 5 and 6, 100% refined rye bread made with sourdough method(pan and flat bread); Bread 7, 100% refined rye bread (flat) with added gluten made with sourdoughmethod; Bread 8, 60%:40% wholemeal rye/wheat bread made with straight dough method; Bread 9,60%:40% wholemeal wheat/wheat bread made with straight dough method; and Bread 10, wheat breadwith fermented bran (33% supplementation level) made with straight dough method. Hence, Breads 2–7were prepared with sourdough method and the rest of the breads with straight dough method.Breads 6 and 7 were baked as flat bread and all the other breads were baked as standard pan breads.Recipes and process for experimental breads are presented as supplementary data (Tables S1 and S2).

Foods 2016, 5, 24 3 of 13
Table 1. Characteristics of rye and wheat breads (chemical composition expressed g/100 g fresh weight). Standard deviation in chemical composition data was lessthan 5%.
Bread type Baking Process PortionSize (g) Sugars Available
CarbohydrateDietary
FiberSoluble
Dietary Fiber Protein Fat Ash Moisture pH TTA BreadVolume, mL/g
1 Refined wheat Straight dough 99.2 2.0 50.4 1.9 0.5 8.6 4.9 1.4 33.7 6.0 3.3 4.5 ˘ 0.1
2 Wholemeal rye(Commercial) Sourdough 134.8 5.0 37.2 9.1 1.6 6.1 1.4 nd a 41.1 4.3 10.9 0.9 ˘ 0.04
3 Wholemeal rye Sourdough 142.9 0.3 35.0 10.7 3.0 7.8 5.5 1.6 40.8 4.9 10.2 1.8 ˘ 0.20
4 Wholemeal rye + bran Sourdough 199.2 0.2 25.1 14.5 2.4 8.4 5.1 2.4 45.2 5.1 14.8 1.7 ˘ 0.20
5 Refined rye Sourdough 112.1 0.4 44.6 5.7 2.1 4.1 0.7 1.0 43.1 4.4 5.1 2.2 ˘ 0.20
6 Refined rye (flat) Sourdough 90.6 1.1 55.2 6.4 2.4 3.7 0.4 1.2 31.5 4.7 5.5 1.9 ˘ 0.10
7 Refined rye + gluten (flat) Sourdough 100.6 1.0 49.7 5.4 2.2 4.4 0.4 1.1 37.2 4.5 4.9 2.2 ˘ 0.10
8 Wholemeal rye/ wheat Straight dough 137.7 1.5 36.3 7.1 2.0 12.9 2.6 1.8 39.4 6.1 4.3 3.8 ˘ 0.03
9 Wholemeal wheat/ wheat Straight dough 135.9 1.8 36.8 6.0 0.8 8.6 13.7 nd 38.3 5.9 5.3 4.2 ˘ 0.05
10 Refined Wheat +fermented bran Straight dough 162.3 2.2 30.8 10.6 1.1 8.0 4.4 2.0 46.9 5.5 10.3 3.3 ˘ 0.03
a not determined.

Foods 2016, 5, 24 4 of 13
2.2. Chemical Composition, Acidity and Volume of Breads
The amount of available starch was determined by an enzymatic kit (Megazyme method, [21]).Sugars were analyzed after extraction with water for 15 min at 50 ˝C by the high performanceliquid chromatography HPLC-method of Tenkanen et al. [22]. The available carbohydrate contentwas defined as the sum of available starch and sugars. DF was determined as described byAsp et al. [23], protein was analyzed by the Kjeldahl method [24], and fat was analyzed using theFat in Flour-Mojonnier method (AOAC (Association of Official Analytical Chemists) official methodsof analysis (2000, no. 922.06 “fat in flour”.) no. 922.06). Acidity of breads was determined bymeasuring the pH value and total titratable acidity [25]. Specific volume (mL/g) of the fresh breadswas determined by the rapeseed displacement method.
2.3. Postprandial Glucose and Insulin Responses
The postprandial glucose and insulin responses of the breads were tested in five differentexperiments each including refined wheat bread as the reference and Breads 1–3. The subjects forBreads 1 and 2 were men and women (n = 17), aged 22–37 year, BMI 19.2–26.7 kg/m2, all had normalglucose tolerance [26]. The subjects for Breads 3–10 were 12 females aged 64 years (57–72), body weight68.3 ˘ 8.4 kg (mean, SD) and with normal glucose tolerance. The meal tests were performed in themorning after the subjects had fasted for 12–15 h. The meal contained 50 g available carbohydrates fromthe test bread and 40 g cucumber and 3 dL non-caloric orange drink. From the time when the subjectsstarted to eat, altogether 8 blood samples were drawn (15, 30, 45, 60, 90, 120, 150 and 180 min) for thedetermination of blood glucose and insulin concentrations. The breads were served in a random orderwith a minimum of a one-week interval. Plasma glucose was analyzed with the enzymatic photometricmethod (Granutest 100; Merck, Damstadt, Germany) with use of a Kone Specific Clinical Analyzer(Kone Ltd, Espoo, Finland), and serum insulin was analyzed by radioimmunoassay (PhadasephInsulin RIA 100; Pharmacia Diagnostica, Uppsala, Sweden). Glucose and insulin responses of theBreads 6–10 were determined specifically for this work, whereas the data for Breads 1 and 2 were fromLeinonen et al. [26], and the data for Breads 3–5 from Juntunen et al. [11]. The postprandial incrementalblood glucose and insulin areas over 180 min (AUC) were calculated for the test breads and comparedto the respective areas for the refined wheat bread in each series. The mean AUC value of each breadwas used in PCA analysis.
2.4. In Vitro Digestion Method
The digestion method for the particle-size analysis was performed according to the in vitro methodby Grandfeldt et al. [17]. An equivalent amount of available carbohydrate (1 g of starch and sugars onthe basis of analyzed data) of the breads was chewed in vivo for 15 s by four subjects and the masticatedresidues were expectorated into a beaker containing 50 mg pepsin (Activity ě 2000 FIP-U/g, Merck,Darmstadt, Germany) in 6 mL of 0.05 M NaK phosphate buffer (containing 0.4 g/L NaCl) adjusted topH 1.5 with HCl. Then the subjects rinsed their mouth with 10 mL of phosphate buffer, (pH 6.9) for15 s and expectorated the rinsing solution into the beaker. The pH of the suspension was adjusted to1.5 with HCl. The suspension was incubated for 30 min (37 ˝C, 400 rpm). Samples for the particle sizeanalysis were removed at this stage.
2.5. Digesta Particle Size and Microscopy Analysis
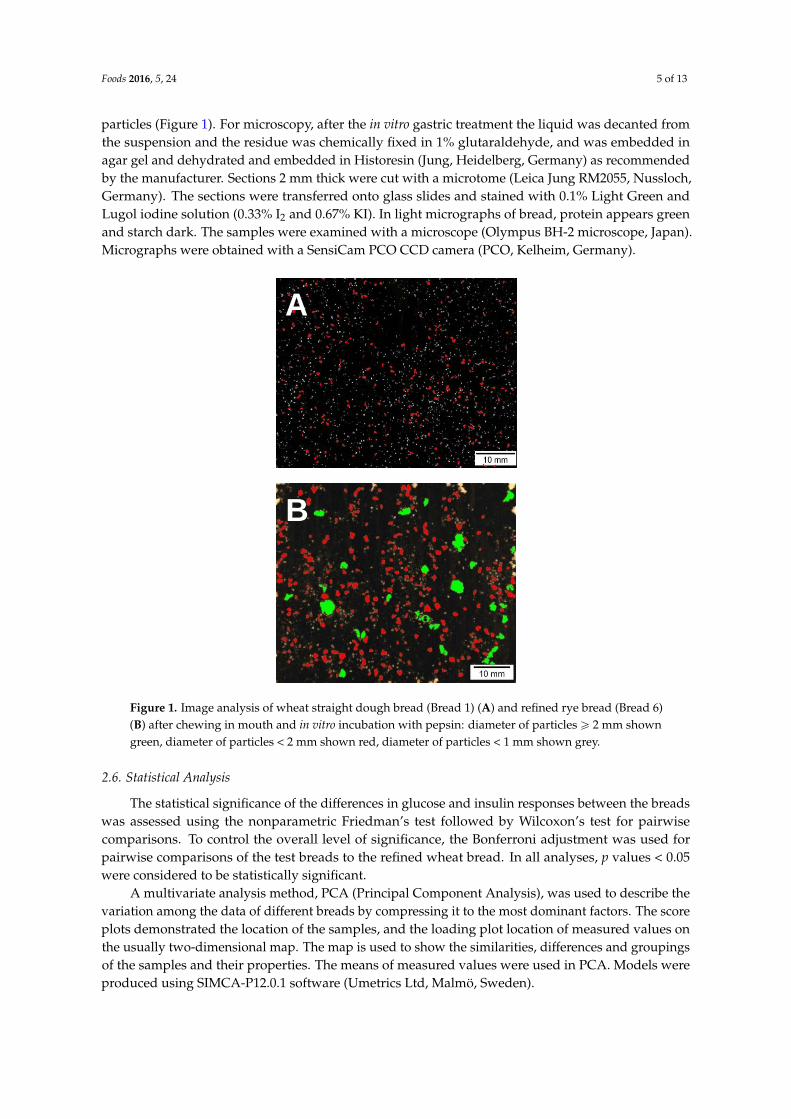
After pepsin incubation described above the whole suspension was diluted with water to 200 mLand divided onto 20 Petri dishes. The particles were photographed by camera (Nikon Coolpix 5400,Nikon Corp., Tokyo, Japan). The maximum diameter and the number of particles were analysed withthe AnalySIS 3.0 image analysis program (Soft Imaging System, Münster, Germany). To visualize thesizes of the different particles in the images, the large particles (diameter > 2 mm) are by image analysisshown green and the small ones (0.5–2.0 mm) red. Particles over 2 or 3 mm were considered as large
Foods 2016, 5, 24 5 of 13
particles (Figure 1). For microscopy, after the in vitro gastric treatment the liquid was decanted fromthe suspension and the residue was chemically fixed in 1% glutaraldehyde, and was embedded inagar gel and dehydrated and embedded in Historesin (Jung, Heidelberg, Germany) as recommendedby the manufacturer. Sections 2 mm thick were cut with a microtome (Leica Jung RM2055, Nussloch,Germany). The sections were transferred onto glass slides and stained with 0.1% Light Green andLugol iodine solution (0.33% I2 and 0.67% KI). In light micrographs of bread, protein appears greenand starch dark. The samples were examined with a microscope (Olympus BH-2 microscope, Japan).Micrographs were obtained with a SensiCam PCO CCD camera (PCO, Kelheim, Germany).
Foods 2016, 5, 24 5 of 13
was embedded in agar gel and dehydrated and embedded in Historesin (Jung, Heidelberg, Germany)
as recommended by the manufacturer. Sections 2 mm thick were cut with a microtome (Leica Jung
RM2055, Nussloch, Germany). The sections were transferred onto glass slides and stained with 0.1%
Light Green and Lugol iodine solution (0.33% I2 and 0.67% KI). In light micrographs of bread, protein
appears green and starch dark. The samples were examined with a microscope (Olympus BH-2
microscope, Japan). Micrographs were obtained with a SensiCam PCO CCD camera (PCO, Kelheim,
Germany).
Figure 1. Image analysis of wheat straight dough bread (Bread 1) (A) and refined rye bread (Bread 6)
(B) after chewing in mouth and in vitro incubation with pepsin: diameter of particles ≥ 2 mm shown
green, diameter of particles < 2 mm shown red, diameter of particles < 1 mm shown grey.
2.6. Statistical Analysis
The statistical significance of the differences in glucose and insulin responses between the breads
was assessed using the nonparametric Friedman’s test followed by Wilcoxon’s test for pairwise
comparisons. To control the overall level of significance, the Bonferroni adjustment was used for
pairwise comparisons of the test breads to the refined wheat bread. In all analyses, p values < 0.05
were considered to be statistically significant.
A multivariate analysis method, PCA (Principal Component Analysis), was used to describe the
variation among the data of different breads by compressing it to the most dominant factors. The
score plots demonstrated the location of the samples, and the loading plot location of measured
values on the usually two-dimensional map. The map is used to show the similarities, differences
and groupings of the samples and their properties. The means of measured values were used in PCA.
Models were produced using SIMCA-P12.0.1 software (Umetrics Ltd, Malmö, Sweden).
Whole meal rye bread Standard wheat bread
A
B
Figure 1. Image analysis of wheat straight dough bread (Bread 1) (A) and refined rye bread (Bread 6)(B) after chewing in mouth and in vitro incubation with pepsin: diameter of particles ě 2 mm showngreen, diameter of particles < 2 mm shown red, diameter of particles < 1 mm shown grey.
2.6. Statistical Analysis
The statistical significance of the differences in glucose and insulin responses between the breadswas assessed using the nonparametric Friedman’s test followed by Wilcoxon’s test for pairwisecomparisons. To control the overall level of significance, the Bonferroni adjustment was used forpairwise comparisons of the test breads to the refined wheat bread. In all analyses, p values < 0.05were considered to be statistically significant.
A multivariate analysis method, PCA (Principal Component Analysis), was used to describe thevariation among the data of different breads by compressing it to the most dominant factors. The scoreplots demonstrated the location of the samples, and the loading plot location of measured values onthe usually two-dimensional map. The map is used to show the similarities, differences and groupingsof the samples and their properties. The means of measured values were used in PCA. Models wereproduced using SIMCA-P12.0.1 software (Umetrics Ltd, Malmö, Sweden).

Foods 2016, 5, 24 6 of 13
3. Results
3.1. Chemical Composition and Texture of the Breads
Chemical composition, volume and acidity of the breads are presented in Table 1. Refined ryebreads (55%) contained the highest amount of starch, whereas wholemeal rye bread with added bran(25.0%) had the lowest amount of starch. In the postprandial study, the bread portion size was designedto deliver 50 g of available carbohydrates; therefore, the amount of breads eaten varied from 91 g(refined rye, Bread 6) to 199 g of bread (wholemeal rye sourdough bread with rye bran, Bread 4).Wholemeal rye sourdough bread with added bran (Bread 4) contained the highest amount DF (14.5%),whereas refined wheat bread (Bread 1) and refined rye sourdough bread with gluten (Bread 7) had thelowest amount of DF (1.9% and 5.4%, respectively). The amount of DF varied from 1.9 g/consumedportion (refined wheat, Bread 1) to 28.9 g/consumed portion (wholemeal rye sourdough bread withrye bran, Bread 4).
Breads made with sourdough method had clearly smaller specific volume and harder texture ascompared to breads made with straight dough method (Table 1). The volume of pan breads variedfrom 1.7 mL/g (wholemeal rye sourdough bread with added bran, Bread 4) to 4.5 mL/g (refined wheat,Bread 1) and those of flat breads between 1.9 and 2.2 mL/g (refined rye bread without and with gluten,Breads 6 and 7, respectively). The pH of the breads varied from around 6 (straight dough, Breads 1, 8and 9) to around 4.5 (refined rye sourdough, Breads 5–7). TTA varied from 3.3 (refined wheat, Bread 1)to 14.8 (wholemeal rye sourdough bread with bran, Bread 4).
3.2. Microscopy of Refined Wheat and Wholemeal Rye Breads after in Vitro Digestion
The micrographs of the residues after in vitro digestion of wheat straight dough bread (Bread 1,Figure 2A,C) and whole meal rye sourdough bread (Bread 2, Figure 2B,D) are shown in Figure 1. It wasobvious that microstructure of the digesta particles of the rye breads was much less disintegratedcompared to wheat breads. The difference in microstructure was seen already after chewing(Figure 2A,B) but was more pronounced after the gastric phase (Figure 2C,D). After in vivo chewing,the digesta particles of refined wheat bread were broken down from the edges, whereas the particlesfrom rye sourdough bread were mainly intact. After the in vitro gastric step, the protein network ofthe wheat bread residue was extensively hydrolyzed and starch granules were freely distributed inthe sample. Then again, the rye bread digesta particles resembled the original rye bread, in whichaggregated starch granules form a continuous network and protein acts as filler.
3.3. In Vitro Particle Size Distribution of the Test Breads
The particle size distribution of the breads after in vitro digestion was analyzed by image analysis(Table 2). To visualize the differences in particle size in the digested material, small particles (Ø < 2 mm)were labeled red in image analysis and large particles (Ø > 2 mm) were labeled green. Image analysisin Figure 1 shows wheat straight dough bread (Bread 1, Figure 1A) and refined rye bread (Bread 6,Figure 1B) after chewing in mouth and in vitro incubation with pepsin. The percentage of particles over3 mm (Ø) varied from 0.1% (refined wheat bread, Bread 1) to 7.9% (flat refined rye sourdough bread,Bread 6). The relative portion of particles over 2 mm (Ø) varied from 0.2% (refined wheat bread, Bread 1)to 16.5% (flat refined rye sourdough bread, Bread 6). The refined wheat and mixed wheat breadsmade with straight dough method (Breads 1, 8, 9, and 10) had the highest relative portion of particlesbetween 0.2–2 mm (Ø), and also the average diameter of the large particles of the digested wheatbreads was low. Commercial wholemeal rye bread (Bread 2,) as well as experimental refined rye breads(Breads 5–7) had higher percentage of particles over 2 or 3 mm and larger average size of particles afterin vitro digestion than the wheat breads. Both the proportion of large particles and average particlediameter were larger in flat bread (Bread 6) in comparison to pan bread (Bread 5), and addition ofgluten to refined rye sourdough bread (Bread 7) reduced the proportion of large particles.

Foods 2016, 5, 24 7 of 13
Foods 2016, 5, 24 7 of 13
Figure 2. Micrographs of the residues after chewing in mouth: (a) wheat straight dough bread (Bread
1); and (b) whole meal rye sourdough bread (Bread 2). Micrographs of the residues after incubation
with pepsin: (c) wheat straight dough bread (Bread 1); and (d) whole meal rye sourdough bread
(Bread 2).
Table 2. Particle size distribution (%) of the test breads after in vitro digestion of bread pieces (bread
amount dosed based on 1 g potentially available carbohydrates).
Bread
Distribution of Digesta
Particles (%)
Average Diameter of Digesta
Particles (DP a)
0.2–2 mm >2 mm >3 mm >2 mm >3 mm
1. Refined wheat (commercial) (st) b 99.8 0.2 0.1 2.6 (±0.2) 3.5 (±0.3)
2. Wholemeal rye (commercial) (sd) c 94.4 5.6 2.5 3.6 (±0.2) 5.1 (±0.2)
3. Wholemeal rye (sd) nd d nd nd nd nd
4. Wholemeal rye+bran (sd) nd nd nd nd nd
5. Refined rye (sd) 93.1 6.9 2.2 2.9 (±0.1) 4.0 (±0.2)
6. Refined rye, flat (sd) 83.5 16.5 7.9 3.4 (±0.0) 4.4 (±0.2)
7. Refined rye+gluten, flat (sd) 86.6 13.4 4.8 3.3 (±0.1) 5.0 (±0.3)
8. Wholemeal rye/wheat (st) 97.4 2.6 0.5 2.7 (±0.2) 3.8 (±0.2)
9. Wholemeal wheat/wheat (st) 97.6 2.4 0.2 2.4 (±0.01) 3.4 (±0.3)
10. Refined Wheat + fermented bran (st) 94.9 5.1 0.8 2.5 (±0.1) 3.5 (±0.2)
a DP = Average diameter of over 2 mm or over 3 mm particles; b st = straight dough process; c sd =
sourdough process, d nd = not determined.
3.4. Postprandial Glucose and Insulin Responses
No differences were found in glucose responses (AUC values) of the breads, but insulin
responses (AUC values) of most 100% rye sourdough breads (Breads 2, 3, 5, and 6) were significantly
lower than those of refined wheat bread controls (Table 3). The insulin responses of wholemeal rye
sourdough bread with added bran (Bread 4) and the refined rye sourdough bread with added gluten
(Bread 7) did not differ from refined wheat bread. The bread containing 60% wholemeal and 40%
Figure 2. Micrographs of the residues after chewing in mouth: (a) wheat straight dough bread (Bread 1);and (b) whole meal rye sourdough bread (Bread 2). Micrographs of the residues after incubation withpepsin: (c) wheat straight dough bread (Bread 1); and (d) whole meal rye sourdough bread (Bread 2).
Table 2. Particle size distribution (%) of the test breads after in vitro digestion of bread pieces (breadamount dosed based on 1 g potentially available carbohydrates).
Bread
Distribution of DigestaParticles (%)
Average Diameter ofDigesta Particles (DP a)
0.2–2 mm >2 mm >3 mm >2 mm >3 mm
1. Refined wheat (commercial) (st) b 99.8 0.2 0.1 2.6 (˘0.2) 3.5 (˘0.3)2. Wholemeal rye (commercial) (sd) c 94.4 5.6 2.5 3.6 (˘0.2) 5.1 (˘0.2)
3. Wholemeal rye (sd) nd d nd nd nd nd4. Wholemeal rye+bran (sd) nd nd nd nd nd
5. Refined rye (sd) 93.1 6.9 2.2 2.9 (˘0.1) 4.0 (˘0.2)6. Refined rye, flat (sd) 83.5 16.5 7.9 3.4 (˘0.0) 4.4 (˘0.2)
7. Refined rye+gluten, flat (sd) 86.6 13.4 4.8 3.3 (˘0.1) 5.0 (˘0.3)8. Wholemeal rye/wheat (st) 97.4 2.6 0.5 2.7 (˘0.2) 3.8 (˘0.2)
9. Wholemeal wheat/wheat (st) 97.6 2.4 0.2 2.4 (˘0.01) 3.4 (˘0.3)10. Refined Wheat + fermented bran (st) 94.9 5.1 0.8 2.5 (˘0.1) 3.5 (˘0.2)
a DP = Average diameter of over 2 mm or over 3 mm particles; b st = straight dough process; c sd = sourdoughprocess, d nd = not determined.
3.4. Postprandial Glucose and Insulin Responses
No differences were found in glucose responses (AUC values) of the breads, but insulin responses(AUC values) of most 100% rye sourdough breads (Breads 2, 3, 5, and 6) were significantly lower thanthose of refined wheat bread controls (Table 3). The insulin responses of wholemeal rye sourdough

Foods 2016, 5, 24 8 of 13
bread with added bran (Bread 4) and the refined rye sourdough bread with added gluten (Bread 7) didnot differ from refined wheat bread. The bread containing 60% wholemeal and 40% refined wheatflour made with straight dough method (Bread 9) had significantly higher insulin response than therefined wheat bread.
Table 3. The postprandial incremental blood glucose and insulin responses of the breads determinedas areas under the curve (AUC) over 180 min. The values are shown as means with standarddeviation. Statistical significance of differences within each series was assessed using the nonparametricFriedman´s test. In case a significant difference was observed, Wilcoxon´s test for pairwise comparisonswas made to compare the other samples to refined wheat bread. In bread coding “sd” stands forsourdough and “st” for straight dough.
Bread Glucose Area Statistics 1,2 Insulin Area StatisticalSignificance 1,2
Series 1 (n = 17)
1. Refined wheat (commercial) 98 ˘ 91 3342 ˘ 16002. Wholemeal rye (commercial)(sd) 79 ˘ 63 P = 0.709 2 2086 ˘ 889 P = 0.001 2
Series 2 (n = 12)
Refined wheat 90 ˘ 49 P = 0.940 1 3289 ˘ 1105 P = 0.001 1
3. Wholemeal rye (sd) 71 ˘ 42 2469 ˘ 954 P = 0.031 2
4. Wholemeal rye+bran (sd) 103 ˘ 120 2758 ˘ 1013 P = 0.166 2
5. Refined rye (sd) 95 ˘ 84 2326 ˘ 737 P = 0.006 2
Series 3 (n = 12)
Refined wheat 143 ˘ 88 P = 0.717 1 3661 ˘ 1476 P = 0.013 1
6. Refined rye, flat (sd) 190 ˘ 95 2811 ˘ 844 P = 0.020 2
7. Refined rye+ gluten, flat (sd) 191 ˘ 97 3212 ˘ 1368 P = 0.628 2
Series 4 (n = 12) 121 ˘ 90 P = 0.127 1 3658 ˘ 1656 P = 0.627 1
8. Wholemeal rye/wheat (st) 109 ˘ 94 3600 ˘ 136510. Refined Wheat + fermentedbran (st) 74 ˘ 41 3758 ˘ 1512
Series 5 (n = 12)
Refined wheat 100 ˘ 58 3435 ˘ 15359. Wholemeal wheat/wheat (st) 98 ˘ 56 P = 0.936 2 4173 ˘ 1722 P = 0.018 2
1 Friedman’s test and 2 Wilcoxon’s test with Bonferroni corrections in series 2 and 3.
3.5. Correlation between Bread Properties, Particle Size, and Glucose and Insulin Response with PCA
PCA was applied to study the relationships between chemical composition, structural features,in vitro disintegration and in vivo response of breads. Due to the non-significant statistical differences,the AUC values for glucose were not included in the PCA test. Figure 3 shows a Biplot with PC 1plotted against PC2. The first factor explained 54% of the variation in measured properties and thesecond factor 31% of the variation. Wheat breads were plotted opposite to rye breads, which furtherwere grouped to wholemeal and refined rye breads. Insulin response (AUC values) was grouped withspecific volume, pH and straight dough process, indicating that samples having high pH, low densityand made with straight dough process had high insulin response. The AUC values for insulin a hadstrong negative correlation with the number of larger particles after in vitro digestion and amount ofsoluble fiber as well as sourdough process, indicating that samples prepared with sourdough processhad a high number of larger particles and lower insulin response. Total dietary fiber content, portionsize or amount of carbohydrates or proteins was not correlated with the insulin response.

Foods 2016, 5, 24 9 of 13Foods 2016, 5, 24 9 of 13
Figure 3. Results of PCA (Principal Component Analysis) analysis presented as Biplot picture of
relation on properties of bread, particle size after in vitro digestion and in vivo response (AUC (area
under the curve) values for insulin) (shown as green circles). Refined rye, whole meal rye and wheat
breads are illustrated with stars, squares and hexagons, respectively. WM = wholemeal, EN = refined,
C = commercial bread, F = flat bread, CH = carbohydrates, Auc in = AUC values for insulin. Number
coding for breads is according to Table 1.
4. Discussion
The results of the present study show that bread structure and acidity influence in vitro
digestibility and insulin responses. The glucose responses (glucose AUC values) did not show
significant differences among the different breads, and thus multivariate analysis of glucose response
and bread characteristics was not performed. Of the bread characteristics, low specific volume and
high acidity, but, for example, not total DF content correlated with slower disintegration in vitro and
lower insulin response in vivo. The lowering of insulin response as compared to refined wheat bread
was linked to higher proportion of large particles of the bread after digestion in vitro. The result
suggests that gastric particle disintegration in vitro could provide a tool for prediction of insulin
response in vivo, like the glycemic index method is used to predict glycemic response. As shown by
Eerdelink et al. [27], slower intestinal uptake of glucose from a starchy food product can result in
lower postprandial insulinemia even in the absence of lower glycemic response, and provide longer-
term health effects. The macro- and microstructural characteristics of breads resulting in large
particles in simulated gastrointestinal digestion and consequently lower insulin index are discussed
more in detail below.
4.1. Macrostructural Aspects
The macrostructure and texture of cereal products are known to affect their digestibility in vivo.
Disintegration and particle size of food products during digestion is dependent on food texture and
Figure 3. Results of PCA (Principal Component Analysis) analysis presented as Biplot picture of relationon properties of bread, particle size after in vitro digestion and in vivo response (AUC (area under thecurve) values for insulin) (shown as green circles). Refined rye, whole meal rye and wheat breadsare illustrated with stars, squares and hexagons, respectively. WM = wholemeal, EN = refined,C = commercial bread, F = flat bread, CH = carbohydrates, Auc in = AUC values for insulin. Numbercoding for breads is according to Table 1.
4. Discussion
The results of the present study show that bread structure and acidity influence in vitro digestibilityand insulin responses. The glucose responses (glucose AUC values) did not show significantdifferences among the different breads, and thus multivariate analysis of glucose response and breadcharacteristics was not performed. Of the bread characteristics, low specific volume and high acidity,but, for example, not total DF content correlated with slower disintegration in vitro and lower insulinresponse in vivo. The lowering of insulin response as compared to refined wheat bread was linkedto higher proportion of large particles of the bread after digestion in vitro. The result suggests thatgastric particle disintegration in vitro could provide a tool for prediction of insulin response in vivo,like the glycemic index method is used to predict glycemic response. As shown by Eerdelink et al. [27],slower intestinal uptake of glucose from a starchy food product can result in lower postprandialinsulinemia even in the absence of lower glycemic response, and provide longer-term health effects.The macro- and microstructural characteristics of breads resulting in large particles in simulatedgastrointestinal digestion and consequently lower insulin index are discussed more in detail below.
4.1. Macrostructural Aspects
The macrostructure and texture of cereal products are known to affect their digestibility in vivo.Disintegration and particle size of food products during digestion is dependent on food texture and
Foods 2016, 5, 24 10 of 13
is known to influence the rate of gastric emptying and thus the glycemic responses [19]. Porousfood structures, such as puffed rice and wheat, corn flakes and corn chips are known to producehigh glucose and insulin responses [6,28]. In the present work, the refined wheat bread and wheatbread with 60% wholemeal flour, made with straight dough method, were easily disintegrated duringin vivo chewing and subsequent in vitro pepsin incubation, as shown by the lowest number of largeparticles. The size of wheat bread digesta particles was typically less than 50 µm. On the other hand,the wholemeal and refined rye breads prepared by sourdough method were disintegrated in vitro toa much lower extent than the wheat breads, and the bread digestas contained several particles withsize over 2 or 3 mm. Furthermore, the number of particles with the average diameter of particles over2 or 3 mm correlated with AUC for insulin in PCA. Porosity provides one probable explanation forthe observed differences between the wheat and rye breads. Standard wheat bread has a very porousstructure, which enables salivary α-amylase to penetrate easily through the pores and disintegratethe bread matrix, whereas more dense rye sourdough breads were less susceptible for disintegration.Similarly in wheat bread increasing density has been linked to lowered digestibility [6,29]. Form ofrye sourdough bread was also found to affect the in vitro disintegration of bread (Breads 5 and 6).The number of particles in the in vitro digesta was higher and average diameter higher in the flatrefined rye bread in comparison to corresponding pan bread, most likely due to the larger amount ofcrust and the denser structure of the flat bread. Addition of gluten in rye sourdough bread (Bread 7)decreased the number of large particles in vitro and increased insulin response to similar value aswith refined wheat bread. As in wheat bread, gluten increases porosity and reduces firmness of therye bread crumb structure, which most probably explains the increased disintegration and insulinresponse of the rye bread with added gluten. Breadmaking method, straight dough or sourdough,presumably influenced bread digestibility as well. Wholemeal mixed wheat breads (60% wholemealand 40% of refined wheat, Breads 8–10) made with straight dough method had bigger volume andsofter texture, showed less large digesta particles than the 100% rye sourdough breads, and comparableor higher insulin response than refined wheat bread. However, the breads made by straight doughprocess contained both refined and wholegrain flour, so the results are not directly comparable to 100%sourdough wholegrain rye bread.
4.2. Microstructural Aspects
Microstructure of food is known to influence substrate-enzyme interactions and thus susceptibilityof nutrients to gastrointestinal enzymes. Generally in wheat bread making, gluten forms the continuousphase of the bread matrix, whereas starch granules form the continuous phase of rye breads [11,30].In addition, in the tested rye sourdough breads the continuous bread matrix was composed of swollenstarch granules, leached amylose and swollen cell walls, thus making proteins probably less susceptiblefor hydrolysis under conditions mimicking gastric environment. The sourdough process also changesthe microstructure of rye bread by solubilization of proteins and DF, mainly arabinoxylan that isthe main water binding substance in rye sourdough [30]. These changes by sourdough are partlyacidity-induced, either directly by acid or by induction of endogenous xylanases and proteases byacidic environment. Acid and its effect on proteins and DF has been proposed to affect the glycemicresponses to breads [15], and besides microstructural changes, it has been suggested that one reasonfor the acid-induced reduced postprandial responses could also be delayed gastric emptying rate dueto organic acids produced by sourdough microflora [31,32].
In the case of wheat bread microstructure, pieces of bread after mastication were large, and glutennetwork was dominating and binding the dispersed individual starch granules. However, underconditions mimicking gastric digestion, the pieces of standard wheat bread were easily broken downsince pepsin has access to protein phase surrounding the starch granules. This was also supported bythe microscopy analysis of wholemeal rye sourdough bread were the continuous phase of swollenstarch granule aggregates protected starch and protein against enzymatic hydrolysis. This can be onereason why disintegration of rye sourdough bread is reduced as compared to wheat bread. Adding

Foods 2016, 5, 24 11 of 13
gluten to rye sourdough bread (Bread 7) might also have changed the microstructure and continuousphase of rye bread with subsequent increase in disintegration by pepsin during in vitro digestion.Interestingly, the rye sourdough bread with added bran (Bread 4) also showed increased insulinresponse that did not differ from refined wheat bread. The mechanism behind the result remains tobe studied in more detail, but possibly the bran addition physically disrupted the dense structure ofrye sourdough bread. Bran has typically high degree of insoluble components, especially insolubledietary fiber that might have disrupted the rye crumb structure consisting of viscous network made ofsoluble arabinoxylan and starch and thus making bread components more susceptible for digestiveenzymes. Generally, in a view of these results and hypothesis, it was rather unexpected that only theinsulin responses but not those of glucose were lower to rye sourdough breads than to wheat breads.However, also previous studies have demonstrated that sourdough rye breads or other foods rich instarch products display low insulinemic response, regardless of their glucose response [27,33].
4.3. Limitations of the Study
Combining the data of several in vivo experiments carried over several years brings an element ofvariability to the results. Besides natural variation between the studies performed at different times,the subjects for testing the commercial breads (Breads 1 and 2) were young men and women andin the other experiments older women. However, all subjects were healthy and the age and genderdifferences in the subject groups are not expected to cause major impact on the results. There were alsosome weaknesses in the dataset for the comparison of the bread characteristics. For example, bread of100% rye flour with straight dough process was not available to be compared to the correspondingsourdough rye bread. Nevertheless, the breads studied provided enough variance with respect tostructural parameters to suggest that disintegration of structure during early phases of gastrointestinaldigestion might be one factor contributing to postprandial control of glucose metabolism.
5. Conclusions
Relationships were shown between chemical and structural properties of rye and wheat breads,their in vitro gastric disintegration and in vivo insulin, but not glucose responses. High relativeproportion of large sized particles after chewing and in vitro gastric digestion was associated with lowpostprandial insulin responses, suggesting that analysis of structural disintegration is a complementarytool in predicting postprandial physiology.
Supplementary Materials: Supplementary materials are available online at www.mdpi.com/link.
Acknowledgments: Karin Autio is acknowledged for participation in planning and conducting the research.Kirsi-Helena Kanninen conducted part of the research work, and Anna-Marja Aura participated in developmentof the in vitro method. Ritva Heinonen performed the microscopy and particle size analysis of the breads.
Author Contributions: Emilia Nordlund was responsible for structuring and writing the paper. Kati Katinaparticipated in the experimental planning of the work, analyzed the results and contributed to writing.Hannu Mykkänen participated in the experimental planning of clinical experiment, analyzed the results andcontributed to writing. Kaisa Poutanen participated in the experimental planning of the research, coordinated thework and contributed to writing the paper.
Conflicts of Interest: The authors declare no conflict of interest.
References
1. Bhupathiraju, N.S.; Tobias, K.D.; Malik, S.V.; Pan, A.; Adela, H.; JoAnn, E.; Manson, E.A.J.; Willett, C.W.;Hu, B.F. Glycemic index, glycemic load, and risk of type 2 diabetes: Results from 3 large US cohorts and anupdated meta-analysis. AJCN 2014, 100, 218–232. [CrossRef] [PubMed]
2. Raben, A. Glycemic index and metabolic risks: How strong is the evidence? AJCN 2014, 100, 1–3. [CrossRef][PubMed]
3. Mellen, P.B.; Walsh, T.F.; Herrington, D.M. Whole grain intake and cardiovascular disease: A meta-analysis.Nutr. Metab. Cardiovasc. Dis. 2008, 18, 283–290. [CrossRef] [PubMed]

Foods 2016, 5, 24 12 of 13
4. Chanson-Rolle, A.; Meynier, A.; Aubin, F.; Lappi, J.; Poutanen, K.; Vinoy, S.; Braesco, V. Systematic Reviewand meta-analysis of human studies to support a quantitative recommendation for whole grain intake inrelation to type 2 diabetes. PLoS ONE 2015, 10, e0131377. [CrossRef] [PubMed]
5. Foster-Powell, K.; Brand Miller, J. International tables of glycemic index. Am. J. Clin. Nutr. 2002, 76, 5–56.[PubMed]
6. Eelderink, C.; Noort, M.W.; Sozer, N.; Koehorst, M.; Holst, J.J.; Deacon, C.F.; Rehfeld, J.F.; Poutanen, K.;Vonk, R.J.; Oudhuis, L.; et al. The structure of wheat bread influences the postprandial metabolic response inhealthy men. Food Funct. 2015, 6, 3236–3248. [CrossRef] [PubMed]
7. Della Valle, G.; Chiron, H.; Cicerelli, L.; Kansou, K.; Katina, K.; Ndiaye, A.; Whitworth, M.; Poutanen, K.Basic knowledge models for the Processing of Bread as a Solid Foam. Key Eng. Mater. 2014, 611–612, 901–908.[CrossRef]
8. Autio, K.; Parkkonen, T.; Fabritius, M. Observing structural differences in wheat and rye breads.Cereal Foods World 1997, 42, 702–705.
9. Lorenz, K. Rye Bread: Fermentation processes ABD products in the United States. In Handbook of DoughFermentations; Kulp, K., Lorenz, K., Eds.; Marcel Dekker Inc.: New York, NY, USA, 2003; pp. 159–191.
10. De Angelis, M.; Rizzello, C.G.; Alfonsi, G.; Arnault, P.; Cappelle, S.; di Cagno, R.; Gobbetti, M. Use ofsourdough lactobacilli and oat fibre to decrease the glycaemic index of white wheat bread. Br. J. Nutr. 2007,98, 1196–205. [CrossRef] [PubMed]
11. Juntunen, K.; Laaksonen, D.E.; Autio, K.; Niskanen, L.K.; Holst, J.J.; Savolainen, K.E.; Liukkonen, K.-H.;Poutanen, K.; Mykkänen, H. Structural differences between rye and wheat bread but not total fiber contentmay explain the lower postprandial insulin response to rye bread. Am. J. Clin. Nutr. 2003, 78, 957–964.[PubMed]
12. Östman, E.M.; Nilsson, M.; Liljeberg Elmståhl, H.G.M.; Molin, G.; Björck, I.M.E. On the effect of lacticAcid on Blood Glucose and Insulin Responses to Cereal Products: Mechanistic Studies in Healthy Subjectsand in Vitro. J. Cereal Sci. 2002, 36, 339–346. [CrossRef]
13. Rosén, L.A.; Östman, E.M.; Shewry, P.R.; Ward, J.L.; Andersson, A.A.; Piironen, V.; Lampi, A.M.; Rakszegi, M.;Bedö, Z.; Björck, I.M. Postprandial glycemia, insulinemia, and satiety responses in healthy subjects afterwhole grain rye bread made from different rye varieties. J. Agric. Food Chem. 2011, 59, 12139–12148.[CrossRef] [PubMed]
14. Rosén, L.A.; Blanco Silva, L.O.; Andersson, U.K.; Holm, C.; Östman, E.M.; Björck, I.M.E. Endosperm andwhole grain rye breads are characterized by low post-prandial insulin response and a beneficial bloodglucose profile. Nutr. J. 2009, 8, 42. [CrossRef] [PubMed]
15. Lappi, J.; Selinheimo, E.; Schwab, U.; Katina, K.; Lehtinen, P.; Mykkänen, H.; Kolehmainen, M.; Poutanen, K.Sourdough fermentation of wholemeal wheat bread increases solubility of arabinoxylan and protein anddecreases postprandial glucose and insulin responses. J. Cereal Sci. 2010, 51, 152–158. [CrossRef]
16. Englyst, H.N.; Kingman, S.M.; Cummings, J.H. Classification and measurement of nutritionally importantstarch fractions. Eur. J. Clin. Nutr. 1992, 46, S33–S50. [PubMed]
17. Granfeldt, Y.; Björck, I.; Drews, A.; Tovar, J. An in vitro procedure based on chewing to predict metabolicresponse to starch in cereal and legume products. Eur. J. Clin. Nutr. 1992, 46, 649–660. [PubMed]
18. Singh, J.; Dartois, A.; Kaur, L. Starch digestibility in food matrix: A review. Trends Food Sci. Technol. 2010,21, 168–180. [CrossRef]
19. Kong, F.; Singh, R.P. Disintegration of solid foods in Human Stomach. J. Food Sci. 2008, 73, R67–R80.[CrossRef] [PubMed]
20. Hernot, D.; Boileau, T.; Bauer, L.; Swanson, K.; Fahey, G., Jr. In Vitro Digestion characteristics of unprocessedand Processed Whole Grains and Their Components. J. Agric. Food Chem. 2008, 56, 10721–10726. [CrossRef][PubMed]
21. McCleary, B.V.; Solah, V.; Gibson, T.S. Quantitative measurement of total starch in cereal flours and products.J. Cereal Sci. 1994, 20, 51–58. [CrossRef]
22. Tenkanen, M.; Makkonen, M.; Perttula, M.; Viikari, L.; Teleman, A. ckraft pulp. J. Biotechnol. 1997, 57, 191–204.[CrossRef]
23. Asp, N.-G.; Johansson, C.-G.; Hallmer, H.; Siljeström, M. Rapid enzymatic assay of insoluble and solubledietary fiber. J. Agric. Food Chem. 1983, 31, 476–482. [CrossRef] [PubMed]

Foods 2016, 5, 24 13 of 13
24. European Brewery Convention (EBC) Analytica. Analytica EBC; Verlag Hans Carl Getranke-Fachverlag:Nürnberg, Germany, 1998.
25. Arbeitsgemeinschaft Getreideforschung e.V. Säuregrad—Brot und Sauerteig. In Standard-methoden fürGetreide, Mehl und Brot, 7th ed.; Verlag Moritz Schäfer: Detmold, Germany, 1994; pp. 283–288.
26. Leinonen, K.; Liukkonen, K.; Poutanen, K.; Uusitupa, M.; Mykkänen, H. Rye bread decreases postprandialinsulin response but does not alter glucose response in healthy Finnish subjects. Eur. J. Clin. Nutr. 1999,53, 262–267. [CrossRef] [PubMed]
27. Eelderink, C.; Schepers, M.; Preston, T.; Vonk, R.J.; Oudhuis, L.; Priebe, M.G.E. Slowly and rapidly digestiblestarchy foods can elicit a similar glycemic response because of differential tissue glucose uptake in healthymen. Am. J. Clin. Nutr. 2012, 96, 1017–1024. [CrossRef] [PubMed]
28. Brand, J.C.; Nicholson, PL.; Thorburn, A.W.; Truswell, A.S. Food processing and the glycemic index.Am. J. Clin. Nutr. 1985, 42, 1192–1196. [PubMed]
29. Burton, P.; Lightowler, H.J. Influence of bread volume on glycaemic response and satiety. Br. J. Nutr. 2006,96, 877–882. [CrossRef] [PubMed]
30. Katina, K.; Laitila, A.; Juvonen, R.; Liukkonen, K.-H.; Kariluoto, S.; Piironen, V.; Landberg, R.; Åman, P.;Poutanen, K. Bran fermentation as a means to enhance technological properties and bioactivity of rye.Food Microbiol. 2007, 24, 175–186. [CrossRef] [PubMed]
31. Liljeberg, H.G.M.; Björck, I.M.E. Delayed gastric emptying rate as a potential mechanism for loweredglycemia after eating sourdough bread: Studies in humans and rats using test products with added organicacids or an organic salt. Am. J. Clin. Nutr. 1996, 64, 886–893. [PubMed]
32. Poutanen, K.; Flander, L.; Katina, K. Sourdough and cereal fermentation in a nutritional perspective.Food Microbiol. 2009, 26, 693–699. [CrossRef] [PubMed]
33. Björck, I.; Östman, E.; Nilsson, A. Modulating glycaemia to cereal products. In Whole Grains and Health;Marquart, L., Jacobs, D., McIntosh, G., Poutanen, K., Reicks, M., Eds.; Blackwell Publishing: First. Ames,Iowa, USA, 2007; pp. 177–184.
© 2016 by the authors; licensee MDPI, Basel, Switzerland. This article is an open accessarticle distributed under the terms and conditions of the Creative Commons by Attribution(CC-BY) license (http://creativecommons.org/licenses/by/4.0/).