distance time graphs 16 jul 14. starter: 76 77 28 jan 14 time -distance graphs write in and...
TRANSCRIPT

Distance Time Graphs16 JUL 14
Starter:
76 7728 JAN 14 Time -Distance Graphs
Writ
e in
and
Calculate
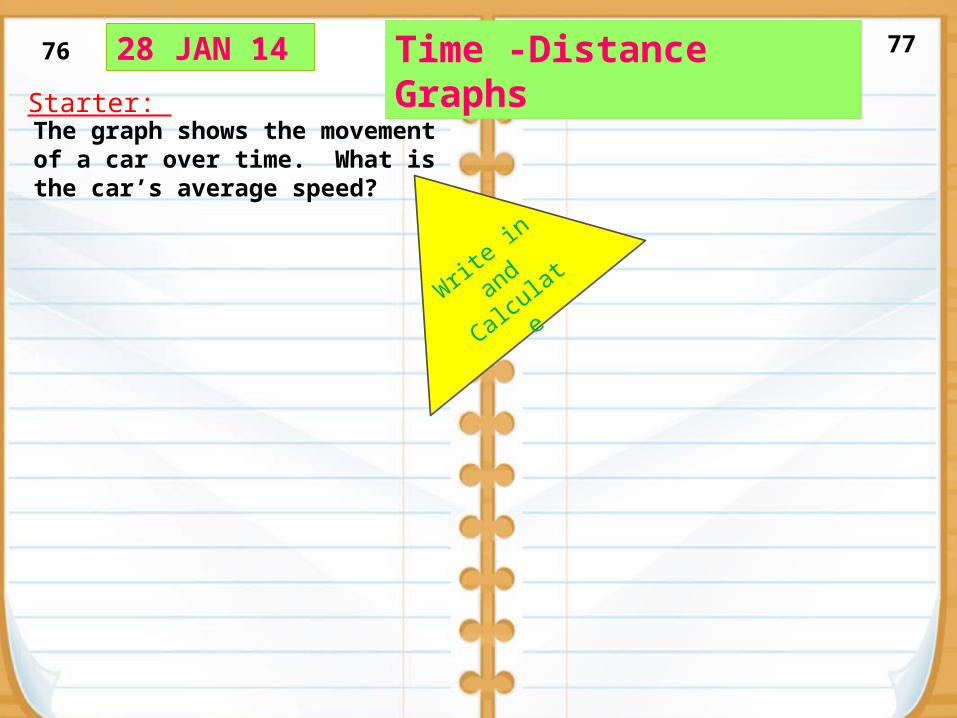
The graph shows the movement of a car over time. What is the car’s average speed?

The graph shows the movement of a car over time. What is the car’s average speed?
Starter:
Measure from here
𝑠𝑝𝑒𝑒𝑑=𝑑𝑖𝑠𝑡𝑎𝑛𝑐𝑒𝑡𝑖𝑚𝑒
𝑠𝑝𝑒𝑒𝑑=30𝑘𝑚2h
302
𝑠𝑝𝑒𝑒𝑑=¿𝑘𝑚h

Starter:
76 7728 JAN 14 Time -Distance Graphs
The graph shows the movement of a car over time. What is the car’s average speed?
Practice:
fill in th
e
blanks
and paste
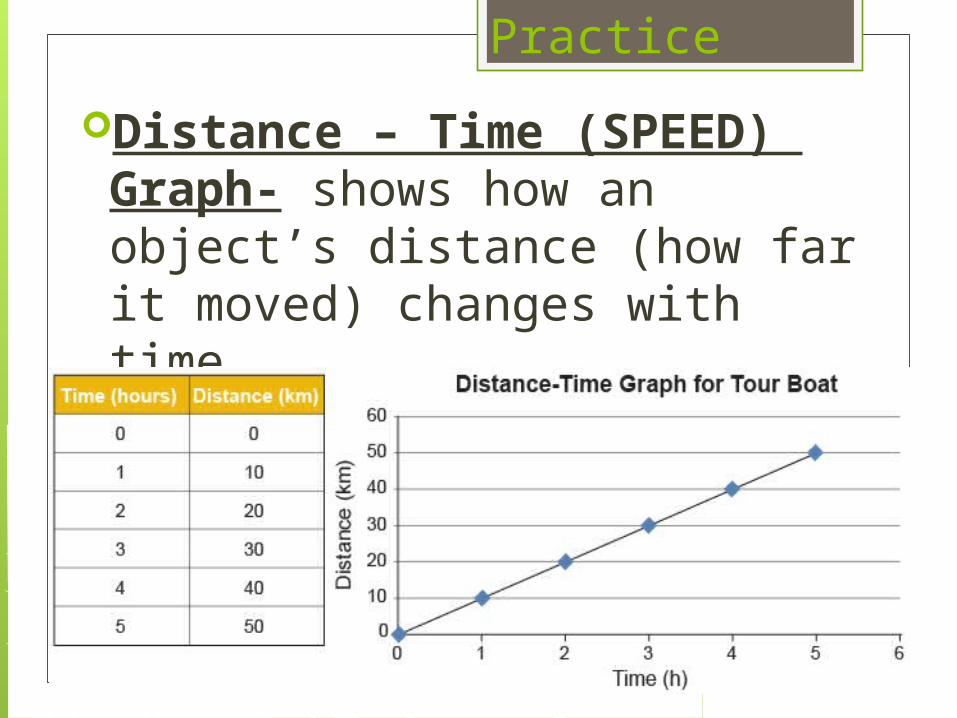
Distance – Time (SPEED) Graph- shows how an object’s distance (how far it moved) changes with time.
Practice
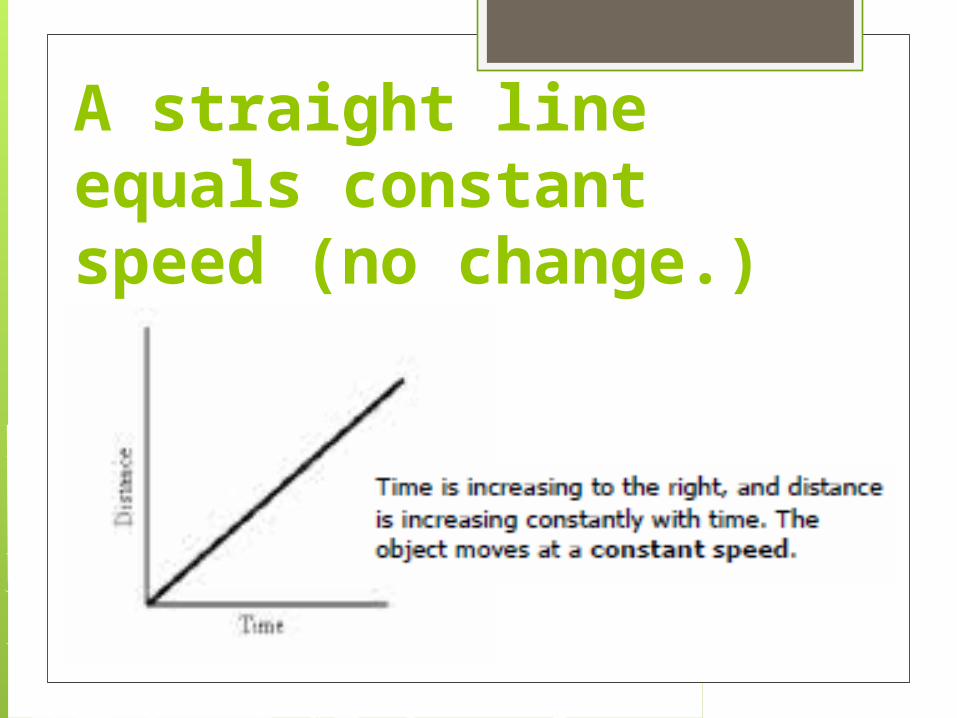
A straight line equals constant speed (no change.)

A steeper line means a larger distance moved over time or a higher speed.

A flat line means there is no motion, the object
is at rest.

A curved line means speeding up or slowing down.
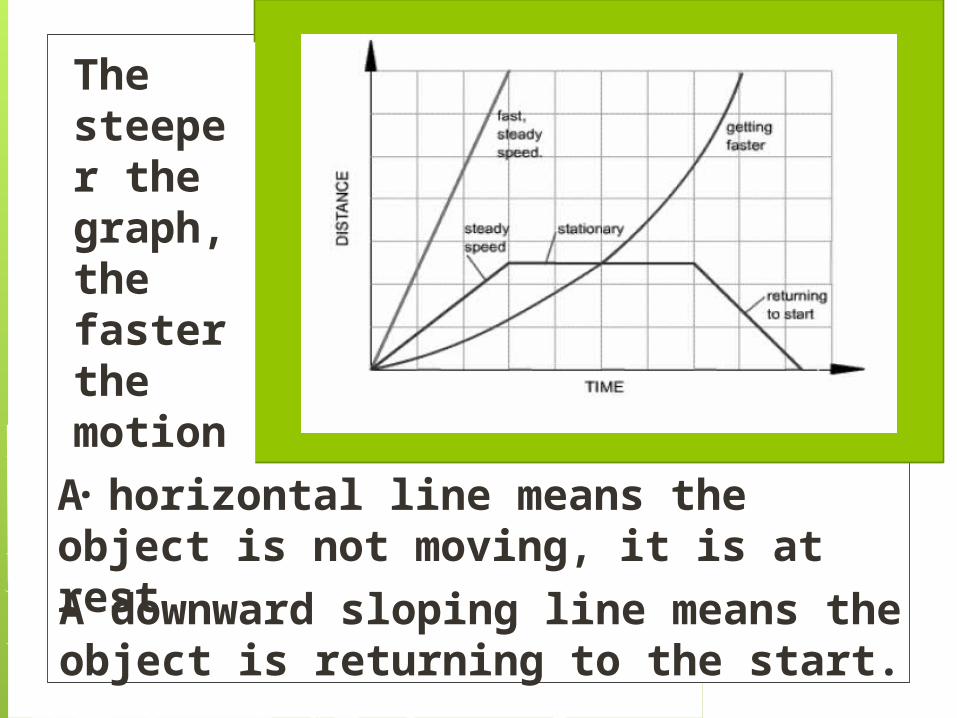
The steeper the graph, the faster the motion.A horizontal line means the object
is not moving, it is at rest
A downward sloping line means the object is returning to the start.

Starter:
76 7728 JAN 14 Time -Distance Graphs
The graph shows the movement of a car over time. What is the car’s average speed?
Practice:Glue in
strip of
graphs
Application/ connection:
Exit:

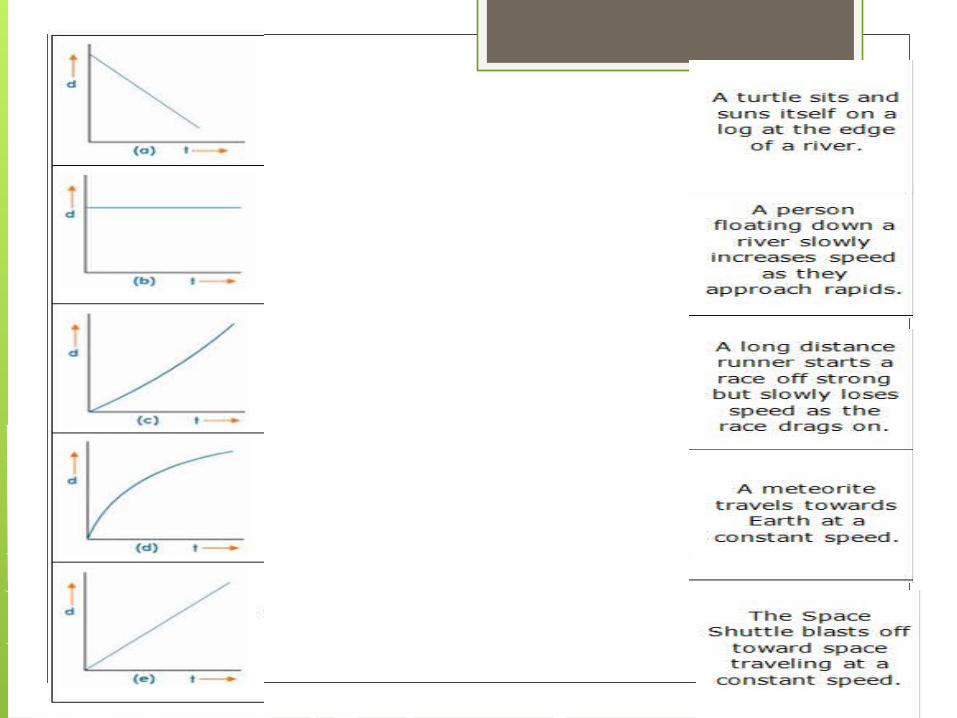
Application/connection:
Match the description to the correct graph.

Exit:
1. _______ won the race.2. _______ stopped for a rest. His rest was for
_________ seconds.3. Bob completed the race in ____________ seconds.