dissolved substances can move into and out of cells by diffusion diffusion is the spreading of the...
TRANSCRIPT
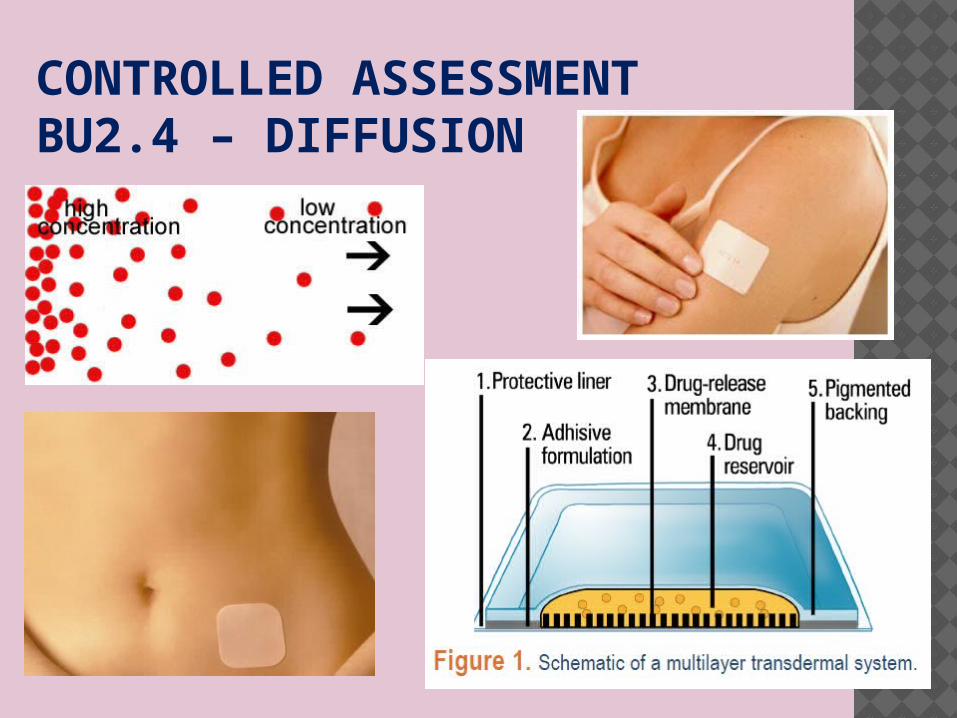
CONTROLLED ASSESSMENT BU2.4 – DIFFUSION

DISSOLVED SUBSTANCESDissolved substances can move into and out of cells by diffusion
Diffusion is the spreading of the particles of a liquid or a gas. The particles move from an area of higher concentration to an area of lower concentration.
High concentration outside Low concentration inside
Same concentration inside and outside
Oxygen required for respiration passes through cell membranes by diffusion.
3 ways to speed up diffusion
1 BIG difference in concentration2 LARGE surface area3 SHORT distance (ie THIN membrane)

CONTROLLED ASSESSMENT BU2.4 – DIFFUSIONDiffusion is the spreading of the particles of a gas, or of any substance in solution, resulting in a net movement from a region where they are of a higher concentration to a region with a lower concentration.
The greater the difference in concentration, the faster the rate of diffusion

CONTROLLED ASSESSMENT BU2.4 – DIFFUSION
Topic of investigation: the effect of a factor that may affect the rate of diffusion?
Investigate a factor that affects the rate of diffusion. Develop your OWN hypothesis Research possible methods to investigate it Develop a detailed plan for ONE method Fill in the RESEARCH NOTES sheet (BOTH sides) and
hand in to your teacher.
CANDIDATE RESEARCH NOTES
Fill in both sides of the sheet. Make sure you SIGN and DATE the front page.
It is important you put as much detail as you can BUT do not write outside the boxes.
When you have finished, your teacher will check your notes and sign the front if everything is complete. If they are handed back to you unsigned, you MUST make the improvements before you start the next stage of the assessment.

HYPOTHESIS
Not a guess Based on prior observations A statement not a question States that changing an independent variable will affect a
dependent variable A good hypothesis describes the direction of the
expected relationship if there is theory to support it Explain WHY you made this hypothesis – use the
statements ‘I think that ….’ and ‘This is because …’
Show your teacher a DRAFT on lined paper BEFORE you write on your Research Notes sheet

CONTEXT Nicotine patches are made of an
artificial membrane which delivers drugs to the blood stream.
The patch will need to have certain features enable the drug to get into the blood quickly (shorten the delivery time).
HINT
Which three factors affect the rate of diffusion? D… S…. a.... C…. difference
Which factor did you investigate? What was the relationship between this and the rate of diffusion?
Which part of the drug patch influences the factor you investigated?
For fast drug delivery, what should be done with this part of the patch?

Hazard Risk Control
Possible outcome: how could somebody be HARMED?ANDHow likely? Write low, medium or high risk
How to reduce the risk.“Be careful” is NOT enough!How could you prevent the risk from happening in the first place? NOT how you would deal with it after it happens
Name of the HAZARD, not just the object.
For example, water is not hazardous. Water on the floor is a hazard.
RISK ASSESSMENT
We recommend you use this table format, it saves a lot of space!Show your draft to your teacher before writing on the Research Notes sheet.
000022439Your emai

RESEARCH Read at least 2 sources. Look for descriptions of experiments
that investigate factors affecting the rate of diffusion, or explanations of how to speed up diffusion.
PLAN AHEAD! You have to squeeze FOUR lines of writing into a very small space! Draft it on another piece of paper first.
1. Select the most useful source and write down its Title, Author, Publisher and Date OR its Title and Web address.
2. Write WHY you thought this one was the most useful. Don’t judge by appearance, read what it says. It could explain the theory, or it includes clear safety information or the method shows the steps in detail.
3. Choose ONE source to reject and write down its Title, Author, Publisher and Date OR its Title and Web address.
4. Write clearly WHY you rejected it.
5. Show your teacher a DRAFT on lined paper BEFORE you write on your Research Notes sheet
EQUIPMENT LIST
List every item with sizes
Where possible include the range and resolution of the measuring instruments

METHOD IN NOTE FORM. DON’T WRITE FULL SENTENCES.
Variables MethodIndependent variable Name AND how it will be measured AND the RANGE and INTERVAL of its valuesDependent variableName AND how you will measure itControl variablesAt least TWO RELEVANT ones named AND for EACH one, how it will be controlled. Say what value it will be when you keep it constant.
PLAN AHEAD!
Not enough space in the Method section?Put the Variables beside the Equipment list
1. Step by step instructions
2. It is a good idea to number the steps
3. Make sure they are in a logical order
4. Finish with an instruction to repeat the whole thing again and calculate a mean.


It is difficult to work out the end point – the time at which all the dye has turned clear
Think about how you might overcome this

WRITING A METHOD: PRACTICE In Paper 1, you need to be able to
turn your notes into a clear, ordered Method.
You have limited space to write, so practise writing it on ONE side of A4 ONLY
Divide the space into sections and include all the details you have in your notes.
Use the Writing a Method Medal Sheet to help you.
Show your work to your teacher and make any changes they suggest.
Equipment Variables
Method1. 2. 3. 4. 5.
Hazard Risk Control

THINK PINK FOR LITERACY – GO GREEN TO IMPROVE• Well done – in this task you have:
To GO GREEN! You should now:
Over to you – re-write the THINK PINK section correcting the highlighted errors.
My response is …
Strengths, weaknesses and next steps
EK Range High School 2013
Bronze
Can you • List the equipment you need,
including at least one measuring instrument?
• Name the independent variable and the dependent variable?
• Give one way to make it a fair test?• State at least one safety
precaution?• Describe what to do during the
practical?
Silver
Can you• List all the apparatus, giving details of sizes or
types? • Identify and give the range and intervals or
values of the independent variable?• Identify and state how the dependent variable will
be measured?• Name at least two control variables and say how
they will be controlled?• Describe at least two hazards and link them to
their control measures?• Describe the sequence of the practical work using
correct English?
Gold
Can you• List all the apparatus, including the sizes or
types and the range and/or precision of all measuring instruments?
• Identify all relevant variables, stating how they will be measured and/or controlled?
• Write a 3-part risk assessment, linking at least two hazards with their associated risks and control measures?
• Describe the sequence of the practical work using almost faultless English?
Diamond
Can you explain• Your choice of key apparatus• How you selected the values of
the independent variable• Why it is important to control
extraneous variables?
Investigations: Writing a Method
This is what you need to doto get the full 9 marks in the Part 1 CAU exam
Gold
Can you• List all the apparatus, including the sizes
or types and the range and/or precision of all measuring instruments?
• Identify all relevant variables, stating how they will be measured and/or controlled?
• Write a 3-part risk assessment, linking at least two hazards with their associated risks and control measures?
• Describe the sequence of the practical work using almost faultless English?

RESULTS
Draw a blank table suitable for the method you have planned
It’s worth 2 marks Don’t forget to label each column clearly and write
the UNITS You MUST do this in EXAM CONDITIONS. Your teacher
should be able to mark it straight away but they CANNOT tell you what is wrong with it!
Make sure you write your NAME and hand it in.

PAPER 1 STRUCTUREQ1 Hypothesis 3 marks
USE your Research Notes.• Write your hypothesis• Explain why you made it.
Q2 Research sources 3 marks
USE your Research Notes• Identify two sources. • Say why you found one better
than the other.
Q3 Plan 9 marks
USE your Research Notes• Equipment list with details• Name the independent and dependent
variables, giving details of how they will be measured and the range and interval of the IV
• Identify the control variables and say how they should be kept the same
• Write instructions for the method in a logical order
• Write a 3-part Risk Assessment• Spelling, punctuation and grammar
MATTER for this question!
Q4 Methods 3 marksWhy is identifying the end point difficult?What could you do to overcome this?
Q5 Results table 2 marks
Your blank results table. This should have been done in a lesson. Make sure it is handed in.If you did not do one earlier, draw it in the space below the question.
Total 20 marks

THE PRACTICAL You may work individually or in groups You will be asked to use the equipment and follow the
method provided (this might not be the same as your own plan)
You should be given a photocopy of instructions to follow. If you do not understand what to do, make sure you ask for
help. You need to produce your own results table, with heading
and units and any repeat readings etc.
TAKE PART! Make sure the teacher sees you take some measurements and taking care to keep the control variables the same.

ANALYSING RESULTS You MUST do this by yourself Remember to use a SHARP PENCIL and a RULER Decide if it should be a bar chart or a line graph If the IV is categoric (labels), draw a BAR CHART If the IV is continuous (numbers that have been counted
or measured), draw a LINE GRAPH The graph is worth 4 marks.
Remember to make the graph take up more than half the page. Label both axes with the name and units. Accurate plotting of all points and a line of best fit are worth a mark each.
Your teacher cannot help you.

EXAM PART 2 You will have your Research Notes, table and graph with
you. There will be Secondary Data sheets for use with some
questions.
You will be required to: Analyse your own results and see if they support your
hypothesis Identify anomalous results and explain how you could make
use repeat readings to make your results more accurate Look at the variables in your experiment Evaluate methods and quality of data Report your findings in the context set.

PAPER 2 STRUCTUREQ1 Your investigation 15 marksUSE your Research Notes, Results and GraphWill ask about your own results and how they relate to some of the Key Terms, for example:• Can you see any patterns in your
results? – include examples.• Identify IV, state range of IV and explain
whether it was suitable. Examples from results
• Repeated readings and anomalous results: (Explain HOW you calculate a mean). How do repeats improve the results?
• Uncertainties: what are they and how can we reduce their effect?
• Reproducibility: how do results from other methods show if investigations are reproducible?
Make sure you know what the words on the AQA Glossary of Terms mean and can explain why they are important.
Q2 Secondary Data 8 marks• Sketch graph. Name and label both
axes, draw the SHAPE of line. NO points or numbers needed.
• Case studies 1, 2, 3. Explain whether each one supports the hypothesis. Write about ALL of them, identify each one clearly.
• Case study 4. Does the data support the statement? You will need to quote data.
Q3 Context 3 marksUSE your Research Notes.Explain how your investigation could be useful in context given.
Q4 Graph 4 marksYou should have already done this. Check it is ready to hand in: labels and units on both axes. ALL points accurate. LoBF smooth curve or ruled line as appropriate. Total 30 marks