dissolved and particulate phosphorus distributions and
TRANSCRIPT

University of South CarolinaScholar Commons
Theses and Dissertations
2015
Dissolved and Particulate PhosphorusDistributions and Elemental StoichiometryThroughout the Chukchi SeaMeryssa PiperUniversity of South Carolina
Follow this and additional works at: https://scholarcommons.sc.edu/etd
Part of the Marine Biology Commons
This Open Access Thesis is brought to you by Scholar Commons. It has been accepted for inclusion in Theses and Dissertations by an authorizedadministrator of Scholar Commons. For more information, please contact [email protected].
Recommended CitationPiper, M.(2015). Dissolved and Particulate Phosphorus Distributions and Elemental Stoichiometry Throughout the Chukchi Sea. (Master'sthesis). Retrieved from https://scholarcommons.sc.edu/etd/3671
DISSOLVED AND PARTICULATE PHOSPHORUS DISTRIBUTIONS AND ELEMENTAL
STOICHIOMETRY THROUGHOUT THE CHUKCHI SEA
by
Meryssa Piper
Bachelor of Science University of South Carolina, 2012
Submitted in Partial Fulfillment of the Requirements
For the Degree of Master of Science in
Marine Science
College of Arts and Sciences
University of South Carolina
2015
Accepted by:
Claudia Benitez-Nelson, Director of Thesis
Lori Ziolkowski, Reader
Tammi Richardson, Reader
Lacy Ford, SeniorVice Provost and Dean of Graduate Studies

ii
© Copyright by Meryssa M. Piper, 2015 All Rights Reserved.
iii
DEDICATION
To my parents, who have given their all to prepare me for life’s curves.
My best friends, may the time and effort you put into helping me be paid off with
interest.
And to my husband, who has given me his time, support and patience. To many more
chapters!

iv
ACKNOWLEDGEMENTS
I would like to begin by thanking my committee for their patience and support
throughout my thesis work. Dr. Claudia Benitez-Nelson, my main advisor, whom over
the past several years has provided mentorship aiding both in my personal and
professional experiences. Dr. Tammi Richardson, without whom I would have never
comprehended the biological workings of this project as well as oceanography as a
whole. Finally Dr. Lori Ziolkowski, who has consistently pushed me to think outside of
my realm. I am indebted to these women, as they have provided me with the skills to
stand my ground, worked diligently with me to bestow upon me the ability to
communicate across broad outlooks, and have proved excellent mentors both as women
and scientists.
A special appreciation must also be extended to my lab mates present and past,
former lab manager, Wendy Plessinger, family and friends. Blaire Umhau, Doug Bell,
Mariella Monge, and Kelly McCabe, who learned with me and provided encouragement
each step of the way. Annie Opseth and Sharmila Pal who provided mentorship and
friendship as senior graduate students. Daniel Wade, Victoria Garefino, and Emily
Palmer, who were patient with me as I learned to teach the phosphorus method. Wendy
Plessinger who taught me most everything I know about analytical chemistry, was patient
with me through my hard days, and always made a point to celebrate my good days.
Lastly my close friends and family, for putting up with my hectic schedule and various
attitudes, I couldn’t have done it without you!
v
ABSTRACT
As the only gateway of material, particularly nutrients, from the Pacific to the
Arctic Ocean, the biological and chemical transformations that occur within the Chukchi
Sea are critical for understanding Arctic ecosystems. This study examines the
biogeochemical cycling of the macronutrient phosphorus (P) relative to carbon and
nitrogen in the eastern Chukchi Sea during the ICESCAPE’s mission. Sea ice and water
column dissolved and particulate phosphorus samples were collected during two summer
expeditions in 2010 (n=593) and 2011 (n=989). Despite being a landlocked marginal sea,
the P pool present within the Chukchi Sea was substantially modified by biological
processes with 30-40% of the total dissolved pool (TDP) comprised of organic P (DOP)
and nearly 50% of total particulate P comprised of organic P forms. Surprisingly the
offshore waters held significantly higher concentrations of P in all forms throughout the
Chukchi Sea (TP2010 = 1.54 ± 0.64 µM, TP2011 = 1.58 ± 0.67 µM; ±1 standard deviation),
suggesting coastal inputs of P were relatively small during our sampling. This increase
offshore highlights the potential importance of sea ice melt in the addition of nutrients to
the surface waters. Upon the examination of ice cores collected, this study suggests that
the impact of sea ice melt depends heavily on whether the ice is clean or sediment-laden,
as their particulate C:N:P ratios vary by over a factor of 10. The dissolved data also
suggests the potential for N:P to be altered in favor nitrogen from 0.44 to 0.64, though
overall concentrations would be diluted throughout the mixed layer.
vi
TABLE OF CONTENTS
DEDICATION ....................................................................................................................... iii
ACKNOWLEDGEMENTS ........................................................................................................ iv
ABSTRACT ............................................................................................................................v
LIST OF TABLES .................................................................................................................. ix
LIST OF FIGURES ...................................................................................................................x
LIST OF ABBREVIATIONS ..................................................................................................... xi
CHAPTER 1 INTRODUCTION ...................................................................................................1
CHAPTER 2 MATERIALS AND METHODS ................................................................................4
2.1 STUDY SITE AND SAMPLE COLLECTION .................................................................4
2.2 SHIP BOARD ANALYSIS ..........................................................................................5
2.3 DISSOLVED ANALYSIS ...........................................................................................6
2.4 PARTICULATE ANALYSIS .......................................................................................7
2.5 STATISTICS ............................................................................................................8
CHAPTER 3 RESULTS ...........................................................................................................10
3.1 PHYSICAL REGIME ...............................................................................................10
3.2 WATER COLUMN DISSOLVED P ...........................................................................12
3.3 WATER COLUMN PARTICULATE P .......................................................................14
3.4 WATER COLUMN TOTAL P SPECIATION ................................................................15
3.5 WATER COLUMN ELEMENTAL STOICHIOMETRY ..................................................17
3.6 SEA ICE................................................................................................................19
vii
CHAPTER 4 DISCUSSION ......................................................................................................30
4.1 RIVERINE INPUTS AND BOTTOM RESUSPENSION ..................................................30
4.2 BIOLOGY .............................................................................................................32
4.3 THE ROLE OF SEA ICE ..........................................................................................34
CHAPTER 5 CONCLUSION ....................................................................................................37
REFERENCES .......................................................................................................................39
viii
LIST OF FIGURES
Figure 2.1 Station Map ........................................................................................................9
Figure 3.1 Total P Pool ......................................................................................................22
Figure 3.2 DIN:SRP by Depth ...........................................................................................23
Figure 3.3 POC:TPP/POP by Depth ..................................................................................24
Figure 3.4 PN:TPP/POP by Depth .....................................................................................25
Figure 3.5 POC:PN by Depth ............................................................................................26
Figure 3.6 Sea Ice Dissolved N and P Pools ......................................................................27
Figure 3.7 Sea Ice Particulate P Pool .................................................................................28
Figure 3.8 Sea Ice C:N:P Stoichiometry ............................................................................29

ix
LIST OF ABBREVIATIONS
DIN ........................................................................................ Dissolved Inorganic Nitrogen
DOP...................................................................................... Dissolved Organic Phosphorus
P .......................................................................................................................... Phosphorus
PC ............................................................................................................. Particulate Carbon
PIP .................................................................................... Particulate Inorganic Phosphorus
PN ......................................................................................................... Particulate Nitrogen
POC ............................................................................................ Particulate Organic Carbon
POP ..................................................................................... Particulate Organic Phosphorus
SRP ......................................................................................... Soluble Reactive Phosphorus
TDP .......................................................................................... Total Dissolved Phosphorus
TP .............................................................................................................. Total Phosphorus
TPP .......................................................................................... Total Particulate Phosphorus

1
CHAPTER 1
INTRODUCTION
The Arctic Ocean is undergoing significant changes in its physical and
biogeochemical environment due to rising water temperatures, melting sea ice, and
increases in riverine drainage (Arnell 2005, Serreze et al. 2007, Stroeve et al. 2012, Post
et al. 2013). The 2007-2010 average September sea ice extent shows a 40% decline
compared to measurements taken 20-30 years ago (Stroeve et al. 2012). Sea ice
distributions reached record lows in 2012. Furthermore models suggest that the entire
Arctic will become seasonally ice free as early as 2040 (Holland et al. 2006, Wang and
Overland 2009). Indeed, some Arctic seas have already begun to experience ice free
seasons, including the Chukchi Sea (Stroeve et al. 2012). Coincident with this loss of sea
ice, is a significant increase in primary production, mainly due to open water expansion
and duration of the open water season (Arrigo and van Dijken 2011). This increase in
water column primary production occurs simultaneously with dwindling sea ice primary
production, which likely contributes greater than 50% of the annual primary production
within the central Arctic (Gosselin et al. 1997). Sea ice loss also influences the timing of
blooms (allowing for blooms to occur earlier in the season with greater sunlight
penetration), disrupts predation, and may provide an important source of food to pelagic
and benthic biota (Leu et al. 2011).
As nutrient rich Pacific waters make their way through the only pathway to the
Arctic, the Chukchi Sea via the Bering Strait, they are impacted by a variety of processes,

2
including coastal inputs, sediment resuspension, redox reactions (e.g., denitrification),
variable ice cover, and primary production (Frey et al. 2014). Similar to the rest of the
Arctic Ocean, the Chukchi Sea has experienced an increase in water column primary
production of almost 50% over the past 15 years, one of the highest increases in primary
production throughout the region. This dramatic increase is likely due to greater light
penetration as a result of declining sea ice and enhanced melt ponding .,(Arrigo and van
Dijken 2011, Frey et al. 2011, Grebmeier 2012, Petrenko et al. 2013). It is important to
note, however, these estimates do not include primary productivity within or beneath sea
ice, such as the massive under ice bloom observed in 2011 (Arrigo et al. 2012).
Furthermore, nearly 70% of the resulting carbon fixed in the southeast Chukchi from
water column primary production is believed to settle to the sea floor where it can be
utilized by benthic fauna (Cooney and Coyle 1982, Walsh et al. 1989, McTigue et al.
2015).
Over the last decade, Pacific waters transported from the Chukchi into the
Beaufort Sea have declined by over 80%, despite the increase of water flow through the
Bering Strait (Brugler et al. 2014). Most of this decline has occurred during the summer
months; thus it is hypothesized that the intensifying summer easterly winds, which
counteract the north easterly flowing current along the shelf, are to blame for this large
scale decline (Moore 2012, Brugler et al. 2014, Frey et al. 2015). Modifications in water
circulation potentially impacts the magnitude and composition of the nutrients supplied to
the Arctic Ocean as well as biogeochemical cycling in the north Chukchi and Beaufort
seas.
3
Phosphorus (P) is an essential macronutrient that influences biological production
and community structures in a variety of marine systems (Karl 2014). Within the ocean, P
occurs in both organic and inorganic forms and is actively partitioned between dissolved
and particulate phases via a suite of biologically and chemically mediated reactions.
While many previous studies have focused mainly on inorganic P, as it is the most readily
available form (e.g., Benitez-Nelson 2000, Paytan and McLaughlin 2007) numerous
studies now recognize that organisms also utilize organic P compounds even when
inorganic P concentrations are relatively high (> 0.2 µM) (e.g., Mortazavil et al. 2000,
Dyhrman et al. 2006, Sylvan et al. 2006, Huang and Zhang 2010, Karl 2014). Therefore,
understanding the distribution and concentrations of all P forms is critical for examining
nutrient dynamics. Nevertheless, relatively little is known regarding its distribution
within marine dissolved and particulate matter in the Arctic Ocean, particularly in the
Chukchi Sea. In this study, we analyzed multiple water column and sea ice core samples
for dissolved and particulate P that were collected throughout the eastern Chukchi Sea
during the summers of 2010 and 2011 as part of the NASA’s Impact of Climate Change
on the Ecosystems and Chemistry of the Arctic Pacific Environment (ICESCAPE)
Mission. The goal of this study was to improve our understanding of the source,
composition, and distribution of dissolved and particulate P within this climate impacted
ecosystem.

4
CHAPTER 2
MATERIALS AND METHODS
2.1 Study Site and Sample Collection
As part of the ICESCAPE field mission, the Chukchi Sea was sampled during two
summer cruises, 15 June - 22 July 2010 and 25 June - 29 July 2011 aboard the USCGC
Healy (Figure 2.1). During the 2010 cruise, 140 water column (n=135) and ice (n=10)
stations were sampled from the Bering Strait northward to Barrow Canyon. Dissolved
and/or particulate P were sampled from 121 of these stations with 543 samples analyzed.
Due to decreased ice cover, the 2011 cruise extended from the Bering Strait northward to
the southern Beaufort Sea; 173 stations were sampled, including nine ice core stations.
Dissolved and/or particulate data was analyzed in 553 samples from 104 stations. All ice
stations were comprised of only first year ice. Both cruises encompassed sections of
major water masses. The Alaska Coastal Waters were identified by high temperatures
(>2°C) and salinities between 30 and 33.64, while the Chukchi Summer Waters were
characterized by lower temperatures (-1-2°C), but with similar salinities (Brugler et al.
2014). Bering Strait waters, while present, were more difficult to distinguish due to solar
warming of the mixed layer and relatively limited knowledge regarding its flow path
(Coachman et al. 1975). Atlantic deep waters were also sampled and characterized by
low temperatures (< -1.26°C) and high salinities (> 33.64) (Brugler et al. 2014).
Water column data was obtained by deploying a conductivity,
temperature, and depth sensor (CTD) on a rosette system equipped with twelve 10 L
5
Niskin bottles. The CTD/rosette system also included a photosynthetically available
radiation (PAR) sensor, and a fluorometer. Water samples were collected at various
depths (roughly 2, 10, 25, 50, 100, 200, 500, 1000, and 2000 m depending on water
depth) and analyzed for chlorophyll a, and dissolved inorganic nutrients (i.e. nitrate
silicate, phosphate).
Ice core data was collected using a custom built CRREL ice coring system
with a diameter of 10 cm. Cores used for nutrient analysis during the 2010 cruise (n = 21)
were melted in a known amount of filtered surface seawater (usually 2 L per 10 cm
section), with salinity measurements recorded pre and post melt. As such, no dissolved
nutrient data are available. These waters were then filtered for particulate P analysis onto
a 1N HCl washed and 500°C combusted 25 mm GF/F filter (~0.7 µm) and frozen until
lab analysis. In 2011, the ice cores used for nutrient analysis were melted without
dilution. Particulate and dissolved nutrient analyses were conducted on the resulting melt
water. During the 2010 cruise, there were visibly sediment laden sea ice cores, which
were later separated for comparison based on visual differences.
2.2 Ship board Analysis
Fluorescence data were collected at each station using a Wetlabs Chlorophyll
fluorometer. Additional samples for chlorophyll a analysis were filtered onto a 25 mm
Whatman GF/F (~0.7 µm) filter, placed in 5 mL of 90% acetone and extracted in the dark
at 3°C for 24 hours. Chlorophyll a concentrations were then measured fluorometrically
using a Turner fluorometer 10-Au (Holm-Hansen et al. 1965). Extracted chlorophyll
measurements were used to calibrate fluorescence based chlorophyll a measurements in
remaining samples (Arrigo et al. 2014).

6
Total inorganic nutrients (unfiltered) were analyzed on a segmented continuous
flow auto analyzer within a few hours of collection on the ship. [NO3-], [NO2
-] and
[Si(OH)4] analysis was performed using a modification of the method outlined by
Armstrong et al. (1967). While [NH4+] was determined fluorometrically according to
Kérouel and Aminot (1997), and [H2PO4-] was measured using the ammonium molybdate
method described in Bernhardt and Wilhelms (1967) (Brown et al. 2015).
2.3 Dissolved Analysis
Dissolved P samples were collected by filtering ~40 mL of seawater through a
500°C pre-combusted and 1N HCl washed, 25 mm GF/F filter (~0.7 µm) and frozen until
analysis. Soluble reactive P (SRP) was measured according to the spectrophotometric
method described in Koroleff (1983). Total dissolved P (TDP) was measured by the high
temperature ash/hydrolysis technique outlined in Monaghan and Ruttenberg (1999). Both
SRP and TDP analyses have a detection limit of 0.07 µM. Dissolved organic P (DOP)
was calculated based on the difference between the two measurements, i.e. TDP - SRP =
DOP. Approximately 11% of samples were run in duplicate, with an average coefficient
of variation (CV) of 6.0 ± 5.2%. It is important to note that SRP and DOP are analytically
defined; therefore SRP may contain acid-labile organic compounds, such as simple
sugars, while DOP may contain acid insoluble inorganic compounds, such as
polyphosphates (Monaghan and Ruttenberg 1999, Benitez-Nelson 2000). Comparison of
ship board auto-analysis versus laboratory SRP measurements found that auto-analyzed P
values were on average 13% greater than filtered SRP concentrations, likely due to the
presence of reactive particulate P.

7
2.4 Particulate Analysis
Samples for particulate nitrogen (PN) and particulate organic carbon (POC) were
filtered onto a pre-combusted 25 mm Whatman GF/F filter (~0.7 µm) and stored frozen
until analysis. The POC filters were fumed in a desiccator with concentrated HCl. The
PN and POC samples were subsequently dried at 60°C, and packed into tin capsules for
elemental analysis. Peach leaves and glutamic acid were used as calibration standards for
PN and POC (Mills et al. 2015). Particulate P samples were filtered onto a 500°C pre-
combusted, 1N HCl washed 25 mm Whatman GF/F filter (~0.7 µm), frozen and stored
until analysis. Ice core particulate total carbon (PC) and PN were analyzed from surplus P
filters.
Total particulate phosphorus (TPP) and particulate inorganic phosphorus
(PIP) were analyzed according to the ash/hydrolysis method outlined by Aspila et al.
(1976) as modified by Benitez-Nelson et al. (2007). Particulate organic phosphorus
(POP) was determined by the difference, i.e. TPP – PIP = POP. Recovery efficiency and
reproducibility for each sample set was assessed from the quadruplicate analysis of two
certified reference materials (NIST 1515, tomato leaves, certified 0.216% P by weight,
and NIST 1673a, estuarine sediment, certified 0.027% P by weight). The distinction
between PIP and POP concentrations is again operationally defined. Therefore it is
probable that the inorganic P fraction contains some labile organic P compounds and vice
versa (Benitez-Nelson et al. 2004). Approximately, 5% of the samples were run in
duplicate, with average CV of 5.3 ± 3.9%. Average GF/F filter blanks were below the
0.07 µM P limit of detection.
8
2.5 Statistics
All data sets were tested for normality using the Lillifor’s significance correction
K-S test (Lilliefors 1967). Much of the data experiences small departures from normality.
Due to their robust nature, parametric t-tests were used to determine significant
differences (p ≤ 0.05). One standard deviation is presented alongside all arithmetic means
and as error bars. When summed data are presented instead of means, total errors are
propagated using the analytical uncertainties of each measurement.
9
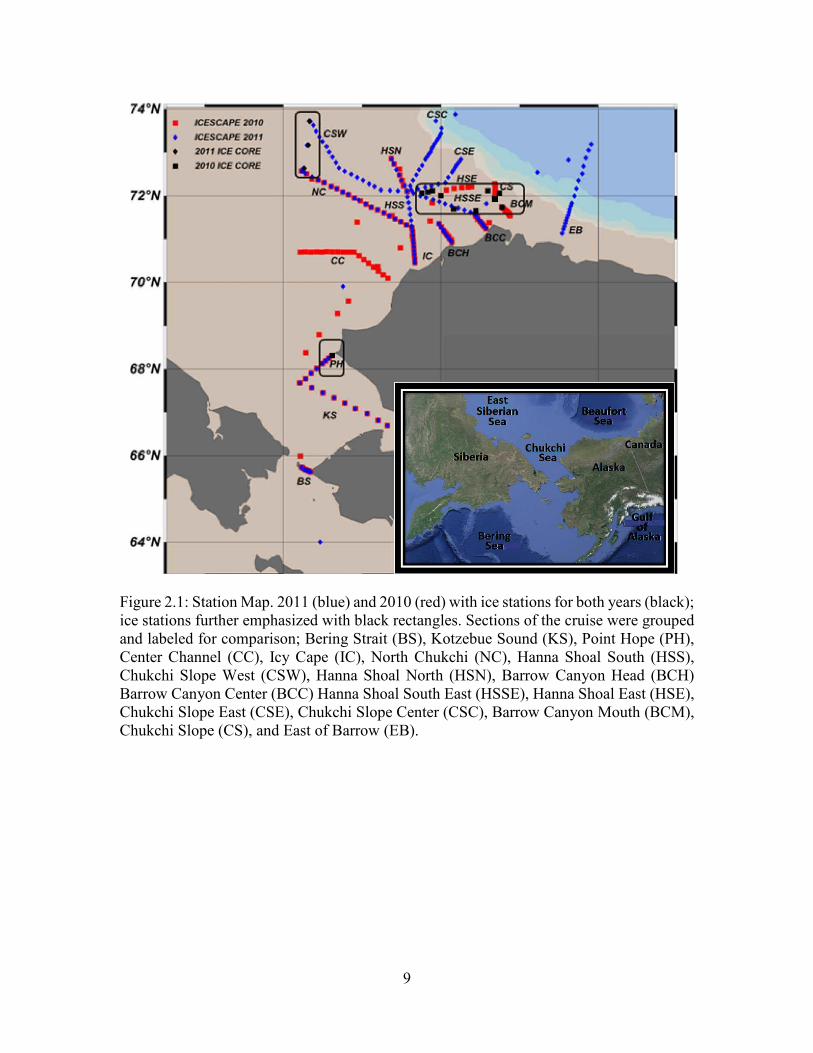
Figure 2.1: Station Map. 2011 (blue) and 2010 (red) with ice stations for both years (black); ice stations further emphasized with black rectangles. Sections of the cruise were grouped and labeled for comparison; Bering Strait (BS), Kotzebue Sound (KS), Point Hope (PH), Center Channel (CC), Icy Cape (IC), North Chukchi (NC), Hanna Shoal South (HSS), Chukchi Slope West (CSW), Hanna Shoal North (HSN), Barrow Canyon Head (BCH) Barrow Canyon Center (BCC) Hanna Shoal South East (HSSE), Hanna Shoal East (HSE), Chukchi Slope East (CSE), Chukchi Slope Center (CSC), Barrow Canyon Mouth (BCM), Chukchi Slope (CS), and East of Barrow (EB).
10
CHAPTER 3
RESULTS
3.1 Physical Regime
Waters make their way through the eastern Chukchi Sea in one of two major
water masses: the Alaskan Coastal Waters or the Chukchi Summer Waters (von Appen
and Pickart 2012, Brugler et al. 2014), which is also referred to as Bering Sea Water
(Gong and Pickart 2015), Summer Bering Sea Water (Steele et al. 2004), and Eastern
Chukchi Summer Water (Shimada et al. 2001). The Alaskan Coastal Waters are pumped
through the Chukchi Sea by the Alaskan Coastal Current (ACC) and remain trapped
within 50 m of the coast (Schumacher and Reed 1986). However, the Chukchi Summer
Waters (CSW) move through the Chukchi Sea in a variety of pathways. These waters
enter into the Arctic Ocean via four main routes: Long Strait, Herald Valley, Central
Channel, and Barrow Canyon. Barrow Canyon is the fastest flowing output with rates up
to 1Sv during the summer months, and is the major exit pathway assessed in this study
(Münchow et al. 1999, Weingartner et al. 2005). As waters exit Barrow Canyon, they are
squeezed into the Beaufort Shelf Jet, a narrow shelf break, as they make their way into
the Beaufort Sea (Pickart 2004, Nikolopoulos et al. 2009).
Between the 2010 and 2011 cruises, important differences in the physical regime
of the water column were observed. During the 2011 cruise, sea ice retreat was extensive,
allowing samples to be collected farther into the Chukchi Sea and into the Beaufort Sea.
This alteration in ice melt may have been caused in part by the increase in warm, fresh

11
waters entering Kotzebue Sound from the Noatak, Selawik, and Kobuk Rivers. The
warm water intrusion also resulted in an increase in stratification in 2011 relative to 2010.
The ACC was notably less constrained during 2011 and mixed with the Chukchi Summer
Waters. These water masses are therefore more difficult to identify, particularly in the
northern region. The Chukchi Sea Environmental Studies Program noted that the winds
during 2010 were weaker and more variable from July to September, while the 2011
northeasterly winds were more prominent and lasted from June to October
(www.Chukchiscience.com/science, 7 Nov. 2014). These winds contributed to the
observed decrease in the ACC strength, and a reduction in the Beaufort Shelf Jet during
2011 compared to that of 2010.
In order to better understand spatial and temporal differences, data were sorted by
year, transect, depth (mixed layer, mid waters, and bottom waters) as well as overall
region and water mass (inshore of ACC, referred to as inshore , the ACC, and offshore of
ACC waters, referred to as offshore). ACC waters were separated by specific sampling
depths according to measured temperatures and salinities (See Section 2.1) rather than by
entire stations, as many stations did not contain ACC waters throughout all depths
(Figure 3.1). Seventeen transects were analyzed, nine of which were sampled during
both cruises (Figure 2.1). The Barrow Canyon Center transect was chosen for direct
comparison to the Bering Strait transect because the Beaufort Shelf jet is a major outflow
pathway of ACC waters into the Arctic Ocean, and thus reflects the alterations that occur
to Pacific waters as they travel through the Chukchi Sea. Mixed layer depths were
determined by density differences greater than 0.125 corresponding to temperature
differences of 0.5°C as outlined by Monterey and Levitus (1997), with an average mixed
12
layer depth of 9 ± 8 m in 2010 and 9 ± 7 m in 2011. Bottom waters were defined as all
waters within 5 m of seafloor, and middle waters are defined as all waters falling between
the mixed layer and bottom waters.
3.2 Water Column Dissolved P
Dissolved P concentrations within the Chukchi Sea varied widely, from a
minimum of 0.39 µM in the mid waters of Kotzebue Sound in 2011, to a maximum of
3.61 µM within mid waters of Chukchi Slope West in 2011. Mixed layer SRP
concentrations ranged from 0.11 to 1.97 µM and averaged 0.60 ± 0.35 µM and 0.58 ±
0.21 µM in 2010 and 2011. DOP concentrations ranged from < 0.07 µM to 2.06 µM
averaging 0.52 ± 0.32 µM (46 ± 18% of TDP) and 0.46 ± 0.23 µM (43 ± 15% of TDP) in
2010 and 2011, respectively. There were no clear trends in either SRP or DOP with total
chlorophyll a. SRP concentrations in the mid-waters varied from 0.07 to 2.24 µM and
was significantly higher in 2011 versus 2010, 0.77 ± 0.42 µM versus 1.03 ± 0.50 µM (p
<0.001). Total dissolved P concentrations in the bottom waters had little interannual
variability averaging 1.64 ± 0.49 µM and 1.63 ± 0.60 µM in 2010 and 2011, respectively.
Bottom water SRP concentrations dominated the dissolved P pool (2010 = 67 ± 19% ;
2011 = 60 ± 23%), ranging from 0.31 to 2.23 µM and averaged 1.11 ± 0.51 µM and 1.06
± 0.49 µM in 2010 and 2011, respectively. DOP concentrations were significantly lower
(p < 0.001), ranging from < 0.7 to 2.17 µM and averaging 0.54 ± 0.38 µM and 0.60 ±
0.41 µM in 2010 and 2011.
Closer examination of the various water masses within the Chukchi Sea showed
significant differences between ACC and non ACC waters depending on the study year
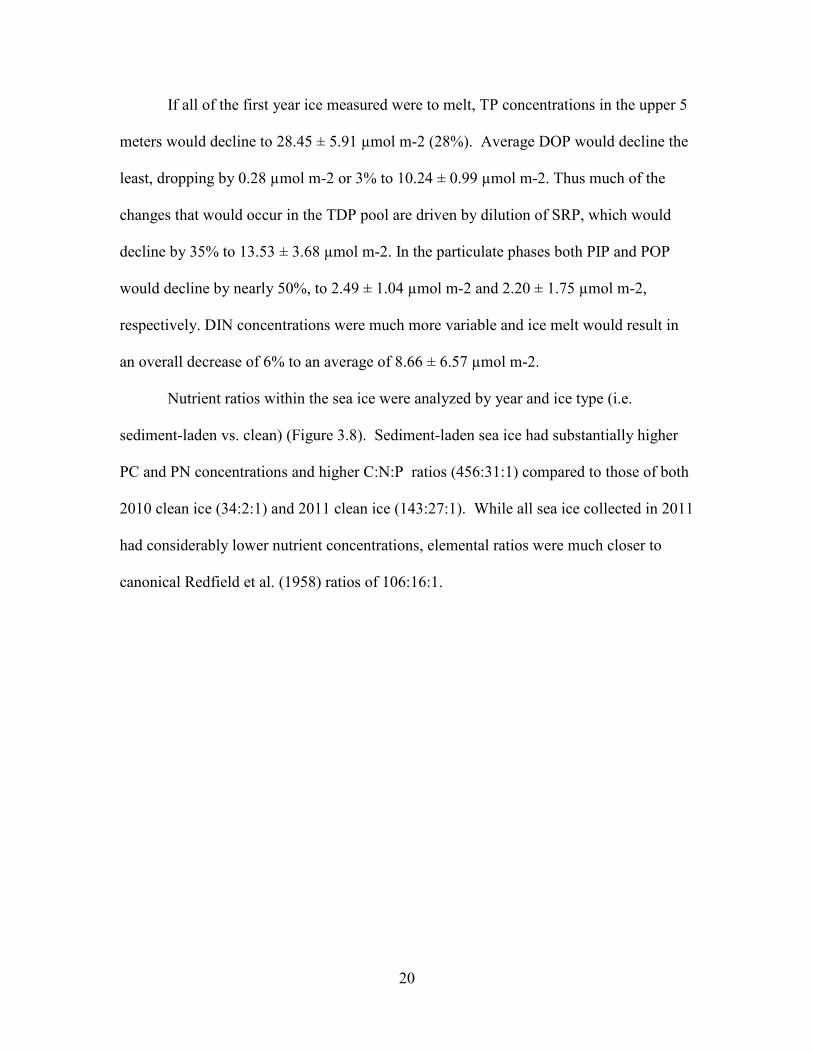
(Figure 3.1). SRP concentrations were similar in offshore waters, averaging 0.80 ± 0.46
13
µM in 2010 and 0.94 ± 0.49 µM in 2011. These concentrations however, were always
significantly higher than inshore waters, which averaged 0.57 ± 0.19 µM and 0.49 ± 0.13
µM, and ACC waters, which averaged 0.53 ± 0.28 µM and 0.58 ± 0.19 µM in 2010 and
2011, respectively (p < 0.001). In 2010, DOP concentrations consistently decreased from
inshore (0.69 ± 0.38 µM) to offshore (0.50 ± 0.3 6 µM; p = 0.016), while no significant
differences were observed in 2011 (average DOP concentrations of 0.49 ± 0.30 µM).
Combined, observed water mass and temporal differences drove overall changes in TDP
concentrations, with inshore waters decreasing from 1.26 ± 0.50 µM in 2010 to 1.01 ±
0.15 µM in 2011 (p = 0.029), offshore waters increasing from 1.19 ± 0.28 µM in 2010 to
1.41 ± 0.59 µM in 2011 (p = 0.007) and ACC waters remaining relatively unchanged.
On a regional basis, most of the variability observed in P concentrations and
composition occurred within the mixed layer, with average regional SRP concentrations
increasing from an average of 0.74 ± 0.43 µM in 2010 to 0.89 ± 0.48 µM in 2011 (p <
0.05) mainly due to higher SRP concentrations observed in three transects: North
Chukchi, Hanna Shoal North, and Barrow Canyon Center (data not shown). In contrast,
average DOP concentrations remained relatively similar, 0.52 ± 0.36 µM in 2010 and
0.49 ± 0.30 µM in 2011. High variability in both SRP and DOP concentrations
throughout the region resulted in similar average TDP concentrations of 1.26 ± 0.53 µM
in 2010 and 1.37 ± 0.57 µM in 2011. In comparing the dissolved P pools within waters
entering (Bering Strait) to those exiting (Barrow Canyon Center) no significant
concentration alterations were present within or among years (Table 1).
14
3.3 Water Column Particulate P
Particulate P concentrations within the Chukchi Sea were lower and more variable
than their dissolved counterparts and had no significant trends with depth or year. TPP
ranged from < 0.07 µM to a maximum of 1.44 µM. Mixed layer PIP concentrations
ranged from < 0.7 µM to 0.54 µM and averaged 0.12 ± 0.12 µM and 0.09 ± 0.07 µM in
2010 and 2011, respectively. POP concentrations ranged from < 0.07 µM to 0.95 µM
and averaged 0.10 ± 0.12 µM and 0.07 ± 0.08 µM in 2010 and 2011. Particulate P
concentrations were relatively stable with increasing depth. PIP concentrations in the
mid-waters averaged 0.12 ± 0.14 µM and 0.08 ± 0.11 µM in 2010 and 2011 and POP
concentrations averaged 0.11 ± 0.14 µM to 0.07 ± 0.10 µM. Bottom waters had similar
trends (PIP, 0.14 ± 0.13 µM to 0.14 ± 0.12 µM; POP, 0.10 ± 0.09 µM to 0.11 ± 0.14 µM
in 2010 and 2011 respectively).
Though low throughout the Chukchi Sea, TPP concentrations were always
significantly higher in offshore waters relative to both ACC and inshore waters during
both years, averaging 0.24 ± 0.26 µM and 0.17 ± 0.19 µM (p2010 and 2011 ACC <0.001,
p2010inshore = 0.024, p2011inshore <0.001) versus average ACC concentrations of 0.15
± 0.08 µM during both 2010 and 2011, and inshore values of 0.19 ± 0.16 µM in 2010 and
0.12 ± 0.05 µM in 2011. Offshore and inshore waters experienced significant declines in
particulate P concentrations relative to 2010 (poffshore < 0.001, and pinshore = 0.005).
Higher offshore particulate P concentrations were associated with significant increases in
chlorophyll a, which averaged 5.66 ± 9.27 µg L-1 and 3.28 ± 0.63 µg L-1 respectively (p
< 0.001). TPP concentrations in offshore waters were almost evenly divided between
POP and PIP concentrations (Figure 3.1). ACC and inshore waters contained
15
significantly lower PIP and POP concentrations (ACC, PIP = 0.09 ± 0.06 µM, 0.10 ±
0.05 µM during 2010 and 2011; inshore PIP = 0.09 ± 0.09 µM in 2010 and below
detection in 2011; ACC, POP = averaged below detection during both years; inshore POP
= 0.09 ± 0.10 in 2010 and below detection in 2011) and had little to no interannual
variability.
Unlike the dissolved P pool, the particulate P pools entering the Chukchi Sea
decreased significantly from 2010 to 2011, however the particulate P exiting via Barrow
Canyon Center remained relatively unchanged. During 2010 TPP declined 57%,
decreasing from an average of 0.30 ± 0.20 µM within the Bering Strait to 0.13 ± 0.08 µM
within Barrow Canyon Center (p < 0.001). This significant reduction was present in both
the inorganic and organic phases with PIP falling 58% to 0.08 ± 0.05 µM (p < 0.001) and
POP falling 45% to below detection limits (p = 0.015). There was little annual difference
present within Barrow Canyon center, however Bering Strait decreased by over half
within each of the particulate pools (p<0.001) from 2010 to 2011.
3.4 Water Column Total P Speciation
Between 2010 and 2011 cruises, the water column experienced no significant
changes in the regional average total phosphorus (TP) concentration, yet nearly all of the
particulate and dissolved components of the P pool varied significantly (p < 0.001)
between years, with the exception of DOP. On average, TP was comprised of 54 ± 17%
SRP, 34 ± 16% DOP, 7 ± 6% PIP and 5 ± 6% POP. Some transects remained relatively
constant in their TP concentrations and composition, while others were highly variable
(data not shown). For example, during 2010, the highest mixed layer TP concentrations
were measured in Central Channel, averaging 2.16 ± 0.76 µM, with the DOP fraction

16
dominating (44 ± 14%), whereas the mixed layer within Barrow Canyon Center had the
lowest TP concentrations (1.21 ± 0. 51 µM) and was almost equally split between SRP
and DOP. In 2011, the highest mixed layer TP concentrations were measured in Chukchi
Slope West (2.05 ± 0.75 µM) and the lowest concentrations were found East of Barrow
(1.23 ± 0.41 µM). SRP was the dominant component of both transects, 61 ± 15% and 69
± 15% respectively. There were no trends with increasing latitude.
Within the water column, a significant decline in mixed layer TP was observed,
decreasing from 1.35 ± 0.55 µM in 2010 to 1.19 ± 0.36 µM in 2011 (p = 0.003). In
contrast the mid-waters had small, but significant increases in TP from 1.52 ± 0.63 µM in
2010 to 1.65 ± 0.68 µM in 2011 (p = 0.046). The bottom waters did not experience any
annual change between 2010 and 2011, averaging 1.87 ± 0.64 µM.
During both cruise years, offshore TP concentrations were significantly higher
than ACC waters 1.54 ± 0.64 µM versus 1.24 ± 0.42 µM in 2010 (p < 0.001) and 1.58 ±
0.67 µM versus 1.27 ± 0.32 µM in 2011 (p < 0.001). During 2010, inshore water
concentrations fell between offshore and ACC waters to 1.46 ± 0.51 µM. In 2011 inshore
waters declined even further, down to 1.12 ± 0.16 µM. The most prevalent P pool within
inshore and ACC waters was the dissolved phase at 88 ± 5%, with similar distributions
between inorganic and organic pool and no significant changes with year. Offshore
waters consisted of a significantly different P pool as these waters were dominated
mainly by SRP (49 ± 17% in 2010 and 59 ± 17% in 2011). As waters made their way
through the Chukchi from Bering Strait to Barrow Canyon Center, little change in the
total P concentration occurred due to the dominance of the dissolved P pool during both
cruise years.

17
3.5 Water Column Elemental Stoichiometry
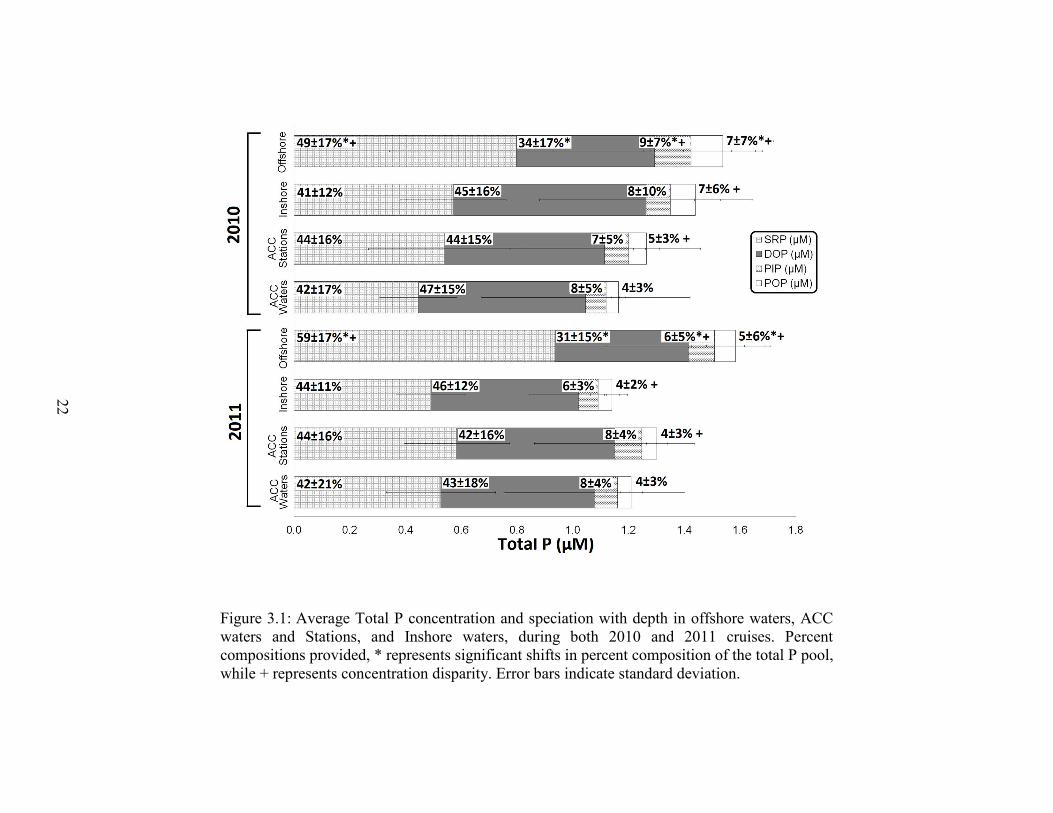
In order to place P pool concentrations and distributions in perspective, dissolved
and particulate P concentrations were compared to dissolved inorganic nitrogen (DIN =
NO3- + NO2- + NH4+) POC, and PN with depth (mixed layer, mid waters, bottom
waters) and with water mass (inshore, ACC, offshore) (Figure 3.2-3.5). In the mixed
layer, SRP concentrations were plentiful with respect to DIN in all inshore and ACC
waters (Figure 3.2). Offshore waters had bifurcated trends, with one data set
characterized by high SRP concentrations and below detection DIN, and a second data set
characterized by a DIN:SRP ratio of 5 (R2 = 0.29) (when all DIN data < 2 µM are not
considered). Moving deeper into the water column to the middle and deep waters,
nitrogen depletion was reduced, with a DIN:SRP ratio of 10:1 (R2 = 0.56) and 10:1 (R2 =
0.52) respectively. In 2011, Atlantic waters were also sampled and were characterized by
lower DIN:SRP ratios of 1.6:1 (R2 = 0.31). There were no significant differences
between sample years with regards to the DIN:SRP ratio (p > 0.05).
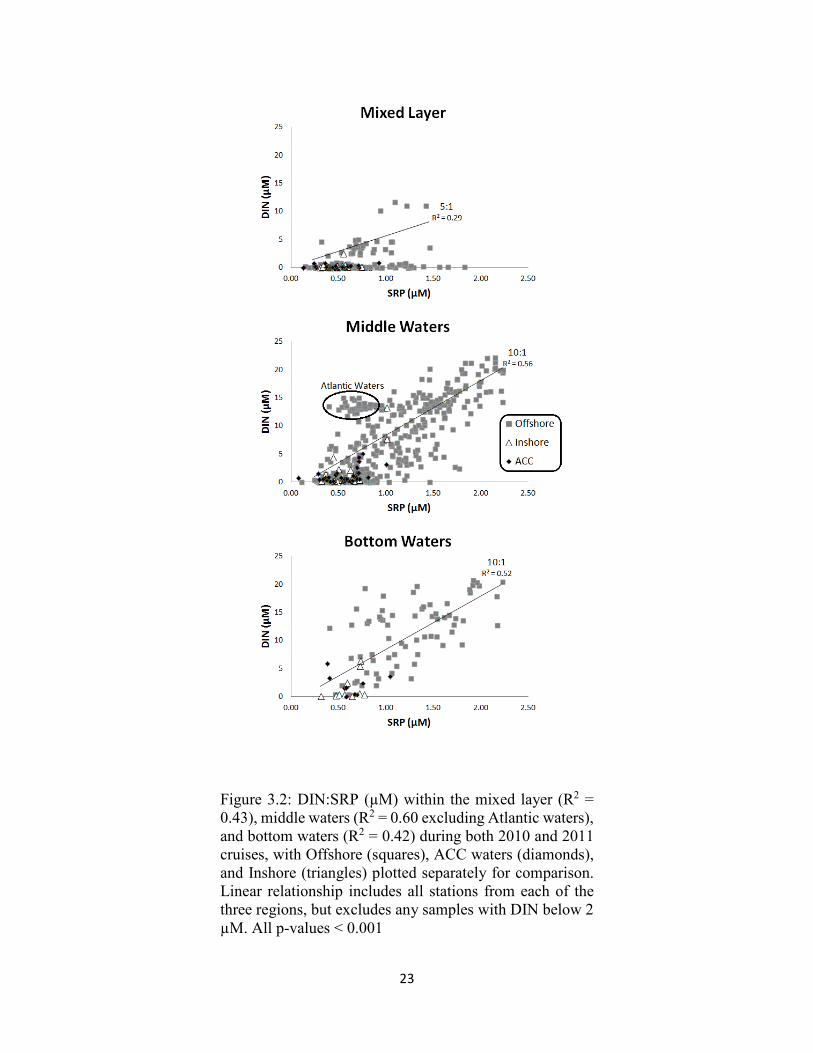
In order to understand particulate stoichiometry, POC and PN concentrations
versus both POP and TPP were examined (Figure 3.3 & 3.4). While TPP is typically
assumed to be derived solely from biological activity in the open ocean, coastal waters
are more complex due to terrigenous fluxes from the near shore that may add non-living
and mineral P (PIP) to the system (Benitez-Nelson, 2000). POP concentrations also
underestimate biologically derived inorganic P components, such as polyphosphate
(Hupfer et al. 2008). In contrast to the dissolved phase, particulate elemental ratios
varied not only with depth, but with year as well, and had similar trends across all water
masses, albeit data were limited.

18
Within the mixed layer, 69% of the PN concentration can be explained by
changes in POC with a POC: PN ratio of 8:1 (Figure 3.5). With depth, this relationship
moved closer to canonical Redfield et al. (1958) ratios of 7:1, with the correlation
increasing in strength to 81% and 75% within the mid and bottom waters respectively.
The POC:POP (TPP) ratio was higher than the Redfield ratio at 180:1 (R2 = 0.58),
however when the inorganic fraction is included the ratio fell to 104:1 and the
relationship was reduced in strength (R2 = 0.52) (Figure 3.3). A similar decline was
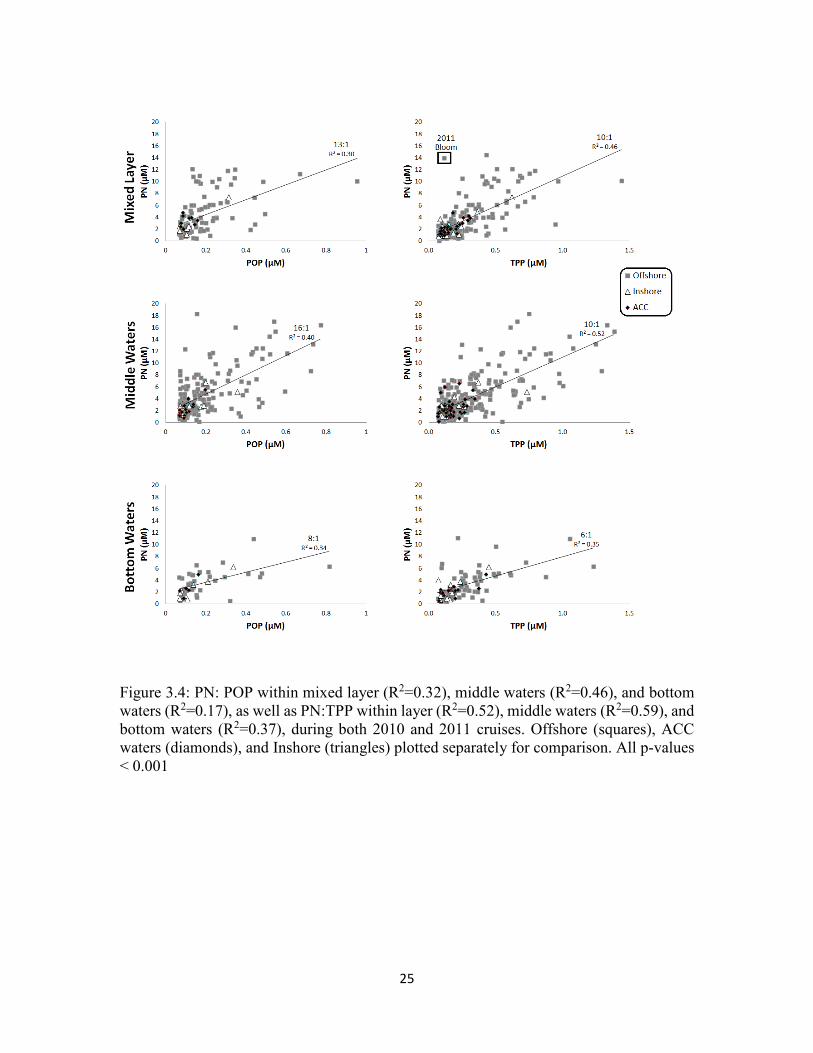
observed for PN to particulate P ratios as well, with a PN: POP ratio of 13:1 (R2 = 0.30)
and PN:TPP ratio of 10:1 (R2=0.46) (Figure 3.4). Samples collected during under ice
blooms in 2010 and 2011 were different from the bulk dataset and from one another, with
significantly higher POC: PN: POP (TPP) ratios of 898:52:1 (274:16:1) in 2010 and
below detection POP (784:124:1) in 2011 suggesting rapid biological uptake and
production of vey labile organic matter.
Middle waters were characterized by lower POC:POP (TPP), and POC: PN but
higher PN: POP (TPP) ratios than those measured in the surface and were consistent with
preferential remineralization of P relative to N with increasing depth, even in this shallow
sea (Figure 3.3-3.5). There were no significant differences between the various water
masses or with year. Deeper waters were characterized by significantly different
elemental ratios than those found in the mixed layer and in middle waters as ratios
decline and relationship strength was reduced.
DIN and SRP concentrations experience minute changes between the time they
enter the Chukchi Sea via the Bering Strait and exit via Barrow Canyon Center.
Furthermore, there were no significant dissolved nutrient patterns. In contrast, although
19
the particulate pool was only a small component of the total P pool, elemental ratios
declined from the Bering Strait (POC:PN:TPP = 2010 78:11:1, 2011 65:12:1) to Barrow
Canyon (201047:6:1, 201113:2:1) (Table 1). The declining relationship both from 2010
to 2011 and from Bering Strait to Barrow Canyon Center, was driven by the large scale
reduction in POC and PN concentrations. While POP and TPP concentrations also
declined, this decrease was not to the same extent, thus decoupling the relationships
between POC:POP (TPP) and PN:POP (TPP).
3.6 Sea Ice
In order to understand the potential role of sea ice melt on the underlying water
column, P inventories were determined within the entirety of each core compared to the
nutrient inventories measured in the corresponding mixed layer of the sampled station.
Mixed layer inventories were determined using a uniform depth of 5 m, as the average
mixed layer below the ice sheets was 5 ± 1 m in 2010 and 5 ± 4 m in 2011. Sea Ice SRP
and DOP concentrations were only measured in 2011 averaged 6.23 ± 0.80 µmol m-2 and
9.97 ± 4.42 µmol m-2 respectively, and showed no clear trends within each ice core
(Figure 3.6). While average TDP and SRP concentrations were significantly lower than
underlying mixed layer waters (p < 0.05), average DOP concentrations were similar.
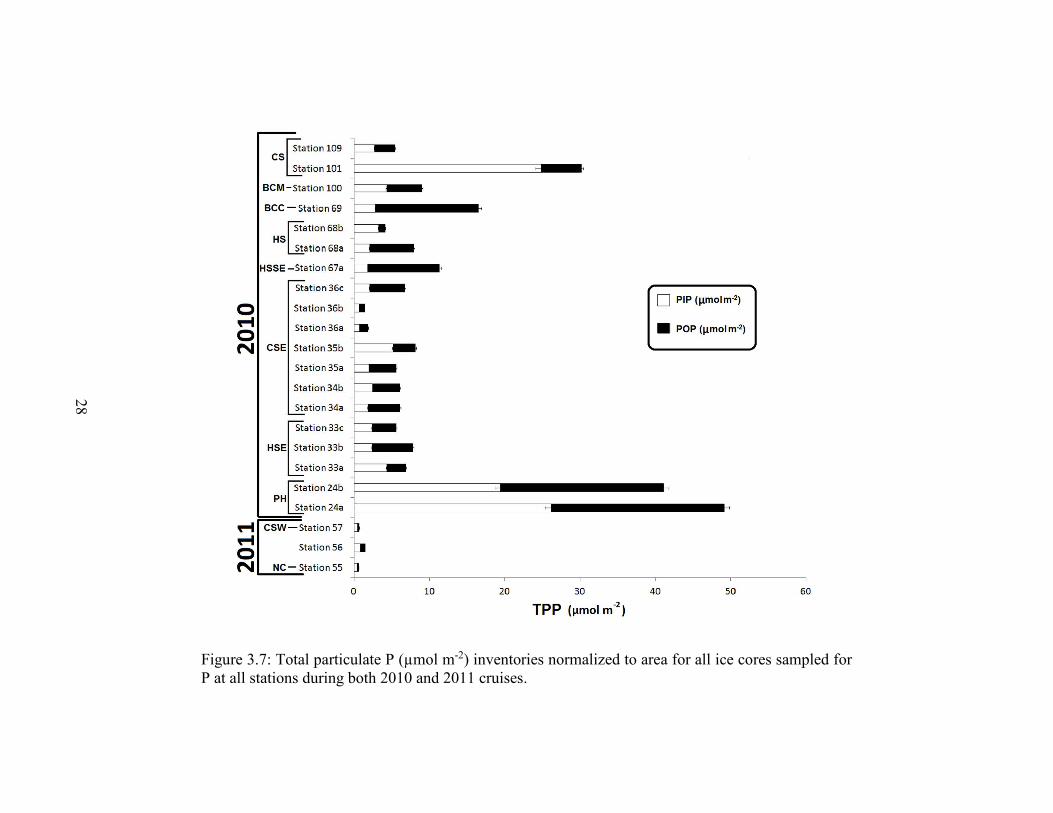
TPP and PIP concentrations were measured in both 2010 and 2011 and were significantly
different between years (Figure 3.7). In 2010, particulate P concentrations averaged
12.35 ± 12.93 µmol m-2 and 6.14 ± 7.86 µmol m-2, while in 2011, concentrations were
over 10 times lower, averaging 0.94 ± 0.47 µmol m-2 and 0.60 ± 0.23 µmol m-2. These
differences are likely due to sampling location (offshore in 2011, inshore in 2010)
although temporal differences cannot be dismissed.
20
If all of the first year ice measured were to melt, TP concentrations in the upper 5
meters would decline to 28.45 ± 5.91 µmol m-2 (28%). Average DOP would decline the
least, dropping by 0.28 µmol m-2 or 3% to 10.24 ± 0.99 µmol m-2. Thus much of the
changes that would occur in the TDP pool are driven by dilution of SRP, which would
decline by 35% to 13.53 ± 3.68 µmol m-2. In the particulate phases both PIP and POP
would decline by nearly 50%, to 2.49 ± 1.04 µmol m-2 and 2.20 ± 1.75 µmol m-2,
respectively. DIN concentrations were much more variable and ice melt would result in
an overall decrease of 6% to an average of 8.66 ± 6.57 µmol m-2.
Nutrient ratios within the sea ice were analyzed by year and ice type (i.e.
sediment-laden vs. clean) (Figure 3.8). Sediment-laden sea ice had substantially higher
PC and PN concentrations and higher C:N:P ratios (456:31:1) compared to those of both
2010 clean ice (34:2:1) and 2011 clean ice (143:27:1). While all sea ice collected in 2011
had considerably lower nutrient concentrations, elemental ratios were much closer to
canonical Redfield et al. (1958) ratios of 106:16:1.

21
Table 3.1: Average concentrations (± standard deviation) alongside nutrient ratios within the Bering Strait (n2010 = 28, n2011 = 12) and Barrow Canyon Center (n2010 = 27, n2011=24) transects. Bold letter indicates significant annual differences within sites (<0.05), while underlined text indicates interannual differences between sites (<0.05).
22
Figure 3.1: Average Total P concentration and speciation with depth in offshore waters, ACC waters and Stations, and Inshore waters, during both 2010 and 2011 cruises. Percent compositions provided, * represents significant shifts in percent composition of the total P pool, while + represents concentration disparity. Error bars indicate standard deviation.
23
Figure 3.2: DIN:SRP (µM) within the mixed layer (R2 = 0.43), middle waters (R2 = 0.60 excluding Atlantic waters), and bottom waters (R2 = 0.42) during both 2010 and 2011 cruises, with Offshore (squares), ACC waters (diamonds), and Inshore (triangles) plotted separately for comparison. Linear relationship includes all stations from each of the three regions, but excludes any samples with DIN below 2 µM. All p-values < 0.001
24
Figure 3.3: POC: POP within mixed layer (R2=0.42), middle waters (R2=0.48), and bottom waters (R2=0.13), as well as PN:TPP within layer (R2=0.54), middle waters (R2=0.59), and bottom waters (R2=0.30), during both 2010 and 2011 cruises. Offshore (squares), ACC waters (diamonds), and Inshore (triangles) plotted separately for comparison. All p-values < 0.001
25
Figure 3.4: PN: POP within mixed layer (R2=0.32), middle waters (R2=0.46), and bottom waters (R2=0.17), as well as PN:TPP within layer (R2=0.52), middle waters (R2=0.59), and bottom waters (R2=0.37), during both 2010 and 2011 cruises. Offshore (squares), ACC waters (diamonds), and Inshore (triangles) plotted separately for comparison. All p-values < 0.001

26
Figure 3.5: POC: PN within mixed layer (R2=0.67), middle waters (R2=0.81), and bottom waters (R2=0.72). Offshore (squares), ACC waters (diamonds), and Inshore (triangles) plotted separately for comparison. All p-values < 0.001

27
Figure 3.6: Total P and TN (µmol m-2) inventories normalized to area for the three ice core stations sampled for P during the 2011 cruise, error bars represent analytical error.
28
Figure 3.7: Total particulate P (µmol m-2) inventories normalized to area for all ice cores sampled for P at all stations during both 2010 and 2011 cruises.

29
Figure 3.8: Particulate C:N:P regression plots within 2010 sediment laden sea ice (C:N R2= ;C:P R2= ; N:P R2= ), 2010 clean ice (C:N R2= ;C:P R2= ; N:P R2= ), and 2011 clean ice(C:N R2= 0.64; C:P R2= 0.34; N:P R2= 0.55). All p-values < 0.00
30
CHAPTER 4
DISCUSSION
As P makes its way through the Chukchi Sea and into the Arctic Ocean, P
concentrations and composition are influenced by a variety of processes that include river
runoff, bottom resuspension, biological activity, and sea ice melt. Most of these processes
were evident during the 2010 and 2011 sampling periods, with the exception of
resuspension, causing significant regional variability.
4.1 Riverine Inputs and Bottom Resuspension
Given the coastal nature of our sampling, riverine inputs may potentially supply P
into the Chukchi Sea (e.g., Galloway et al. 1996, Ruttenberg 2003), particularly in
Kotzebue Sound. Previous studies however, show that both the Yukon and Mackenzie
rivers are relatively low in P (average fluxes of 1.9 x 10⁹ and 1.5 x 10⁹ g y-1 P)
particularly relative to N (average fluxes of 19 - 24 x 109 and 12.5 x 24*109 g y-1 N)
thus resulting in provided N:P ratios of about 10-13 and 8-16 respectively (Gordeev et al.
1996, Holmes et al. 2012, Le Fouest et al. 2013). This suggests that the smaller rivers
feeding directly into the eastern Chukchi Sea (e.g., Noatak, Selawik, and Kobuk Rivers)
are likely lower in P as well. Indeed, average dissolved P concentrations inshore of the
ACC, are consistently lower than offshore waters and there was no difference in inshore
P concentrations between 2010 and 2011(Figure 3.1). While an increase in suspended
particulate P is also possible, there was no clear evidence of high particulate P inshore
relative to offshore, suggesting that if particulate P was sourced by rivers, it was rapidly
31
removed from the system (Ruttenberg 2003, Benitez-Nelson 2000). Zhang et al. (2010)
examined sediment core nutrient concentrations and ratios inshore (near Icy Cape
transect), and found TN:TP to be 1.6, while total N to total organic P was much higher at
14.2. Their study highlights the dominance of terrestrial P within this shallow basin
Bottom resuspension is another potential source of P to marine systems,
particularly in shallow seas. However there was little evidence that bottom resuspension
occurred during our summer cruises. On rare occurrence (fewer than 21% of the bottom
water sampled), bottom water particulate P concentrations were elevated relative to that
measured in the overlying mid water and mixed layer. Increases in bottom water
dissolved P concentrations may occur due to resuspension or remineralization of P.
Souza et al. (2014b) found a significant efflux of P from sediments at stations located
within the inshore and offshore regions in this study area, but found uptake of phosphate
via sediments located within the ACC.
While increases in dissolved P occurred with increasing depth in the Chukchi Sea,
our data did not allow us to differentiate whether the increase was due to regeneration of
P from sediments or remineralization of P from sinking material from above. As
mentioned previously, sediment cores taken close in proximity to our sampling region are
characterized by N:P ratios of 14.2, considerably higher than the average N:P ratio of 6
measured in bottom waters in this study (Figure 3.4). This suggests that sediment
resuspension was not a dominant source of P to the water column during our study.
Rather, the decline in N:P ratios in bottom waters was likely due to preferential removal
of nitrogen via denitrification (see Section 4.2).

32
4.2 Biology
Phosphorus plays a key role in a number of biochemical reactions within marine
systems by influencing biological production as well as community composition and
food web structure (Karl 2014). In order to understand the potential role of P in the
Chukchi Sea, however, we need to consider both N and C as well. For decades, the
concept that all marine phytoplankton have a fixed “Redfield” ratio of C, N, to P has been
the foundation of numerous studies that examine carbon and nutrient biogeochemistry in
marine systems. In essence, any deviation in the elemental ratios of C , N, and P from
canonical Redfield ratios is often used to determine nutrient limitation or stress (Redfield
1958, Tyrrell 1999). However, the relationships between these elements are often
decoupled, particularly in nearshore regimes, owing to changes in nutrient source, food
web dynamics, and physical forcing (Karl et al. 1997, Weber and Deutsch 2010, Martin
et al. 2014).
During both the 2010 and 2011 ICESCAPE cruises within the Chukchi Sea,
dissolved and particulate N and P concentrations were poorly correlated relative to POC
and PN (Figure 3.2-3.5). In surface waters, dissolved N concentrations in the mixed layer
for most of our study region were below detection, suggesting strong N limitation,
consistent with other work (Cota et al. 1996, Mills et al. 2015). Only in offshore waters
and with increasing depth do dissolved nutrient relationships begin to emerge (Figure
3.2). When DIN is exhausted in surface waters, SRP concentrations remain high,
averaging 1.30 µM, with an N:P ratio < 2. As a result, there was a significant source of
dissolved P entering the Arctic Ocean within the surface waters alone and is a major
source of “excess” P relative to N within the Arctic Ocean. Indeed, recent studies
33
suggest that the Arctic Ocean as a whole is a net exporter of phosphate (~ 1.0 ± 0.3 kmol
s−1, net ± 1std error) to the North Atlantic (Torres-Valdés et al. 2013). In fact, this is
likely an underestimate of P, due to the high DOP concentrations and thus, high DOP
export to the Arctic Ocean. Such low dissolved N:P ratios within the Arctic Ocean
provide an ideal environment for nitrogen fixation and are likely a major driving factor
in the high nitrogen fixation rates observed downstream within the northern Atlantic
Ocean (Yamamoto-Kawai et al. 2006).
As one moves deeper into the water column SRP and DIN relationships begin to
emerge due to the remineralization of sinking organic matter. DIN:SRP ratios in offshore
mixed layer and mid waters throughout the Chukchi Sea ranged from 7-9.1 consistent
with biological activity associated with low N:P sinking material (see below, Martiny et
al. 2013), or removal of DIN via denitrification (Mills et al. 2015). Similar ratios were
presented in Souza et al.’s (2014) study of N:P within the surface and bottom waters
throughout the Chukchi Sea. Their findings indicate dissolved inorganic surface water
N:P ratios vary between 0.4 - 3.5 and deep water N:P ratios range from 6 - 15.
Particulate N:P ratios were also quite variable throughout the Chukchi Sea (Figure
3.4). It is now recognized that various groups of marine phytoplankton have N:P ratios
that span a factor of 5 or more (Geider and La Roche 2002, Bertilsson et al. 2003, Ho et
al. 2003, Martiny et al. 2013). Most of this N:P plasticity is attributed to the ability of
cyanobacteria to utilize nitrogen from the atmosphere for their nutritional N needs (e.g.,
nitrogen fixation) as well as the bioaccumulation of inorganic and oxidized organic P
forms that contain minimal N (e.g., polyphosphate or phospholipids) even during times
periods when dissolved P concentrations are quite low (< 0.05 µM) (Orchard et al. 2010,
34
Martin et al. 2014). Recently, Martiny et al. (2013) presented a global compilation of
particulate C:N:P ratios and found significantly lower ratios than traditional Redfield
within the polar regions (78:13:1). These low C:N:P ratios are generally the result of
high diatom abundances as they tend to utilize much more P relative to other
phytoplankton communities (Twining et al. 2004). Therefore, lower C:N:P values were
expected with the abundant diatom community present within the Chukchi Sea during the
2010-2011 sampling periods (Hill et al. 2005). Ratios may decline even further with
depth due to extensive denitrification in the mid and deep waters during our study (Mills
et al. 2015). Indeed, N:P ratios range from 6:1 to 16:1 depending on depth and the form
of particulate P used in the ratio analysis.
4.3 The Role of Sea Ice
Alterations in warm Pacific water movement is likely a dominating factor in the
increased sea ice melt specific to this region during 2011 (Brugler et al. 2014). As such,
the 2011 ICESCAPE’s cruise did not have the opportunity to sample sea ice in close
proximity to land masses, and extended farther north than the 2010 cruise. This earlier ice
retreat seemingly led to the increased stratification observed in 2011.
Within the sea ice there were large annual variations with 2010 ice cores
experiencing particulate P values up to 35 times higher than that measured in 2011 sea
ice (Figure 3.7). The reasoning behind this difference is unclear as it could be tied to both
annual and spatial variations. In 2010, sea ice cores were collected much closer to land
and were visibly more sediment laden. Although not all near shore (2010) samples were
sediment laden, they still held a considerably higher amount of particulate P. The
variability noted in both the dissolved and particulate P concentrations were as expected.
35
Sea ice, particularly in the shallow Chukchi Sea, reaches the seafloor, and therefore can
potentially include the benthos allowing for nutrient regeneration within the ice core
(Gradinger and Ikävalko 1998). All ice is not created equal, thus resulting in considerable
variability within each ice core. This patchiness is attributed to the depth at which the ice
was formed (Reimnitz et al. 1992), what kind of dust/snow inputs occurred in the region
(Ehn et al. 2004, Nomura et al. 2011), and when melt ponds were present or ice had
thinned, and the magnitude of biological production within the ice (Arrigo 2014, Garrison
et al.1986, Gradinger and Ikävalko 1998).
Variations in sea ice (i.e., sediment laden versus “clean”) have large impacts on
the nutrient ratios within the core, and thus, on the surrounding environment when the ice
melts (Figure 3.8). In 2010, sediment laden sea ice particulate C:N:P ratios of 456:31:1
were even higher than generally found in terrestrial environments (Elser et al. 2000). This
suggests that as N is added to the system during ice melt, the Chukhci Sea may become
less nitrogen limited for a transient period. Clean sea ice present must also be considered
in future implication of the nutrient pools. During the same cruise (2010) clean sea ice
nutrient ratios were significantly lower (34:2:1). As such, the addition of clean sea ice
melt would likely lead to the exacerbation of N limitation in this already N limited
system. Due to the higher nutrient ratios (168:30:1) examined in the offshore 2011 ice
cores, it is more likely that increased sea ice melt would alleviate nitrogen limitation and
therefore, increase water column primary production within the Chukchi Sea.
During the ICESCAPE cruises phytoplankton blooms occurred under ice,
possibly fueled by nutrient input from melting sea ice. Melnikov et al. (2002) found that
when ice was sampled in spring (April, just before ice melt), SRP concentrations were

36
much higher than concentrations observed in the following Fall, implying that phosphate
increases in sea ice over time. However, when nutrient inputs from sea ice melt are
adjusted to the volume of fresh water melted into the mixed layer, there is a significant
dilution effect. The dilution is relatively small for DIN, but significant for SRP, thereby
impacting the nutrient ratio. Given that Chukchi Sea blooms are likely nitrogen limited
(Hameedi 1978, Arrigo et al. 2012, Mills et al. 2015), dilution does not appear to inhibit
blooms from occurring; although it may impact the biological diversity, at least on a
transient basis, of responding organisms as ice melt expands.
37
CHAPTER 5
CONCLUSION
Due to climate change and biological abundance, studies within the Chukchi and
Beaufort seas have increased throughout the years. Many of these studies have aimed to
aid in scientific collections for NOAA fisheries service as a decision to open the Arctic
region to commercial fisheries. However as climate continues to change and the P supply
continues to shift, there could be a fundamental change in ecosystem structure within the
Chukchi Sea and Arctic region. This idea is not farfetched as the much studied Bering
Sea has encountered a shift from a benthic to a pelagic environment (Grebmeier 2012).
With increasing stratification due to winds (Brugler et al. 2014), resuspension may be
reduced in a future Arctic. DIN and SRP experience an anticipated relationship at several
stations in the offshore waters, likely because other sources of P are added to the system,
e.g., bottom water mixing, and coastal inputs are reduced. Due to the relatively small
amount of P data collected in this region it is unknown if the decoupling has always
occurred or whether it is a new or seasonal phenomenon.
The Arctic has been attributed to the increasing P concentration within the
Atlantic that fuels nitrogen fixation (Yamamoto-Kawai et al. 2006). This study shows the
drawdown of N:P occurs as waters travel through the Chukchi and make their way into
the Arctic. This study shows that this shift of N:P is likely due to the drastic draw down
of N rather than increasing P concentrations as waters make their way into the Atlantic.
This shift in N:P ratios will exacerbate the already N limited system. With sea ice adding
38
more N relative to P (though may still dilute both pools) it is possible that during the melt
season N will become less limiting than in prior years. This shift may also cause an
alteration in the phytoplankton community structure, further altering the nutrient
abundances and ratios in addition to the overall ecosystem (Twining et al. 2004).

39
REFERENCES
Armstrong, F.A.J., Stearns, C.R., Strickland, J.D.H., 1967. The measurement of upwelling and subsequent biological process by means of the Technicon Autoanalyzer® and associated equipment. Deep Sea Research and Oceanographic Abstracts, 14(3): 381-389.
Arnell, N.W., 2005. Implications of climate change for freshwater inflows to the Arctic Ocean. Journal of Geophysical Research: Atmospheres (1984–2012), 110(D7).
Arrigo, K.R., 2014. Sea Ice Ecosystems. Annual Review of Marine Science, 6(1): 439-467.
Arrigo, K.R. et al., 2012. Massive Phytoplankton Blooms Under Arctic Sea Ice. Science, 336(6087): 1408.
Arrigo, K.R. et al., 2014. Phytoplankton blooms beneath the sea ice in the Chukchi sea. Deep Sea Research Part II: Topical Studies in Oceanography, 105(0): 1-16.
Arrigo, K.R., van Dijken, G.L., 2011. Secular trends in Arctic Ocean net primary production. Journal of Geophysical Research: Oceans (1978–2012), 116(C9).
Aspila, K.I., Agemian, H., Chau, A.S.Y., 1976. A semi-automated method for the determination of inorganic, organic and total phosphate in sediments. Analyst, 101(1200): 187-197.
Benitez-Nelson, C., O'Neill, L., Kolowith, L.C., Pellechia, P., Thunell, R., 2004. Phosphonates and particulate organic phosphorus cycling in an anoxic marine basin. Limnology and Oceanography, 49(5): 1593-1604.
Benitez-Nelson, C.R., 2000. The biogeochemical cycling of phosphorus in marine systems. Earth-Science Reviews, 51(1): 109-135.
Benitez-Nelson, C.R., Madden, L.P.N., Styles, R.M., Thunell, R.C., Astor, Y., 2007. Inorganic and organic sinking particulate phosphorus fluxes across the oxic/anoxic water column of Cariaco Basin, Venezuela. Marine Chemistry, 105(1): 90-100.
Bernhardt, H., Wilhelms, A., 1967. The continuous determination of low level iron, soluble phosphate and total phosphate with the AutoAnalyzer, Technicon Symposia, pp. 385-389.
Bertilsson, S., Berglund, O., Karl, D.M., Chisholm, S.W., 2003. Elemental composition of marine Prochlorococcus and Synechococcus: Implications for the ecological stoichiometry of the sea. Limnology and Oceanography, 48(5): 1721-1731.
Brown, Z.W., Casciotti, K.L., Pickart, R.S., Swift, J.H., Arrigo, K.R., 2015. Aspects of the marine nitrogen cycle of the Chukchi Sea shelf and Canada Basin. Deep Sea Research Part II: Topical Studies in Oceanography(0).
Brugler, E.T. et al., 2014. Seasonal to interannual variability of the Pacific water boundary current in the Beaufort Sea. Progress in Oceanography, 127: 1-20.
Coachman, L.K., Aagaard, K., Tripp, R.B., 1975. Bering Strait: the regional physical oceanography. University of Washington Press.
40
Cooney, R., Coyle, K., 1982. Trophic implications of cross-shelf copepod distributions in the southeastern Bering Sea. Marine Biology, 70(2): 187-196.
Cota, G. et al., 1996. Nutrients, primary production and microbial heterotrophy in the southeastern Chukchi Sea: Arctic summer nutrient depletion and heterotrophy. Marine ecology progress series. Oldendorf, 135(1): 247-258.
Dyhrman, S. et al., 2006. Phosphonate utilization by the globally important marine diazotroph Trichodesmium. Nature, 439(7072): 68-71.
Ehn, J., Granskog, M.A., Reinart, A., Erm, A., 2004. Optical properties of melting landfast sea ice and underlying seawater in Santala Bay, Gulf of Finland. Journal of Geophysical Research: Oceans (1978–2012), 109(C9).
Elser, J.J. et al., 2000. Nutritional constraints in terrestrial and freshwater food webs. Nature, 408(6812): 578-580.
Frey, K. et al., 2014. Graduate School of Geography, Clark University, Worcester, MA, USA 2 Cryospheric Sciences Laboratory, NASA Goddard Space Flight Center, Greenbelt, MD, USA 3 Chesapeake Biological Laboratory, University of Maryland Center for Environmental Science, Solomons, MD, USA 4 Institute of Marine Research, Tromsø, Norway 5 Graduate School of Fisheries Sciences, Hokkaido University, Hokkaido, Japan.
Galloway, J. et al., 1996. Nitrogen and phosphorus budgets of the North Atlantic Ocean and its watershed, Nitrogen Cycling in the North Atlantic Ocean and its Watersheds. Springer, pp. 3-25.
Garrison, D.L., Sullivan, C.W., Ackley, S.F., 1986. Sea ice microbial communities in Antarctica. BioScience: 243-250.
Geider, R.J., La Roche, J., 2002. Redfield revisited: variability of C : N : P in marine microalgae and its biochemical basis. European Journal of Phycology, 37(1): 1-17.
Gong, D., Pickart, R.S., 2015. Summertime circulation in the eastern Chukchi Sea. Deep Sea Research Part II: Topical Studies in Oceanography.
Gordeev, V., Martin, J., Sidorov, I., Sidorova, M., 1996. A reassessment of the Eurasian river input of water, sediment, major elements, and nutrients to the Arctic Ocean. American Journal of Science, 296(6): 664-691.
Gosselin, M., Levasseur, M., Wheeler, P.A., Horner, R.A., Booth, B.C., 1997. New measurements of phytoplankton and ice algal production in the Arctic Ocean. Deep Sea Research Part II: Topical Studies in Oceanography, 44(8): 1623-1644.
Gradinger, R., Ikävalko, J., 1998. Organism incorporation into newly forming Arctic sea ice in the Greenland Sea. Journal of Plankton Research, 20(5): 871-886.
Grebmeier, J.M., 2012. Shifting patterns of life in the Pacific Arctic and sub-Arctic Seas. Marine Science, 4.
Hameedi, M.J., 1978. Aspects of water column primary productivity in the Chukchi Sea during summer. Marine Biology, 48(1): 37-46.
Hill, V., Cota, G., Stockwell, D., 2005. Spring and summer phytoplankton communities in the Chukchi and Eastern Beaufort Seas. Deep Sea Research Part II: Topical Studies in Oceanography, 52(24–26): 3369-3385.
Ho, T.-Y. et al., 2003. THE ELEMENTAL COMPOSITION OF SOME MARINE PHYTOPLANKTON1. Journal of Phycology, 39(6): 1145-1159.
41
Holland, M.M., Bitz, C.M., Tremblay, B., 2006. Future abrupt reductions in the summer Arctic sea ice. Geophysical Research Letters, 33(23).
Holm-Hansen, O., Lorenzen, C.J., Holmes, R.W., Strickland, J.D., 1965. Fluorometric determination of chlorophyll. Journal du Conseil, 30(1): 3-15.
Holmes, R.M. et al., 2012. Seasonal and annual fluxes of nutrients and organic matter from large rivers to the Arctic Ocean and surrounding seas. Estuaries and Coasts, 35(2): 369-382.
Huang, X.-L., Zhang, J.-Z., 2010. Spatial variation in sediment-water exchange of phosphorus in Florida Bay: AMP as a model organic compound. Environmental science & technology, 44(20): 7790-7795.
Karl, D. et al., 1997. The role of nitrogen fixation in biogeochemical cycling in the subtropical North Pacific Ocean. Nature, 388(6642): 533-538.
Karl, D.M., 2014. Microbially mediated transformations of phosphorus in the sea: New views of an old cycle. Annual Review of Marine Science, 6: 279-337.
Kérouel, R., Aminot, A., 1997. Fluorometric determination of ammonia in sea and estuarine waters by direct segmented flow analysis. Marine Chemistry, 57(3): 265-275.
Koroleff, F., 1983. Simultaneous oxidation of nitrogen and phosphorus compounds by persulfate. Methods of seawater analysis, 2: 205-206.
Le Fouest, V., Babin, M., Tremblay, J.É., 2013. The fate of riverine nutrients on Arctic shelves. Biogeosciences, 10(6): 3661-3677.
Leu, E., Søreide, J., Hessen, D., Falk-Petersen, S., Berge, J., 2011. Consequences of changing sea-ice cover for primary and secondary producers in the European Arctic shelf seas: timing, quantity, and quality. Progress in Oceanography, 90(1): 18-32.
Martin, P., Dyhrman, S.T., Lomas, M.W., Poulton, N.J., Van Mooy, B.A., 2014. Accumulation and enhanced cycling of polyphosphate by Sargasso Sea plankton in response to low phosphorus. Proceedings of the National Academy of Sciences, 111(22): 8089-8094.
Martiny, A.C. et al., 2013. Strong latitudinal patterns in the elemental ratios of marine plankton and organic matter. Nature Geoscience, 6(4): 279-283.
Melnikov, I.A., Kolosova, E.G., Welch, H.E., Zhitina, L.S., 2002. Sea ice biological communities and nutrient dynamics in the Canada Basin of the Arctic Ocean. Deep Sea Research Part I: Oceanographic Research Papers, 49(9): 1623-1649.
Mills, M.M. et al., 2015. Impacts of low phytoplankton NO 3−: PO 4 3− utilization ratios over the Chukchi Shelf, Arctic Ocean. Deep Sea Research Part II: Topical Studies in Oceanography.
Monaghan, E., Ruttenberg, K., 1999. Dissolved organic phosphorus in the coastal ocean: Reassessment of available methods and seasonal phosphorus profiles from the Eel River Shelf. Limnology and Oceanography, 44(7): 1702-1714.
Monterey, G., Levitus, S., 1997. Climatological cycle of mixed layer depth in the world ocean. US Government Printing Office, NOAA NESDIS, 5.
Mortazavil, B., Iversonl, R.L., Landing, W.M., Huang, W., 2000. Phosphorus budget of Apalachicola Bay: a river-dominated estuary in the northeastern. Mar Ecol Prog Ser, 198: 33-42.

42
Münchow, A., Weingartner, T.J., Cooper, L.W., 1999. The summer hydrography and surface circulation of the East Siberian shelf sea*. Journal of Physical Oceanography, 29(9): 2167-2182.
Nikolopoulos, A. et al., 2009. The western Arctic boundary current at 152 W: Structure, variability, and transport. Deep Sea Research Part II: Topical Studies in Oceanography, 56(17): 1164-1181.
Nomura, D., McMinn, A., Hattori, H., Aoki, S., Fukuchi, M., 2011. Incorporation of nitrogen compounds into sea ice from atmospheric deposition. Marine Chemistry, 127(1): 90-99.
Orchard, E.D., Benitez-Nelson, C.R., Pellechia, P.J., Lomas, M.W., Dyhrman, S.T., 2010. Polyphosphate in Trichodesmium from the low‐phosphorus Sargasso Sea. Limnology and Oceanography, 55(5): 2161-2169.
Paytan, A., McLaughlin, K., 2007. The oceanic phosphorus cycle. Chemical Reviews, 107(2): 563-576.
Petrenko, D., Pozdnyakov, D., Johannessen, J., Counillon, F., Sychov, V., 2013. Satellite-derived multi-year trend in primary production in the Arctic Ocean. International Journal of Remote Sensing, 34(11): 3903-3937.
Pickart, R.S., 2004. Shelfbreak circulation in the Alaskan Beaufort Sea: Mean structure and variability. Journal of Geophysical Research: Oceans (1978–2012), 109(C4).
Post, E. et al., 2013. Ecological consequences of sea-ice decline. Science, 341(6145): 519-524.
Redfield, A.C., 1958. The biological control of chemical factors in the environment. American scientist: 230A-221.
Reimnitz, E., Marincovich Jr, L., McCormick, M., Briggs, W., 1992. Suspension freezing of bottom sediment and biota in the Northwest Passage and implications for Arctic Ocean sedimentation. Canadian Journal of Earth Sciences, 29(4): 693-703.
Ruttenberg, K., 2003. The global phosphorus cycle. Treatise on geochemistry, 8: 585-643.
Schumacher, J., Reed, R., 1986. On the Alaska coastal current in the western Gulf of Alaska. Journal of Geophysical Research: Oceans (1978–2012), 91(C8): 9655-9661.
Serreze, M.C., Holland, M.M., Stroeve, J., 2007. Perspectives on the Arctic's shrinking sea-ice cover. Science, 315(5818): 1533-1536.
Shimada, K., Carmack, E.C., Hatakeyama, K., Takizawa, T., 2001. Varieties of shallow temperature maximum waters in the western Canadian Basin of the Arctic Ocean. Geophysical Research Letters, 28(18): 3441-3444.
Souza, A.C., Gardner, W.S., Dunton, K.H., 2014. Rates of nitrification and ammonium dynamics in northeastern Chukchi Sea shelf waters. Deep Sea Research Part II: Topical Studies in Oceanography, 102(0): 68-76.
Steele, M. et al., 2004. Circulation of summer Pacific halocline water in the Arctic Ocean. Journal of Geophysical Research: Oceans, 109(C2): C02027.
Stroeve, J.C. et al., 2012. Trends in Arctic sea ice extent from CMIP5, CMIP3 and observations. Geophysical Research Letters, 39(16).
Sylvan, J.B. et al., 2006. Phosphorus limits phytoplankton growth on the Louisiana shelf during the period of hypoxia formation. Environmental science & technology, 40(24): 7548-7553.
43
Torres-Valdés, S. et al., 2013. Export of nutrients from the Arctic Ocean. Journal of Geophysical Research: Oceans, 118(4): 1625-1644.
Twining, B.S., Baines, S.B., Fisher, N.S., 2004. Element stoichiometries of individual plankton cells collected during the Southern Ocean Iron Experiment (SOFeX). Limnology and Oceanography, 49(6): 2115-2128.
Tyrrell, T., 1999. The relative influences of nitrogen and phosphorus on oceanic primary production. Nature, 400(6744): 525-531.
von Appen, W.-J., Pickart, R.S., 2012. Two configurations of the western Arctic shelfbreak current in summer. Journal of Physical Oceanography, 42(3): 329-351.
Walsh, J. et al., 1989. Carbon and nitrogen cycling within the Bering/Chukchi Seas: source regions for organic matter effecting AOU demands of the Arctic Ocean. Progress in Oceanography, 22(4): 277-359.
Wang, M., Overland, J.E., 2009. A sea ice free summer Arctic within 30 years? Geophysical Research Letters, 36(7).
Weber, T.S., Deutsch, C., 2010. Ocean nutrient ratios governed by plankton biogeography. Nature, 467(7315): 550-554.
Weingartner, T. et al., 2005. Circulation on the north central Chukchi Sea shelf. Deep Sea Research Part II: Topical Studies in Oceanography, 52(24): 3150-3174.
Yamamoto-Kawai, M., Carmack, E., McLaughlin, F., 2006. Nitrogen balance and Arctic throughflow. Nature, 443(7107): 43-43.
Zhang, J.-Z., Guo, L., Fischer, C.J., 2010. Abundance and chemical speciation of phosphorus in sediments of the Mackenzie River Delta, the Chukchi Sea and the Bering Sea: importance of detrital apatite. Aquatic geochemistry, 16(3): 353-371.