dissolution similarity testing for demonstration of ......conclusion: for test condition #2,...
TRANSCRIPT
FDA’s Current Practice and Challenges in the Use of Dissolution Similarity Testing for Demonstration of
Bioequivalence – Case Studies
Zhen Zhang, Ph.D.Division of Bioequivalence I
Office of BioequivalenceOffice of Generic Drugs, CDER, FDA
Dissolution Similarity WorkshopUniversity of Maryland School of Pharmacy, May 21-22, 2019
2
Disclaimer
The views and opinions presented here represent those of the speaker and should not be considered to represent advice or guidance on behalf of the U.S. Food and Drug Administration
www.fda.gov
3
Outline
• Definition of Dissolution Similarity
• Dissolution Similarity in Bioequivalence Determination
• Office of Bioequivalence’s Current Practice and Challenges: Four Case Studies
• Summary/Challenges
www.fda.gov
4
Definition of Dissolution Similarity
• Dissolution profiles may be considered similar by virtue of overall profile similarity (e.g., f2 ≥ 50)1, 2, 3, 4, 5 and similarity at every dissolution sample time point (e.g., ≤ 15%) 1, 3, 4. – Profile Comparison
• When both test and reference products dissolve 85 percent or more of the label amount of the drug in 15 minutes using all three dissolution media, the profile comparison with an f2 test is unnecessary5. – Point Comparison
• To allow the use of mean data, the coefficient of variation should not be more than 20 percent at the earlier time points (e.g., 15 minutes), and should not be more than 10 percent at other time points1, 5. – Low variability
www.fda.gov
5
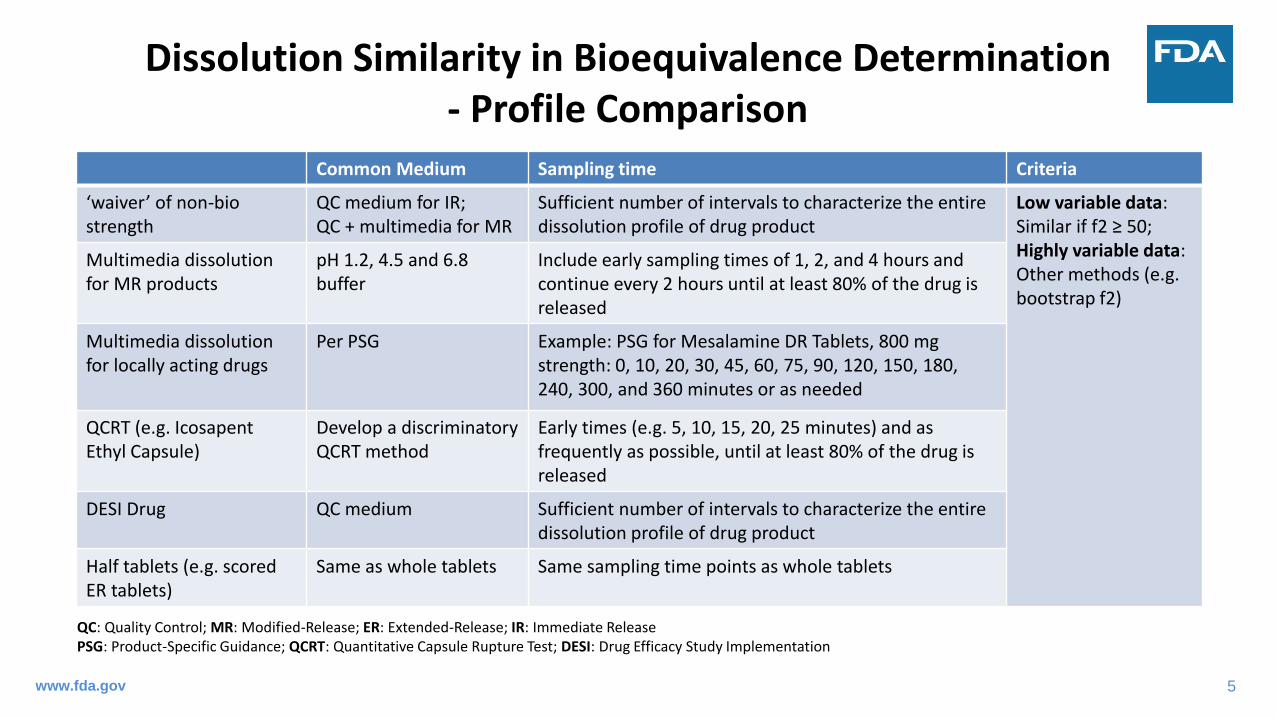
Dissolution Similarity in Bioequivalence Determination- Profile Comparison
Common Medium Sampling time Criteria
‘waiver’ of non-bio strength
QC medium for IR; QC + multimedia for MR
Sufficient number of intervals to characterize the entire dissolution profile of drug product
Low variable data: Similar if f2 ≥ 50; Highly variable data: Other methods (e.g. bootstrap f2)
Multimedia dissolution for MR products
pH 1.2, 4.5 and 6.8 buffer
Include early sampling times of 1, 2, and 4 hours and continue every 2 hours until at least 80% of the drug is released
Multimedia dissolution for locally acting drugs
Per PSG Example: PSG for Mesalamine DR Tablets, 800 mg strength: 0, 10, 20, 30, 45, 60, 75, 90, 120, 150, 180, 240, 300, and 360 minutes or as needed
QCRT (e.g. IcosapentEthyl Capsule)
Develop a discriminatory QCRT method
Early times (e.g. 5, 10, 15, 20, 25 minutes) and as frequently as possible, until at least 80% of the drug is released
DESI Drug QC medium Sufficient number of intervals to characterize the entire dissolution profile of drug product
Half tablets (e.g. scored ER tablets)
Same as whole tablets Same sampling time points as whole tablets
QC: Quality Control; MR: Modified-Release; ER: Extended-Release; IR: Immediate ReleasePSG: Product-Specific Guidance; QCRT: Quantitative Capsule Rupture Test; DESI: Drug Efficacy Study Implementation
www.fda.gov
6
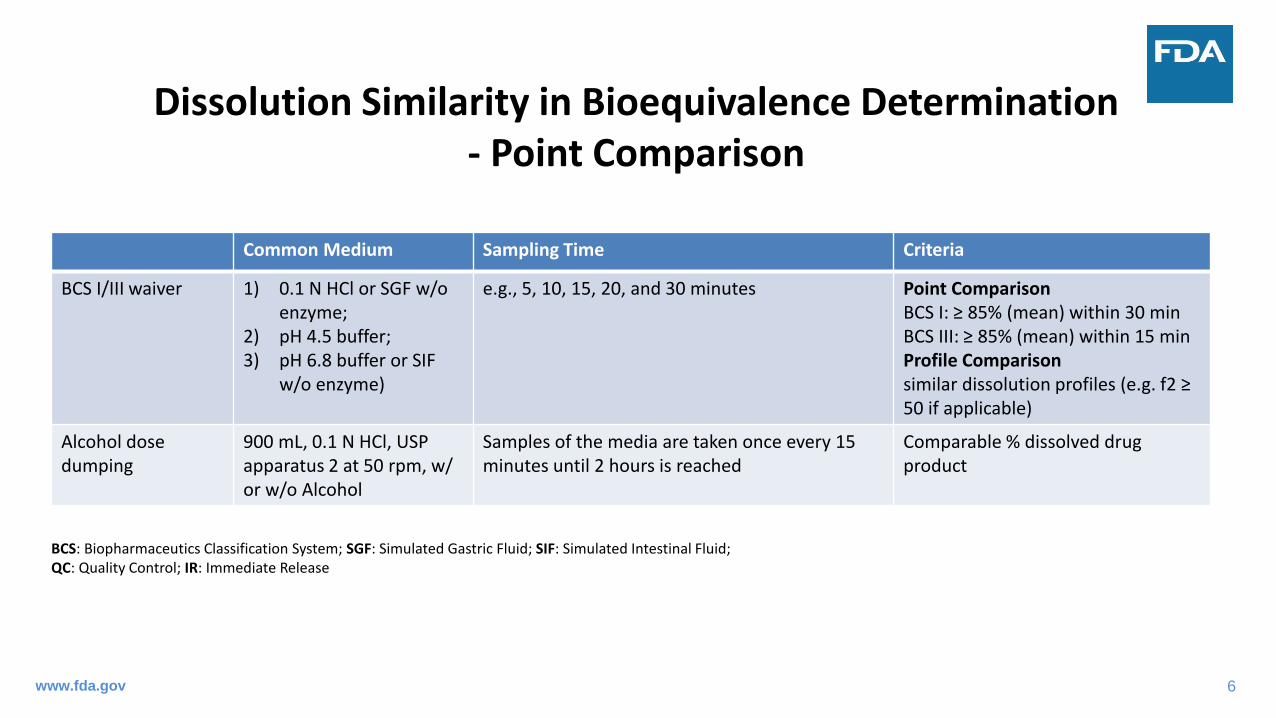
Dissolution Similarity in Bioequivalence Determination- Point Comparison
Common Medium Sampling Time Criteria
BCS I/III waiver 1) 0.1 N HCl or SGF w/o enzyme;
2) pH 4.5 buffer;3) pH 6.8 buffer or SIF
w/o enzyme)
e.g., 5, 10, 15, 20, and 30 minutes Point ComparisonBCS I: ≥ 85% (mean) within 30 minBCS III: ≥ 85% (mean) within 15 minProfile Comparisonsimilar dissolution profiles (e.g. f2 ≥ 50 if applicable)
Alcohol dose dumping
900 mL, 0.1 N HCl, USP apparatus 2 at 50 rpm, w/ or w/o Alcohol
Samples of the media are taken once every 15 minutes until 2 hours is reached
Comparable % dissolved drug product
BCS: Biopharmaceutics Classification System; SGF: Simulated Gastric Fluid; SIF: Simulated Intestinal Fluid;QC: Quality Control; IR: Immediate Release
www.fda.gov
7
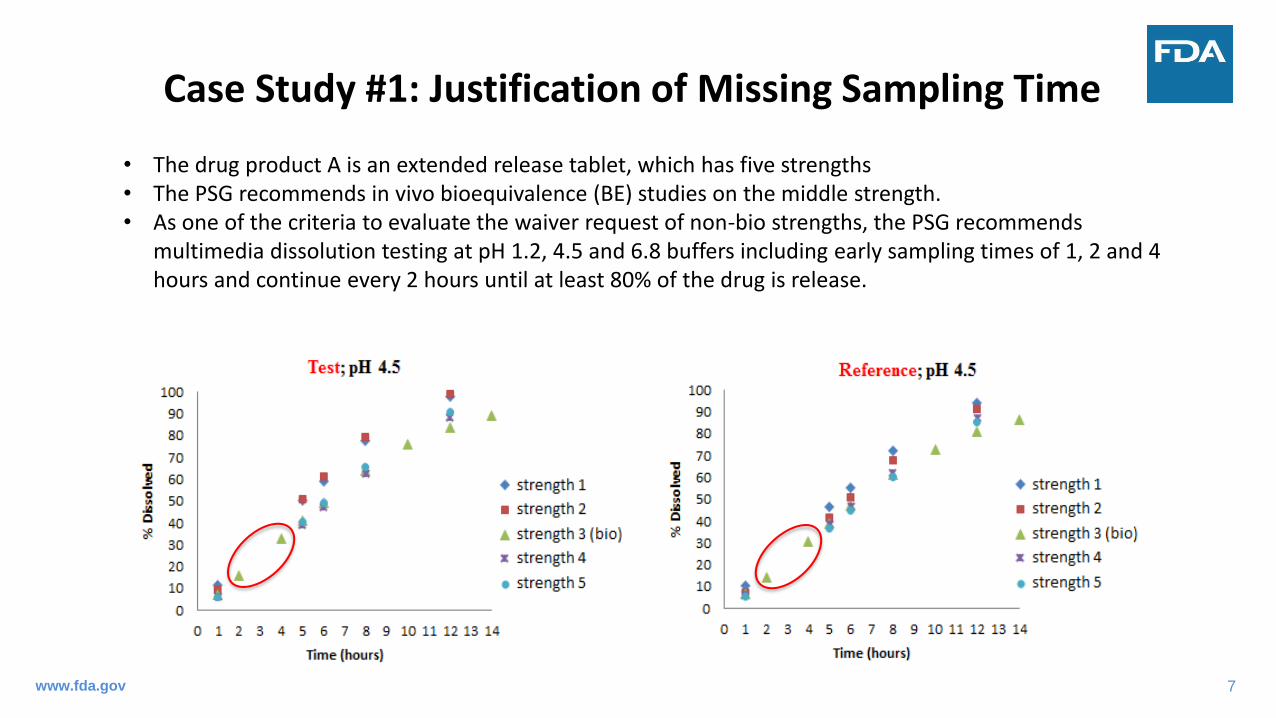
Case Study #1: Justification of Missing Sampling Time
• The drug product A is an extended release tablet, which has five strengths• The PSG recommends in vivo bioequivalence (BE) studies on the middle strength.• As one of the criteria to evaluate the waiver request of non-bio strengths, the PSG recommends
multimedia dissolution testing at pH 1.2, 4.5 and 6.8 buffers including early sampling times of 1, 2 and 4 hours and continue every 2 hours until at least 80% of the drug is release.
www.fda.gov
8
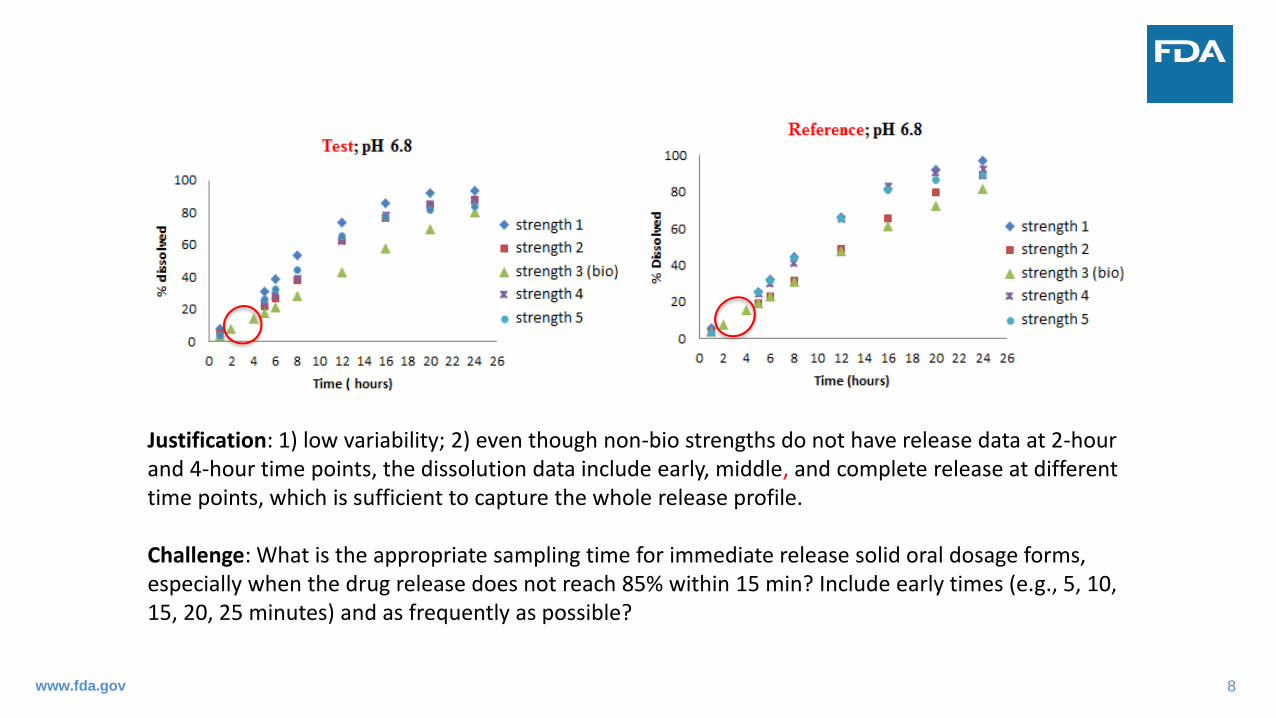
Justification: 1) low variability; 2) even though non-bio strengths do not have release data at 2-hour and 4-hour time points, the dissolution data include early, middle, and complete release at different time points, which is sufficient to capture the whole release profile.
Challenge: What is the appropriate sampling time for immediate release solid oral dosage forms, especially when the drug release does not reach 85% within 15 min? Include early times (e.g., 5, 10, 15, 20, 25 minutes) and as frequently as possible?
www.fda.gov
9
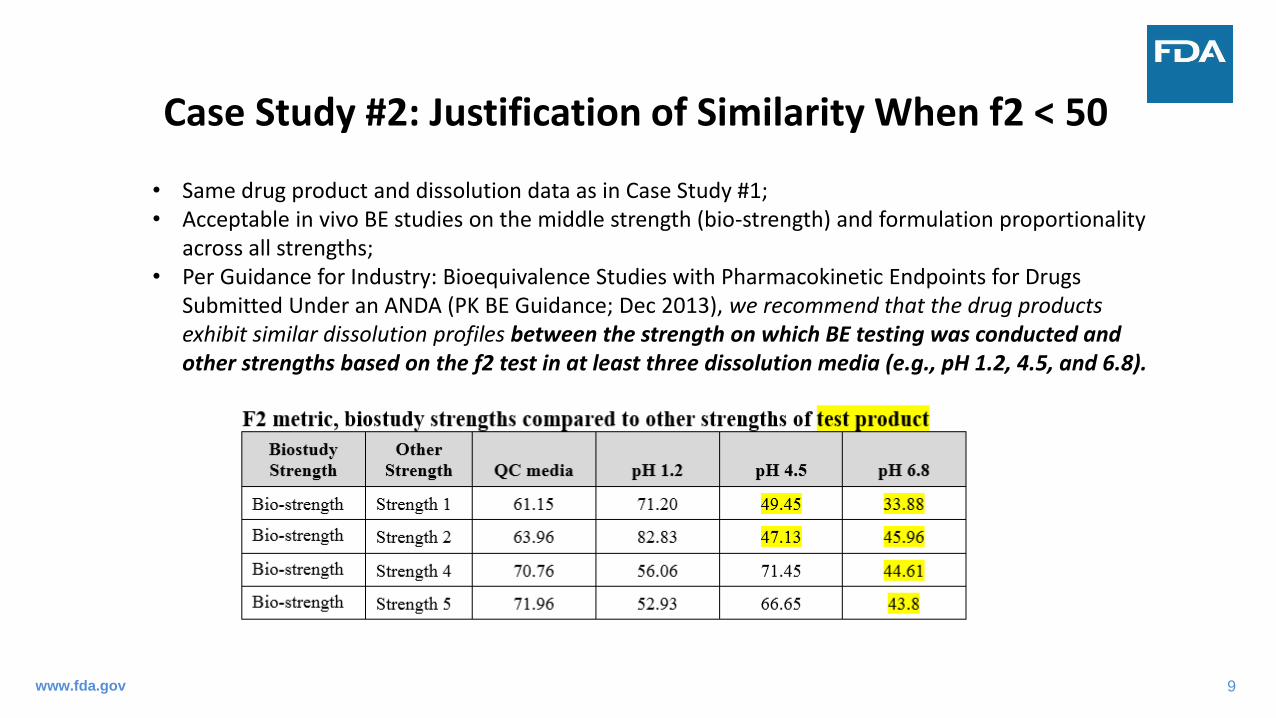
Case Study #2: Justification of Similarity When f2 < 50
• Same drug product and dissolution data as in Case Study #1;• Acceptable in vivo BE studies on the middle strength (bio-strength) and formulation proportionality
across all strengths;• Per Guidance for Industry: Bioequivalence Studies with Pharmacokinetic Endpoints for Drugs
Submitted Under an ANDA (PK BE Guidance; Dec 2013), we recommend that the drug products exhibit similar dissolution profiles between the strength on which BE testing was conducted and other strengths based on the f2 test in at least three dissolution media (e.g., pH 1.2, 4.5, and 6.8).
www.fda.gov
10
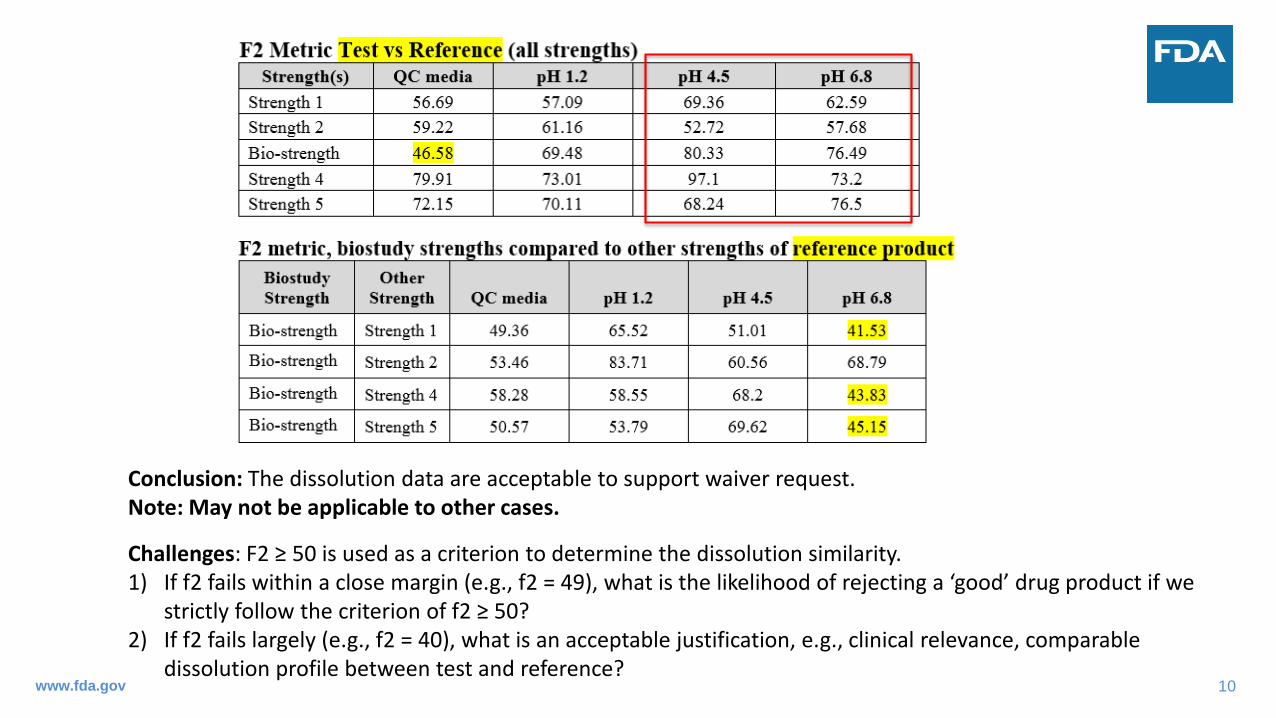
Conclusion: The dissolution data are acceptable to support waiver request. Note: May not be applicable to other cases.
Challenges: F2 ≥ 50 is used as a criterion to determine the dissolution similarity. 1) If f2 fails within a close margin (e.g., f2 = 49), what is the likelihood of rejecting a ‘good’ drug product if we
strictly follow the criterion of f2 ≥ 50? 2) If f2 fails largely (e.g., f2 = 40), what is an acceptable justification, e.g., clinical relevance, comparable
dissolution profile between test and reference? www.fda.gov
11
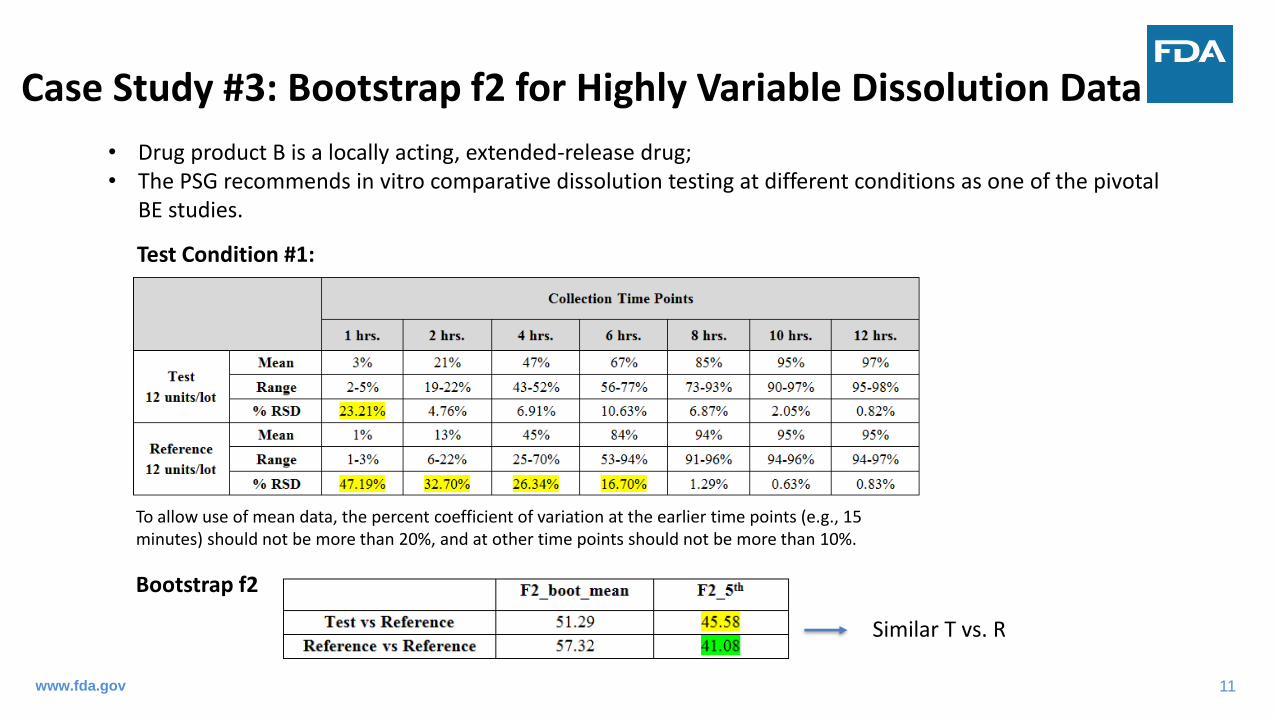
Case Study #3: Bootstrap f2 for Highly Variable Dissolution Data
• Drug product B is a locally acting, extended-release drug;• The PSG recommends in vitro comparative dissolution testing at different conditions as one of the pivotal
BE studies.
Test Condition #1:
Bootstrap f2
To allow use of mean data, the percent coefficient of variation at the earlier time points (e.g., 15 minutes) should not be more than 20%, and at other time points should not be more than 10%.
Similar T vs. R
www.fda.gov
12
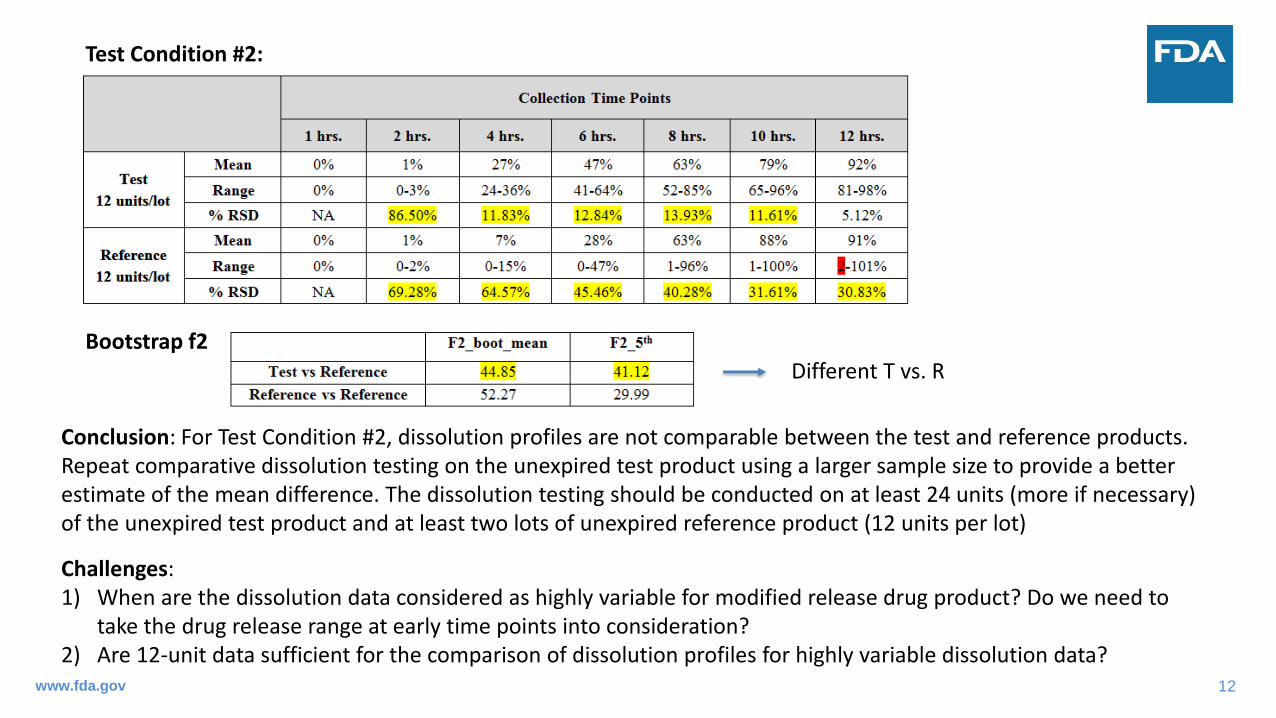
Test Condition #2:
Bootstrap f2
Conclusion: For Test Condition #2, dissolution profiles are not comparable between the test and reference products. Repeat comparative dissolution testing on the unexpired test product using a larger sample size to provide a better estimate of the mean difference. The dissolution testing should be conducted on at least 24 units (more if necessary) of the unexpired test product and at least two lots of unexpired reference product (12 units per lot)
Challenges: 1) When are the dissolution data considered as highly variable for modified release drug product? Do we need to
take the drug release range at early time points into consideration? 2) Are 12-unit data sufficient for the comparison of dissolution profiles for highly variable dissolution data?
Different T vs. R
www.fda.gov
13
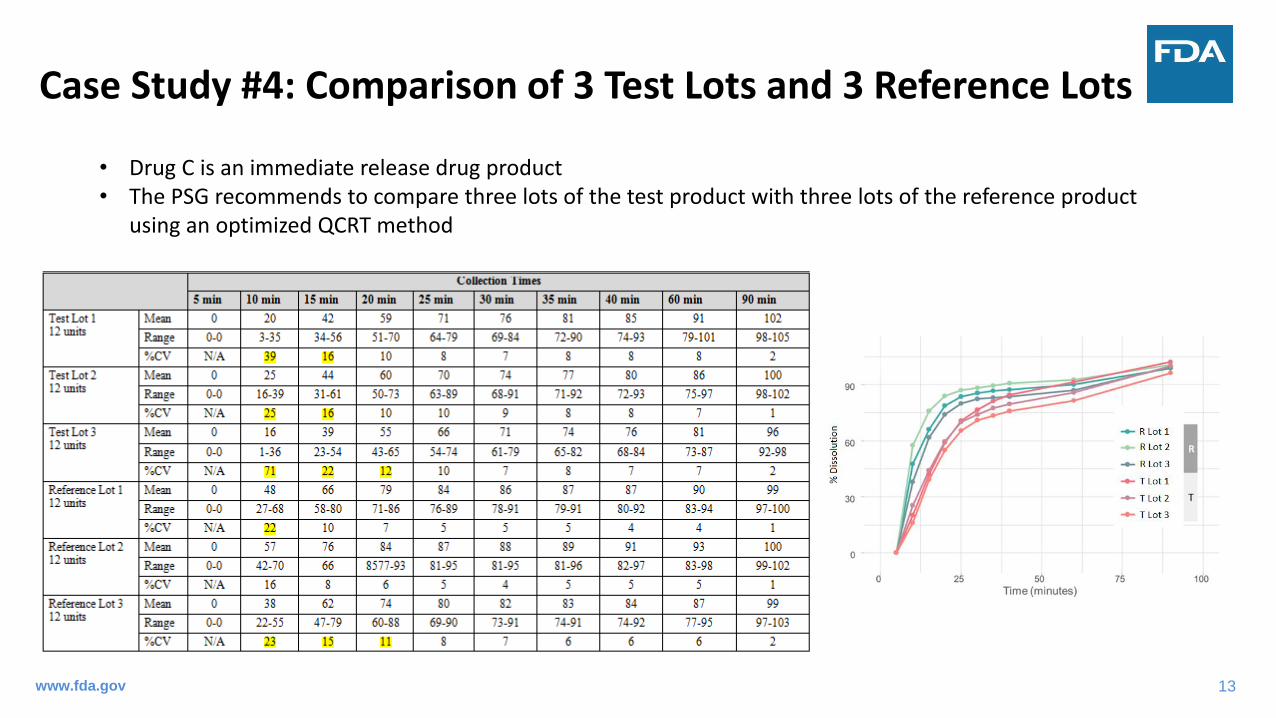
Case Study #4: Comparison of 3 Test Lots and 3 Reference Lots
• Drug C is an immediate release drug product• The PSG recommends to compare three lots of the test product with three lots of the reference product
using an optimized QCRT method
www.fda.gov

14
Individual Test Lot vs. Individual Reference Lot (12 T vs. 12 R) – Bootstrap f2
Pooled Test Data vs. Pooled Reference Data (36 T vs. 36 R) – Bootstrap f2
Results: Only Test Lot 1 and Test Lot 2 are comparable to Reference Lot 3.
Results: The QCRT data are not comparable between the test and reference products
Exploratory: Mahalanobis distance (M-distance)-based approach also shows that the QCRT data are not comparable between the test and reference products
Challenge: What is an appropriate approach to compare multiple T vs. multiple R? Individual or pooled data?www.fda.gov
15
Summary
• Dissolution is a critical tool for the evaluation of generic drug products;
• Low variable dissolution datao Similar if f2 ≥ 50;
• Highly variable dissolution datao Bootstrap f2 method; o Other methods with sufficient justification are also acceptable.
• If f2 fails to meet the acceptance criteria, justification is welcome.
• Challenges
www.fda.gov
16
Challenges
• What is the appropriate sampling interval for immediate release solid oral dosage forms, especially when the drug release does not reach 85% within 15 min? Include early times (e.g., 5, 10, 15, 20, 25 minutes) and as frequently as possible?
• If f2 fails within a close margin (e.g., f2 = 49), what is the likelihood of rejecting a ‘good’ drug product if we strictly follow the criterion of f2 ≥ 50?
• If f2 fails largely (e.g., f2 = 40), what is an acceptable justification, e.g., clinical relevance, comparable dissolution profile between test and reference?
• When are the dissolution data considered as highly variable for modified release drug products? Do we need to take the drug release range at early time points into consideration?
• Are 12-unit data sufficient for the comparison of dissolution profiles for highly variable dissolution data?
• What is an appropriate approach to compare multiple T vs. multiple R? Individual or pooled data?
www.fda.gov
17
Acknowledgements
Division of Bioequivalence IBing V. LiUtpal MunshiQing LiuRong Wang
Division of Bioequivalence IIHongling Zhang
Division of Bioequivalence IIINilufer TampalApril Braddy
Division of BiopharmaceuticsSandra Suarez
www.fda.gov
18
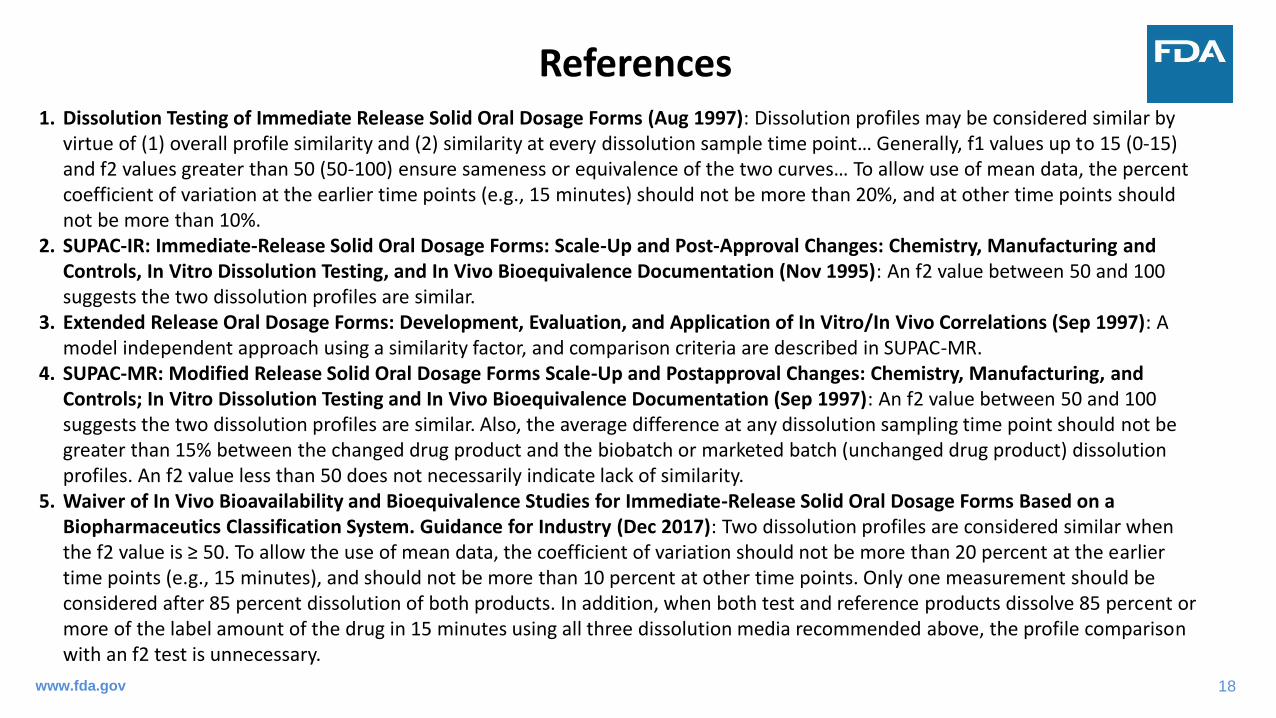
References1. Dissolution Testing of Immediate Release Solid Oral Dosage Forms (Aug 1997): Dissolution profiles may be considered similar by
virtue of (1) overall profile similarity and (2) similarity at every dissolution sample time point… Generally, f1 values up to 15 (0-15) and f2 values greater than 50 (50-100) ensure sameness or equivalence of the two curves… To allow use of mean data, the percent coefficient of variation at the earlier time points (e.g., 15 minutes) should not be more than 20%, and at other time points should not be more than 10%.
2. SUPAC-IR: Immediate-Release Solid Oral Dosage Forms: Scale-Up and Post-Approval Changes: Chemistry, Manufacturing and Controls, In Vitro Dissolution Testing, and In Vivo Bioequivalence Documentation (Nov 1995): An f2 value between 50 and 100 suggests the two dissolution profiles are similar.
3. Extended Release Oral Dosage Forms: Development, Evaluation, and Application of In Vitro/In Vivo Correlations (Sep 1997): A model independent approach using a similarity factor, and comparison criteria are described in SUPAC-MR.
4. SUPAC-MR: Modified Release Solid Oral Dosage Forms Scale-Up and Postapproval Changes: Chemistry, Manufacturing, and Controls; In Vitro Dissolution Testing and In Vivo Bioequivalence Documentation (Sep 1997): An f2 value between 50 and 100 suggests the two dissolution profiles are similar. Also, the average difference at any dissolution sampling time point should not be greater than 15% between the changed drug product and the biobatch or marketed batch (unchanged drug product) dissolution profiles. An f2 value less than 50 does not necessarily indicate lack of similarity.
5. Waiver of In Vivo Bioavailability and Bioequivalence Studies for Immediate-Release Solid Oral Dosage Forms Based on a Biopharmaceutics Classification System. Guidance for Industry (Dec 2017): Two dissolution profiles are considered similar when the f2 value is ≥ 50. To allow the use of mean data, the coefficient of variation should not be more than 20 percent at the earlier time points (e.g., 15 minutes), and should not be more than 10 percent at other time points. Only one measurement should be considered after 85 percent dissolution of both products. In addition, when both test and reference products dissolve 85 percent or more of the label amount of the drug in 15 minutes using all three dissolution media recommended above, the profile comparison with an f2 test is unnecessary.
www.fda.gov