dissecting hotel sourcing – a well managed process · 1 dissecting hotel sourcing – a well...
TRANSCRIPT

1 1
Dissecting Hotel Sourcing – A Well Managed Process GBTA Boston July 23, 2012
Presented by: Carol Ann Salcito, CCTE President Management Alternatives, Inc. 203-849-9137 [email protected] www.mgmtalternatives.com
Jan D. Freitag
SVP STR
615-824-8664 [email protected] www.str.com

2
US Lodging Overview
Jan D. Freitag
Senior Vice President

3
www.hotelnewsnow.com
Click on “Hotel Data Presentations”

4
Agenda
• Total US Review
• Scales
• Segmentation
• 2012 / 2013 Forecast

5
Supply / Demand Drive Results. Pricing Power Is Back (?)
% Change Room Supply* 727 mm 0.3% Room Demand* 430 mm 3.5% Occupancy 59% 3.2% A.D.R. $104 4.2% RevPAR $62 7.5% Room Revenue* $45 bn 7.9%
YTD May 2012, Total US Results
* All Time High

6
YTD May 2012: Highest Demand - EVER (430 Million Rooms Sold)

7
-10
-5
0
5
1990 2000 2010
Demand ADR
ADR Rebound Trajectory Flattens Out (Too?) Early
-6.9%
-4.7%
-0.9%
-4.6%
-0.2%
-8.7%
4.0%
*Total US, ADR & Demand % Change, 12 MMA 1990 – 5/2012

8
ADR Discounting at Twice The Speed of ADR Increases
95
100
105
110
2008 2009 2010 2011
*Total US, ADR $, 12 MMA 2007 - 2011
Apr ‘10
$97
Sept ‘08
$108
Dec ‘11
$102
+4.6%
-10%
19 Months
19 Months

9
Chain Scale Review
10
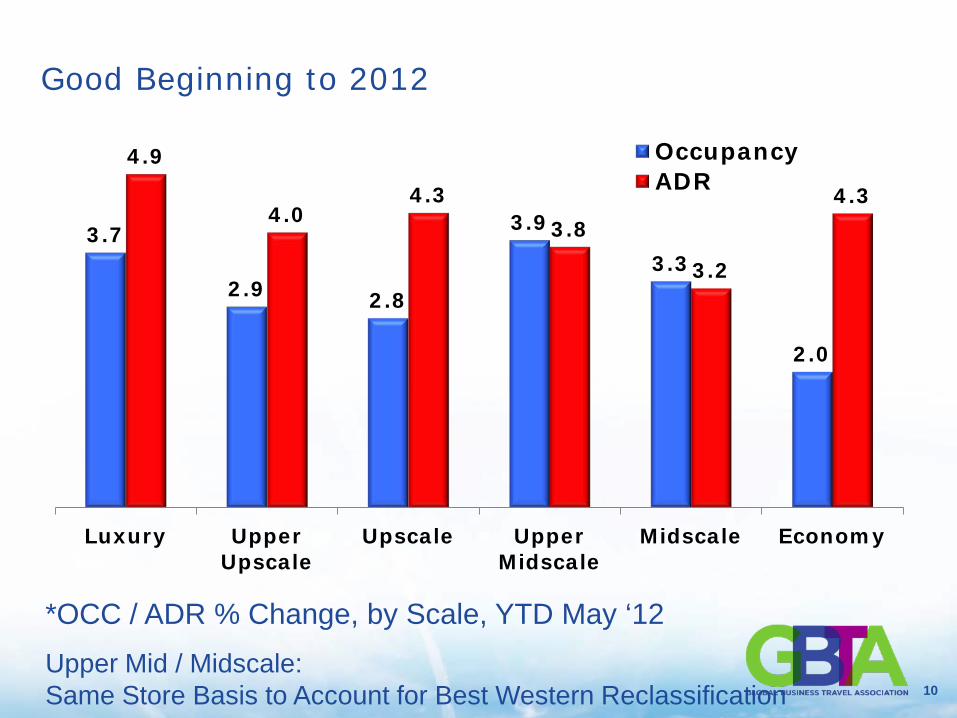
Good Beginning to 2012
3.7
2.9 2.8
3.9
3.3
2.0
4.9
4.0 4.3
3.8
3.2
4.3
Luxury Upper Upscale
Upscale Upper Midscale
Midscale Economy
Occupancy ADR
*OCC / ADR % Change, by Scale, YTD May ‘12 Upper Mid / Midscale: Same Store Basis to Account for Best Western Reclassification

11
Upper End Sells 7 out of 10 Rooms Every Night 72.5
70.5 69.6
65.6
59.0 57.0
72.1 70.1 70.3
62.2
54.3 53.9
Luxury Upper Upscale
Upscale Upper Midscale*
Midscale* Economy
2007 12 Months end 5/12
*Absolute OCC %, by Scale, YE 2007 & 12 Months ending 5/12 Upper Mid / Midscale: Same Store Basis to Account for Best Western Reclassification
12
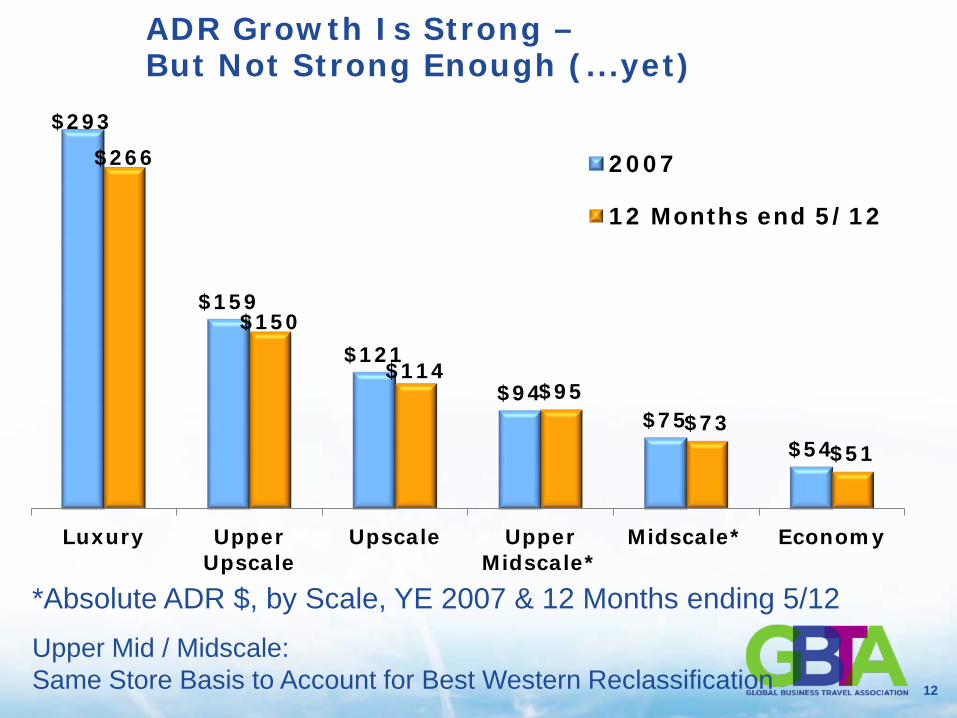
ADR Growth Is Strong – But Not Strong Enough (...yet)
$293
$159
$121
$94 $75
$54
$266
$150
$114 $95
$73 $51
Luxury Upper Upscale
Upscale Upper Midscale*
Midscale* Economy
2007
12 Months end 5/12
*Absolute ADR $, by Scale, YE 2007 & 12 Months ending 5/12 Upper Mid / Midscale: Same Store Basis to Account for Best Western Reclassification
13
Segmentation Review
14
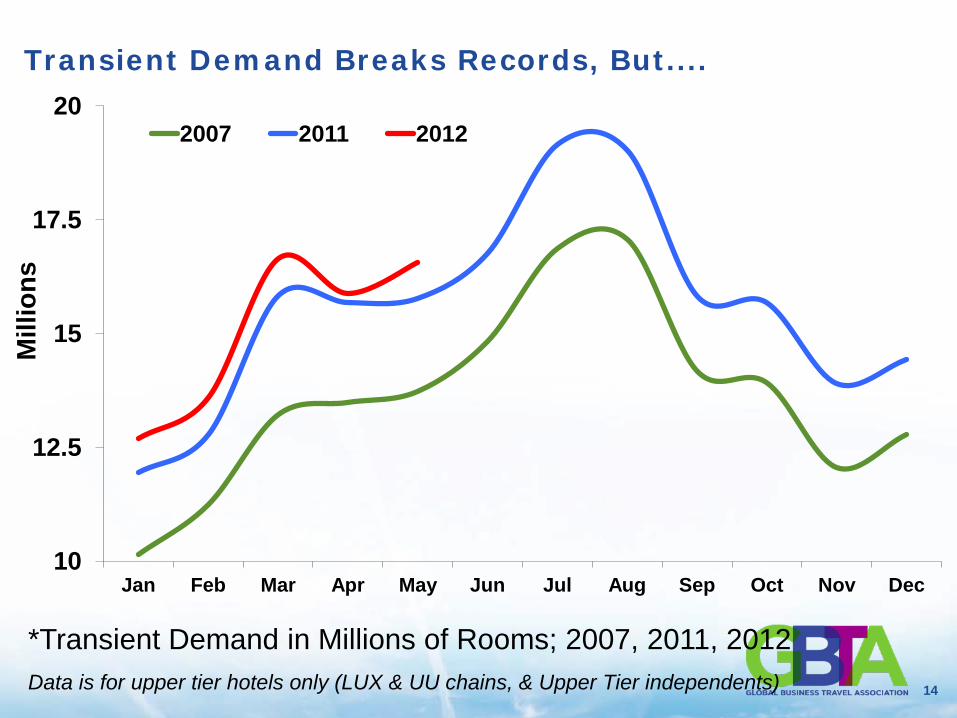
Transient Demand Breaks Records, But....
10
12.5
15
17.5
20
Jan Feb Mar Apr May Jun Jul Aug Sep Oct Nov Dec
2007 2011 2012
*Transient Demand in Millions of Rooms; 2007, 2011, 2012 Data is for upper tier hotels only (LUX & UU chains, & Upper Tier independents)
Mill
ions
15
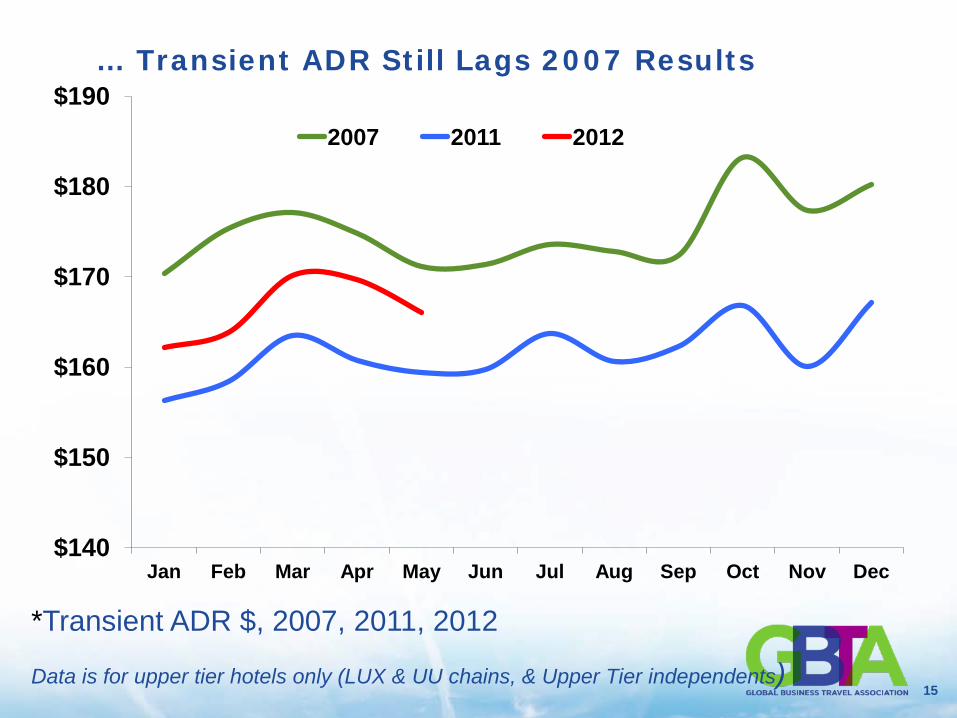
… Transient ADR Still Lags 2007 Results
$140
$150
$160
$170
$180
$190
Jan Feb Mar Apr May Jun Jul Aug Sep Oct Nov Dec
2007 2011 2012
*Transient ADR $, 2007, 2011, 2012
Data is for upper tier hotels only (LUX & UU chains, & Upper Tier independents)

16
Group Demand Has Not Changed Over Time, But…
4
6
8
10
12
Jan Feb Mar Apr May Jun Jul Aug Sep Oct Nov Dec
Mill
ions
2007 2011 2012
*Group Demand in Millions of Rooms, 2007, 2011, 2012 Data is for upper tier hotels only (LUX & UU chains, & Upper Tier independents)

17
… Group ADRs Still Depressed (& Could Dampen Future Absolute ADRs)
$130
$140
$150
$160
$170
Jan Feb Mar Apr May Jun Jul Aug Sep Oct Nov Dec
2008 2011 2012
*Group ADR $, 2008, 2011, 2012 Data is for upper tier hotels only (LUX & UU chains, & Upper Tier independents)

18
Forecast 2012 / 2013

19
Total United States Forecast 2012 / 2013 Key Performance Indicator % Change
2012 Forecast
2013 Forecast
Supply 0.5% 1.1%
Demand 2.0% 1.8%
Occupancy 1.5% 0.7%
ADR 4.0% 4.6%
RevPAR 5.5% 5.4%

20
2012 Chain Scale Forecast
Chain Scale Occupancy
(% chg) ADR
(% chg) RevPAR (%chg)
Luxury +2.6% +5.1% +7.9% Upper Upscale +1.5% +4.2% +5.7%
Upscale +2.3% +4.6% +7.1%
Upper Midscale +1.4% +4.0% +5.5% Midscale +2.8% +1.4% +4.3% Economy +1.4% +3.1% +4.5%
Independent +0.5% +3.5% +4.0% Total United States 1.5% 4.0% 5.5%
21 21
Best in Class Sourcing Strategy, Formation and Data Analysis Carol Ann Salcito, CCTE

22

23
Topics • Sourcing Strategy Simplified
• Hotel Data
• Data-driven Insights
• Chain Wide Deals
• Travel Policy & Negotiations • Savings & Reporting Methods • Compliance & Performance Tracking • Meetings & Events Management
24
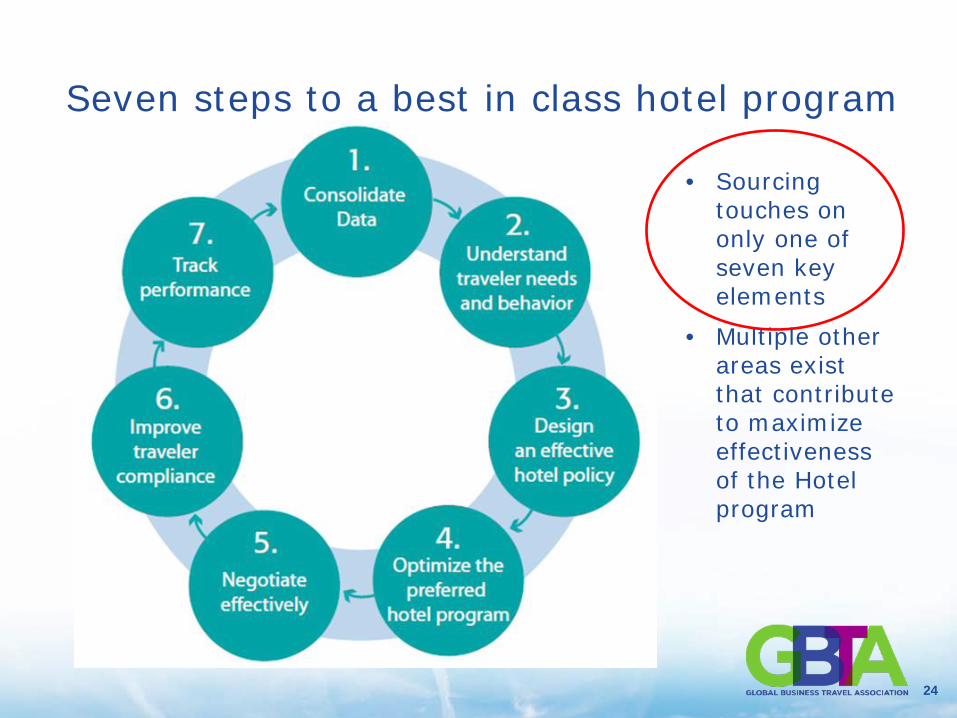
Seven steps to a best in class hotel program
• Sourcing touches on only one of seven key elements
• Multiple other areas exist that contribute to maximize effectiveness of the Hotel program

25
Best in Class Approaches for Navigating 2012 RFP Season
•Consolidate all data available (agency, charge card, expense system, supplier data)
•Focus on bids in top markets
•Benchmark for competitiveness
•Analyze total cost of stay
•Avoid program dilution caused by choosing too many preferred hotels
•Audit frequently
•Communicate purposefully around greatest opportunities.
•Manage program throughout the year
“Don’t let your hotel program sit on the shelf”

26
Typical sourcing timeline

27
Goal: Maximize convenience and savings, subject to the Frame
• Framing the “should cost” • The Framework is: ‒ Travel Policy
‒ LOCATION
‒ Convenience
‒ Tier
‒ Market
‒ Current Workload
‒ Company Culture for change (traveler and management)
‒ Supplier relationships

28
Hotel Data

29
Sources of Hotel data
• TMC Bookings • charge Cards • Buyer’s preferred program rates • Suppliers - but data varies wildly • Automated Expense Reporting Tools are best… ‒ But require adjustment - entry filters
‒ Even with corporate card feed!
• Manually-entered expense reports are unreliable • E-folio data may be more than time permits!

30
Data-driven Insights

31
Volume Leverage
• You know each market’s room nights
‒ Realistic and actionable opportunity for bidders
• Becomes a much more practical basis for negotiations
• Can show realistic available room nights to each brand and chain by rolling up markets
‒ Cities, metro areas, states, regions and countries – all from bottom-up detail

32 32
Optimizing Hotel Spend: Travel Policy & Negotiations

33
“Surprising how quickly we wrapped up negotiations after I ate that liverwurst and onion sandwich for lunch”
34
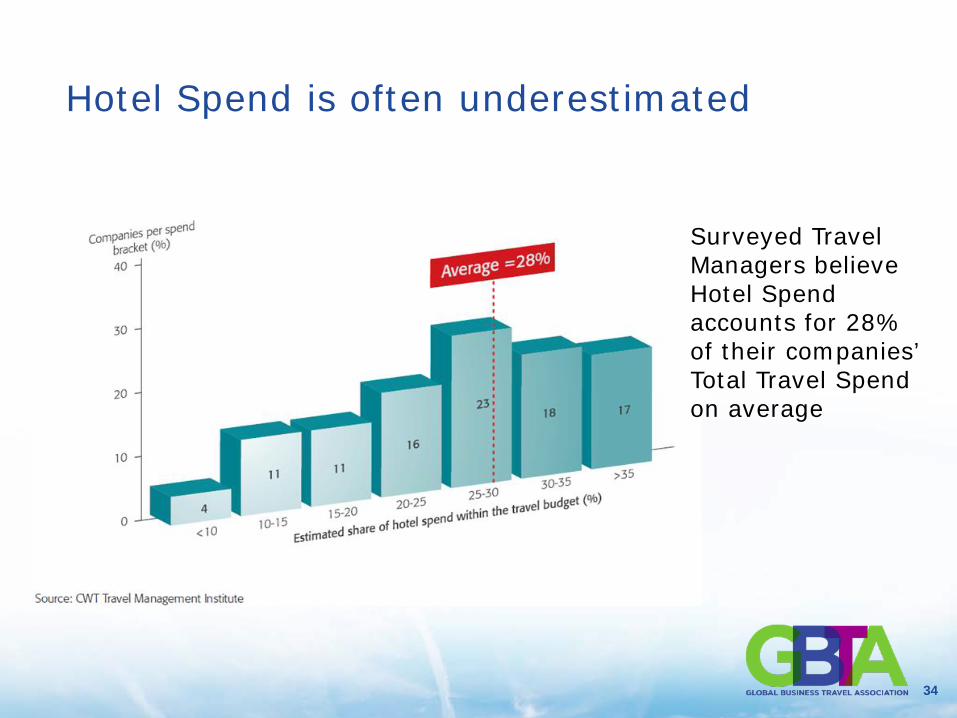
Hotel Spend is often underestimated
Surveyed Travel Managers believe Hotel Spend accounts for 28% of their companies’ Total Travel Spend on average

35
Hotel spend represents an avg of 39% of total travel spend
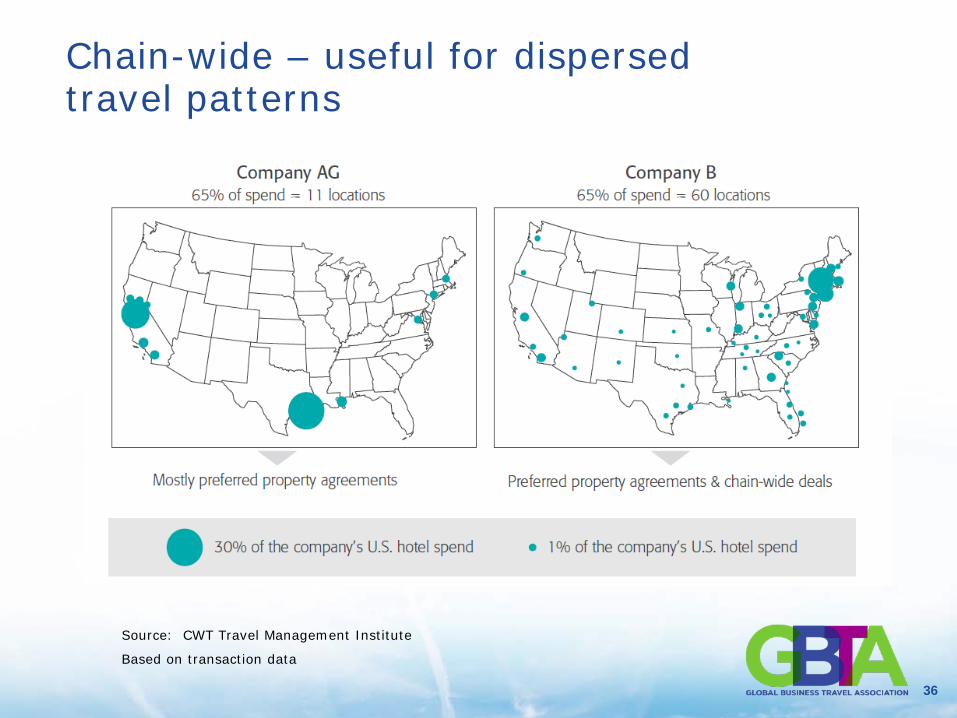
36
Source: CWT Travel Management Institute
Based on transaction data
Chain-wide – useful for dispersed travel patterns

37
Key: High/Easy Medium Low / Difficult
What are the negotiation decision points?
Decision Point Impact Ease to Implement Accessibility
Volume at hotel
Year-over-year
Amenity inclusions
City volumes
Competitor benchmark
Relationship
Market conditions
Length of stay
Arrival pattern
Advanced booking
-

38
What is the best value?
Hotel A Hotel B
$182 $180
$0 $0
$15 $15
$0 $12
$165 $155
39 39
Measurements Savings and Reporting Methods
40
Testing the Value of Measuring and Reporting Savings
• Credible (can be audited, pass the CFO test) • Relevant (to company culture and in the right
language) • Predictable (for budgets and forecasts) • Accountable (linked to specific efforts)

41
Which Rates for Benchmarks?
Which undiscounted rate? • Published or Best Available (BAR)
‒ BAR gets a better grade from CFOs
Which rate used by travelers?
• Negotiated* • Booked (ABR) • Paid
*(a.k.a. corporate or program)
CFO’s Rank Low
OK
Best
TM’s Rank
Low
OK
Best

42 42
What is Happening? Traveler Compliance & Performance Tracking

43
Understand why travelers book out of policy is key to improving compliance

44
Actions to Improve Compliance
• Publish the program to web directory and communicate
• Implement clear mandate policies
• Check online booking tool configuration
• Require air w/hotel booking
• Empower TMC to enforce compliance
• Investigate reasons for non-compliance reasons and follow-up
• Explain the stakes

45
FUTURE
GBTA SOURCING WORKSHOPS
• Air Sourcing
– October 9, 2012 – Denver, Colorado
• Go “Beyond” Hotel Sourcing
– November 14, 2012 – Scottsdale, Arizona

46
Don’t Forget! We Want to Hear From You!
Please take a moment now to complete an evaluation.
Go Green! Complete your evaluation from the mobile app or http://m.gbta.org.
Paper surveys can be turned in to the
GBTA room volunteer upon exit.