disrupting the datacenter: qualcomm centriq 2400 · pdf file2 safe harbor this presentation by...
TRANSCRIPT

November 8, 2017
Disrupting the datacenter: Qualcomm Centriq™ 2400Processor

2
Safe Harbor
This presentation by Qualcomm Incorporated and its indirect wholly-owned subsidiary, Qualcomm Datacenter Technologies, Inc. (“QDT”), contains
forward-looking statements. Such forward-looking statements involve known and unknown risks, uncertainties and other factors which may cause
Qualcomm Incorporated’s or QDT’s actual results, performance or achievements to be materially different from any future results, performance or
achievements expressed or implied by the forward-looking statements.
Neither Qualcomm Incorporated nor QDT undertakes any obligation to revise or update any forward-looking statements in order to reflect any event or
circumstance that may arise after the date of this presentation and each entity reserves the right to revise their respective product roadmaps at any time
for any reason without notice. Any third-party statements included in the presentation are not made by either Qualcomm Incorporated or QDT, but
instead by such third parties themselves and neither Qualcomm Incorporated nor QDT has any responsibility in connection therewith.

3
Technology leadership in
advanced computing, connectivity,
security, and systems design
Transforming our world

4
Inventing technologies that fuel innovation
Long history of anticipating big industry
challenges and developing system-level
solutions to solve them

5
A unified connectivity platform facilitating distributed intelligence between cloud and device
Mission-critical
services
Massive Internet
of Things
Enhanced mobile
broadband
5G will power a new cloud and connectivity paradigm

6
Intelligence distributed
from cloud to device
Smart homes
Networking
Industrial IoT
Media consumption
Automotive
Computing
Low power, efficient, integrated
computing platforms
5G for high speed,
low latency connectivity
Comprehensive
security
Optimized machine
learning
High performance at
leading process nodes
Utilizing our technology
leadership to drive innovation
at scale across industries
Distributed intelligence drives new requirements

7
2005
2006
2007
2008
2009
2010
2011
2012
2013
2014
2015
2016
Arm vs x86: Architectural footprint
100B+ Arm-based chips have shipped since 1991
Expect next 100B to ship by 2021
X86 Arm

8
Manufacturing process
Cloud
Structural trendsdriving tectonic shift
in the data center
9
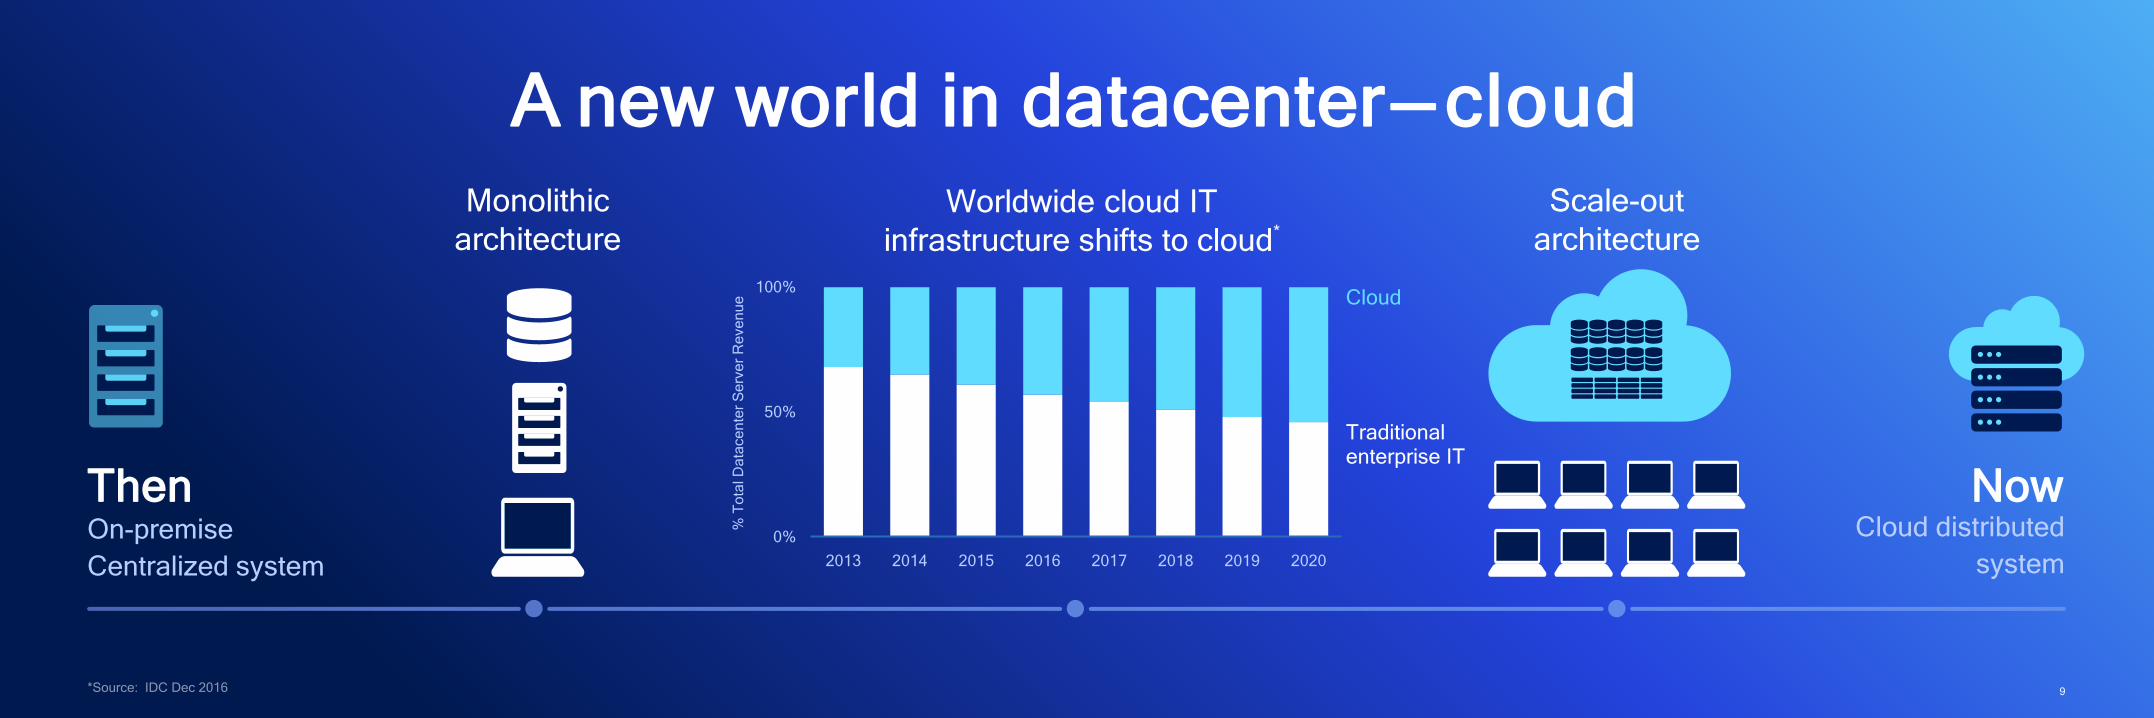
A new world in datacenter— cloud
NowThenOn-premise
Centralized system
Cloud distributed
system
Worldwide cloud IT
infrastructure shifts to cloud*
Monolithic
architecture
Scale-out
architecture
Cloud
Traditional enterprise IT
0%
50%
100%
2013 2014 2015 2016 2017 2018 2019 2020
% T
ota
l D
ata
ce
nte
r S
erv
er
Re
ve
nu
e

10
2005 2006 2007
219M
units
230M
units
269M
units
56M
units
82M
units
124M
units
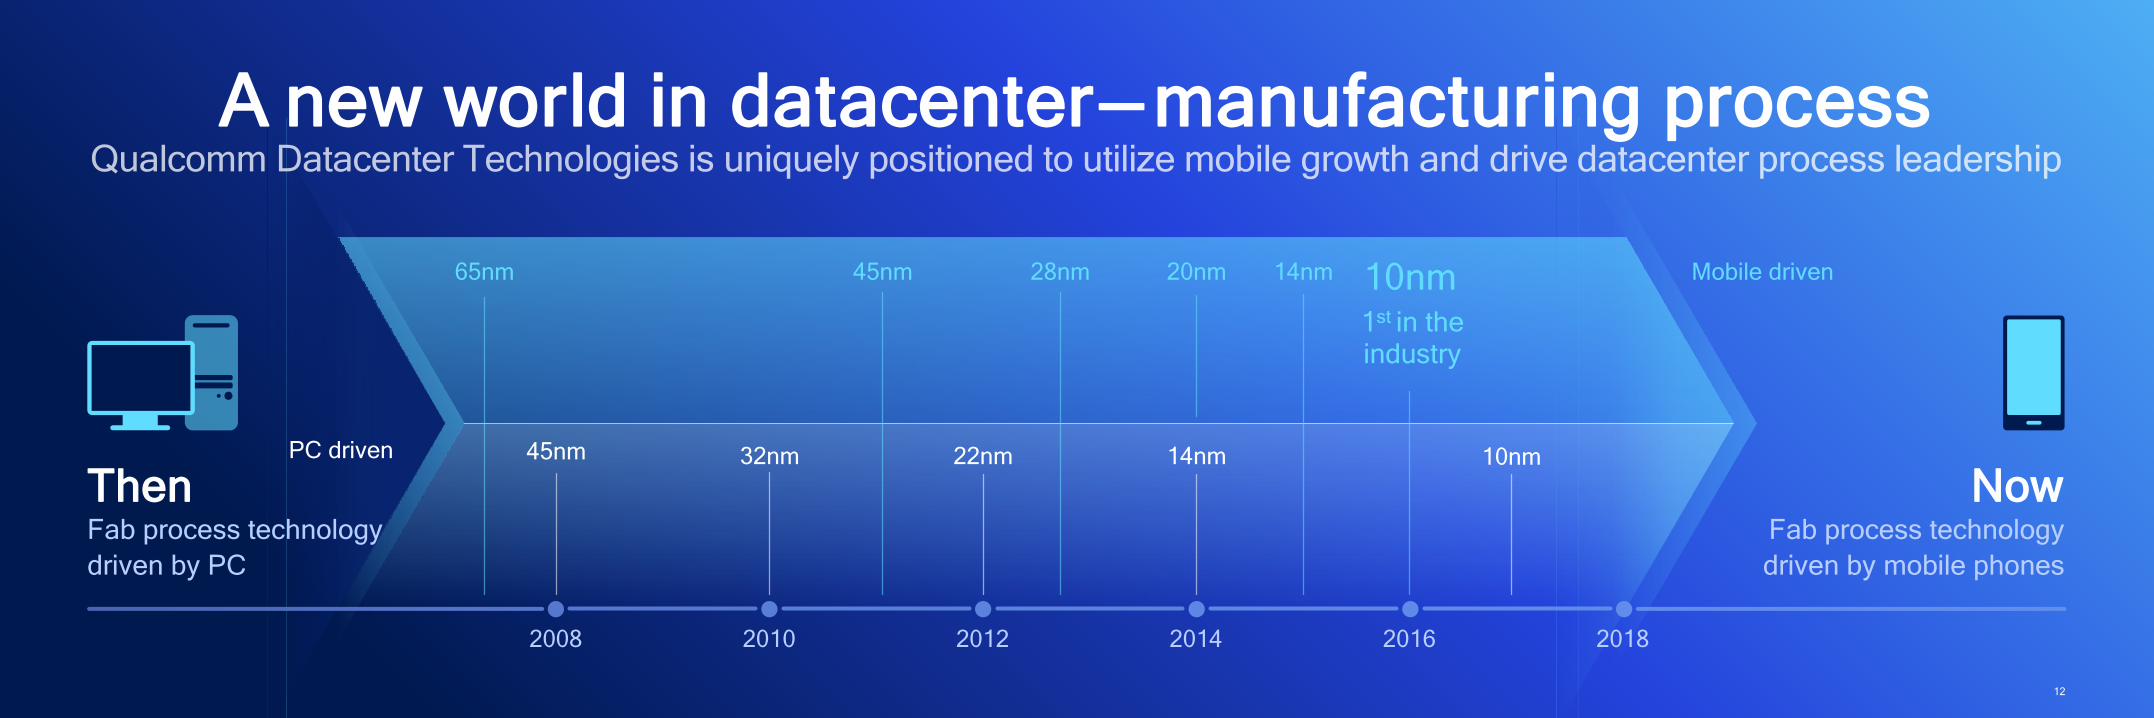
A new world in datacenter— manufacturing process
NowThen
Global PC vs. Smartphone shipments
2012201120102008 2009 2013
305M
units
294M
units
1.3B
units
1.4B
units
20152014
1.5B
units
2016
280M
units
Fab process technology
driven by PC
Fab process technology
driven by mobile phones
PC
Smartphone

11
2005 2006 2007
219M
units
230M
units
269M
units
56M
units
82M
units
124M
units
A new world in datacenter— manufacturing process
NowThen
305M
units
294M
units
1.3B
units
1.4B
units
20152014
1.5B
units
2016
280M
units180
nm
350
nm
250
nm
130
nm
90
nm
65
nm
45
nm
32
nm
22
nm
De
fect d
en
sity*
(Lo
g s
ca
le)
~2 year
Fab process technology
driven by PC
Fab process technology
driven by mobile phones
PC
Smartphone
12
45nm
65nm
32nm 22nm 14nm
45nm 28nm 20nm 10nm14nm
1st in theindustry
Mobile driven
2008 2010 2012 2016 20182014
Now10nm
Fab process technology
driven by mobile phones
ThenPC driven
Fab process technology
driven by PC
A new world in datacenter— manufacturing process

13
2400Qualcomm Centriq™
Processor
Disrupting the datacenter

14
Process technology leadership
Custom design expertise
Built for the cloud Open ecosystem
Reimagining the datacenter
Industry’s first and only 10nm server processor.

15
+ =
“Samsung's 10nm process technology
with specific optimizations for high
performance, combined with QDT’s
leading-edge custom SoC design,
allow us to deliver a world-class
server processor that will disrupt the
datacenter market.”
ES Jung, President and GM, Foundry
Business, Samsung Electronics
World
class design
Industry leading
process node
Innovative design on leading edge node

16
Benefits of leading edge node
Better performance, power, area
Transistor speed Higher performance
Transistor density Lower cost
Transistor power Higher perf /Watt
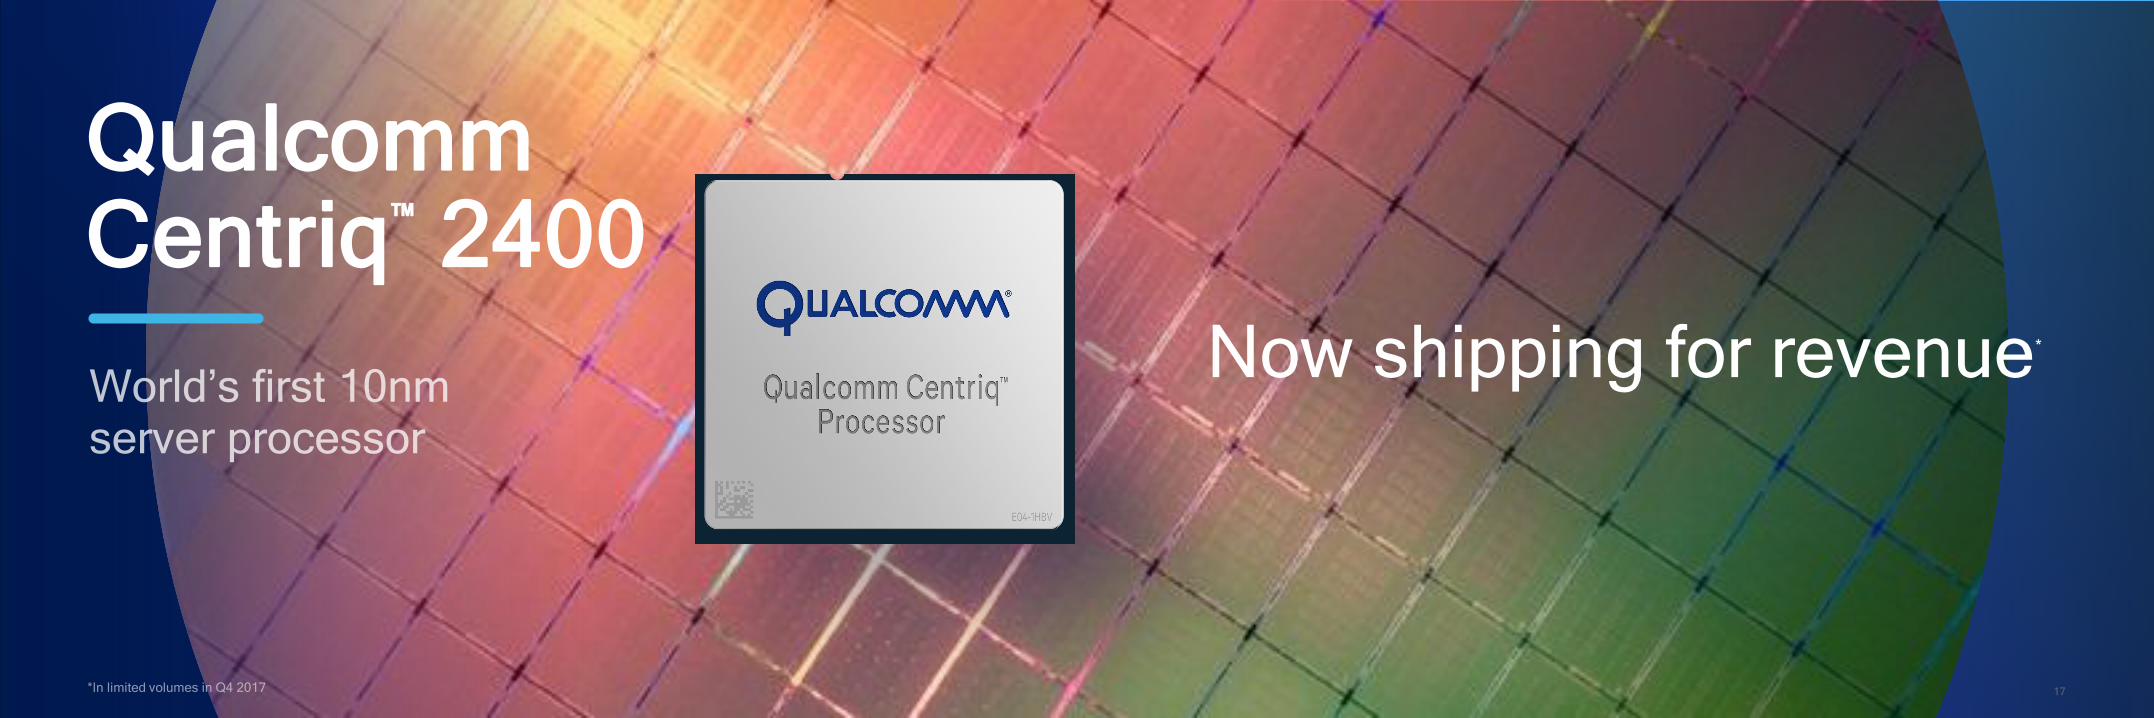
17
Now shipping for revenue*
QualcommCentriq™ 2400

18
Cloud
Traditional enterprise IT
% T
ota
l d
ata
ce
nte
r se
rve
r re
ve
nu
e
0%
25%
50%
75%
100%
2013 2014 2015 2016 2017 2018 2019 2020
Industry is shifting to the cloud
19
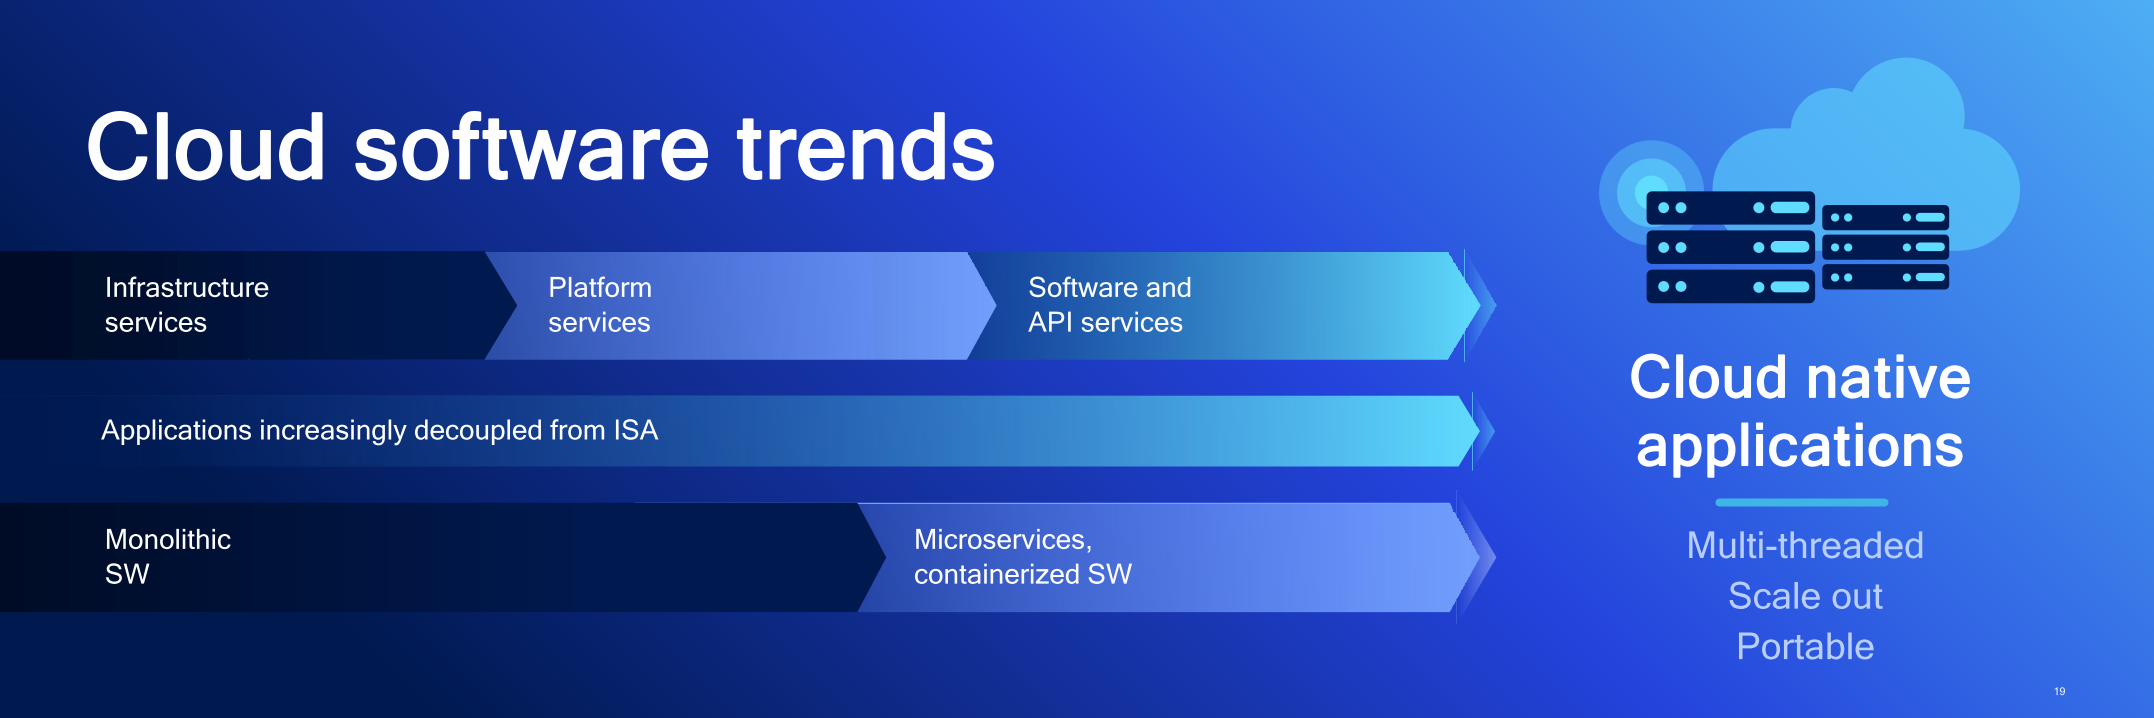
Cloud nativeapplications
Multi-threaded
Scale out
Portable
Infrastructure
services
Platform
services
Software and
API services
Monolithic
SW
Microservices,
containerized SW
Applications increasingly decoupled from ISA
Cloud software trends

20
Qualcomm Centriq™
2400Throughput performance
Thread density
Quality of service
Energy efficiency
What cloud means forprocessor architecture
Key metrics
• Perf / thread
• Perf / Watt
• Perf / $

21
Large cache
• 64 KB L1 instruction cache with 24 KB
single-cycle L0 cache
• 512 KB L2 per duplex
• 60 MB unified L3 cache
Bi-directional multi-ring
• Fully coherent
• >250GB/s aggregate bandwidth
Qualcomm®
Falkor™ CPU
• 5th-generation custom core design
• 2.2 GHz base frequency, 2.6 GHz peak*
• Arm v8-compliant
• AArch64 only
High core count
• Up to 48 single-thread CPU cores
Qualcomm Centriq 2400: Built for cloud
Falkor
duplex
Falkor
duplex
Falkor
duplex
Falkor
duplex
Falkor
duplex
Falkor
duplex
Falkor
duplex
Falkor
duplex
Falkor
duplex
Falkor
duplex
Falkor
duplex
Falkor
duplex
Falkor
duplex
Falkor
duplex
Falkor
duplex
Falkor
duplex
Falkor
duplex
Falkor
duplex
Falkor
duplex
Falkor
duplex
Falkor
duplex
Falkor
duplex
Falkor
duplex
Falkor
duplex
8-S
erd
es
SA
TA
CT
LH
DM
AE
MA
C
OC
ME
M
QG
IC
US
B
US
B
US
B
US
B
PW
QF
PR
OM
IMC
MP
M/C
C
8-S
erd
es
PC
le
8-S
erd
es
8-S
erd
es
PC
le
8-S
erd
es
DDR DDR DDR
MCMCMC
DDR DDR DDR
Coherent segmented ring interconnect
L3L3L3L3 L3L3
L3L3L3L3 L3L3
MCMCMC

22
Security
• Immutable root of trust
• EL3 (TrustZone) and EL2 (hypervisor)
Cloud workload enhancers
• Inline memory bandwidth compression
• Cache Quality of Service
Integrated chipset
• 32 PCIe Gen3 lanes with 6 PCIe controllers
• Low speed IO; integrated management controller
Falkor
duplex
Falkor
duplex
Falkor
duplex
Falkor
duplex
Falkor
duplex
Falkor
duplex
Falkor
duplex
Falkor
duplex
Falkor
duplex
Falkor
duplex
Falkor
duplex
Falkor
duplex
Falkor
duplex
Falkor
duplex
Falkor
duplex
Falkor
duplex
Falkor
duplex
Falkor
duplex
Falkor
duplex
Falkor
duplex
Falkor
duplex
Falkor
duplex
Falkor
duplex
Falkor
duplex
8-S
erd
es
SA
TA
CT
LH
DM
AE
MA
C
OC
ME
M
QG
IC
US
B
US
B
US
B
US
B
PW
QF
PR
OM
IMC
MP
M/C
C
8-S
erd
es
PC
le
8-S
erd
es
8-S
erd
es
PC
le
8-S
erd
es
DDR DDR DDR
MCMCMC
DDR DDR DDR
Coherent segmented ring interconnect
L3L3L3L3 L3L3
L3L3L3L3 L3L3
MCMCMC
Highly integrated SoC
• Distributed architecture
• Single chip platform-level solution
• Arm SBSA Level 3-compliant
High memory BW
• 6 Channels of DDR4 2667 MT/s
• Up to 768 GB of memory
• 128 GB/s peak aggregate BW
Low power
• Up to 120W TDP
Qualcomm Centriq 2400: Built for cloud

23
Falkor
duplex
Falkor
duplex
Falkor
duplex
Falkor
duplex
Falkor
duplex
Falkor
duplex
Falkor
duplex
Falkor
duplex
Falkor
duplex
Falkor
duplex
Falkor
duplex
Falkor
duplex
Falkor
duplex
Falkor
duplex
Falkor
duplex
Falkor
duplex
Falkor
duplex
Falkor
duplex
Falkor
duplex
Falkor
duplex
Falkor
duplex
Falkor
duplex
Falkor
duplex
Falkor
duplex
8-S
erd
es
SA
TA
CT
LH
DM
AE
MA
C
OC
ME
M
QG
IC
US
B
US
B
US
B
US
B
PW
QF
PR
OM
IMC
MP
M/C
C
8-S
erd
es
PC
le
8-S
erd
es
8-S
erd
es
PC
le
8-S
erd
es
DDR DDR DDR
MCMCMC
DDR DDR DDR
Coherent segmented ring interconnect
L3L3L3L3 L3L3
L3L3L3L3 L3L3
MCMCMC
• 48 physical 2.6 GHz custom cores with large cache
• High bandwidth coherent ring
• Constant peak frequency
• Cache quality of service
• Inline memory bandwidth compression
• Security rooted in hardware
• Leading performance and power efficiency
Qualcomm Centriq 2400: Built for cloud

24
Qualcomm Centriq performance leadership
613
534
657607
SPECint®_rate2006 estimate* SPECfp®_rate2006 estimate*
7% better13% better
Intel Xeon Platinum 8160
24 cores / 48 threads
150W TDP
Qualcomm Centriq 2460
48 cores / 48 threads
120W TDP

25
SKU Core Count L3 Cache Frequency
(base and turbo** freq)
Power
(TDP)
Intel Xeon Platinum 8180 28 38.5 MB 2.5 / 3.8 GHz 205W
Intel Xeon Gold 6152 22 30.25 MB 2.1 / 3.7 GHz 140W
Intel Xeon Silver 4116 12 16.5 MB 2.1 / 3.0 GHz 85W
Comparative SKU lineup
Intel Xeon — Top bin Platinum, Gold, Silver SKUs*
SKU Core Count L3 Cache Frequency
(base and peak** freq)
Power
(TDP)
Qualcomm Centriq 2460 48 60 MB 2.2 / 2.6 GHz 120W
Qualcomm Centriq 2452 46 57.5 MB 2.2 / 2.6 GHz 120W
Qualcomm Centriq 2434 40 50 MB 2.3 / 2.5 GHz 110W

26
Qualcomm Centriq performance leadership
13.912.8
13.613.7 13.8 14.1
~Parity 8% better 4% better
Qualcomm Centriq 2460 120W TDP
vs.
Intel Xeon Platinum 8180 205W TDP*
Qualcomm Centriq 2452 120W TDP
vs.
Intel Xeon Gold 6152 140W TDP*
Qualcomm Centriq 2434 110W TDP
vs.
Intel Xeon Silver 4116 85W TDP*
SP
EC
int®
_ra
te2
00
6 E
stim
ate
pe
r T
hre
ad
Intel Xeon
Qualcomm
Centriq

27
Qualcomm Centriq performance leadership 3.8
4.0 3.9
5.55.3
5.1
SP
EC
int®
_ra
te2
00
6 E
stim
ate
pe
r T
DP
W
Qualcomm Centriq 2460 120W TDP
vs.
Intel Xeon Platinum 8180 205W TDP*
Qualcomm Centriq 2452 120W TDP
vs.
Intel Xeon Gold 6152 140W TDP*
Qualcomm Centriq 2434 110W TDP
vs.
Intel Xeon Silver 4116 85W TDP*
45% better 32% better 31% better
Intel Xeon
Qualcomm
Centriq

28
Qualcomm Centriq energy efficiency
0
20
40
60
80
100
120
Po
we
r (
Wa
tts
)
8W idle power
400.
perlbench
401.
bzip2
403.
gcc
429.
mcf
445.
gobmk
456.
hmmer
458.
libquantum
464.
h264ref
471.
omnetpp
473.
astar
458.
sieng
483.
xalancbmk
SPECint®_rate2006 subtests
120W TDP
Median = 65W

29
Qualcomm Centriq performance leadership
https://s21.q4cdn.com/600692695/files/doc_presentations/2017/TechnologyManufacturingDay/2017_TMD_MarkBohr_
MooresLaw_FINAL.pdf
1.11
1.65
48% better
SP
EC
int®
_ra
te2
00
6 E
stim
ate
pe
r m
m2
698mm2** in Intel 14nm(37.5M transistors per mm2)
398mm2 in Samsung 10LPE
(50M transistors per mm2)
Intel Xeon
Qualcomm
Centriq
Qualcomm Centriq 2460 120W TDP
vs.
Intel Xeon Platinum 8180 205W TDP*

30
Qualcomm Centriq performance leadership
https://ark.intel.com
0.08
0.15
0.330.33
0.46
0.64
4xbetter
3xbetter
2xbetter
Qualcomm Centriq 2460 120W TDP
vs.
Intel Xeon Platinum 8180 205W TDP*
Qualcomm Centriq 2452 120W TDP
vs.
Intel Xeon Gold 6152 140W TDP*
Qualcomm Centriq 2434 110W TDP
vs.
Intel Xeon Silver 4116 85W TDP*
SP
EC
int®
_ra
te2
00
6 E
stim
ate
pe
r C
PU
$
Intel Xeon
Qualcomm
Centriq
31
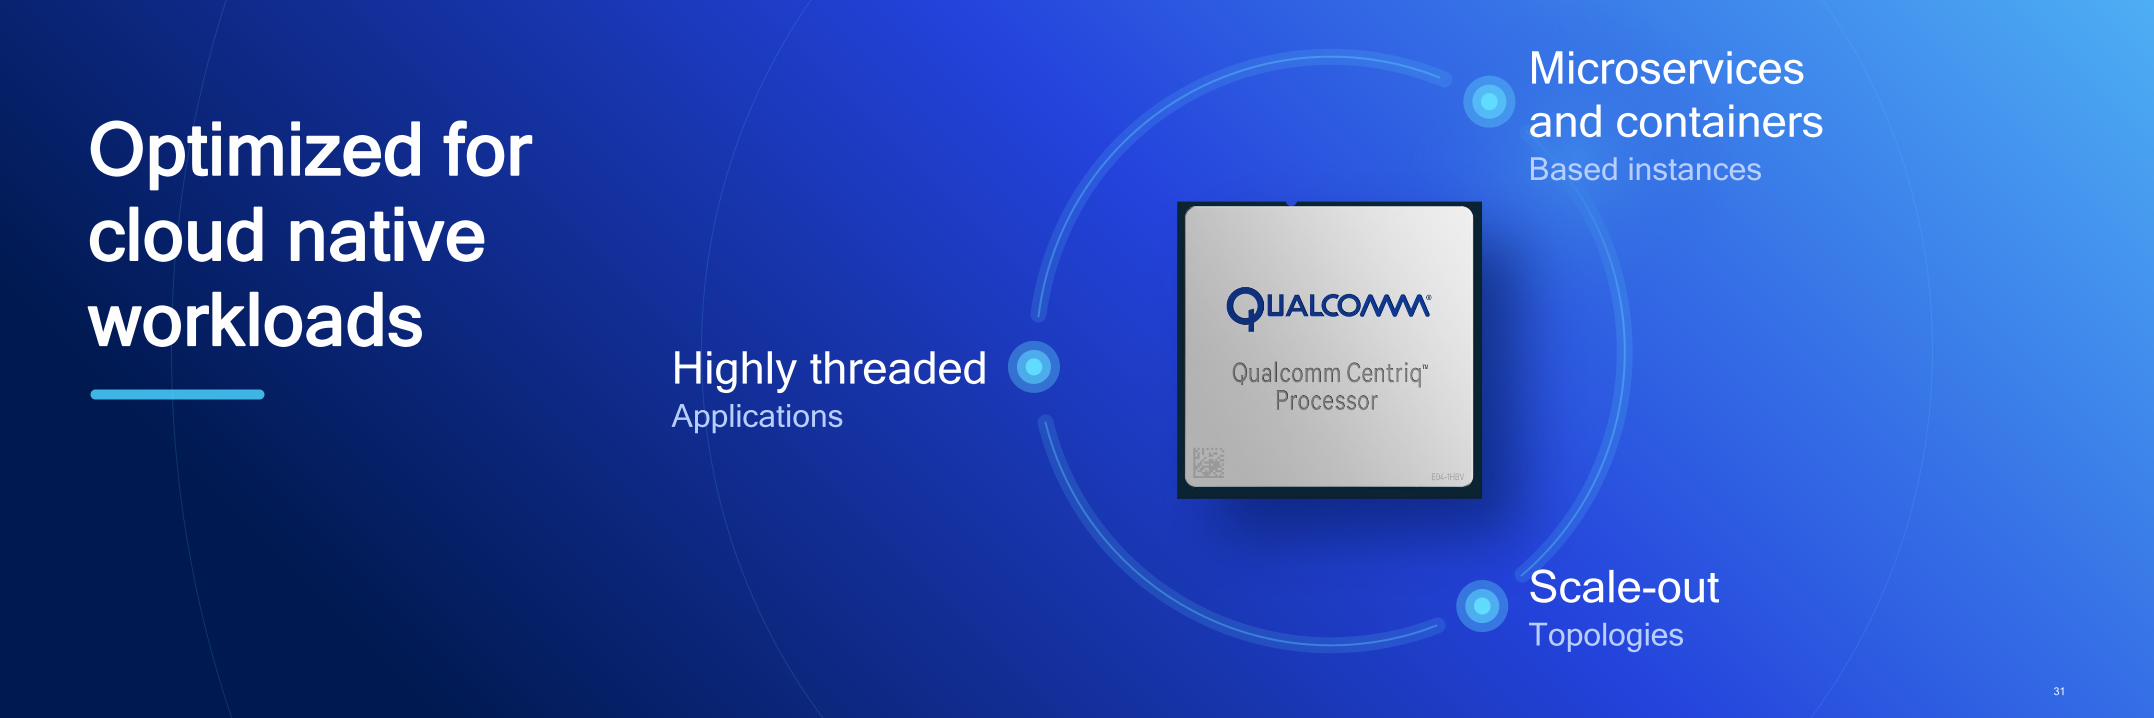
Highly threadedApplications
Scale-outTopologies
Microservices
and containersBased instancesOptimized for
cloud native workloads

32
Firmware platform mgmt
OS
Virtualization
Tools
Languages, runtimes
Cloud / mgmt
Enabling tech
HW Root of Trust / Trusted Execution Environment / Power Management / Secure Boot
GCC / LLVM / Debuggers (JTAG, GDB) / Libraries (glibc, others)
Memcached MongoDB My SQL NGINX Hadoop Apache Spark Redis Cassandra OPNFV
Kubernetes Openstack Mesos Cloud Foundry
Java Python Open JDK PHP Node Golang
KVM Xen Docker
Canonical Redhat Suse CentOS
American Megatrends
Apache Tomcat
Software ecosystem momentum
Azul

33
NowQualcomm Centriq 2400
Falkor Core
NextQualcomm® Firetail™
Qualcomm®
Saphira™ Core
Future
Cadence of innovation

34
World class design team
San JoseAustin Bangalore Beijing Boulder Raleigh San Diego Taipei

35
End notes

36
Qualcomm Centriq 2460 delivers 7% better
integer performance than Intel Xeon Platinum
8160
Qualcomm Centriq 2460 provides up to 7% better integer
performance than Intel Xeon Platinum 8160 based on estimates
of SPECint®_rate2006. In Qualcomm internal testing, Qualcomm
Centriq 2460 scored 657 on estimated SPECint®_rate2006 using
QDT’s Software Development Platform v2 with CentOS 7.3.1611
(AltArch), GCC O2 v6.1.1, 192GB (6x32GB, DDR4-2666), 256
GB SATA drives for boot, versus Intel Xeon Platinum 8160
system score of 613 on estimated SPECint®_rate2006 using
Supermicro SYS-6029P-WTR with CentOS 7.4, GCC 02 v6.1.1,
192GB (6x32GB, DDR4-2666), 240 GB SATA drives for boot.
Qualcomm Centriq 2460 delivers 13% better
floating point performance than Intel Xeon
Platinum 8160
Qualcomm Centriq 2460 provides up to 13% better floating point
performance than Intel Xeon Platinum 8160 based on estimates
of SPECfp®_rate2006. In Qualcomm internal testing, Qualcomm
Centriq 2460 scored 607 on estimated SPECfp®_rate2006 using
QDT’s Software Development Platform v2 with CentOS 7.3.1611
(AltArch), GCC 02 v6.1.1, 192GB (6x32GB, DDR4-2666), 256 GB
SATA drives for boot, versus Intel Xeon Platinum 8160 system
score of 535 on estimated SPECfp®_rate2006 using Supermicro
SYS-6029P-WTR with Cent OS 7.4, GCC 02 v6.1.1, 192GB
(6x32GB, DDR4-2666), 240 GB SATA drives for boot.
Qualcomm Centriq 2460 delivers ~parity
performance per thread versus Intel Xeon
Platinum 8180
Qualcomm Centriq 2460 provides ~parity performance per thread
versus Intel Xeon Platinum 8180 based on estimates of
SPECint®_rate2006. In Qualcomm internal testing, Qualcomm
Centriq 2460 (48 core/48 thread) scored 657 on estimated
SPECint®_rate2006 using QDT’s Software Development
Platform v2 with CentOS 7.3.1611 (AltArch), GCC 02 v6.1.1,
192GB (6x32GB, DDR4-2666), 256 GB SATA drives for boot.
Qualcomm’s internal measurements of the Xeon Platinum 8160
with a system score 612 on SPECint®_rate2006 using
Supermicro SYS-6029P-WTR with CentOS 7.4, GCC 02 v6.1.1,
192GB (6x32GB, DDR4-2666), 4 240 GB SATA drives for boot
show that the 1 socket SPECint®_rate2006 score is
0.286459949 times the published 2 socket icc- based
SPECint(R)_rate2006 score of 2140 published on www.spec.org
as of 11 July 2017. The same scale factor of 0.286459949 was
used to extrapolate a 1-socket Intel Xeon Platinum 8180 (56
core/56 thread) GCC-02 SpecInt® rate2006 estimate of 776
compared to a published 2-socket Intel Xeon Platinum 8180 icc-
based SPECint(R)_rate2006 score of 2710 published on
www.spec.org as of 11 July 2017
Qualcomm Centriq 2452 delivers 8% better
performance per thread than Intel Xeon Gold 6152
Qualcomm Centriq 2452 delivers up to 8% performance per thread
versus Intel Xeon Gold 6152 based on estimates of
SPECint®_rate2006. In Qualcomm internal testing, Qualcomm
Centriq 2452 (46 core/46 thread) scored 636 on estimated
SPECint®_rate2006 using QDT’s Software Development Platform
v2 with CentOS 7.3.1611 (AltArch), GCC 02 v6.1.1, 192GB
(6x32GB, DDR4-2666), 256 GB SATA drives for boot. Qualcomm’s
internal measurements of the Xeon Platinum 8160 with a system
score 613 on SPECint®_rate2006 using Supermicro SYS-6029P-
WTR with CentOS 7.4, GCC 02 v6.1.1, 192GB (6x32GB, DDR4-
2666), 240 GB SATA drives for boot show that the 1 socket
SPECint®_rate2006 score is 0.286459949 times the published 2
socket icc- based SPECint_rate2006 score of 2140 published on
www.spec.org as of 11 July 2017. The same scale factor of
0.286459949 was used to extrapolate a 1-socket Intel Xeon Gold
6152 (22 core/44 thread) GCC-02 SpecInt® rate2006 estimate of
564 compared to a published 2-socket Intel Xeon Gold 6152 icc-
based SPECint®_rate2006 score of 1970 published on
www.spec.org as of 11 July 2017.

37
Qualcomm Centriq 2434 delivers 4% better
performance per thread than Intel Xeon
Silver 4116
Qualcomm Centriq 2434 delivers up to 4% performance per
thread versus Intel Xeon Silver 4116 based on estimates of
SPECint®_rate2006. In Qualcomm internal testing, Qualcomm
Centriq 2434 (40 core/40 thread) scored 565 on estimated
SPECint®_rate2006 using QDT’s Software Development
Platform v2 with CentOS 7.3.1611 (AltArch), GCC 02 v6.1.1,
192GB (6x32GB, DDR4-2666), 256 GB SATA drives for boot.
Using Qualcomm’s internal measurements of the Xeon Silver
4110 with a system score 436 on SPECint®_rate2006 using
Supermicro SYS-6029P-WTR with CentOS 7.4, GCC 02 v6.1.1,
192GB (6x32GB, DDR4-2666), 240 GB SATA drives for boot
adjusted to a 1 socket score of 221 show that the 1 socket
SPECint®_rate2006 score is 0.317716 times the published 2
socket icc- based SPECint®_rate2006 score of 697 published on
www.spec.org as of 11 July 2017. The same scale factor of
0.317716 was used to extrapolate a 1-socket Intel Xeon Silver
4116 (12 core/24 thread) GCC-02 SpecInt®_ rate2006 estimate
of 327 compared to a published 2-socket Intel Xeon Silver 4116
icc-based SPECint®_rate2006 score of 1040 published on
www.spec.org as of 11 July 2017.
Qualcomm Centriq 2460 delivers 45% better
performance per Watt versus Intel Xeon
Platinum 8180
Qualcomm Centriq 2460 provides up to 45% better performance
per Watt versus Intel Xeon Platinum 8180 based on estimates of
SPECint®_rate2006. In Qualcomm internal testing, Qualcomm
Centriq 2460 (120W TDP) scored 657 on estimated
SPECint®_rate2006 using QDT’s Software Development
Platform v2 with CentOS 7.3.1611 (AltArch), GCC 02 v6.1.1,
192GB (6x32GB, DDR4-2666), 256 SATA drives for boot.
Qualcomm’s internal measurements of the Xeon Platinum 8160
with a system score 613 on SPECint®_rate2006 using
Supermicro SYS-6029P-WTR with CentOS 7.4, GCC 02 v6.1.1,
192GB (6x32GB, DDR4-2666), 4 240 GB SATA drives for boot
show that the 1 socket SPECint®_rate2006 score is 0.286459949
times the published 2 socket icc- based SPECint(R)_rate2006
score of 2140 published on www.spec.org as of 11 July 2017.
The same scale factor of 0.286459949 was used to extrapolate a
1-socket Intel Xeon Platinum 8180 (205W TDP) GCC-02
SpecInt® rate2006 estimate of 776 compared to a published 2-
socket Intel Xeon Platinum 8180 icc-based SPECint®_rate2006
score of 2710 published on www.spec.org as of 11 July 2017.
Qualcomm Centriq 2452 delivers 32% better
performance per Watt than Intel Xeon Gold 6152
Qualcomm Centriq 2452 delivers up to 32% performance per
thread versus Intel Xeon Gold 6152 based on estimates of
SPECint®_rate2006. In Qualcomm internal testing, Qualcomm
Centriq 2452 (120W TDP) scored 636 on estimated
SPECint®_rate2006 using QDT’s Software Development
Platform v2 with CentOS 7.3.1611 (AltArch), GCC 02 v6.1.1,
192GB (6x32GB, DDR4-2666), 256 GB SATA drives for boot.
Qualcomm’s internal measurements of the Xeon Platinum 8160
with a system score 613 on SPECint®_rate2006 using
Supermicro SYS-6029P-WTR with CentOS 7.4, GCC 02 v6.1.1,
192GB (6x32GB, DDR4-2666), 240 GB SATA drives for boot
show that the 1 socket SPECint®_rate2006 score is 0.286459949
times the published 2 socket icc- based SPECint®_rate2006
score of 2140 published on www.spec.org as of 11 July 2017.
The same scale factor of 0.286459949 was used to extrapolate a
1-socket Intel Xeon Gold 6152 (140W TDP) GCC-02 SpecInt®
rate2006 estimate of 564 compared to a published 2-socket Intel
Xeon Gold 6152 icc-based SPECint®_rate2006 score of 1970
published on www.spec.org as of 11 July 2017.
Qualcomm Centriq 2434 delivers 31% better
performance per Watt than Intel Xeon Silver 4116
Qualcomm Centriq 2434 delivers up to 31% performance per Watt
versus Intel Xeon Silver 4116 based on estimates of
SPECint®_rate2006. In Qualcomm internal testing, Qualcomm
Centriq 2434 (110W TDP) scored 565 on estimated
SPECint®_rate2006 using QDT’s Software Development Platform v2
with CentOS 7.3.1611 (AltArch), GCC 02 v6.1.1, 192GB (6x32GB,
DDR4-2666), 256 GB SATA drives for boot. Qualcomm’s internal
measurements of the 2-socket Xeon Silver 4110 with a system score
of 436 on SPECint®_rate2006 using Supermicro SYS-6029P-WTR
with CentOS 7.4, GCC 02 v6.1.1, 192GB (6x32GB, DDR4-2666), 240
GB SATA drives for boot adjusted to a 1 socket score of 221 show
that the 1 socket SPECint®_rate2006 score is 0.317716 times the
published 2 socket icc- based SPECint®_rate2006 score of 697
published on www.spec.org as of 11 July 2017. The same scale
factor of 0.317716 was used to extrapolate a 1-socket Intel Xeon
Silver 4116 (85W TDP) GCC-02 SpecInt® rate2006 estimate of 327
compared to a published 2-socket Intel Xeon Silver4116 icc-based
SPECint®_rate2006 score of 1040 published on www.spec.org as of
11 July 2017.
38
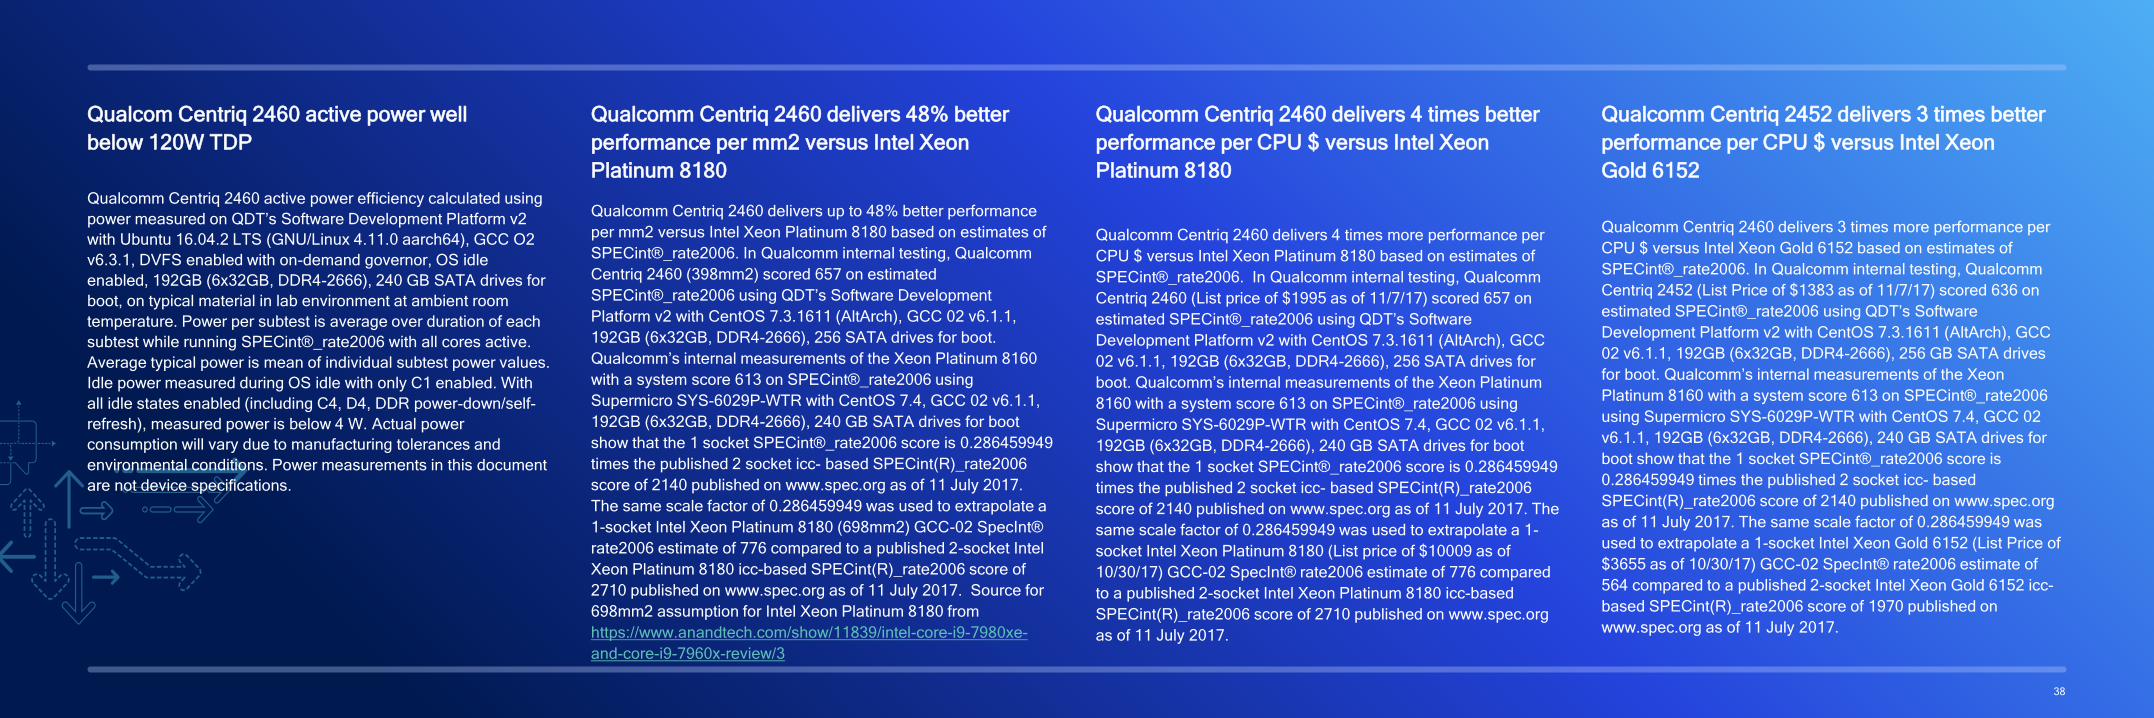
Qualcom Centriq 2460 active power well
below 120W TDP
Qualcomm Centriq 2460 active power efficiency calculated using
power measured on QDT’s Software Development Platform v2
with Ubuntu 16.04.2 LTS (GNU/Linux 4.11.0 aarch64), GCC O2
v6.3.1, DVFS enabled with on-demand governor, OS idle
enabled, 192GB (6x32GB, DDR4-2666), 240 GB SATA drives for
boot, on typical material in lab environment at ambient room
temperature. Power per subtest is average over duration of each
subtest while running SPECint®_rate2006 with all cores active.
Average typical power is mean of individual subtest power values.
Idle power measured during OS idle with only C1 enabled. With
all idle states enabled (including C4, D4, DDR power-down/self-
refresh), measured power is below 4 W. Actual power
consumption will vary due to manufacturing tolerances and
environmental conditions. Power measurements in this document
are not device specifications.
Qualcomm Centriq 2460 delivers 48% better
performance per mm2 versus Intel Xeon
Platinum 8180
Qualcomm Centriq 2460 delivers up to 48% better performance
per mm2 versus Intel Xeon Platinum 8180 based on estimates of
SPECint®_rate2006. In Qualcomm internal testing, Qualcomm
Centriq 2460 (398mm2) scored 657 on estimated
SPECint®_rate2006 using QDT’s Software Development
Platform v2 with CentOS 7.3.1611 (AltArch), GCC 02 v6.1.1,
192GB (6x32GB, DDR4-2666), 256 SATA drives for boot.
Qualcomm’s internal measurements of the Xeon Platinum 8160
with a system score 613 on SPECint®_rate2006 using
Supermicro SYS-6029P-WTR with CentOS 7.4, GCC 02 v6.1.1,
192GB (6x32GB, DDR4-2666), 240 GB SATA drives for boot
show that the 1 socket SPECint®_rate2006 score is 0.286459949
times the published 2 socket icc- based SPECint(R)_rate2006
score of 2140 published on www.spec.org as of 11 July 2017.
The same scale factor of 0.286459949 was used to extrapolate a
1-socket Intel Xeon Platinum 8180 (698mm2) GCC-02 SpecInt®
rate2006 estimate of 776 compared to a published 2-socket Intel
Xeon Platinum 8180 icc-based SPECint(R)_rate2006 score of
2710 published on www.spec.org as of 11 July 2017. Source for
698mm2 assumption for Intel Xeon Platinum 8180 from
https://www.anandtech.com/show/11839/intel-core-i9-7980xe-
and-core-i9-7960x-review/3
Qualcomm Centriq 2460 delivers 4 times better
performance per CPU $ versus Intel Xeon
Platinum 8180
Qualcomm Centriq 2460 delivers 4 times more performance per
CPU $ versus Intel Xeon Platinum 8180 based on estimates of
SPECint®_rate2006. In Qualcomm internal testing, Qualcomm
Centriq 2460 (List price of $1995 as of 11/7/17) scored 657 on
estimated SPECint®_rate2006 using QDT’s Software
Development Platform v2 with CentOS 7.3.1611 (AltArch), GCC
02 v6.1.1, 192GB (6x32GB, DDR4-2666), 256 SATA drives for
boot. Qualcomm’s internal measurements of the Xeon Platinum
8160 with a system score 613 on SPECint®_rate2006 using
Supermicro SYS-6029P-WTR with CentOS 7.4, GCC 02 v6.1.1,
192GB (6x32GB, DDR4-2666), 240 GB SATA drives for boot
show that the 1 socket SPECint®_rate2006 score is 0.286459949
times the published 2 socket icc- based SPECint(R)_rate2006
score of 2140 published on www.spec.org as of 11 July 2017. The
same scale factor of 0.286459949 was used to extrapolate a 1-
socket Intel Xeon Platinum 8180 (List price of $10009 as of
10/30/17) GCC-02 SpecInt® rate2006 estimate of 776 compared
to a published 2-socket Intel Xeon Platinum 8180 icc-based
SPECint(R)_rate2006 score of 2710 published on www.spec.org
as of 11 July 2017.
Qualcomm Centriq 2452 delivers 3 times better
performance per CPU $ versus Intel Xeon
Gold 6152
Qualcomm Centriq 2460 delivers 3 times more performance per
CPU $ versus Intel Xeon Gold 6152 based on estimates of
SPECint®_rate2006. In Qualcomm internal testing, Qualcomm
Centriq 2452 (List Price of $1383 as of 11/7/17) scored 636 on
estimated SPECint®_rate2006 using QDT’s Software
Development Platform v2 with CentOS 7.3.1611 (AltArch), GCC
02 v6.1.1, 192GB (6x32GB, DDR4-2666), 256 GB SATA drives
for boot. Qualcomm’s internal measurements of the Xeon
Platinum 8160 with a system score 613 on SPECint®_rate2006
using Supermicro SYS-6029P-WTR with CentOS 7.4, GCC 02
v6.1.1, 192GB (6x32GB, DDR4-2666), 240 GB SATA drives for
boot show that the 1 socket SPECint®_rate2006 score is
0.286459949 times the published 2 socket icc- based
SPECint(R)_rate2006 score of 2140 published on www.spec.org
as of 11 July 2017. The same scale factor of 0.286459949 was
used to extrapolate a 1-socket Intel Xeon Gold 6152 (List Price of
$3655 as of 10/30/17) GCC-02 SpecInt® rate2006 estimate of
564 compared to a published 2-socket Intel Xeon Gold 6152 icc-
based SPECint(R)_rate2006 score of 1970 published on
www.spec.org as of 11 July 2017.
39
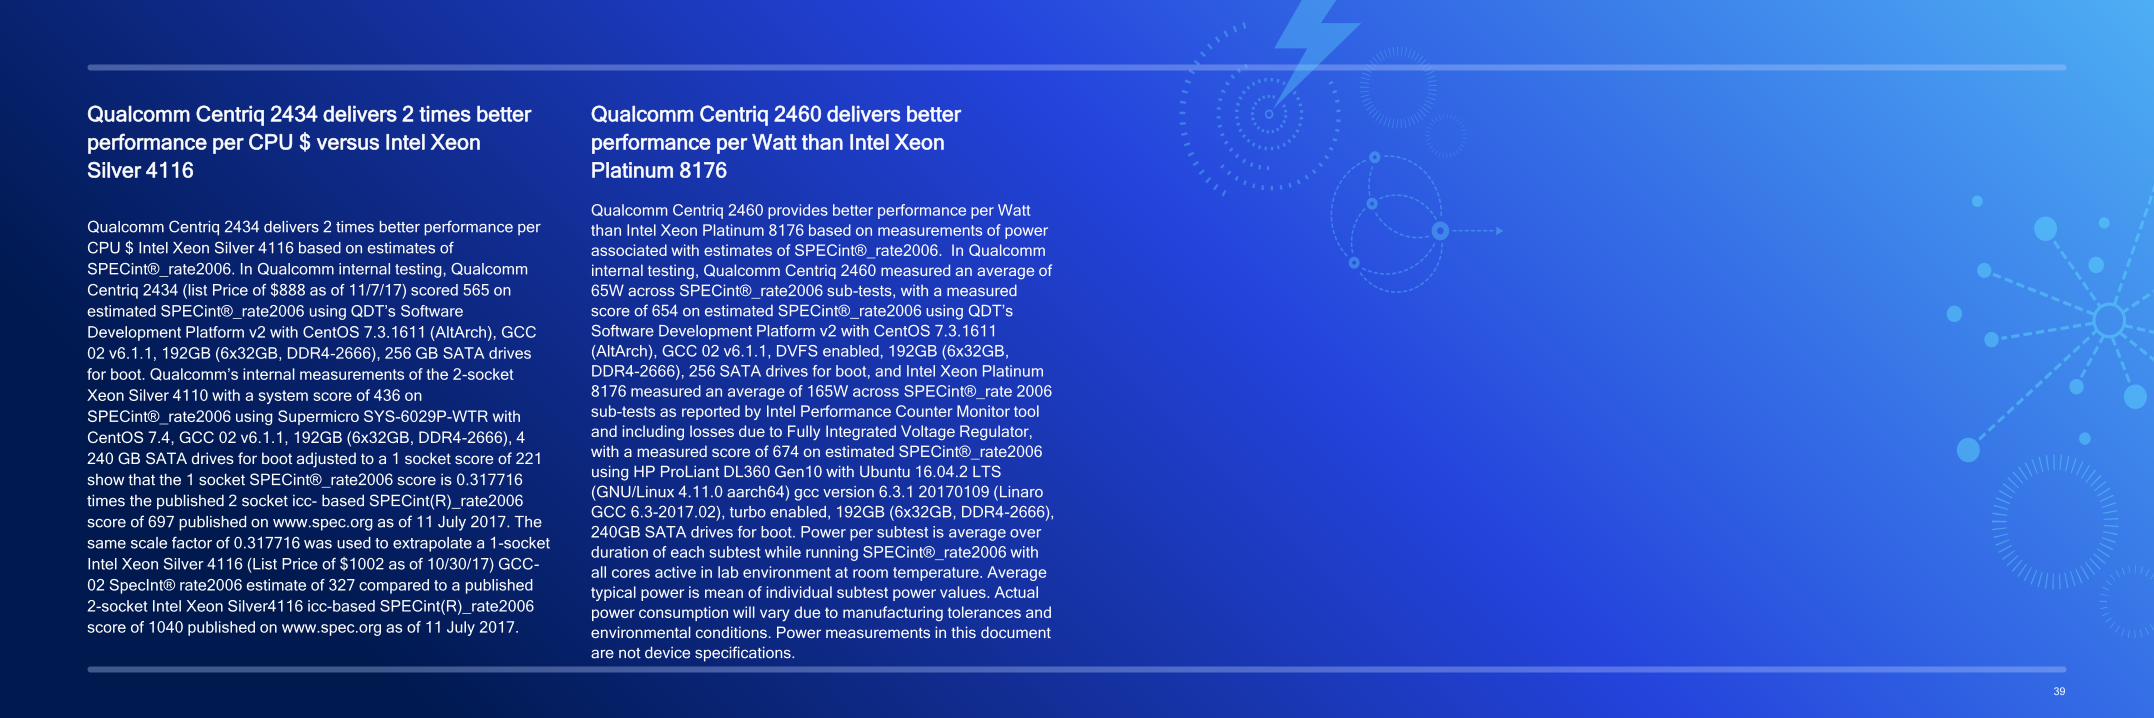
Qualcomm Centriq 2434 delivers 2 times better
performance per CPU $ versus Intel Xeon
Silver 4116
Qualcomm Centriq 2434 delivers 2 times better performance per
CPU $ Intel Xeon Silver 4116 based on estimates of
SPECint®_rate2006. In Qualcomm internal testing, Qualcomm
Centriq 2434 (list Price of $888 as of 11/7/17) scored 565 on
estimated SPECint®_rate2006 using QDT’s Software
Development Platform v2 with CentOS 7.3.1611 (AltArch), GCC
02 v6.1.1, 192GB (6x32GB, DDR4-2666), 256 GB SATA drives
for boot. Qualcomm’s internal measurements of the 2-socket
Xeon Silver 4110 with a system score of 436 on
SPECint®_rate2006 using Supermicro SYS-6029P-WTR with
CentOS 7.4, GCC 02 v6.1.1, 192GB (6x32GB, DDR4-2666), 4
240 GB SATA drives for boot adjusted to a 1 socket score of 221
show that the 1 socket SPECint®_rate2006 score is 0.317716
times the published 2 socket icc- based SPECint(R)_rate2006
score of 697 published on www.spec.org as of 11 July 2017. The
same scale factor of 0.317716 was used to extrapolate a 1-socket
Intel Xeon Silver 4116 (List Price of $1002 as of 10/30/17) GCC-
02 SpecInt® rate2006 estimate of 327 compared to a published
2-socket Intel Xeon Silver4116 icc-based SPECint(R)_rate2006
score of 1040 published on www.spec.org as of 11 July 2017.
Qualcomm Centriq 2460 delivers better
performance per Watt than Intel Xeon
Platinum 8176
Qualcomm Centriq 2460 provides better performance per Watt
than Intel Xeon Platinum 8176 based on measurements of power
associated with estimates of SPECint®_rate2006. In Qualcomm
internal testing, Qualcomm Centriq 2460 measured an average of
65W across SPECint®_rate2006 sub-tests, with a measured
score of 654 on estimated SPECint®_rate2006 using QDT’s
Software Development Platform v2 with CentOS 7.3.1611
(AltArch), GCC 02 v6.1.1, DVFS enabled, 192GB (6x32GB,
DDR4-2666), 256 SATA drives for boot, and Intel Xeon Platinum
8176 measured an average of 165W across SPECint®_rate 2006
sub-tests as reported by Intel Performance Counter Monitor tool
and including losses due to Fully Integrated Voltage Regulator,
with a measured score of 674 on estimated SPECint®_rate2006
using HP ProLiant DL360 Gen10 with Ubuntu 16.04.2 LTS
(GNU/Linux 4.11.0 aarch64) gcc version 6.3.1 20170109 (Linaro
GCC 6.3-2017.02), turbo enabled, 192GB (6x32GB, DDR4-2666),
240GB SATA drives for boot. Power per subtest is average over
duration of each subtest while running SPECint®_rate2006 with
all cores active in lab environment at room temperature. Average
typical power is mean of individual subtest power values. Actual
power consumption will vary due to manufacturing tolerances and
environmental conditions. Power measurements in this document
are not device specifications.

Follow us on:
For more information, visit us at:
www.qualcomm.com & www.qualcomm.com/blog
Nothing in these materials is an offer to sell any of the components or devices referenced herein.
©2017 Qualcomm Technologies, Inc. and/or its affiliated companies. All Rights Reserved.
Qualcomm is a trademark of Qualcomm Incorporated, registered in the United States and other countries.Other products and brand names may be trademarks or registered trademarks of their respective owners.
References in this presentation to “Qualcomm” may mean Qualcomm Incorporated, Qualcomm Technologies, Inc., and/or other subsi diaries or business units within the Qualcomm corporate structure, as applicable. Qualcomm Incorporated includes Qualcomm’s licensing bu siness, QTL, and the vast majority of its patent portfolio. Qualcomm Technologies, Inc., a wholly-owned subsidiary of Qualcomm Incorporated, operates, along with its subsidiaries, substantially all of Qualcomm’s engineering, research and development functions, and substantially all of its p roduct and services businesses, including its semiconductor business, QCT.
Thank you