disposal of cheese whey by digestion
TRANSCRIPT
Disposal of Cheese Whey by DigestionAuthor(s): David BackmeyerSource: Sewage Works Journal, Vol. 20, No. 6 (Nov., 1948), pp. 1115-1118Published by: Water Environment FederationStable URL: http://www.jstor.org/stable/25030997 .
Accessed: 15/06/2014 03:44
Your use of the JSTOR archive indicates your acceptance of the Terms & Conditions of Use, available at .http://www.jstor.org/page/info/about/policies/terms.jsp
.JSTOR is a not-for-profit service that helps scholars, researchers, and students discover, use, and build upon a wide range ofcontent in a trusted digital archive. We use information technology and tools to increase productivity and facilitate new formsof scholarship. For more information about JSTOR, please contact [email protected].
.
Water Environment Federation is collaborating with JSTOR to digitize, preserve and extend access to SewageWorks Journal.
http://www.jstor.org
This content downloaded from 185.2.32.109 on Sun, 15 Jun 2014 03:44:04 AMAll use subject to JSTOR Terms and Conditions
Vol. 20, No. 6 DISPOSAL OF CHEESE WHEY BY DIGESTION 1115
This is not an entirely new prece dent since this division has made some
tests in the past on special occasions,
particularly for the Fire Prevention
Bureau, but has never had the person nel to do such work regularly nor in the amount requested.
It is recommended that a special assistant to the chemist be employed to do the. testing under the direct su
pervision of the chemist and the
undersigned. This assistant would also receive training in sewage labora
tory work to the end that he would be available to take over the duties of the chemist whenever that may become nec
essary. The cost of operating this bu reau would be negligible outside of the assistant's salary and the initial mod est expenditure for equipment.
A summary of plant operation data is given in Table IV.
TABLE IV.?Summary of Operation of the
Item Average
Rainfall (in.). 36.50
Design flow (m.g.d.): Mean D.W.F. 80.0
Max. D.W.F. 140.0
Raw sewage flow (m.g.d.). 46.3
Screenings (cu. yd. per month).... 204
Grit removed (cu. yd. per month).. 73
Suspended solids (p.p.m.) :
Raw sewage. 199
Plant eflluent.. 96
Per cent removal. 51.4
B.O.D. (p.p.m.): Raw sewage. 205
Plant eflluent. 96
Per cent removal. 34.4
Per cent volatile solids:
Raw sewage. 65.4
Digested sludge. 44.4
Digested sludge (cu. yd.) :
To marsh. 30,525
(Ohio) Sewage Treatment Plant for 1947
Item Average
To drying beds. 11,440 Tons dry sludge pulverized for
fertilizer. 915 Tons fertilizer sold. 950
Total sales ($). 9,525 Bay View pumping station costs
($ per m.g.) :
Purchased power. 0.30
Supplies. 0.33
Supervision and labor. 3.38
Total. 4.01
Sewage works costs ($ per m.g.): Power. 0.008
Supplies. 1.15
Supervision and labor. 5.86
Total. 7.02
Gas engine economy ($) :
Pumping cost if power purchased 23,638.49 Actual pumping cost. 6,058.91 Gas engine saving. 17,579.58
DISPOSAL OF CHEESE WHEY BY DIGESTION By David Backmeyer
Superintendent, Water and Sewage Treatment Utilities, Marion, Ind.
The sewage treatment and garbage
disposal plant at Marion, Indiana, was
completed and placed in operation in
July, 1940. This plant, which utilizes
activated sludge for secondary treat
ment, is equipped with complete fa
cilities for separate sludge digestion of
both sewage and garbage solids, to
gether with gas engines for utilization
of the digestion gas. The resident
population of Marion in 1940 was
26,676. The total gas production in
1947 was 23.167 million cu. ft., which
is the equivalent of 2.37 cu. ft. per capita per day.
Whey Waste Problem
During the past 3 years the sewage plant has been seriously overloaded
during the spring months of each year from cheese whey discharged to the
sanitary sewer by one of the local milk
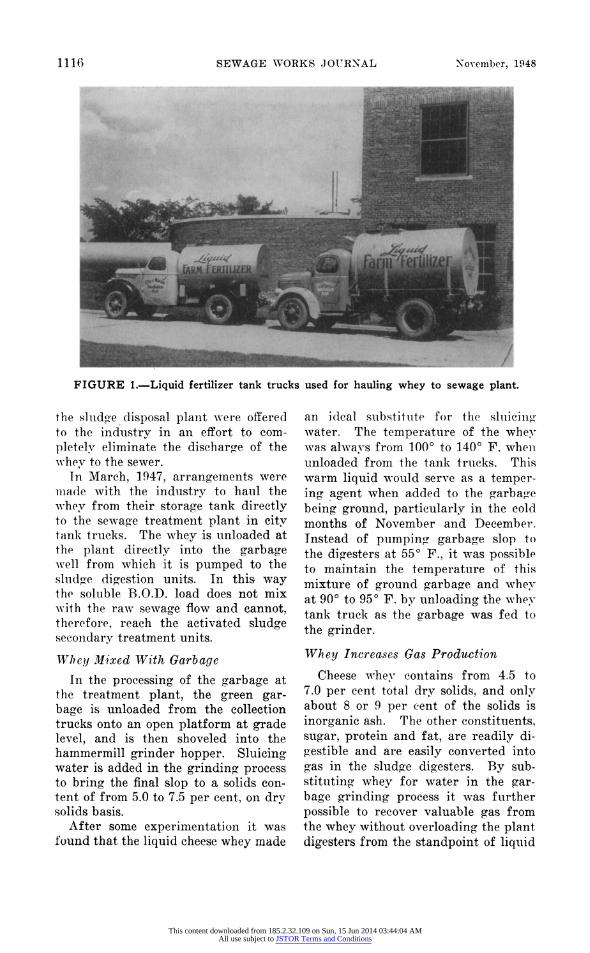
processing plants. As the treatment
plant had been disposing of digested sludge in liquid form by hauling in tank trucks (Figure 1), the facilities of
This content downloaded from 185.2.32.109 on Sun, 15 Jun 2014 03:44:04 AMAll use subject to JSTOR Terms and Conditions
1116 SEWAGE WORKS JOURNAL November, 1948
^v*' '
>v
FIGURE 1.?Liquid fertilizer tank trucks used for hauling whey to sewage plant.
the sludge disposal plant were offered to the industry in an effort to com
pletely eliminate the discharge of the
whey to the sewer.
In March, 1947, arrangements were
made with the industry to haul the
whey from their storage tank directly to the sewage treatment plant in city tank trucks. The whey is unloaded at the plant directly into the garbage
well from which it is pumped to the
sludge digestion units. In this way the soluble B.O.D. load does not mix
with the raw sewage flow and cannot, therefore, reach the activated sludge secondary treatment units.
Whey Mixed With Garbage
In the processing of the garbage at the treatment plant, the green gar bage is unloaded from the collection trucks onto an open platform at grade level, and is then shoveled into the
hammermill grinder hopper. Sluicing water is added in the grinding process to bring the final slop to a solids eon tent of from 5.0 to 7.5 per cent, on dry solids basis.
After some experimentation it was
found that the liquid cheese whey made
an ideal substitute for the sluicing water. The temperature of the whey
was always from 100? to 140? F. when
unloaded from the tank trucks. This warm liquid would serve as a temper
ing agent when added to the garbage being ground, particularly in the cold
months of November and December. Instead of pumping garbage slop to the digesters at 55? F., it was possible to maintain the temperature of this
mixture of ground garbage and whey at 90? to 95? F. by unloading the whey tank truck as the garbage was fed to the grinder.
Whey Increases Gas Production
Cheese whey contains from 4.5 to 7.0 per cent total dry solids, and only about 8 or 9 per cent of the solids is
inorganic ash. The other constituents,
sugar, protein and fat, are readily di
gestible and are easily converted into
gas in the sludge digesters. By sub
stituting whey for water in the gar
bage grinding process it was further
possible to recover valuable gas from the whey without overloading the plant digesters from the standpoint of liquid
This content downloaded from 185.2.32.109 on Sun, 15 Jun 2014 03:44:04 AMAll use subject to JSTOR Terms and Conditions
Vol. 20, No. 6 DISPOSAL OF CHEESE WHEY BY DIGESTION
TABLE I.?Effect of Whey on Plant Operation
1117
Plant Operation Data Before and During Whey Discharge to Sewers
Batch Discharge of Whey
to Sewers, June 23 to
July 7, 1946
Continuous Discharge of Whey to Sewers
Feb. 18 to Mar. 12, 1947
May 18 to 30, 1948
Average for
1946
Average for 76 Months
Prior to Jan. 1, 1947
B.O.D. (p.p.m.): Raw
Settled Final
% Reduction
232 162
7 96.8
212 182 31 85.4
219 149 29 86.7
174 152
13 92.8
188 134
13 93.4
Sludge Index (Mohlman) 138 118 107 91 81
D. 0. Aerator Effluent
(p.p.m.) 1.8 0.9 0.8 3.1
Activated Sludge Volatile Solids (%) 65 75.7 68.4 61.5 58.9
Air Supplied, Cu. Ft./Gal.
Sewage 1.04 1.06 1.32 0.90 0.89
volume fed daily into the digestion system.
A sharp rise in the gas production rate was evident within 30 minutes after the garbage-whey mixture was
pumped to the digesters. On several
days when peak loads of whey were
handled it was necessary to pump the
pure whey to the digesters without the addition of ground garbage. Gas pro duction volumes on these days soared to as much as 108,000 cu. ft. per 24 hour period.
Although the addition of whey to the already heavily loaded digestion system made it extremely difficult to
withdraw clear supernatant from the
digesters, at no time was there any evi dence of foaming or excessive volatile acid accumulation in the digestion sys tem. The carbon dioxide content of the gas produced would increase from 33.0 per cent when small volumes of
whey were being handled to about 36
per cent when large volumes were taken and gas production was at its
peak. No difficulty was encountered in using this fuel in the plant gas en
gines.
Effect of Whey on Plant Operation
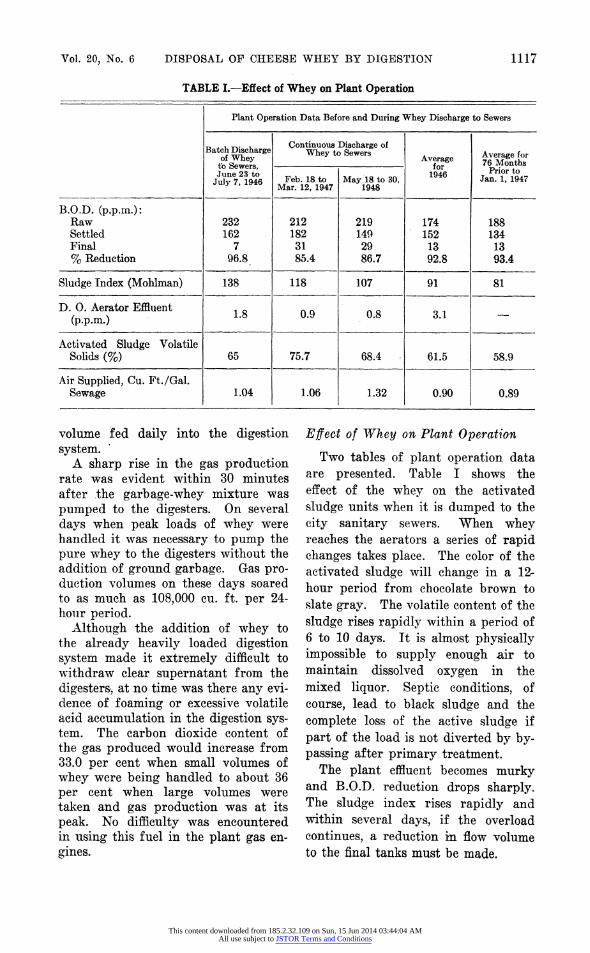
Two tables of plant operation data are presented. Table I shows the
effect of the whey on the activated
sludge units when it is dumped to the
city sanitary sewers. When whey reaches the aerators a series of rapid changes takes place. The color of the
activated sludge will change in a 12
hour period from chocolate brown to
slate gray. The volatile content of the
sludge rises rapidly within a period of 6 to 10 days. It is almost physically
impossible to supply enough air to
maintain dissolved oxygen in the
mixed liquor. Septic conditions, of
course, lead to black sludge and the
complete loss of the active sludge if
part of the load is not diverted by by passing after primary treatment.
The plant effluent becomes murky and B.O.D. reduction drops sharply. The sludge index rises rapidly and within several days, if the overload
continues, a reduction in flow volume to the final tanks must be made.
This content downloaded from 185.2.32.109 on Sun, 15 Jun 2014 03:44:04 AMAll use subject to JSTOR Terms and Conditions
1118 SEWAGE WORKS JOURNAL November, 1948
TABLE II.?Whey Discharged to Digesters During 1947-48
Month I Loads Thousand Gallons
Per Cent Dry
Solids
Thousand Pounds
Dry Solids
Per Cent Volatile
Solids
Thousand Pounds Volatile
Solids
Thousand Pounds Sludge
Dry Solids, to Plant
Percentage Whey Solids
of Sludge Solids
B.O.D. of Whey (p.p.m.)
1947 March
April May
July August
September October
November
December
1948 March
April May
Average
23
27
43
34
25
2
61
73
103
76 88 10
47
29.7
36.9
43.0
34.0
25.0
2.0
61.0
73.0
103.0
76.0
88.0
10.0
48.5
5.60
5.74
6.31
6.03
5.50
6.48
5.65
5.19
5.13
4.73
4.90
6.14
5.61
14.2
17.8
23.0
17.0
11.5
1.1
28.8
31.3
43.9
26.2
14.5
4.6
19.5
92.0
91.5
91.7
91.5
91.0
94.5
92.5
90.9
91.1
89.4
91.1
95.4
91.7
13.1
16.3
21.1
15.5
10.4
1.0
26.6
28.4
40.0
23.4
13.2
4.4
17.8
223.1
113.6
205.5
288.6
292.3
276.8
236.2
176.7 277.6
275.5
259.1
253.8
239.0
6.35
15.70
11.20
5.89
3.92
0.39
12.16
17.70 15.85
9.53
5.57
1.83
8.80
33,100 46,200 36,300 34,700 33,200
34,700 32,340
35,700
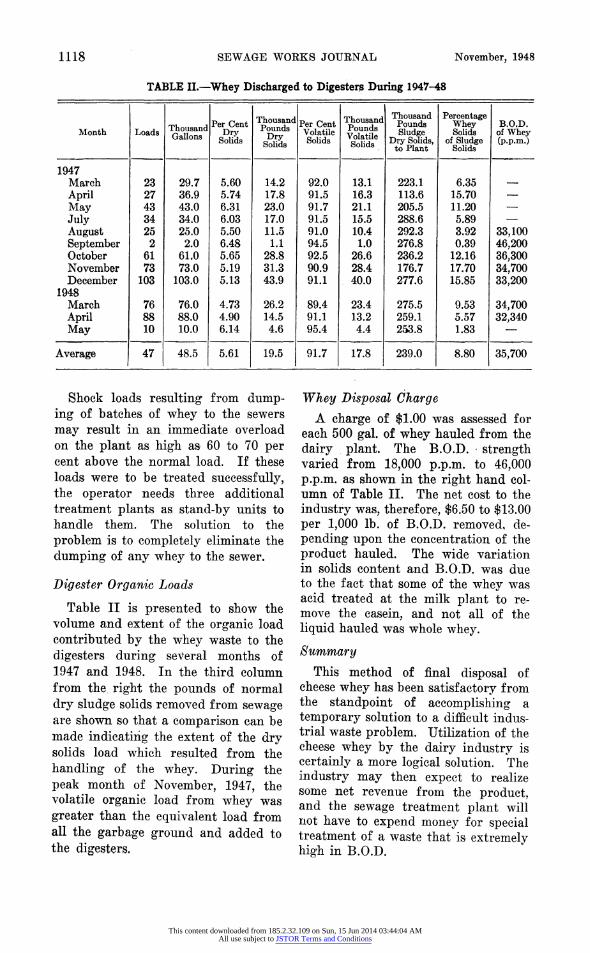
Shock loads resulting from dump
ing of batches of whey to the sewers
may result in an immediate overload on the plant as high as 60 to 70 per cent above the normal load. If these loads were to be treated successfully, the operator needs three additional treatment plants as stand-by units to
handle them. The solution to the
problem is to completely eliminate the
dumping of any whey to the sewer.
Digester Organic Loads
Table II is presented to show the volume and extent of the organic load
contributed by the whey waste to the
digesters during several months of 1947 and 1948. In the third column from the right the pounds of normal
dry sludge solids removed from sewage are shown so that a comparison can be
made indicating the extent of the dry solids load which resulted from the
handling of the whey. During the
peak month of November, 1947, the volatile organic load from whey was
greater than the equivalent load from all the garbage ground and added to the digesters.
Whey Disposal Charge
A charge of $1.00 was assessed for each 500 gal. of whey hauled from the
dairy plant. The B.O.D. strength varied from 18,000 p.p.m. to 46,000 p.p.m. as shown in the right hand col umn of Table II. The net cost to the
industry was, therefore, $6.50 to $13.00 per 1,000 lb. of B.O.D. removed, de
pending upon the concentration of the
product hauled. The wide variation in solids content and B.O.D. was due to the fact that some of the whey was acid treated at the milk plant to re
move the casein, and not all of the
liquid hauled was whole whey.
Summary
This method of final disposal of cheese whey has been satisfactory from the standpoint of accomplishing a
temporary solution to a difficult indus trial waste problem. Utilization of the cheese whey by the dairy industry is
certainly a more logical solution. The
industry may then expect to realize some net revenue from the product, and the sewage treatment plant will not have to expend money for special treatment of a waste that is extremely high in B.O.D.
This content downloaded from 185.2.32.109 on Sun, 15 Jun 2014 03:44:04 AMAll use subject to JSTOR Terms and Conditions