displacements and transformations of nitrate-rich...
TRANSCRIPT

Ple
ase
note
that
this
is a
n au
thor
-pro
duce
d P
DF
of a
n ar
ticle
acc
epte
d fo
r pub
licat
ion
follo
win
g pe
er re
view
. The
def
initi
ve p
ublis
her-a
uthe
ntic
ated
ver
sion
is a
vaila
ble
on th
e pu
blis
her W
eb s
ite
1
Ocean Dynamics April 2005; 55(1) : 34 - 46 http://dx.doi.org/10.1007/s10236-005-0111-5© 2005 Springer-Verlag The original publication is available at http://www.springerlink.com
Archimer, archive institutionnelle de l’Ifremerhttp://www.ifremer.fr/docelec/
Displacements and transformations of nitrate-rich and nitrate-poor water
masses in the tropical Pacific during the 1997 El Niño
Marie-Helene Radenac1*, Yves Dandonneau2 and Bruno Blanke3
1Laboratoire drsquoÉtudes en Géophysique et Océanographie Spatiale CNRS-IRD-UPS-CNES, 14 avenue Édouard Belin, 31401 Toulouse cedex 9, France 2IPSL, Laboratoire drsquoOcéanographie Dynamique et de Climatologie CNRS-IRD-UPMC, case 100, 4 place Jussieu, 75252 Paris cedex 05, France 3Laboratoire de Physique des Océans, UFR Sciences et Technique CNRS-IFREMER-UBO, 6 avenue Le Gorgeu, 809, 29285 Brest, France *: Corresponding author : Phone: +33-561-333000 Fax: +33-561-253205 [email protected]
Abstract: A Lagrangian analysis was applied to the outputs of a coupled physical-biogeochemical model to describe the redistribution of nitrate-rich and nitrate-poor surface water masses in the tropical Pacific throughout the major 1997 El Niño. The same tool was used to analyze the causes of nitrate changes along trajectories and to investigate the consequences of the slow nitrate uptake in the high nutrient low chlorophyll (HNLC) region during the growth phase of the event. Three patterns were identified during the drift of water masses. The first mechanism is well known along the equator: oligotrophic waters from the western Pacific are advected eastward and retain their oligotrophic properties along their drift. The second concerns the persistent upwelling in the eastern basin. Water parcels have complex trajectories within this retention zone and remain mesotrophic. This study draws attention to the third process which is very specific to the HNLC region and to the El Niño period. During the 1997 El Niño, horizontal and vertical inputs of nitrate decreased so dramatically that nitrate uptake by phytoplankton became the only mechanism driving nitrate changes along pathways. The study shows that because of the slow nitrate uptake characteristic of the tropical Pacific HNLC system, nitrate in the pre-El Niño photic layer can support biological production for a period of several months. As a consequence, the slow nitrate uptake delays the gradual onset of oligotrophic conditions over nearly all the area usually occupied by upwelled waters. Owing to this process, mesotrophic conditions persist in the tropical Pacific during El Niño events. Keywords: Nitrate uptake - Tropical Pacific - El Niño - Lagrangian analysis

2
Abstract A Lagrangian analysis was applied to the outputs of a coupled physical-biogeochemical model to
describe the redistribution of nitrate-rich and nitrate-poor surface water masses in the tropical Pacific throughout
the major 1997 El Niño. The same tool was used to analyze the causes of nitrate changes along trajectories and
to investigate the consequences of the slow nitrate uptake in the High Nutrient Low Chlorophyll (HNLC) region
during the growth phase of the event. Three patterns were identified during the drift of water masses. The first
mechanism is well known along the equator: oligotrophic waters from the western Pacific are advected eastward
and retain their oligotrophic properties along their drift. The second concerns the persistent upwelling in the
eastern basin. Water parcels have complex trajectories within this retention zone and remain mesotrophic. This
study draws attention to the third process which is very specific to the HNLC region and to the El Niño period.
During the 1997 El Niño, horizontal and vertical inputs of nitrate decreased so dramatically that nitrate uptake by
phytoplankton became the only mechanism driving nitrate changes along pathways. The study shows that
because of the slow nitrate uptake characteristic of the tropical Pacific HNLC system, nitrate in the pre-El Niño
photic layer can support biological production for a period of several months. As a consequence, the slow nitrate
uptake delays the gradual onset of oligotrophic conditions over nearly all the area usually occupied by upwelled
waters. Owing to this process, mesotrophic conditions persist in the tropical Pacific during El Niño events.
Keywords nitrate uptake tropical Pacific El Niño Lagrangian analysis
1 Introduction
Nitrate-rich waters of the equatorial divergence in the eastern tropical Pacific are surrounded
by oligotrophic regions: the warm pool to the west and the subtropical gyres north and south.
In the photic layer of the equatorial divergence, the phytoplankton biomass is low relative to
available nitrate concentrations. High Nutrient Low Chlorophyll (HNLC) conditions persist
because the ecosystem is iron-limited and grazing-balanced (Landry et al. 1997). Biologically
available iron in the photic layer is mainly upwelled from the Equatorial Undercurrent (EUC)
(Coale et al. 1996). The overall consequences of such an ecosystem are that nitrate uptake is
kept at a very low rate (Price et al. 1994) and that a large amount of surface nitrate remains
unused in surface water (Coale et al. 1996; Landry et al. 1997). The northern limit of the
enriched waters of the equatorial divergence is sharply defined around 5°N (Wyrtki and
Kilonsky 1984; Bender and McPhaden 1990). The surface waters of the tropical part of the
north Pacific gyre are nitrate-depleted with low phytoplankton biomass (Wyrtki and Kilonsky
1984; Hardy et al. 1996). The deep chlorophyll maximum is close to the nitracline at about
100 m depth (Venrick et al. 1973; Levitus et al. 1993; Karl and Lukas 1996). South of the
HNLC waters of the equatorial divergence, the tropical gyre is probably among the most
undersampled regions. Cruise surveys have shown a deep nitrate-depleted surface layer with
low chlorophyll concentration (Dandonneau 1979; Wyrtki and Kilonsky 1984; Hardy et al.

3
1996; Raimbault et al. 1999). Nutrient-rich surface water as far south as 12°S is a frequent
feature (Wyrtki and Kilonsky 1984; Dandonneau and Eldin 1987; Bender and McPhaden
1990; Raimbault et al. 1999) and the transition between the mesotrophic and oligotrophic
waters is more gradual than at the northern limit.
West of the equatorial divergence, the transition toward the warm pool is marked by a
sharp salinity front while the sea surface temperature increases smoothly (Kuroda and
McPhaden 1993; Eldin et al. 1997). This is also the site of transition between the HNLC and
oligotrophic equatorial ecosystems producing a discontinuity of chemical and biological
properties such as nutrients, chlorophyll, zooplankton biomass, pCO2, and phytoplankton
community structure (Inoue et al. 1996; Eldin et al. 1997; Boutin et al. 1999; Le Borgne et al.
2002; Kobayashi and Takahashi 2002). Mean zonal currents approach zero in this region of
convergence (Picaut et al. 1996). Warm pool waters, defined by temperature greater than
29°C (McPhaden and Picaut 1990), are nitrate-depleted with very low chlorophyll and new
production. The nitracline, the chlorophyll maximum and a weak new production maximum
are closely associated with the thermocline at a depth of around 100 m (Mackey et al. 1995;
Radenac and Rodier 1996; Navarette 1998).
Biogeochemical conditions in the tropical Pacific change drastically during El Niño
events. These changes are generally understood to be a significant reduction in primary and
export production in the entire equatorial cold tongue (Barber and Chavez, 1983; Strutton and
Chavez 2000). Measurements relying on oceanographic cruises, merchant ships, moorings, as
well as model studies have revealed changes in the east-west equatorial asymmetry of
nutrients and biology. Nevertheless, it was during the 1997-1998 event that this impact was
first visualized on the tropical Pacific basin scale owing to the timely launches of new ocean
color sensors (Fig. 1). The Polarization and Directionality of the Earth Reflectances
(POLDER) (Deschamps et al. 1994) and Ocean Color and Temperature Scanner (OCTS)
sensors aboard the ADEOS satellite provided data (November 1996-June 1997) before and
during the early phase of the event. The Sea-viewing Wide Field-of-view Sensor (SeaWiFS)
(McClain et al. 1998) mission started in September 1997 and captured the warm phase. Fig. 1
summarizes the evolution of the 1997 El Niño event as observed by ocean color sensors.
Before the onset of the event, weak La Niña conditions prevailed in the tropical basin in late
1996 (Fig. 1a) and chlorophyll rich waters (Muramaki et al. 2000; Radenac et al. 2001; Ryan
et al. 2002) extended across most of the equatorial basin. In May 1997, the satellite
chlorophyll (Fig. 1b) had fallen by about 50% since November 1996 and reached about
0.1 mg m-3 in the western part of the equatorial cold tongue. East of 160°W however, the

4
surface chlorophyll remained close to the November 1996 values (about 0.2 mg m-3). During
the peak of the event, from November 1997 to January 1998 (Fig. 1c), more than six months
after the El Niño event started, the chlorophyll-rich region was reduced to its narrowest zonal
extent (Radenac et al. 2001) and high chlorophyll waters stretch from the Central American
coast to the equatorial western basin (Murtugudde et al. 1999). Unfortunately, there was a
three-month gap (July to September 1997) in the time series of ocean color data that
corresponded to an essential transition phase of the onset of El Niño.
What were the processes that led to the December 1997 biological situation as
revealed by ocean color sensors in the tropical Pacific (Fig. 1c)? Most previous studies
focused on the equatorial zone. Observations and simulations have shown that the variability
of nitrate, chlorophyll or new production is mainly controlled by the fast equatorial dynamics
(Chavez et al. 1998; Stoens et al. 1999; Friedrichs and Hofmann 2001; Radenac et al. 2001)
and their analyses stressed the abrupt decrease of primary production. They did not closely
examine the off-equatorial situation for which we hypothesize here that the low nitrate uptake
rate characteristic of the HNLC ecosystem should delay the setting up of oligotrophic
conditions that characterize El Niño. In this study, a Lagrangian analysis (Blanke and
Raynaud 1997) was applied to the outputs of a physical-biogeochemical model (Radenac et
al. 2001) to address the following two issues. First, the goal was to describe the redistribution
of surface water masses in the tropical basin during the 1997 El Niño and secondly, to
investigate the role of the slow nitrate uptake in the HNLC region during the growth phase of
the event.
2 Numerical tools and data
2.1 The physical-biological model
The primitive equation general circulation model (GCM) (Maes et al. 1997; Vialard et al.
2001) covers the tropical Pacific between 120°E and 75°W and between 30°N and 30°S. The
zonal resolution is 1° and the meridional resolution, close to 0.5° between 5°N and 5°S,
increases to 2° at the northern and southern boundaries. The vertical resolution is nearly 10 m
over the first 120 m in depth and increases downward. Wind stress data derived from the
ERS1-2 scatterometer are used to force the model during the 1993-1998 period. Estimates of
the heat and freshwater fluxes are computed from the 1979-1993 seasonal cycle of the
ECMWF reanalysis. The modeled heat flux is parameterized following Vialard et al. (2001).

5
The long term SST drift is counterbalanced by a -40 W m-2 K-1 relaxation (with a relaxation
timescale of 50 days for a 40 m layer) toward the observed Reynolds and Smith (1994) sea
surface temperature. A correction term derived as by Vialard et al. (2002) is also applied to
the freshwater flux to avoid the sea surface salinity drift caused by the forcing freshwater flux.
Five-day outputs of the ocean circulation model (zonal velocity u, meridional velocity
v, vertical velocity w, vertical diffusion coefficient Kz) and the same spatially uniform
horizontal eddy coefficient Kh as in the GCM force the nitrate advection-diffusion equation:
( ) ( ) SNOKNOKNOwNOvNOuNO zzzhhzyxt ++∆+−−−= 333333 ∂∂∂∂∂∂ (1)
in which the left-hand side represents the local nitrate change. The first three terms on the
right-hand side are the zonal, meridional and vertical advection, respectively. The fourth and
fifth terms are the horizontal diffusion (parameterized by the horizontal Laplacian operator
∆h) and the vertical diffusion.
In the euphotic layer, the biological model consists of a nitrate uptake S (new
production) that is biomass-dependant (Price et al. 1994; Landry et al. 1997):
[ ]ChlKPUR
PURKNO
NOVS
ENOmax ++
−=33
3 (2)
in which both the nitrate and light limitations terms are expressed in Michaelis-Menten form.
The photosynthetic usable radiation (PUR) is deduced from the short wave downward
radiation as explained by Stoens et al. (1999) and KE (70×10-6 mol photon m-2 s-1) is the half
saturation constant for PUR. The maximum nitrate uptake rate Vmax (3×10⁻³
µmol N mg Chl-1 s-1) and the half saturation concentration KNO3 (0.01 µM) have been adjusted
in such a way that modeled nitrate fields agree the best with concurrently observed vertical
sections of nitrate content. Because this model does not explicitly resolve variations in
biomass, a calculation specific to the tropical Pacific is applied to chlorophyll profiles
empirically derived from modeled nitrate at the surface (Stoens et al. 1999). New production
is locally exported (exponential shape as by Honjo, 1978, with a 120m length scale) below the
photic layer and is instantaneously remineralized into nitrate. Details on the choice of
constants and rationale of the biological model are given in Stoens et al. (1999) and Radenac
et al. (2001).

6
2.2 The Lagrangian tool
The Lagrangian approach described in detail by Blanke and Raynaud (1997) is applied to the
physical-biological model outputs. Streamlines are computed from the archived, three-
dimensional velocity field (5-day running means). Assuming that the velocity is stationary
over each successive sampling period, consecutive portions of streamlines represent the
trajectories of particles. Properties along trajectories are interpolated from modeled three-
dimensional fields. Both direct and reverse (finding the origin of water mass) experiments can
easily be performed because it is an off-line technique.
In a Lagrangian form, the equation of conservation of nitrate is:
( ) ( ) SNOKNOKNOd zzzhht ++∆= 333 ∂∂ (3)
in which the nitrate change along the trajectory ( 3NOdt ) corresponds to the effect of the
horizontal and vertical diffusions and of the nitrate sink S (eq. 2). For off-line diagnostics, this
relation is still valid if we assume that unsampled tracer and velocity fluctuations are small
relative to their mean values on the time scale of the model outputs. Previous studies using a
similar model (Maes et al. 1997; Lehodey et al. 1998; Stoens et al. 1999; Vialard et al. 2001;
Radenac et al. 2001) have shown that five-day outputs are relevant for capturing the large-
scale variability in the tropical Pacific.
The December 1997 (Fig. 1c) situation was chosen to represent the peak of the 1997
El Niño and the May 1997 situation (Fig. 1b) as the reference for the early stage of the event.
At that time, the surface circulation characteristic of El Niño had clearly emerged while the
disruption of the east-west equatorial trophic contrast was just starting. Our Lagrangian
analyses refer to these situations. The aim is to investigate the redistribution of tropical
surface water masses and to explain nitrate variations along specific trajectories.
2.3 Identification of water masses
The domain was partitioned into six surface water masses (Table 1) and one subsurface water
mass essentially based on the nitrate distribution in May 1997. A 1 µM nitrate threshold
discriminates oligotrophic waters from nitrate-rich waters. Among the oligotrophic surface
waters, an additional temperature criterion (T ≥ 29°C) was used to identify warm pool water
and geographical limits bounded the northwest subtropical water, the northeast subtropical
water and the south subtropical water. Surface nitrate-rich waters have concentration between
1 and 12 µM. Geographical criteria separated the equatorial upwelled water and the coastal

7
waters of Central and South America. Although two nitrate criteria are used to define
subsurface waters, one single class represents them. Subsurface waters underlying nitrate-rich
surface waters have nitrate concentration higher than 12 µM and they have nitrate
concentration higher than 1 µM beneath oligotrophic surface waters. These water masses will
be denominated below according to their status in May 1997, even if their nitrate content
(oligotrophic/mesotrophic) changes during the course of the El Niño.
2.4 Validation data
Three existing data sets were used to validate the modeled surface circulation in 1997. The
first one consisted of currents data gathered twice a year during cruises undertaken to
maintain the Tropical Atmosphere Ocean/Triangle Trans Ocean Buoy Network
(TAO/TRITON) moorings between 165°E and 95°W (Hayes et al. 1991; McPhaden et al.
1998). During these cruises, ADCPs were operated continuously along meridional sections.
The processing and gridding of these data have been described in detail by Johnson et al.
(2000). In the second data set (Ocean Surface Current Analysis – Real time, OSCAR), near-
surface currents were derived from satellite altimeter, scatterometer and sea surface
temperature (Lagerloef et al. 1999; Bonjean and Lagerloef 2002). In this product, the 30 m
surface layer current is the sum of geostrophic and Ekman currents and of a buoyancy term. It
encompasses the period since October 1992 on a 1°×1° grid with a 10-day temporal
resolution. The last set of data used for of the 6-hour interpolated trajectories was collected
from the satellite-tracked drifting buoys by the Atlantic Oceanographic and Meteorological
Laboratory (AOML) (Pazan and Niiler 2004). These data are available on-line
(http://www.aoml.noaa.gov/phod/dac/dacdata.html) and their processing has been described
by Hansen and Poulain (1996).
3 Results
3.1 Surface circulation
The 'climatology' (not shown) that we derived from the modeled 15 m currents averaged over
the 1993-1996 period (the 1997-1998 ENSO years were excluded because of the strong
anomalies present at that time) is very similar to the one presented by Vialard et al (2001;
their fig. 5). Consequently, the reader is referred to Vialard et al. (2001) and Radenac et al.
(2001) for a validation of the mean modeled surface currents. The salient contrast between

8
modeled surface circulation before and during the 1997 El Niño is illustrated in fig.1. The
time evolution of the zonal current along 155°W as derived from satellites and from the
model is shown in fig.2. Snapshots of zonal velocity measured during the pre-El Niño
(December 1996) and El Niño (May and November 1997) TAO/TRITON cruises are also part
of the validation data set (Fig. 2c).
As was expected, the modeled South Equatorial Current (SEC) during cold conditions
in late 1996 was stronger than average and spread well past the date line. The North
Equatorial Countercurrent (NECC) was strong and extended across the basin. These features
are consistent with surface currents measured during cruises or deduced from satellite data
(Lagerloef et al. 1999; Johnson et al. 2000). Between the boreal fall of 1996 and the spring of
1997, the NECC shifted southward and grew in strength (Fig. 2). Its zonal velocity peaked in
the fall of 1997. At the equator, the current was mostly eastward from March to the end of the
year, except in July and August. These eastward currents merged into a large eastward flow
between 6°N and 2°S (Johnson et al. 2000). The model often failed to reproduce the bimodal
structure of the eastward flow during the mature phase (see the November 1997 meridional
profile). Actually, the eastward current at the equator was accurately simulated but the NECC
was too weak. In November, the maximum zonal current measured during the cruise or
derived from satellite data was close to 1 m s-1, which is about twice the modeled velocity.
Besides, a comparison with the TAO zonal current (not shown) shows that the model tended
to overestimate the duration and westward extent of the brief-living SEC in July-August,
while the satellite derived currents seem to have missed part of this event.
Trajectories of satellite-tracked drifters integrate the different circulation events that
occurred during the 1997 El Niño. They resolve circulation features at a high spatial
resolution of which the GCM derived trajectories are not capable. Nevertheless, their
comparison reveals interesting and consistent large-scale patterns. Drifters present between
15°S and 15°N in May 1997 were selected and their displacements followed until December
1997 (Fig. 3a). The coverage is rather sparse except in the near equatorial region and in the
southern hemisphere west of 140°W. To compare these observed trajectories with the
modeled circulation, virtual drifters were released in the modeled velocity field at the location
of the in situ drifting buoys (Fig. 3b): in the North Equatorial Current (NEC) region, in the
near equatorial zone and in the south and south west regions. All simulated trajectories begin
in early May 1997 and are integrated until December 1997 at a constant depth (15 m) in order
to better represent the 15m deep circulation followed by in situ drifters (Niiler 2001).

9
The observed trajectories that start between 10°N and 15°N had roughly eastward
drifts and remained within this latitude band. In the model, the zonal component of the NEC
was too weak and, as a result the virtual drifters had too strong a poleward drift. A
comparison with the Reverdin et al. (1994) climatology confirms the poleward trend of
modeled currents in this region. Nine in situ drifters released in the near equatorial zone (3°S-
1°N) were caught in the strong eastward surface flow that dominates over most of the
equatorial basin in May and June. They separated into two groups when the SEC resumed in
July. In the northern group, two of these drifters rapidly travelled eastward following the
strong NECC. This pathway was well represented by the model. Virtual drifters released at
150°W in May were around 3.6°N, 117°W in October, which is close to the position reached
by in situ drifters (3°N, 120°W). The remaining 7 drifters formed the southern group that was
swept southward in July. In this group, the model reproduced the timing of the direction
changes. While in situ drifters travelled 4 to 6 degrees further south in the vicinity of 160°W
than virtual drifters, in situ and virtual drifters had about the same southward drift along
140°W. These results suggest that the modeled southward velocity has been underestimated in
the central western Pacific. However, measured and modeled meridional velocities during the
fall 1997 are in agreement. Whereas the measured meridional component is greater than
0.1 m s-1 along 155°W south of 4°S and smaller further east, the modeled meridional
component always ranges between 0 and 0.05 m s-1. Further east, the 3 in situ buoys that
started in the equatorial zone near 100°W remained in the eastern basin. In the model, some of
the drifters released at 100°W meandered in the complex circulation patterns in the eastern
part of the upwelling. The remainder travelled south. In situ drifters located in the southeast
region (115°W-3°S and 90°W-9°S) show a westward component which is stronger than in the
model, especially at the end of the period. In situ buoys released in May in the 12°S-13°S
region had a strong westward drift that was not reproduced in the central basin by the model.
The agreement was better in the western zone.
3.2 Nitrate and new production
In late 1996, before the onset of the event, the surface nitrate concentrations in the central
Pacific were representative of cold conditions both in the observations (Strutton and Chavez
2000) and in the model (Fig. 4). However, the measured nitrate was underestimated by the
model by 1.5 to 2 µM. The nitrate concentration fell abruptly near 2-4°N (convergence and
downwelling zone, advection of low nitrate water from the west by the NECC) while the

10
decrease at the southern edge of the upwelling was more gradual. Modeled new production
was within the range of values found in the literature (McCarthy et al. 1996; Navarette 1998;
Raimbault et al. 1999; Turk et al. 2001; Aufdenkampe et al. 2002). It was lower than 1
mmol N m-2 d-1 in the oligotrophic region whereas in the Wyrtki (1981) box (5°S-5°N; 90°W-
180°) it was 1.9 mmol N m-2 d-1 which is slightly lower than values inferred from
measurements or from other physical-biological coupled models. The model reproduced the
relationship between measured nitrate concentrations integrated over the euphotic layer and
new production as established by Raimbault et al. (1999) for the tropical Pacific. In particular,
the rate of increase of new production in the HNLC region was very slow despite high nitrate
concentration. Immediately following the strong westerly wind burst of March 1997, the
warm pool started to move eastward. In the model, nitrate-poor waters reached 170°W in May
and 155°W about one month later which was consistent with the satellite-observed
progression of low chlorophyll waters (Radenac et al. 2001; Ryan et al. 2002). As a result,
nitrate disappeared along 170°W and the nitrate decrease along 155°W between 4°S and 4°N
after December 1996 was about the same (40%) for the observations (Strutton and Chavez
2000) and for the model (Fig. 4). The small nitrate decrease simulated around 2°N in May
1997 is related to the weakness of the modeled NECC during that period. During the peak of
the event, more than six months after the El Niño event started, nitrate and new production
measured in the central equatorial Pacific were representative of warm pool conditions which
were reproduced in the model. Conversely, the uplift of the nitracline in the western
equatorial basin caused a relative increase of the chlorophyll concentration at the deep
chlorophyll maximum and of new production (Turk et al. 2001; Radenac et al. 2001; Christian
et al. 2002).
3.3 The Lagrangian analysis
3.3.1 Redistribution of water masses between May and December
1997
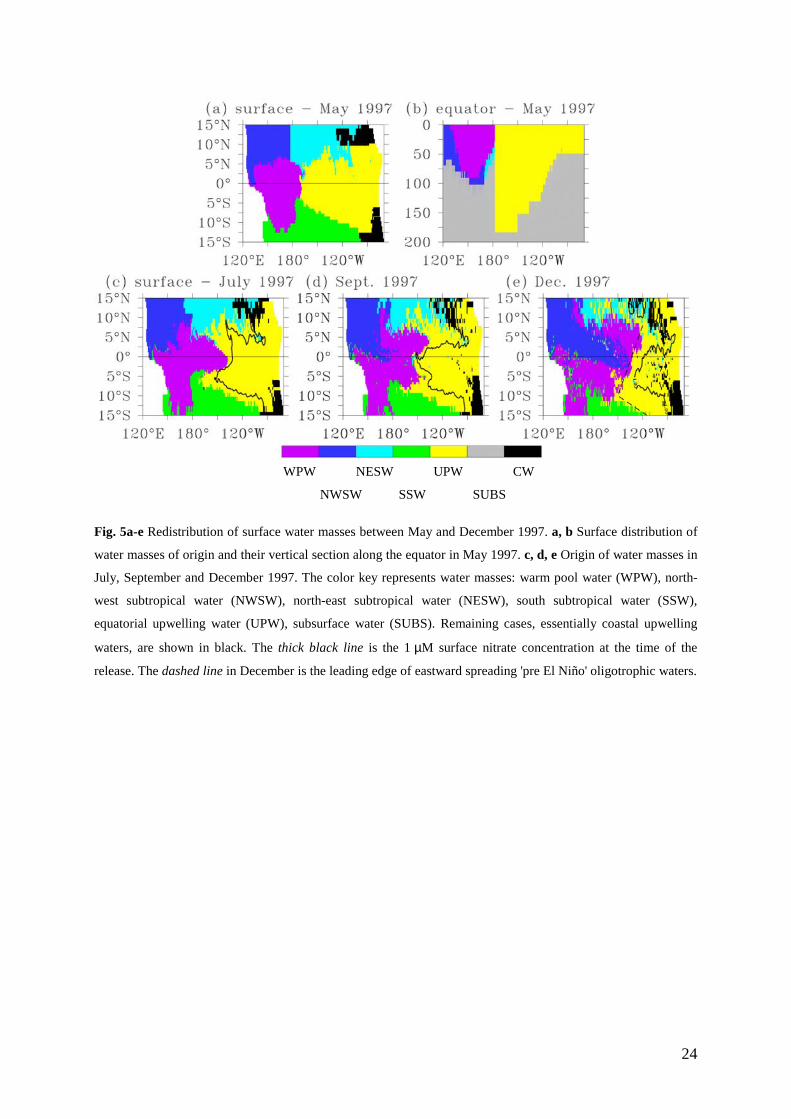
The distribution of surface water masses in May 1997 is shown in Fig. 5a. The nitrate-
depleted layer of the warm pool was about 100 m deep between 160°E and 180°E close to the
equator (Fig. 5b). It became thinner by 20 to 30 m poleward, in agreement with measurements
(Mackey et al. 1995; Radenac and Rodier 1996; Turk et al. 2001). Farther north, the base of
the nitrate-depleted layer of the northwest subtropical water was around 70 m and deepened
north of 12°N as reported during cruises (Kaneko et al. 1998). For the central Pacific, the
11
model reproduced the asymmetry in nitrate distribution of the north and south subtropical
waters (Wyrtki and Kilonsky 1984; Raimbault et al. 1999; Dugdale et al. 2002). The nitrate-
depleted layer of the south subtropical water (that reaches 150 m south of 10°S) was deeper
than that of the northeast subtropical water (about 80 m). The nitracline of the upwelling
equatorial waters shoaled eastward in agreement with the thermocline slope (Fig. 5b).
In order to find the origin of water masses for a given month, virtual water particles
were released at the surface at each grid point of the model (5849 particles). They were
tracked backward in the three-dimensional velocity field until May 1997, when water masses
were defined. In this way, the release position for the selected month was associated with the
water mass of origin. The redistribution of water masses since May was followed using such
mapping performed for each month between June and December. Two intermediate phases of
this progression in July (Fig. 5c) and September (Fig. 5d) are shown as well as the peak phase
in December (Fig. 5e). Less than 1% of drifters that reach the surface in July, September, or
December come from subsurface waters. It should be noted, however, that drifters at the
surface in July, September, or December may come from relatively deep within the body of
surface water masses.
The main displacements in the surface layer between May and December concerned
the oligotrophic warm pool (WPW) and northwest subtropical waters (NWSW) and the
nitrate-rich upwelled water (UPW) (Fig. 5). During a first phase (May-July), oligotrophic
water from the northwest tropical Pacific expanded southwards in the western basin while
water from the warm pool spread eastward (30° along the equator), breaking through the
upwelling water (Fig. 5c). In July-August, waters from the northwest had reached the equator
and began an eastward displacement. Meanwhile, following a brief episode of westward flow,
the upwelling waters shifted westward and separated oligotrophic waters into two branches,
leading to the September situation (Fig. 5d). During the following months, oligotrophic waters
again spread eastward, with the northern branch progressing a little bit faster than the southern
branch. The south-eastward intrusion of northwest tropical water toward the central basin in
fall 1997 was consistent with the freshening observed in late 1997 in this region (Johnson et
al. 2000). In December (Fig. 5e), a northeast-southwest oriented line (between 8°N-120°W
and 10°S-140°W) marked the easternmost expansion of warm pool and northwest subtropical
waters. In the south, the eastern limit of south subtropical waters was oriented northwest-
southeast. Waters that originated in the upwelling were located to the east of these boundaries.
The leading edge of eastward spreading 'pre El Niño' oligotrophic waters did not
match the limit of the nitrate rich surface waters (NO3 > 1 µM) of the December dwindling

12
upwelling (Fig. 5e). Actually, this simple diagram suggests that the main surface water
masses redistributed according to three schemes during the 1997 El Niño. First, advection
without transformation prevailed west of the oligotrophic invasion boundary: oligotrophic
waters from the western and northwestern tropical Pacific spread toward the central basin
with minor nitrate changes. Second, the region inside the nitrate-rich December 1997 limit
was a retention zone where drifters have complex trajectories within the upwelled water mass
as observed with in situ drifters (Fig. 3). Third, east of the leading edge and outside the
remaining upwelling (delimited by the 1 µM isoline), nitrate had been exhausted during the
drift of water masses that were originally nitrate-rich: advection together with transformation
predominated. In that case, water masses followed two main paths. (1) North of the December
residual upwelling, drifters came essentially from the western part of the May upwelling
waters. They were caught in the strong NECC flow and moved eastward toward the Gulf of
Panama. (2) South of the December upwelling, drifters originally in the upwelling region
followed the southward surface circulation that develops during the fall in the central basin
(Fig. 3). Both pathways have been observed with in situ drifters (Fig. 3).
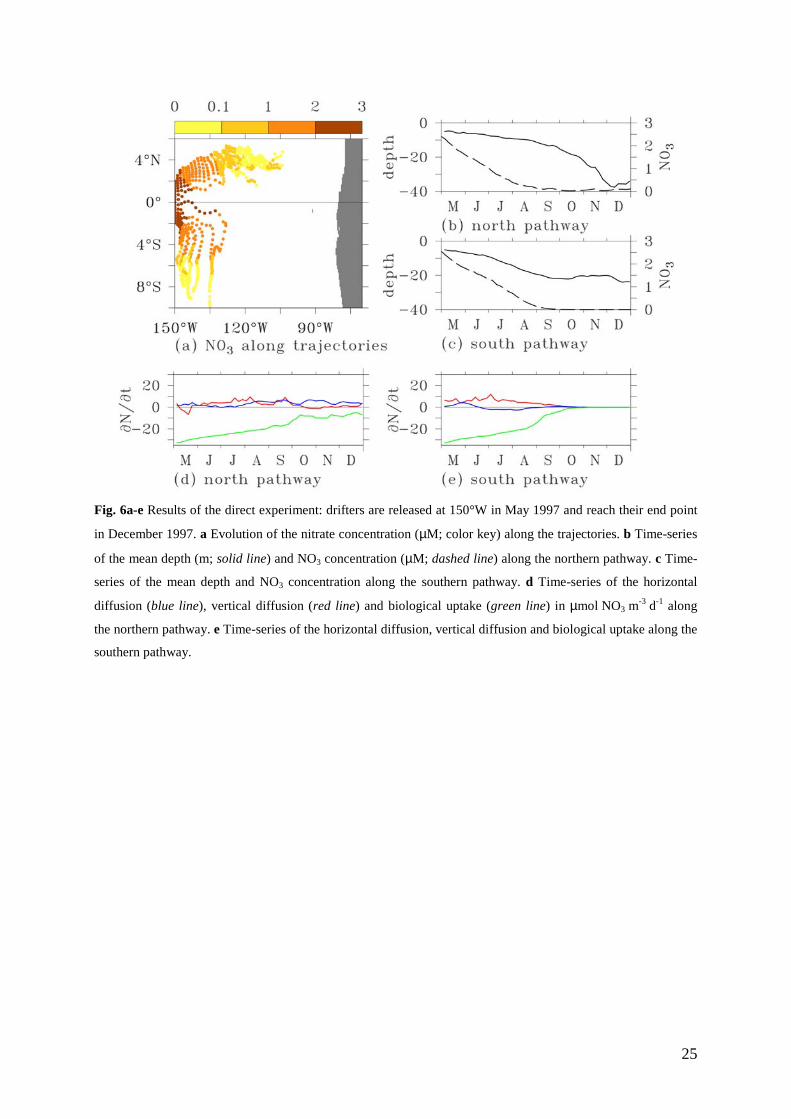
3.3.2 Lagrangian nitrate changes
Fig. 6 is an example of nitrate transformations that take place along trajectories according to
the advection/transformation scheme during the May-December 1997 period. These nitrate
changes are the consequence of mixing with the neighboring water masses and biological
effects (Eq. 3). In order to investigate those transformations, properties such as depth, nitrate
concentration, horizontal and vertical diffusion and biological effects are sampled along the
trajectories of drifters released at the surface in the western part of the upwelling in early May
(along 150°W between 2°S and 2°N).
Within one month, drifters split into the north and south groups as previously
mentioned (Fig. 6a). Their behavior was quite similar. Drifters remained in the upper 20 m,
except for drifters of the northern group that deepened to about 40 m at the end of the period
(Fig. 6b and 6c). It takes about 120 days for drifters released in waters with nitrate
concentrations of about 2.5 µM to become depleted (Fig. 6b and 6c). In May 1997 and during
the depletion period, vertical nitrate supply in the central and eastern equatorial Pacific had
greatly decreased (Chavez et al. 1999; Radenac et al. 2001; Christian et al. 2002). As
expected, the lateral and vertical nitrate diffusion remained small along the drift of particles
and nitrate changes along trajectories were essentially driven by the biological uptake
13
between May and September (Fig. 6d and 6e). Along the northern pathway (Fig. 6d), the
nitrate-impoverished drifters reached the NECC flow in September and accumulated in the
direction of the Gulf of Panama. During their eastward drift north of the upwelling, the
horizontal diffusion balanced the nitrate uptake and the nitrate concentration stayed close to
zero. Along the southern pathway (Fig. 6e), nitrate was assimilated by phytoplankton while
the particles drifted slowly. After September, nitrate was exhausted, giving these waters the
same properties as oligotrophic waters of the subtropical south Pacific. For both drifter
groups, biology drove the nitrate depletion during this period with dynamical characteristics
specific of a mature El Niño phase.
Fig. 7 shows a generalization of this experiment over the tropical Pacific basin.
Drifters were released in December in the surface layer at each grid point of the model and
then tracked backward until May. For each trajectory, the nitrate consumption between May
and December (∆NO3) was computed and the biological (bio) and diffusion (phy) effects
integrated. In order to compare the order of magnitude of those quantities in December, –phy
is presented in Fig. 7c (i.e. nitrate gain is negative). As expected in the region west of the limit
of eastward spreading oligotrophic waters, advection of oligotrophic water prevailed and no
major nitrate changes occurred (Fig. 7a). East of this limit, nitrate diminished. Drifters that
had reached the eastern part of the NECC or that were situated southward of the upwelling in
December had lost 2 to 5 µM nitrate. The nitrate fall could be even higher within the
upwelling region. Some sparse small spots of nitrate increase were found in the upwelling and
off the Central American coast. The physical inputs integrated over the May-December period
were negligible west of the leading edge of eastward spreading oligotrophic waters. East of
the limit, the surface circulation patterns that had drastically changed at the onset of the event
only resulted in small physical inputs. The biological response was slower and during that
period, nitrate assimilation remained rather stable. As a result, the biological consumption was
greater than the physical inputs and drove the nitrate impoverishment.
4 Discussion
The reliability of the GCM is an essential point for this study. There was general agreement
between modeled and observed surface circulation for 1997, in spite of a slight local
underestimation of the meridional velocity. The model accurately reproduced the timing of
the reversals of current at the equator. In particular, the strong eastward flow in May-June and
the brief SEC return in July-August were well captured. Imperfections in the mixing scheme

14
caused excessive vertical diffusion in the thermocline and therefore in the nitracline (Vialard
et al. 2001; Radenac et al. 2001; Lengaigne et al. 2003). Consequently, the nitrate flux into the
modeled surface mixed layer should be too high. This bias caused a very strong new
production during the first years of the spin-up phase that was initially performed for the
nitrate field to reach equilibrium with the large-scale dynamics (Radenac et al. 2001). The
overall effect of excessively high diffusion during the spin-up (8 years) was to transfer too
much nitrate from just below the pycnocline into the mixed layer and then to immediately
export it to depth. Finally, this led to abnormally low nitrate concentrations in the lower part
of the nitracline whereas the modeled nitrate values remained consistent with observations in
the mixed layer.
The constants Vmax and KNO3 in the biogeochemical model had been estimated in order
to reproduce as faithfully as possible the nitrate concentrations observed in the photic layer
(Stoens et al., 1999). The model is based on the common assumption that nitrate fixation
equals new and exported production. Vmax was in the range of values found after field
experiments (Stoens et al. 1999). On the contrary, KNO3 = 0.01 µM was much lower than
values generally accepted. This biologically unrealistic value was adopted to balance the
excessive nitrate diffusion into the mixed layer in the oligotrophic warm pool waters. Higher
KNO3 values indeed led to slow nitrate assimilation when nitrate concentration was low, so
that nitrate was always present in the warm pool photic layer instead of being depleted. This
choice had no consequences in upwelled waters with significant amounts of nitrate, where
nitrate assimilation is driven by Vmax. These should not apply to rarely reported intense
phytoplankton blooms where high nutrients concentration and probably iron availability
favored a much faster nitrate uptake (Ryan et al. 2002). However, such events are too scarce
to significantly impact the average patterns of nitrate utilization in the equatorial Pacific.
Since these constants finally reproduced the nitrate variability in the main oligotrophic and
mesotrophic regions and the slow nitrate uptake of the HNLC ecosystem, it was considered
that the modeled nitrate uptake does not largely differ from the actual nitrate uptake. These
considerations only concern the oligotrophic and HNLC water masses prior to and during the
1997-98 El Niño. They should not apply to the recovery phase immediately after this event,
when upwelling resumed and brought nitrate-rich waters and iron from below into an entirely
oligotrophic ocean (Murtugudde et al. 1999; Ryan et al. 2002).
Chlorophyll concentration estimated from ocean color data is approximately the mean
chlorophyll concentration between the surface and the first attenuation length which varies as
the inverse of the attenuation coefficient Kd, at the 490 nm wavelength used in the SeaWiFS

15
algorithm (Morel and Maritorena 2001). It is about 40 m in oligotrophic waters where
chlorophyll is lower than 0.1 mg m-3 and about 30 m in waters with chlorophyll ranging
between 0.1 and 0.3 mg m-3. There are two reasons that support the analyses of the trajectories
of drifters simply released in the first layer of the model in order to understand the biological
situation as seen by ocean color during the peak of the 1997 El Niño event. The first one is
that the upper 2 layers of the model (0-20 m) would account for more than 60% of the signal
in oligotrophic waters and that the first layer alone would account for about 50% in upwelling
waters. The second one is that during the singular period studied, drifters released in the
surface layer remained within the mixed layer. The reverse experiment confirmed this result:
virtual drifters that followed the strong NECC flow originated from the surface HNLC waters
of the western part of the equatorial divergence and virtual drifters that reached south of the
upwelling in December drifted southward near the surface. Consequently, the conclusion of
the study as to the origin of water masses of the first layer of the model is reasonable.
During the 1997-1998 El Niño event, lateral and vertical nitrate inputs are greatly
reduced in the HNLC region because of the deepening of the nutricline (Chavez et al. 1998;
Stoens et al. 1999; Strutton and Chavez 2000; Radenac et al. 2001; Christian et al. 2002) and
the decrease in activity of tropical instability waves (Philander et al. 1985). Biological uptake
then becomes the main process that drives nitrate depletion along trajectories. Because of the
slow nitrate uptake characteristic of the tropical Pacific HNLC system, nitrate that was
present in the euphotic layer at the early stage of El Niño was able to sustain biological
production during several months. So, this Lagrangian study shows that the slow nitrate
uptake characteristic of HNLC waters prevents the tropical Pacific from a rapid onset of
oligotrophic conditions. Other studies have shown that the chlorophyll and biological activity
could increase in several regions of the tropical Pacific during El Niño events. In the western
Pacific, the basin tilt of the thermocline and nutricline resulted in higher nitrate content in the
euphotic layer and increased biological activity as shown by Radenac et al. (2001), Turk et al.
(2001), or Christian et al. (2002) for the 1997 event. Similar vertical processes lead to the
north equatorial enrichment that has been reported during the 1982 El Niño event: abnormally
high chlorophyll concentration measured in a wide area centered in the warm pool at 170°E,
10°N (Dandonneau 1992) and abnormally high biogenic particle fluxes at 140°W, 11°N
(Dymond and Collier 1988). In 1997, the SeaWiFS imagery revealed a large zone of surface
chlorophyll higher than 0.1 mg m-3 that extended from about 10°N off the central American
coast southwestward toward the equator (Murtugudde et al. 1999). Numerous equatorial
studies show a decrease of the biological activity along the equator during El Niño events.

16
Nevertheless, the above-mentioned observations together with this investigation suggest that
the tropical Pacific is not a biological desert throughout the event. Without the "memory" of
the HNLC ecosystem, the decrease of biological production would be more pronounced in
waters of the Pacific equatorial divergence and increased biological activity occurs in several
off-equatorial locations.
5 Conclusion
This study contributes to the general issue of the relative contributions of physical and
biological processes to the setting of El Niño oligotrophic conditions. Because chlorophyll is
often used as a proxy for phytoplankton biomass, ocean color imagery is a key instrument for
monitoring the relative extension of phytoplankton rich and poor waters at different
timescales. They may be hints we can grasp about the underlying mechanisms by observing
surface chlorophyll patterns and their evolution. However, there was a gap in ocean color
coverage between June and September 1997, i. e. when most of the pre-El Niño surface layer
nitrate was being consumed. An insight of these processes is possible using numerical
simulations, although they do not perfectly reproduce the real ocean. A Lagrangian analysis
applied to the output of a coupled physical-biogeochemical model shows that surface nitrate-
rich and nitrate-poor water masses were redistributed by three mechanisms during the 1997 El
Niño. First, oligotrophic waters from the western Pacific remained oligotrophic during the
course of their eastward transport. This mechanism is the most documented one along the
equator and highlights the impact that variability of the general circulation may have on the
biological variability at a first order. Second, an upwelling system persists in the eastern part
of the basin. This study emphasized a third scheme that represents an alternative to
generalized nitrate-poor water conditions. Nitrate that was present in the euphotic layer at the
early stage of El Niño was able to sustain biological production during several months. Thus,
the slow nitrate uptake characteristic of HNLC waters delayed the onset of oligotrophic
conditions allowing mesotrophic conditions to persist in the tropical Pacific during this El
Niño event.
Acknowledgements We would like to thank G. C. Johnson, F. Bonjean and G. Lagerloef for
providing the ADCP cruise data and the satellite-derived currents. Our thanks as well to the
Drifter Data Assembly Center, GOOS Center, NOAA/AOML, Miami, Florida, for their
quality control of the drifter data and for making it available through the web. J. Sudre

17
extracted the ocean color data. Special thanks to C. Maes and F. Melin and to two anonymous
reviewers for constructive comments.
References
Aufdenkampe AK, McCarthy JJ, Navarette C, Rodier M, Dunne J, Murray JW (2002) Biogeochemical and physical controls
on new production in the tropical Pacific. Deep-Sea Res II 49(13-14): 2619-2648
Barber RT, Chavez FP (1983) Biological consequences of El Niño. Science 222: 1203-1210
Bender ML, McPhaden MJ (1990) Anomalous nutrient distribution in the equatorial Pacific in April 1988: evidence for rapid
biological uptake. Deep-Sea Res 37: 1075-1084
Blanke B, Raynaud S (1997) Kinematics of the Pacific equatorial undercurrent: an eulerian and Lagrangian approach from
GCM results. J Phy Oceanogr 27: 1038-1053
Bonjean F, Lagerloef GSE (2002) Diagnostic model and analysis of the surface currents in the tropical Pacific Ocean. J Phy
Oceanogr 32(10): 2938-2954
Boutin J, Etcheto J, Dandonneau Y, Bakker DCE, Feely RA, Inoue HY, Ishii M, Ling RD, Nightingale PD, Metzl N,
Wanninkhof R (1999) Satellite sea surface temperature: A powerful tool for interpreting in situ pCO2 measurements in the
equatorial Pacific ocean. Tellus 51(B): 490-508
Chavez FP, Strutton PG, McPhaden MJ (1998) Biological-physical coupling in the central Pacific during the onset of the
1997-98 El Niño. Geophys Res Lett 25(19): 3543-3546
Chavez FP, Strutton PG, Friederich GE, Feely RA, Feldman GC, Foley DG, McPhaden MJ (1999) Biological and chemical
response of the equatorial Pacific Ocean to the 1997-98 El Niño. Science 286: 2126-2131
Christian JR, Verschell MA, Murtugudde R, Busalacchi AJ, McClain CR (2002) Biogeochemical modelling of the tropical
Pacific ocean. I. Seasonal and interannual variability. Deep-Sea Res II 49: 509-543
Coale KH, Fitzwater SE, Gordon RM, Johnson KS, Barber RT (1996) Control of community growth and export production
by upwelled iron the equatorial Pacific Ocean. Nature 379: 621-624
Dandonneau Y (1979) Concentrations en chlorophylle dans le Pacifique tropical sud-ouest: comparaison avec d'autres aires
océaniques tropicales. Oceanol Acta 2: 133-142
Dandonneau Y, Eldin G (1987) Southwestward extent of chlorophyll-enriched waters from the Peruvian and equatorial
upwellings between Tahiti and Panama. Mar Ecol Progr Ser 38: 283-294
Dandonneau Y (1992) Surface chlorophyll concentration in the Tropical Pacific Ocean: an analysis of data collected by
merchant ships from 1978 to 1989. J Geophys Res 97: 3581-3591
Deschamps PY, Breon FM, Leroy M, Podaire A, Bricaud A, Buriez JC, Seze G (1994) The POLDER Mission: Instrument
Characteristics and Scientific Objectives. IEEE Trans Geoscience Remote Sensing 32: 598-615
Dugdale RC, Barber RT, Chai F, Peng TH, Wilkerson FP (2002) One-dimensional ecosystem model of the equatorial Pacific
upwelling system. Part II: sensitivity analysis and comparison with JGOFS EqPac data. Deep-Sea Res II 49: 2747-2768
Dymond J, Collier R (1988) Biogenic particle fluxes in the equatorial Pacific: evidence for both high and low productivity
during the 1982-1983 El Niño. Global Biogeoch Cycles 2(2): 129-137
Eldin G, Rodier M, Radenac MH (1997) Physical and nutrient variability in the upper equatorial Pacific associated with
westerly wind forcing and wave activity in October 1994. Deep-Sea Res II 44: 1783-1800
Friedrichs MAM, Hofmann EE (2001) Physical control of biological processes in the central equatorial Pacific Ocean. Deep-
Sea Res I 48: 1023-1069
Hansen DV, Poulain PM (1996) Quality control and interpolations of WOCE/TOGA drifter data. J Atmosph Oceanic
Technol 13: 900-909
Hardy J, Hanneman A, Behrenfeld M, Horner R (1996) Environmental biogeography of near-surface phytoplankton in the
southeast Pacific Ocean. Deep-Sea Res I 43(10): 1647-1659

18
Hayes SP, Chang P, McPhaden MJ (1991) Variability of the sea surface temperature in the eastern equatorial Pacific during
1986-88. J Geophys Res 96: 10553-10566
Honjo S (1978) Sedimentation of material in the Sargasso Sea at 5,367 m. J Mar Res 36: 469-492
Inoue HY, Ishii M, Matsueda H, Ahoyama M (1996) Changes in longitudinal distribution of the partial pressure of CO2
(pCO2) in the central and western equatorial Pacific, west of 160°W. Geophys Res Lett 14: 1781-1784
Johnson GC, McPhaden MJ, Rowe GD, McTaggart KE (2000) Upper equatorial Pacific Ocean current and salinity variability
during the 1996-1998 El Niño-La Niña cycle. J Geophys Res 105: 1037-1053
Kaneko I, Takatsuki Y, Kamiya H, Kawae S (1998) Water property and current distributions along the WHP-P9 section
(137°-142°E) in the western North Pacific. J Geophys Res 103(C6): 12959-12984
Karl DM, Lukas R (1996) The Hawaii Ocean Time-series (HOT) program: Background, rationale and field implementation.
Deep-Sea Res II 43(2-3): 129-156
Kobayashi F, Takahashi K (2002) Distribution of diatoms along the equatorial transect in the western and central Pacific
during the 1999 La Niña conditions. Deep-Sea Res II 49: 2801-2821
Kuroda Y, McPhaden MJ (1993) Variability in the western equatorial Pacific Ocean during Japanese Pacific Climate Study
Cruises in 1989 and 1990. J Geophys Res 98: 4747-4759
Lagerloef GSE, Mitchum GT, Lukas RB, Niiler PP (1999) Tropical Pacific near-surface currents estimated from altimeter,
wind, and drifter data. J Geophys Res 104: 23313-23326
Landry MR, Barber RT, Bidigare RR, Chai F, Coale KH, Dam HG, Lewis MR, Lindley ST, McCarthy JJ, Roman MR,
Stoecker DK, Verity PG, White JR (1997) Iron and grazing constraints on primary production in the central equatorial
Pacific: An EqPac synthesis. Limnol Oceanogr 42: 405-418
Le Borgne R, Barber RT, Delcroix T, Inoue HY, Mackey DJ, Rodier M (2002) Pacific warm pool and divergence: temporal
and zonal variations on the equator and their effects on the biological pump. Deep-Sea Res II 49: 2471-2512
Lehodey P, André JM, Bertignac M, Hampton J, Stoens A, Menkes C, Memery L, Grima N (1998) Predicting skipjack tuna
forage distributions in the equatorial Pacific using a coupled dynamical bio-geochemical model. Fish Oceanogr 7: 317-325
Lengaigne M, Madec G, Menkes C, Alory G (2003) Impact of isopycnal mixing on the tropical ocean circulation. J Geophys
Res 108(C11) DOI:10.1029/2002JC001704
Levitus S, Conkright ME, Reid JL, Najjar RG, Mantyla AW (1993) Distribution of nitrate, phosphate, and silicate in the
world oceans. Progr Oceanogr 31: 245-273
Mackey DJ, Parslow J, Higgins HW, Griffiths FB, O'Sullivan JE (1995) Plankton productivity and biomass in the western
equatorial Pacific: biological and physical controls. Deep-Sea Res II 42: 499-533
Maes C, Madec G, Delecluse P (1997) Sensitivity of an equatorial Pacific OGCM to the lateral diffusion. Mon Wea Rev 125:
958-971
McCarthy JJ, Garside C, Nevins JL, Barber RT (1996) New production along 140°W in the equatorial Pacific during and
following the 1992 El Niño event. Deep-Sea Res II 43: 1065-1093
McClain CR, Cleave ML, Feldman GC, Gregg WW, Hooker SB, Kuring N (1998) Science quality SeaWiFS data for global
biosphere research. Sea Technol 39: 10-16
McPhaden MJ, Picaut J (1990) El Niño-Southern Oscillation displacements of the western equatorial Pacific warm pool.
Science 250: 1385-1388
McPhaden MJ, Busalacchi AJ, Cheney R, Donguy JR, Gage KS, Halpern D, Ji M, Julian P, Meyers G, Mitchum GT, Niiler
PP, Picaut J, Reynolds RW, Smith N, Takeuchi K (1998) The Tropical Ocean-Global Atmosphere observing system: A
decade of progress. J Geophys Res 103: 14169-14240
Morel A, Maritorena S (2001) Bio-optical properties of oceanic waters: A reappraisal. J Geophys Res 106: 7163-7180
Murakami H, Ishizaka J, Kawamura H (2000) ADEOS observations of chlorophyll a concentration, sea surface temperature,
and wind stress change in the equatorial Pacific during the 1997 El Niño onset. J Geophys Res 105: 19551-19559

19
Murtuggude RG, Signorini SR, Christian JR, Busalacchi AJ, McClain CR, Picaut J (1999) Ocean color variability of the
tropical Indo-Pacific basin observed by SeaWiFS during 1997-98. J Geophys Res 104: 18351-18365
Navarette C (1998) Dynamique du phytoplancton en océan équatorial: mesures cytométriques et mesures isotopiques durant
la campagne FLUPAC, en octobre 1994 dans la partie ouest du Pacifique. Thèse de Doctorat de l'Université Paris VI
Niiler P (2001) The world ocean surface circulation. In: Church J, Siedler G, Gould J (eds) Ocean Circulation and Climate-
Observing and Modeling the Global Ocean, Academic Press, pp 193-204
Pazan SE, Niiler P (2004) New global drifter data set available. EOS, Trans Amer Geophys Union, 85(2)
Philander SGH, Halpern D, Hansen D, Legeckis R, Miller L, Paul C, Watts R, Weisberg R, Winbush M (1985) Long waves
in the equatorial Pacific Ocean. EOS, Trans Amer Geophys Union, 66: 154.
Picaut J, Ioualalen M, Menkes C, Delcroix T, McPhaden MJ (1996) Mechanisms of the zonal displacements of the Pacific
warm pool: implications for ENSO. Science 274: 1486-1489
Price NM, Ahner BA, Morel FMM (1994) The equatorial Pacific Ocean: grazer-controlled phytoplankton populations in an
iron-limited ecosystem. Limnol Oceanogr 39(3): 520-534
Radenac MH, Rodier M (1996) Nitrate and chlorophyll distributions in relation to thermohaline and current structures in the
western tropical Pacific during 1985-1989. Deep-Sea Res II 43: 725-752
Radenac MH, Menkes C, Vialard J, Moulin C, Dandonneau Y, Delcroix T, Dupouy C, Stoens A, Deschamps PY (2001)
Modeled and observed impacts of the 1997-1998 El Niño on nitrate and new production in the equatorial Pacific. J
Geophys Res 106: 26879-26898
Raimbault P, Slawyk G, Boudjellal B, Coatanoan C, Conan P, Coste B, Garcia N, Moutin T, Pujo-Pay M (1999) Carbon and
nitrogen uptake and export in the equatorial Pacific at 150°W: Evidence of an efficient regenerated production cycle. J
Geophys Res 104: 3341-3356
Reverdin G, Frankignoul C, Kestenare E, McPhaden MJ (1994) Seasonal variability in the surface currents of the equatorial
Pacific. J Geophys Res 99: 20323-20344
Reynolds RW, Smith TM (1994) Improved global sea surface temperature analyses using optimum interpolation. J Clim 7:
929-948
Ryan JP, Polito PS, Strutton PG, Chavez FP (2002) Unusual large-scale phytoplankton blooms in the equatorial Pacific.
Progr Oceanogr 55(3): 263-285
Stoens A, Menkes C, Radenac MH, Grima N, Dandonneau Y, Eldin G, Memery L, Navarette C, André JM, Moutin T,
Raimbault P (1999) The coupled physical-new production system in the equatorial Pacific during the 1992-1995 El Niño. J
Geophys Res 104: 3323-3339
Strutton PG, Chavez FP (2000) Primary productivity in the equatorial Pacific during the 1997-98 El Niño. J Geophys Res
105: 26089-26101
Turk D, Lewis MR, Harrison GW, Kawano T, Asanuma I (2001) Geographical distribution of new production in the
western/central equatorial Pacific during El Niño and non-El Niño conditions. J Geophys Res 106: 4501-4515
Venrick EL, MacGowan JA, Mantyla AW (1973) Deep maxima of photosynthetic chlorophyll in the Pacific Ocean. US Fish
Bull 71: 41-52
Vialard J, Menkes C, Boulanger JP, Delecluse P, Guilyardi E, McPhaden MJ, Madec G (2001) A model study of oceanic
mechanisms affecting equatorial Pacific sea surface temperature during the 1997-98 El Niño. J Phy Oceanogr 31: 1649-
1675
Vialard J, Delecluse P, Menkes C (2002) A modeling study of salinity variability and its effects in the tropical Pacific ocean
during the 1993-99 period. J Geophys Res 107(C12) DOI:10.1029/2000JC000758
Wyrtki K (1981) An estimate of equatorial upwelling in the Pacific. J Phy Oceanogr 11: 1205-1214
Wyrtki K, Kilonsky B (1984) Mean water and current structure during the Hawaii to Tahiti shuttle experiment. J Phy
Oceanogr 14: 242-254

20
Fig. 1a-c Modeled surface velocity (vectors, m s-1) superimposed on satellite chlorophyll (color scale, mg m-3).
The November 1996 (a) and May 1997 (b) scenes are POLDER derived chlorophyll, the December 1997 panel
(c) is SeaWiFS chlorophyll. The white solid line corresponds to 0.1 mg m-3. The white dashed line in December
is the leading edge of eastward spreading 'pre El Niño' oligotrophic waters.
Fig. 2a-c Zonal velocity component (m s-1) along 155°W between November 1996 and December 1997. a Time
evolution of the satellite-derived surface zonal current (OSCAR). b Time evolution of the modeled zonal current
at 15 m. The contour interval is 0.25 m s-1. Positive values are shaded. The vertical lines represent the December
1996, May 1997 and November 1997 cruises. c Meridional profiles of ADCP zonal current measured at 15 m
during TAO/TRITON cruises along 155°W in December 1996 (small-dashed line), May 1997 (solid line) and
November 1997 (long-dashed line).
Fig. 3a-b Comparison of (a) in situ drifters and (b) modeled trajectories between May and December 1997.
Colors are one-month intervals between the beginning (May) and the end (December) of trajectories.
Fig. 4 Meridional distributions of measured (top panels; adapted from Strutton and Chavez 2000) and modeled
(bottom panels) surface nitrate before (late 1996; left panels) and during (May 1997; right panels) El Niño along
155°W (triangle) and 170°W (circle).
Fig. 5a-e Redistribution of surface water masses between May and December 1997. a, b Surface distribution of
water masses of origin and their vertical section along the equator in May 1997. c, d, e Origin of water masses in
July, September and December 1997. The color key represents water masses: warm pool water (WPW), north-
west subtropical water (NWSW), north-east subtropical water (NESW), south subtropical water (SSW),
equatorial upwelling water (UPW), subsurface water (SUBS). Remaining cases, essentially coastal upwelling
waters, are shown in black. The thick black line is the 1 µM surface nitrate concentration at the time of the
release. The dashed line in December is the leading edge of eastward spreading 'pre El Niño' oligotrophic waters.
Fig. 6a-e Results of the direct experiment: drifters are released at 150°W in May 1997 and reach their end point
in December 1997. a Evolution of the nitrate concentration (µM; color key) along the trajectories. b Time-series
of the mean depth (m; solid line) and NO3 concentration (µM; dashed line) along the northern pathway. c Time-
series of the mean depth and NO3 concentration along the southern pathway. d Time-series of the horizontal
diffusion (blue line), vertical diffusion (red line) and biological uptake (green line) in µmol NO3 m-3 d-1 along
the northern pathway. e Time-series of the horizontal diffusion, vertical diffusion and biological uptake along the
southern pathway.
Fig. 7a-c Maps of the (a) NO3 consumption and impacts of the (b) biological and (c) physical effects (µM; color
key) computed along Lagrangian backward-trajectories between May and December 1997. Positions are the
positions at the release of virtual water parcels in December. The 1 µM surface nitrate isoline (thick line) is
superimposed. The dashed line is the leading edge of eastward spreading 'pre El Niño' oligotrophic waters.
Table 1 Criteria used to define surface water masses in May 1997: 4 classes of oligotrophic water with
NO3 ≤ 1 µM and 3 classes of nitrate-rich waters. Note that subsurface waters underlying nitrate-rich surface
waters have nitrate concentration higher than 12 µM and that they have nitrate concentration higher than 1 µM
beneath oligotrophic surface waters.

21
Fig. 1a-c Modeled surface velocity (vectors, m s-1) superimposed on satellite chlorophyll (color scale, mg m-3).
The November 1996 (a) and May 1997 (b) scenes are POLDER derived chlorophyll, the December 1997 panel
(c) is SeaWiFS chlorophyll. The white solid line corresponds to 0.1 mg m-3. The white dashed line in December
is the leading edge of eastward spreading 'pre El Niño' oligotrophic waters.

22
Fig. 2a-c Zonal velocity component (m s-1) along 155°W between November 1996 and December 1997. a Time
evolution of the satellite-derived surface zonal current (OSCAR). b Time evolution of the modeled zonal current
at 15 m. The contour interval is 0.25 m s-1. Positive values are shaded. The vertical lines represent the December
1996, May 1997 and November 1997 cruises. c Meridional profiles of ADCP zonal current measured at 15 m
during TAO/TRITON cruises along 155°W in December 1996 (small-dashed line), May 1997 (solid line) and
November 1997 (long-dashed line).
Fig. 3a-b Comparison of (a) in situ drifters and (b) modeled trajectories between May and December 1997.
Colors are one-month intervals between the beginning (May) and the end (December) of trajectories.

23
Fig. 4 Meridional distributions of measured (top panels; adapted from Strutton and Chavez 2000) and modeled
(bottom panels) surface nitrate before (late 1996; left panels) and during (May 1997; right panels) El Niño along
155°W (triangle) and 170°W (circle).
24
Fig. 5a-e Redistribution of surface water masses between May and December 1997. a, b Surface distribution of
water masses of origin and their vertical section along the equator in May 1997. c, d, e Origin of water masses in
July, September and December 1997. The color key represents water masses: warm pool water (WPW), north-
west subtropical water (NWSW), north-east subtropical water (NESW), south subtropical water (SSW),
equatorial upwelling water (UPW), subsurface water (SUBS). Remaining cases, essentially coastal upwelling
waters, are shown in black. The thick black line is the 1 µM surface nitrate concentration at the time of the
release. The dashed line in December is the leading edge of eastward spreading 'pre El Niño' oligotrophic waters.
WPW NESW UPW CW
NWSW SSW SUBS
25
Fig. 6a-e Results of the direct experiment: drifters are released at 150°W in May 1997 and reach their end point
in December 1997. a Evolution of the nitrate concentration (µM; color key) along the trajectories. b Time-series
of the mean depth (m; solid line) and NO3 concentration (µM; dashed line) along the northern pathway. c Time-
series of the mean depth and NO3 concentration along the southern pathway. d Time-series of the horizontal
diffusion (blue line), vertical diffusion (red line) and biological uptake (green line) in µmol NO3 m-3 d-1 along
the northern pathway. e Time-series of the horizontal diffusion, vertical diffusion and biological uptake along the
southern pathway.

26
Fig. 7a-c Maps of the (a) NO3 consumption and impacts of the (b) biological and (c) physical effects (µM; color
key) computed along Lagrangian backward-trajectories between May and December 1997. Positions are the
positions at the release of virtual water parcels in December. The 1 µM surface nitrate isoline (thick line) is
superimposed. The dashed line is the leading edge of eastward spreading 'pre El Niño' oligotrophic waters.

27
surface water mass NO3 (µµµµM) T (°C) latitude longitude (deg. E)
warm pool WPW ≤ 1 ≥ 29 ≤ 240
north-west
subtropical NWSW ≤ 1 < 29 ≥ 0 ≤ 180
north-east subtropical NESW ≤ 1 < 29 ≥ 0 > 180
south subtropical SSW ≤ 1 < 29 < 0
equatorial upwelling UPW 1 < NO3 ≤ 12 −12 ≤ lat ≤ 10
coastal upwelling CW 1 < NO3 ≤ 12 lat > 10 and
lat < −12 > 180
Table 1 Criteria used to define surface water masses in May 1997: 4 classes of oligotrophic water with
NO3 ≤ 1 µM and 3 classes of nitrate-rich waters. Note that subsurface waters underlying nitrate-rich surface
waters have nitrate concentration higher than 12 µM and that they have nitrate concentration higher than 1 µM
beneath oligotrophic surface waters.