displacement-softening constitutive model for...
TRANSCRIPT

Displacement-Softening Constitutive Model for Geosynthetic Interfaces
Mohamed G. Arab & Edward Kavazanjian, Jr. School of Sustainable Engineering and the Built Environment– Arizona State University, Tempe, AZ, USA Patrick J. Fox Department of Structural Engineering, University of California-San Diego, La Jolla, CA, USA Jason D. Ross Staff Engineer, BBC&M Engineering, Inc., Dublin, OH, USA
ABSTRACT A displacement-softening constitutive model has been developed to model the cyclic shear load-deformation behaviour of textured geomembrane/geosynthetic clay liner (GMX/GCL) interfaces. The displacement-softening formulation is based on the assumption that the strength reduction at the interface can be related to the cumulative relative shear displacement. This model was developed based on the results of cyclic shear tests on GMX/GCL interfaces. The constitutive model has been implemented in a finite-difference software package for solution of geotechnical problems. The performance of the constitutive model compares well with the experimental data, showing a progressive degradation in shear strength of the interface with increasing cumulative displacement in uniform cyclic tests. More research is needed to test the performance of the model for the case of non-uniform cyclic loading. RÉSUMÉ Une loi de comportement avec radoucissement a été développée pour modéliser le comportement cyclique de l’interface entre une géomembrane en PEHD avec aspérités et un géosynthétique bentonitique. L’hypothèse de base de cette loi de comportement avec radoucissement est que la réduction de la résistance au cisaillement à l’interface peut être reliée au cumul du cisaillement relatif. Cette loi de comportement avec radoucissement a été développée au vu des résultats d’essais cycliques conduits sur des interfaces entre géomembranes en PEHD avec aspérités et géosynthétiques bentonitiques. La loi de comportement a été intégrée dans un model numérique aux différences finies pour la résolution de problèmes géomécaniques. Les résultats obtenus avec le model numérique se comparent bien aux résultats expérimentaux, indiquant une réduction progressive de la résistance au cisaillement de l’interface avec augmentation du déplacement total lors d’essais cycliques uniformes. Des travaux complémentaires sont nécessaires pour évaluer la performance de la loi de comportement pour chargements cycliques non uniformes. 1 INTRODUCTION
Comprehensive modeling of the cyclic shear behaviour of landfill liner and cover systems used in waste containment facilities requires a suitable constitutive model for geosynthetic interfaces. Modeling of liner and cover system cyclic shear behaviour can be important in the assessment of the long-term performance of waste containment facilities subjected to earthquakes or other dynamic loading. Although a significant body of research has been conducted on the static shear modeling of geosynthetic interfaces (e.g., Byrne 1994, Esterhuizen et al. 2001, Triplett and Fox 2001), only very limited work has been published on modeling the shear behaviour of geosynthetic interfaces under cyclic loads (Desai and Fishman 1991, LoGrasso et al. 2002, Kim et al. 2005).
This paper presents a constitutive model for modeling the in-plane cyclic shear behaviour of textured geomembrane/geosynthetic clay liner (GMX/GCL) interfaces. This model is based upon experimental data from uniform cyclic tests. Comparison between model predictions and experimental results is good, as the model captures the progressive degradation of the hysteresis loops deemed the most important facet of the observed
behaviour. The model has been implemented in a finite-difference program for predicting the response of landfill liner and cover systems to earthquake loading. 2 EXPERMENTAL DATA FROM DYNAMIC SHEAR
TESTING OF GMX/GCL SPEICMENS The constitutive model presented herein was developed using the results of a series of cyclic direct shear tests on GMX/GCL specimens described by Ross (2009) and Ross et al. (2010). These tests were conducted using the cyclic direct shear device described by Fox et al. (2006). GMX/GCL specimens are sheared between the floor of the test device and a horizontal pullout plate. Both test device floor and the pullout plate are configured to prevent specimen slippage and related progressive failure effects (Fox and Kim 2008). Each GMX/GCL specimen was free to fail at the interface or internally (within the GCL).
Ross et al. (2010) describe the experimental program employed to develop the constitutive model described herein. Testing was conducted in the geotechnical laboratory at the University of California at San Diego using two geosynthetic products: a double non-woven (NW) needle-punched (NP) GCL with no thermal bonding

and a 60 mil, HDPE GM with single-sided structured (Micro Spike
®) texturing. All specimens were 1320 x 305
mm in plan dimension. Each GCL specimen was hydrated under the shearing normal stress using the two-stage accelerated hydration procedure developed by Fox and Stark (2004). Ross (2009) conducted twenty-nine displacement-controlled cyclic shear tests on this GMX/GCL combination to determine the effects of the displacement amplitude, Δa, on material response. The loading consisted of 25 cycles of sinusoidal displacement with a frequency, f, equal to 1 Hz. Tests were conducted
at five normal stress levels (13, 348, 692, 1382 and 2071 kPa) and seven displacement amplitudes (±2, 10, 15, 20, 30, 60, and 120 mm).
After each test was completed, the pullout plate and GCL were carefully removed from the shear machine. The observed failure mode was recorded along with any indications of localized stress, tearing, or GMX slippage. 2.1 Results Inspection of the cyclic shear stress-displacement curves indicated that that the displacement at which the peak shear resistance was mobilized was typically between ±10 and ±15 mm. Therefore, cyclic testing done with displacement amplitudes of (±2, 10 and 15 mm) were considered pre-peak tests and cyclic testing done with displacement amplitudes of (±20, 30, 60 and 120 mm) were considered post-peak tests (Ross 2009). The differences between pre- and post-peak response were not as clear at a normal stress, σn, equal to 13 kPa as they were at the larger normal stresses (e.g., 348, 692, and 1382 kPa). Ross (2009) concluded that the 13 kPa normal stress was too small to create intimate contact at the GMX/GCL interface.
In the cyclic interface shear strength tests conducted by Ross (2009), interface failures were consistently observed at the three smallest normal stresses (13, 348, and 692 kPa). The only cyclic test in which a partial internal failure was observed was at σn = 1382 kPa for a
displacement amplitude of ±10 mm. All tests at ±15 mm and greater caused interface failures.
Figure 1 and Figure 2 show the pre-peak (±10 mm) and post-peak (±20 mm) response, respectively, of the GMX/GCL interface at σn = 1382 kPa. In the post-peak case (Figure 2) a continuous degradation in shear strength is observed over the 25 cycles of the test. However, most of the shear strength degradation occurs within the first five cycles of loading in the pre-peak tests.
The post-peak test results from Ross (2009) for cyclic testing of the GMX/GCL combination at normal stresses of 1382 kPa and 2071 kPa are shown in Figure 3 and Figure 4, respectively, for four displacement amplitudes (±20, 30, 60, and 120 mm). For these post-peak cyclic tests, a peak in the shear stress may be observed in the third quadrant of the plot. Both Figure 3 and Figure 4 show a continuous degradation in shear strength with cyclic loading until the cyclic strength reaches a stable minimum value near the end of the test (i.e. reaches a large displacement shear strength).
Figure 1. Pre-peak shear stress vs. displacement for ±10 mm cyclic shear test at σn = 1382 kPa (Ross 2009).
Figure 2. Post-peak shear stress vs. displacement for ±20 mm cyclic shear test at σn = 1382 kPa (Ross 2009).
Figure 3. Shear stress vs. displacement for ±20, 30, 60, and 120 mm amplitudes cyclic shear tests at σn = 1382 kPa.
-600
-400
-200
0
200
400
600
-140 -100 -60 -20 20 60 100 140
Sh
ea
r S
tre
ss, τ
(kP
a)
Displacement (mm)
Δa=20mm Δa=30mm Δa=60mm Δa=120mm

Figure 4. Shear stress vs. displacement for ±20, 30, 60, and 120 mm amplitudes cyclic shear tests at σn = 2071 kPa. 2.2 Interpretation of Test Results The progressive degradation of the hysteresis loops in Figure 2 through Figure 4 was deemed the most important aspect of the observed interface behaviour with respect to modeling the in plane shear behaviour of the GMX/GCL combination. To illustrate the typical post peak degradation behaviour of the GMX/GCL combination modeled in this paper, the shear stress time history over 25 cycles of loading with a constant displacement amplitude of ± 120 mm under σn = 692 kPa is presented in Figure 5. The first five cycles experience most of the degradation in mobilized shear strength and after 10 cycles the mobilized shear strength is almost constant. Based upon the shear stress time history presented in Figure 5, it was hypothesized that the observed degradation in the mobilized shear strength may be related to the cumulative relative shear displacement.
Figure 5. Shear stress vs. time for displacement amplitude ± 120 mm cyclic shear tests at σn = 692 kPa.
A plot of the absolute value of the mobilized shear stress at the peak displacement versus the cumulative relative shear displacement for post-peak displacement amplitudes of 20, 30, 60 and 120 mm at σn = 692 kPa is presented in Figure 6. A distinctive trend of mobilized
shear stress versus cumulative relative shear displacement may be observed in the figure. As the cumulative displacement increases, it appears that a stable minimum value of mobilized shear strength (i.e. a large displacement shear strength) is reached, after which further degradation is negligible. The relationship between mobilized shear strength and cumulative relative shear displacement illustrated in Figure 6 indicates that the reduction in GMX/GCL mobilized shear strength may reasonably be expressed as a function of cumulative relative shear displacement. Relating the reduction in mobilized interface shear strength to the relative shear displacement is not a new concept. Esterhuizen et al. (2001) developed a hyperbolic model for interface behaviour under monotonic loading that relates the reduction in interface shear strength to relative shear displacement based on monotonic interface direct shear test results.
Figure 6. Mobilized shear strength vs. cumulative relative shear displacement for ± 20, 30, 60 and 120 mm amplitudes cyclic shear tests at σn = 692 kPa.
The peak and large displacement shear-strength failure envelopes for the in-plane shear strength of the GMX/GCL combination modeled herein subject to cyclic loading are shown in Figure 7.
Figure 7. Peak and large displacement failure envelopes for the in-plane strength of a GMX/GCL combination.
-800
-600
-400
-200
0
200
400
600
800
-140 -100 -60 -20 20 60 100 140
Sh
ea
r S
tre
ss, τ
(kP
a)
Displacement (mm)
Δa=20mm Δa=30mm Δa=60mm Δa=120mm
-300
-200
-100
0
100
200
300
0 5 10 15 20 25
Sh
ea
r S
tre
ss, τ
(kP
a)
Time (sec)
0
100
200
300
0 2000 4000 6000 8000 10000 12000
She
ar
Stre
ss, τ
(kP
a)
Total (Cumulative) Relative shear displacement (mm)
Δa=20mm
Δa=30mm
Δa=60mm
Δa=120mm
τ = 0.2971σn + 28.274
R² = 0.9923
τ = 0.0259σn + 24.662
R² = 0.9834
0
200
400
600
800
0 500 1000 1500 2000 2500
Shea
r St
ress
, τ(k
Pa)
Normal stress, σn (kPa)
Peak
Large Displacement
Mohr-Coulomb

Both the peak and large displacement shear strength envelopes can be represented by the Mohr-Coulomb model as follows:
tannc [1]
where c is the in-plane cohesion and is the in-plane
friction angle. Table 1 presents the best fit parameters for both the peak and large displacement Mohr-Coulomb envelopes. Table 1. Peak and large displacement shear strength failure envelope parameters.
Failure Envelope
Mohr-Coulomb Parameters
c
(kPa)
(degrees)
Peak 28.20 16.5
Large Displacement 24.70 1.5
The peak strengths in Figure 7 and Table 1 were mobilized at shear displacements of 10.0-15.0 mm.
If the cohesion is assumed to be constant, the friction angle at any stage during degradation can be related to
the mobilized shear strength,, at the peak displacement amplitude according to Eq. 1 as:
n
c
1tan [2]
The friction angle evaluated using Eq. 2 and the large-displacement cohesion from Table 1 is plotted versus the cumulative relative shear displacement for post-peak tests at four different normal stresses in Figure 8. The trends of the four curves are quite similar over the range of normal stresses from 348 kPa to 2071 kPa. At each normal stress, the peak friction angle (and thus peak shear resistance) develops at a relatively small cumulative shear displacement (i.e. 10.0-15.0 mm). Then, as cumulative shear displacement increases the friction angle reduces until it reaches a stable large displacement friction angle. The data in Figure 8 display a higher variability at lower normal stresses. The data in Figure 8 also show a distinctive trend between in-plane friction angle and cumulative relative displacement. This trend may change slightly with normal stress. However, the hypothesis of using cumulative relative displacement as the governing variable to estimate the reduction in in-plane shear strength that accompanies cyclic loading of a GMX/GCL combination is clearly supported by the data in Figure 8.
Figure 8. Friction angle versus cumulative relative shear displacement at normal stresses of 348, 692, 1382 and 2069 kPa for post-peak tests only. 3 DISPLACEMENT-SOFTENING RELATIONSHIP To model the in-plane behaviour of a GMX/GCL specimen subject to cyclic shear loading, a nonlinear displacement-softening model was been developed. The model assumes that a unique relationship exists between the in-plane friction angle and the cumulative relative shear displacement, as suggested by the data in Figure 8. The formulation presented herein results in hysteresis loops representative of those presented in Figure 3. 3.1 Constitutive relationship The generalized shear strength-displacement relationship for the in-plane mobilized friction angle, , of a GMX/GCL
combination is illustrated in Figure 9. Key parameters in this relationship include for the plastic cumulative relative shear displacement ( ), the peak friction angle ( ), the
large displacement friction angle ( ), the cumulative
displacement at the peak friction angle ( ) and
cumulative displacement at the large displacement friction
angle ( ). This formulation assumes elastic behaviour at
relative shear displacements less than and plastic
behaviour after the shear displacement exceeds .
Figure 9. Generalized interface friction angle versus cumulative shear displacement relationship.
0
5
10
15
20
25
0 2000 4000 6000 8000 10000 12000 14000
Fric
tio
n a
ngl
e (d
egre
e)
Total (Cumulative) relative shear displacement (mm)
50 psi (348kPa)
100 psi (692 kPa)
200 psi (1382 kPa)
300 psi (2069 kPa)
p
r
r
p e
p
s
Peak
Residual
p
The assumption that the mobilized friction angle decreases as the cumulative displacement increases once is exceeded and continues to decrease until it
reaches a stable residual value (the large displacement friction angle), as illustrated in Figure 9, is the basis for the displacement-softening model developed herein. This relationship can be represented mathematically as follows:
where a, b and k are model parameters and are assumed to be constant for a particular GMX/GCL combination. These parameters can be defined using the coordinates
( , ), ( , ), and (0, ) from the cumulative shear
displacement relationship in Figure 9. The shear strength of the specimen is equal to until the cumulative
deformation exceeds . At this point, the mobilized
friction angle starts to degrade until it reaches a value of
at a displacement equal to . The rate of decay of the
mobilized friction angle is described by the exponent k. The relationship between the mobilized friction angle and the cumulative plastic shear displacement at
displacements greater than can be written as:
k
p
r
p
da
1 [4]
where
1
1
r
p
p
d
[5]
p
a
1 [6]
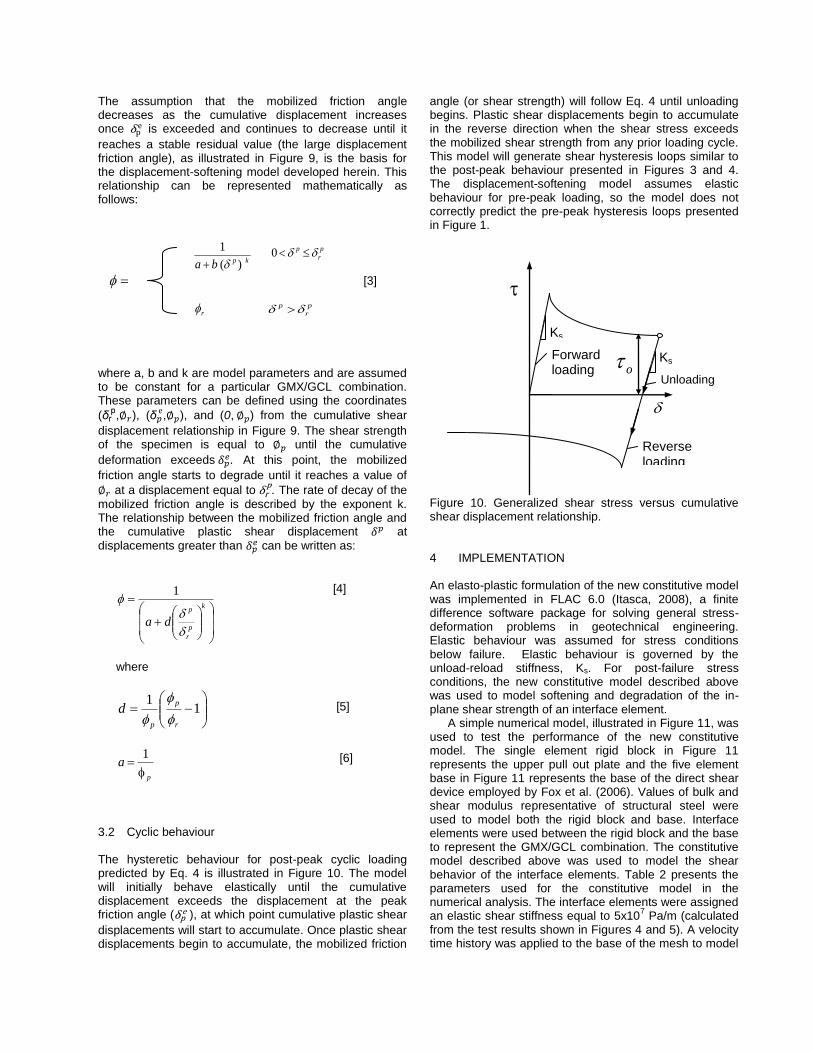
3.2 Cyclic behaviour The hysteretic behaviour for post-peak cyclic loading predicted by Eq. 4 is illustrated in Figure 10. The model will initially behave elastically until the cumulative displacement exceeds the displacement at the peak friction angle ( ), at which point cumulative plastic shear
displacements will start to accumulate. Once plastic shear displacements begin to accumulate, the mobilized friction
angle (or shear strength) will follow Eq. 4 until unloading begins. Plastic shear displacements begin to accumulate in the reverse direction when the shear stress exceeds the mobilized shear strength from any prior loading cycle. This model will generate shear hysteresis loops similar to the post-peak behaviour presented in Figures 3 and 4. The displacement-softening model assumes elastic behaviour for pre-peak loading, so the model does not correctly predict the pre-peak hysteresis loops presented in Figure 1.
Figure 10. Generalized shear stress versus cumulative shear displacement relationship.
4 IMPLEMENTATION An elasto-plastic formulation of the new constitutive model was implemented in FLAC 6.0 (Itasca, 2008), a finite difference software package for solving general stress-deformation problems in geotechnical engineering. Elastic behaviour was assumed for stress conditions below failure. Elastic behaviour is governed by the unload-reload stiffness, Ks. For post-failure stress conditions, the new constitutive model described above was used to model softening and degradation of the in-plane shear strength of an interface element.
A simple numerical model, illustrated in Figure 11, was used to test the performance of the new constitutive model. The single element rigid block in Figure 11 represents the upper pull out plate and the five element base in Figure 11 represents the base of the direct shear device employed by Fox et al. (2006). Values of bulk and shear modulus representative of structural steel were used to model both the rigid block and base. Interface elements were used between the rigid block and the base to represent the GMX/GCL combination. The constitutive model described above was used to model the shear behavior of the interface elements. Table 2 presents the parameters used for the constitutive model in the numerical analysis. The interface elements were assigned an elastic shear stiffness equal to 5x10
7 Pa/m (calculated
from the test results shown in Figures 4 and 5). A velocity time history was applied to the base of the mesh to model
Unloading
Forward loading
s
Reverse loading
Ks
Ks o
kpba )(
1
p
r
p 0
[3]
r p
r
p

the cyclic test input motion (25 cycles of sinusoidal displacement with f = 1 Hz).
Figure 11. Finite difference model (macro elements shown). Table 2. Model parameters values for model verification.
Shear strength
Plastic parameters
Elastic parameters
c
kPa
p
degree
r
degree
e
p
mm
p
r
m k
Ks
pa/m
26 16.5 1.5 10.6 12.0 0.52 5x10⁷
The results calculated using the numerical model are compared to the experimental results from Ross (2009) for a normal stress of 2071 kPa and a 120 mm displacement amplitude in Figure 12. While there is some discrepancy with respect to the initial stiffness and peak shear strength, the numerical model appears to accurately predict the degradation in shear stress.
Figure 12. Comparison of test data to prediction using new constitutive model for ± 120 mm displacement amplitude at σn = 2071 kPa.
The numerical and experimental results under the same normal stress as in Figure 12 (2071 kPa) but for a 60 mm displacement amplitude (instead of 120 mm) are compared in Figure 13. While the numerical model still seems a little off with respect to the initial stiffness, in this case it accurately predicts the peak shear stress upon initial loading and the shear strength at the point of stress reversal. However, the numerical model does not capture the peak in the shear stress at the beginning of every cycle.
Figure 13. Comparison of test data to prediction using new constitutive model for ± 60 mm displacement amplitude at σn = 2071 kPa. In Figure 14, the shear stress time history calculated using the numerical model is compared to the results for the test with a displacement amplitude of 120 mm at a normal stress of 692 kPa (the test results presented in Figure 5). The general trend of the shear stress time history is captured well by the numerical model results presented in Figure 14. However, similar to the discrepancy between the numerical model and test results presented in Figure 13, the peak at the beginning of every stress cycle was not captured by the numerical model. The shear stress spikes observed in the test data at the begging of every cycle may be related to the internal shear behaviour of the GCL, as opposed to the behaviour of the GMX/GCL interface.
Figure 14. Shear stress vs. time calculated for (± 120 mm) displacement amplitudes cyclic shear tests at σn = 692 kPa.
Rigid Block
Interface Elements
Base
X
Y Normal stress (σn)

5 SUMMARY AND CONCLUSIONS An elasto-plastic constitutive model for the in-plane shear behaviour of a GMX/GCL combination has been developed to simulate the degradation in mobilized shear strength accompanying cyclic loading that exceeds the peak shear strength of the material. The model uses the Mohr- Coulomb shear strength criterion for both peak and post-peak shear strength characterization. When implemented in a finite difference computer program, the model is shown to capture the degradation of hysteresis loops (i.e. the degradation in mobilized shear strength) observed in direct shear testing of a GMX/GCL combination. Comparison of numerical and experimental results indicates that the model has some shortcomings with respect to the initial shear stiffness and the shear stress immediately after shear stress reversal. However, capturing the degradation of the mobilized shear strength is considered to be of paramount importance in modeling the behaviour of a GMX/GCL combination subject to earthquake loading.
The framework of the model can be expanded to any geosynthetic interface that follows the same trend of strength reduction, i.e. a strength reduction dependent upon the cumulative relative shear displacement during cyclic loading. A shortcoming of the model is that it is based solely upon the results of uniform cyclic loading tests. However, no data was available on the behaviour of a GMX/GCL combination subject to non-uniform cyclic loading. Additional experimental data is needed to assess the performance of the model under non-uniform cyclic loading, e.g. under loading conditions representative of seismic loading. Furthermore, additional work is needed to improve model performance during initial loading and immediately following stress reversal. ACKNOWLEDGEMENTS The work in this paper is part of a joint Arizona State University / University of California at San Diego research program titled GOALI: Collaborative Research: The Integrity of Geosynthetic Elements of Waste Containment Barrier Systems Subject to Large Settlements or Seismic Loading. This project is funded by the Geomechanics and Geotechnical Systems, Geoenvironmental Engineering, and Geohazards Mitigation program of the National Science Foundation (NSF) Division of Civil, Mechanical, and Manufacturing Innovation under grant number CMMI-0800873. The authors are grateful for this support as well as support of project’s industrial partners, Geosyntec Consultants, Inc and CETCO. Opinions and positions expressed in this paper are the opinions and positions of the authors only and do not reflect the opinions and positions of the NSF.
REFERENCES Byrne, R.J. 1994. Design issues with strain-softening
interfaces in landfill liners. Proc. Waste Tech. ’94, Charleston, South Carolina, USA, 1-26.
Desai, C.S., and Fishman, K. L. 1991. Plasticity-based constitutive model with associated testing for joints. Int. J. Rock Mech. Min. Sci. Geomech. Abstr., 28, 15–26.
Esterhuizen, J.J.B., Filz, G.M., and Duncan, J.M. 2001. Constitutive behavior of geosynthetic interfaces. J. Geotech. and Geoenvir. Engrg., ASCE, 127(10): 834-840.
Fox, P.J., and Kim, R.H. 2008. Effect of progressive failure on measured shear strength of geomembrane/GCL interface. Journal of Geotechnical and Geoenvironmental Engineering, 134(4): 459-469.
Fox, P.J., Nye, C.J., Morrison, T.C., Hunter, J.G., and Olsta, J.T. 2006. Large dynamic direct shear machine for geosynthetic clay liners. Geotechnical Testing Journal, 29(5): 392-400.
Itasca Consulting Group, Inc. 2008. FLAC – Fast Lagrangian analysis of continua, user’s manual,
www.itasca.com. Kim, J., Riemer, M., and Bray, J.D. 2005. Dynamic
properties of geosynthetic interfaces. Geotechnic al Testing Journal, 28(3): 1-9.
Lo Grasso, S.A., Massimino, M.R., and Maugeri, M. 2002. Dynamic analysis of geosynthetic interfaces by shaking table tests. Proc. 7th International Con ference on Geosynthetics, P. Delmas and J. P. Gourc,
eds., Nice, 4, 1335-1338. McCartney, J.S., Zornberg, J.G., and Swan, R.H., Jr.
2009. Analysis of a large database of GCL geomembrane interface shear strength results. Journal of Geotechnical and Geoenvironmental Engineering, 134(2), 209-223.
Ross J.D., Fox P. J. and Olsta, J. T. 2010. Dynamic shear testing of a geomembrane/geosynthetic clay liner interface. 9th International Conference on Geosynthetics, IGS-Brazil, 2: 649-652.
Ross, J.D. 2009. Static and dynamic shear strength of a geomembrane/geosynthetic clay liner interface. M.S.
thesis, Department of Civil and Environmental Engineering and Geodetic Science, The Ohio State University, Columbus, Ohio, USA.
Triplett, E.J. and Fox, P.J. 2001. Shear strength of HDPE geomembrane/geosynthetic clay liner interfaces. Journal of Geotechnical and Geoenvironmental Engineering, 127(6): 543-552.