dispersion model guidelines for oil batteries in the
TRANSCRIPT

Project Number: 02-215W
Date: February 15, 2002
Submitted By: RWDI West Inc.
Principal Meteorologist - Mervyn J.E. Davies, M.Sc.
Submitted To:
Manitoba Industry, Trade and Mines Petroleum Branch
DISPERSION MODEL GUIDELINES
FOR OIL BATTERIES IN THE
PROVINCE OF MANITOBA
RWDI West Inc. Consulting Engineers 1800, 840-7th Avenue SW Calgary, Alberta Canada T2P 3G2 Tel: (403) 232-6771 Fax: (403) 232-6762 Email: [email protected] Website: www.rwdiwest.com A Member of the RWDI Group of Companies

TABLE OF CONTENTS Page
1 INTRODUCTION ...............................................................................................................1
2 MODELLING OVERVIEW ...............................................................................................2
Dispersion Modelling Background ......................................................................................2
Dispersion Model Input .......................................................................................................2
Dispersion Model Output.....................................................................................................3
Dispersion Model Types ......................................................................................................3
SCREEN3 Model Overview................................................................................................3
MS-DOS Version of SCREEN3 ..........................................................................................4
Windows Version of SCREEN3..........................................................................................5
SCREEN 3 Output Interpretation ........................................................................................5
3 EMISSION SOURCE CHARACTERIZATION ..............................................................10
Emission Source Background............................................................................................10
SCREEN3 Emission Source Types ...................................................................................12
Combustion Emission Sources ..........................................................................................14 Heater-treater Stack Emissions ................................................................................. 14 Flare Stack Emissions ............................................................................................... 15 Flare Pit Emissions ................................................................................................... 16 Flare Spreadsheet ...................................................................................................... 16
Non-combustion Sources ...................................................................................................18 Heater-treater Off Gas............................................................................................... 18 Tank Vents ................................................................................................................ 18
Local Aerodynamic Effects ...............................................................................................19 Stack Tip Downwash ................................................................................................ 20 Building/Structure Wake .......................................................................................... 20
Multiple/ Overlapping Sources ..........................................................................................20 Overlapping Method 1 .............................................................................................. 21 Overlapping............................................................................................................... 21 Method 2 ................................................................................................................... 21 Overlapping Comment.............................................................................................. 21 Volume to Mass Conversion..................................................................................... 22

4 METEOROLOGY .............................................................................................................23
Meteorology.......................................................................................................................23
Background ........................................................................................................................23
Wind Direction...................................................................................................................25
Wind Speed and Stability Class.........................................................................................26
Mixing Height....................................................................................................................27
Fumigation .........................................................................................................................28
Rural and Urban Dispersion...............................................................................................28
Ambient Temperature ........................................................................................................29
5 RECEPTORS AND TERRAIN.........................................................................................30
Terrain Types .....................................................................................................................30
Flat Terrain.........................................................................................................................30
Simple Terrain ...................................................................................................................31
Complex Terrain ................................................................................................................31
6 OUTPUT INTERPRETATION.........................................................................................33
Averaging Periods Longer than One Hour ........................................................................33
Peak-To-Mean Ratio..........................................................................................................33
7 REGULATORY SUBMISSION .......................................................................................34
8 EXAMPLES ......................................................................................................................36

Project 02-215W 1 RWDI West Inc.
1 INTRODUCTION
Background The Petroleum Branch of Manitoba Industry, Trade and Mines recently introduced amendments to the Drilling and Production Regulation (“the Regulation”) dealing with oil batteries. The amendments focus on solution gas management at the batteries relative to emissions of hydrogen sulphide (H2S) and sulphur dioxide (SO2). As a follow-up to the amendments, the Petroleum Branch issued Guidelines for Implementing Regulatory Changes Relating to the Permitting and Operation of Batteries (Information Notice 02-1) (“the Guidelines”). The objective of the Regulation amendments and the Guidelines is to ensure that the operation of oil batteries does not result in ambient H2S or SO2 concentrations that exceed the following maximum acceptable level criteria for these compounds:
Maximum Acceptable Level
1-h average 24-h average H2S 15 µg/m3 (11 ppb) 5 µg/m3 (4 ppb)
SO2 900 µg/m3 (0.34 ppm) 300 µg/m3 (0.11 ppm) These maximum acceptable level criteria are applicable beyond the battery site. The Regulation amendments and Guidelines require oil battery operators to demonstrate, using air dispersion modelling, that H2S and SO2 emissions will comply with maximum acceptable level ambient criteria. The Petroleum Branch recommends that the U.S. Environmental Protection Agency (US EPA) SCREEN3 dispersion model be used for this purpose.
Modelling Guideline Objective
In response to the need for dispersion modelling, the Petroleum Branch has prepared this SCREEN3 Dispersion Modelling Guideline document to assist operators in meeting the expectations expressed in the Regulation and Guidelines. While the US EPA has documentation for the SCREEN3 model, this Modelling Guideline is designed to bridge the gap between the Regulation and Guidelines, and the formal dispersion model documentation. The Modelling Guideline is designed to help regulatory staff, operators and other stakeholders apply the SCREEN3 dispersion model and review the SCREEN3 predictions in the context of the oil battery facilities located in the province of Manitoba.

Project 02-215W 2 RWDI West Inc.
2 MODELLING OVERVIEW
Dispersion Modelling Background
Dispersion models provide a scientific link between emissions discharged to the atmosphere and associated changes in air chemistry downwind of the discharge. The discharge, once released to the atmosphere is referred to as a plume. Dispersion models can address the following atmospheric processes:
• Transport: The downwind location of a plume is determined by
the wind direction at plume level. • Dispersion: Thermal and mechanical turbulence processes in the
atmosphere dilute the plume as it is carried downwind. • Chemistry: Depending on the pollutant, gas-to-gas or gas-to-
particle transformation can take place. • Deposition: The interaction of the plume with precipitation or
with surface features such as a tree canopy results in the removal of the pollutant from the air.
These atmospheric processes are represented by mathematical algorithms that are based on a combination of field observations and theoretical considerations. For convenience, these relationships have been incorporated into computer code, which is referred to as a “computer model”.
Dispersion Model Input
To replicate these atmospheric processes, the models require information that can be broadly classified as follows:
• Source: Pollutant streams are frequently discharged to the
atmosphere through a stack with a considerable vertical velocity or a high temperature. The resulting plume will tend to rise due to associated momentum and/or buoyancy effects. To replicate the initial behaviour (i.e., plume rise), parameters such as stack height, stack diameter, exit velocity and exit temperature are required.
• Meteorology: Meteorology controls the transport and dispersion of the plume as it is carried downwind. Important meteorological parameters include wind direction, wind speed, atmospheric turbulence and mixing height.
• Terrain: Terrain features can modify the horizontal trajectory by steering, channelling, and blocking the airflow. For example, a plume emitted in a valley can be confined to the valley and transported along the valley axis. A plume passing over elevated terrain may, in the extreme, impinge on the elevated terrain feature. Rough terrain, in conjunction with surface features such as a tree canopy can increase atmospheric turbulence.

Project 02-215W 3 RWDI West Inc.
Dispersion Model Output
The dispersion model output can be comprised of the following:
• Concentration predictions for specified receptor locations. • An echo of the input parameters to confirm and to provide a
record of the input parameters. • Predictions of other parameters such as plume height or
dispersion coefficients that can be used to help interpret the predicted concentrations.
The model calculates maximum concentrations that can be compared to the maximum ambient air quality criteria in order to determine acceptability. In the event that the maximum predicted values are greater than the criteria, the model can be re-run with modified source parameters to determine operating parameters that will meet the objectives.
Dispersion Model Types
Dispersion models can be categorized according to the complexity of the meteorological input as follows:
• Event. This approach calculates ambient concentrations for an
event defined by a single set of source and meteorological conditions. The duration of an event is typically of the order of one hour. The event mode is used either to help explain a single observation or to help determine model performance.
• Screening. This approach calculates concentrations for a wide range of meteorological conditions. The meteorological conditions are typically pre-selected by the model.
• Sequential Time Series. This approach is used to simulate air quality changes on an hour-by-hour basis using a representative year of hourly average meteorological data (8760 h). The approach creates an hourly average concentration file for all source/receptor combinations. The hourly average concentration file can then be used to determine average concentrations for periods that are multiples of one-hour.
SCREEN3 Model Overview
The US EPA developed the SCREEN dispersion model to provide an easy-to-use method of obtaining pollutant concentrations. The current version of the model is SCREEN3, Version 3.0 of the SCREEN model. The SCREEN3 model can be used to:
• Determine the maximum ground-level pollutant concentrations
downwind for a wide range of meteorological conditions. • Address dispersion in rural and urban areas.
Project 02-215W 4 RWDI West Inc.
• Include the effects of building downwash. • Address terrain effects.
The model focuses primarily on predicting 1-hour average concentrations from a single source. Post-processing of the model output can be undertaken to determine concentrations for other averaging periods and for multiple sources. More detailed US EPA supported models such as ISCST3, AERMOD and CALPUFF address multiple sources, elevated terrain and different averaging periods in a more rigorous manner.
Documentation for the SCREEN3 model include the following reports:
• SCREEN2 Model User’s Guide. EPA document EPA-450/4-92-
006. Prepared by the US Environmental Protection Agency (September 1992).
• Screening Procedures for Estimating the Air Quality Impact of Stationary Sources. EPA document EPA-454/R 92-019. Prepared by the US Environmental Protection Agency (October 1992).
• SCREEN3 Model User’s Guide. EPA document EPA-454/B-95-004. Prepared by the US Environmental Protection Agency (September 1995).
The SCREEN3 model code, executable file, support documentation and sample input/output files are available from the US EPA Support Centre for Regulatory Models (SCRAM) website (www.ttn.epa.gov/scram).
MS-DOS Version of SCREEN3
The SCRAM version of the model is not Windows compatible and has to be run under a MS-DOS Window (for Windows 95 or 98). For Windows 2000, the MS-DOS window is referred to as the “Command Prompt” Window. Features of the MS-DOS version of the model are as follows:
• The user responds to a series of questions to provide the input
data and to select the model options (e.g., Figure 2.1). The user cannot check or change the input without starting from the beginning.
• The SCREEN3 executable file creates an input file named SCREEN.DAT and an output file named SCREEN.OUT for each version. The user has no control over the naming of these files.
• A third-party text editor or word processing package is used to view, archive and print the model output.
Project 02-215W 5 RWDI West Inc.
While full functionality is available through the MS-DOS version, the interface does not meet contemporary graphical user interface (GUI) expectations established by mainstream Windows programs.
Windows Version of SCREEN3
Given the widespread and associated frequent use of the SCREEN3 model, Windows based GUIs for the model are commercially available from the following sources:
• Lakes Environmental (450 Phillip Street — Suite 2, Waterloo,
Ontario, N2L 5J2, Canada. Telephone: 519-746-5995). The Lakes Environmental website is www.lakes-environmental.com. Their SCREEN3 interface is referred to as SCREEN View.
• Trinity Consultants (12801 North Central Expressway, Suite 1200, Dallas, TX 75243-1791, U.S.A.). Telephone: 919-549-0499). Their software website is www.breeze-software.com.
• BEE-Line Software (P.O. Office 7348, Ashville, NC 28802, U.S.A. Telephone: 828-628-0636). The BEE-Line website is www.beeline-software.com.
All three suppliers provide Windows interfaces for air quality models that include SCREEN3. The advantages of the Window’s interface versions include:
• Integrated model input and execution. • Post-processing of data provides a concentration versus distance
plot. • Ability to review, check and modify input parameters prior to
execution. • Ability to handle Metric and English units. • Context sensitive Help features.
Figure 2.2 provides an example of one of the SCREEN View input windows.
SCREEN 3 Output Interpretation
Regardless of whether Windows or MS-DOS versions of the model are used, SCREEN3 produces the same output (Figure 2.3). The user typically will confirm the input parameters and view the concentration profile. The maximum predicted value is then compared to the maximum ambient acceptable level criteria.

Project 02-215W 6 RWDI West Inc.
Figure 2. 1 An example of the MS-DOS input procedure.

Project 02-215W 7 RWDI West Inc.
Figure 2. 2 An example of the SCREEN View input windows.

Project 02-215W 8 RWDI West Inc.
Figure 2. 3 An example of the SCREEN3 model output.
02/03/02 18:03:59 *** SCREEN3 MODEL RUN *** *** VERSION DATED 96043 *** Heater-treater Stack Example SIMPLE TERRAIN INPUTS: SOURCE TYPE = POINT EMISSION RATE (G/S) = .500000 STACK HEIGHT (M) = 6.1000 STK INSIDE DIAM (M) = .3000 STK EXIT VELOCITY (M/S)= 2.5000 STK GAS EXIT TEMP (K) = 573.0000 AMBIENT AIR TEMP (K) = 293.0000 RECEPTOR HEIGHT (M) = .0000 URBAN/RURAL OPTION = RURAL BUILDING HEIGHT (M) = .0000 MIN HORIZ BLDG DIM (M) = .0000 MAX HORIZ BLDG DIM (M) = .0000 THE REGULATORY (DEFAULT) MIXING HEIGHT OPTION WAS SELECTED. THE REGULATORY (DEFAULT) ANEMOMETER HEIGHT OF 10.0 METERS WAS ENTERED. BUOY. FLUX = .270 M**4/S**3; MOM. FLUX = .072 M**4/S**2. *** FULL METEOROLOGY *** ********************************** *** SCREEN AUTOMATED DISTANCES *** ********************************** *** TERRAIN HEIGHT OF 0. M ABOVE STACK BASE USED FOR FOLLOWING DISTANCES *** DIST CONC U10M USTK MIX HT PLUME SIGMA SIGMA (M) (UG/M**3) STAB (M/S) (M/S) (M) HT (M) Y (M) Z (M) DWASH ------- ---------- ---- ----- ----- ------ ------ ------ ------ ----- 100. 357.7 3 1.5 1.5 480.0 11.44 12.56 7.60 NO 200. 326.5 4 1.5 1.5 480.0 11.44 15.64 8.64 NO 300. 294.8 4 1.0 1.0 320.0 14.11 22.73 12.31 NO 400. 229.7 4 1.0 1.0 320.0 14.11 29.54 15.44 NO 500. 177.8 4 1.0 1.0 320.0 14.11 36.22 18.44 NO 600. 140.1 4 1.0 1.0 320.0 14.11 42.78 21.33 NO 700. 112.8 4 1.0 1.0 320.0 14.11 49.24 24.14 NO 800. 101.1 6 1.0 1.0 10000.0 22.03 28.01 12.81 NO 900. 103.1 6 1.0 1.0 10000.0 22.03 31.11 13.76 NO 1000. 102.8 6 1.0 1.0 10000.0 22.03 34.19 14.68 NO 1100. 100.4 6 1.0 1.0 10000.0 22.03 37.24 15.50 NO 1200. 97.28 6 1.0 1.0 10000.0 22.03 40.27 16.31 NO 1300. 93.72 6 1.0 1.0 10000.0 22.03 43.28 17.09 NO 1400. 89.96 6 1.0 1.0 10000.0 22.03 46.27 17.85 NO 1500. 86.15 6 1.0 1.0 10000.0 22.03 49.24 18.60 NO 1600. 82.38 6 1.0 1.0 10000.0 22.03 52.19 19.33 NO 1700. 78.72 6 1.0 1.0 10000.0 22.03 55.13 20.04 NO 1800. 75.19 6 1.0 1.0 10000.0 22.03 58.05 20.74 NO 1900. 71.83 6 1.0 1.0 10000.0 22.03 60.95 21.43 NO 2000. 68.63 6 1.0 1.0 10000.0 22.03 63.84 22.10 NO 2100. 65.62 6 1.0 1.0 10000.0 22.03 66.71 22.67 NO 2200. 62.80 6 1.0 1.0 10000.0 22.03 69.57 23.23 NO 2300. 60.16 6 1.0 1.0 10000.0 22.03 72.42 23.78 NO 2400. 57.69 6 1.0 1.0 10000.0 22.03 75.26 24.32 NO 2500. 55.37 6 1.0 1.0 10000.0 22.03 78.08 24.85 NO 2600. 53.19 6 1.0 1.0 10000.0 22.03 80.89 25.36 NO 2700. 51.15 6 1.0 1.0 10000.0 22.03 83.69 25.87 NO 2800. 49.22 6 1.0 1.0 10000.0 22.03 86.48 26.38 NO 2900. 47.41 6 1.0 1.0 10000.0 22.03 89.27 26.87 NO

Project 02-215W 9 RWDI West Inc.
3000. 45.70 6 1.0 1.0 10000.0 22.03 92.04 27.36 NO 3500. 38.70 6 1.0 1.0 10000.0 22.03 105.75 29.34 NO 4000. 33.35 6 1.0 1.0 10000.0 22.03 119.26 31.17 NO 4500. 29.16 6 1.0 1.0 10000.0 22.03 132.58 32.89 NO 5000. 25.81 6 1.0 1.0 10000.0 22.03 145.74 34.51 NO 5500. 23.07 6 1.0 1.0 10000.0 22.03 158.76 36.05 NO 6000. 20.80 6 1.0 1.0 10000.0 22.03 171.64 37.51 NO 6500. 18.90 6 1.0 1.0 10000.0 22.03 184.40 38.91 NO 7000. 17.27 6 1.0 1.0 10000.0 22.03 197.05 40.26 NO 7500. 15.92 6 1.0 1.0 10000.0 22.03 209.59 41.41 NO 8000. 14.74 6 1.0 1.0 10000.0 22.03 222.03 42.53 NO 8500. 13.71 6 1.0 1.0 10000.0 22.03 234.38 43.60 NO 9000. 12.80 6 1.0 1.0 10000.0 22.03 246.65 44.63 NO 9500. 11.99 6 1.0 1.0 10000.0 22.03 258.83 45.63 NO 10000. 11.27 6 1.0 1.0 10000.0 22.03 270.94 46.61 NO 15000. 6.867 6 1.0 1.0 10000.0 22.03 388.45 55.07 NO 20000. 4.917 6 1.0 1.0 10000.0 22.03 500.97 60.47 NO 25000. 3.791 6 1.0 1.0 10000.0 22.03 609.77 65.02 NO 30000. 3.064 6 1.0 1.0 10000.0 22.03 715.60 68.99 NO 40000. 2.219 6 1.0 1.0 10000.0 22.03 920.23 74.63 NO 50000. 1.728 6 1.0 1.0 10000.0 22.03 1117.43 79.32 NO MAXIMUM 1-HR CONCENTRATION AT OR BEYOND 100. M: 100. 357.7 3 1.5 1.5 480.0 11.44 12.56 7.60 NO DWASH= MEANS NO CALC MADE (CONC = 0.0) DWASH=NO MEANS NO BUILDING DOWNWASH USED DWASH=HS MEANS HUBER-SNYDER DOWNWASH USED DWASH=SS MEANS SCHULMAN-SCIRE DOWNWASH USED DWASH=NA MEANS DOWNWASH NOT APPLICABLE, X<3*LB *************************************** *** SUMMARY OF SCREEN MODEL RESULTS *** *************************************** CALCULATION MAX CONC DIST TO TERRAIN PROCEDURE (UG/M**3) MAX (M) HT (M) -------------- ----------- ------- ------- SIMPLE TERRAIN 357.7 100. 0. *************************************************** ** REMEMBER TO INCLUDE BACKGROUND CONCENTRATIONS **
***************************************************

Project 02-215W 10 RWDI West Inc.
3 EMISSION SOURCE CHARACTERIZATION
Emission Source Background
There are about 80 oil batteries in the province of Manitoba. Characteristics of these batteries include:
• Oil production can range from 1 to 180 m3/d. • The typical water-to-oil ratio is 10 m3 water per m3 oil. • Gas to oil ratios vary from 5 to 65 m3 of solution gas (as a gas at
NTP) per m3 oil (as a liquid). • H2S concentrations in the solution gas can range from <0.01% to
13.5%.
The solution gas for these facilities is variously used as process fuel, flared, incinerated or vented. The disposal method depends on the battery and on the volume of gas produced.
As the solution gas can contain varying amounts of hydrogen sulphide (H2S), associated combustion of the solution gas will result in sulphur dioxide (SO2) emissions. The direct venting of H2S emissions to the atmosphere results in a potential for odours due to a relatively low odour threshold for H2S. Figure 3.1 represents a typical oil battery processing schematic showing locations for potential air emissions. The following are noted:
• The well fluids enter a free-water knockout separator where any
liquid water that is not in an emulsion is removed and directed to an on-site water storage tank.
• A heater-treater is used to separate the oil-water emulsion. During this heating process most of the solution gas is flashed. This gas can be collected and be used to fire the heater-treater (i.e., used as process gas), directed for disposal through a flare stack or directed to the storage tanks.
• The recovered water is directed to the water storage tank and the oil is directed to an oil storage tank.
• Residual amounts of solution gas often remain in the water and the oil product. As a consequence, the solution gas can collect in the headspace of both tanks and vent directly to the atmosphere through the tank vents, or be collected by a vapour recovery system and used as process fuel or directed to the flare stack

Project 02-215W 11 RWDI West Inc.
Figure 3.1 Potential emission sources associated with Manitoba oil batteries.
Test Satellite
Recycle Pump
6' X 20' Treater
Disposal Pump400 bblWaterTank
400 bblWaterTank
400 bblPopTank
1000 bblOilTank
500 bbl 500 bbl
Vapour Recovery Lines
Flare Stack and Knock Out Drum
Disposal Well
HeaderEmulsion In
Oil Tank Vents
Water Tank Vents
Flare Stack
Heater-Treater Stack

Project 02-215W 12 RWDI West Inc.
In summary, the two primary source types are as follows:
• Combustion sources that include the use of the solution gas as a process gas or the flare. In this case, the H2S in the solution gas is converted to SO2. Ambient SO2 concentrations are likely to be of a lesser concern than H2S since the combustion products will be buoyant and rise, and the odour threshold for SO2 is much greater than that for H2S.
• Direct venting of solution gas will not have the benefit of a buoyant plume rise and the low odour threshold for H2S has the potential to produce odours.
SCREEN3 Emission Source Types
The SCREEN3 model defines the following source types that depend on the physical characteristics of the release:
• A Point source is an isolated stack or vent that is typically defined
by a pipe that is oriented vertically with a circular cross section (e.g., a stack). Gas flow from a point source is characterized by an exit velocity and an exit temperature. For combustion sources, the products of combustion can be significantly warmer than ambient (e.g., 300 °C). For non-combustion sources, the exit temperature can be near ambient (e.g., about 18 °C).
• A Flare source is a specialized point source where the combustion takes place at the stack tip. The products of combustion are significantly warmer than ambient (e.g., 1000 °C).
• An Area source is a ground-based source where the emissions can be assumed to originate from a defined area. Examples include evaporation of hydrocarbons from an impoundment pond or emissions from a landfill site. The emissions are assumed to be at the ambient temperature.
• A Volume source is used to represent a diffuse source with an initial size. Examples include dust emissions from a storage pile or fugitive gas emissions from an industrial facility. Emissions are assumed to be at the ambient temperature.
Table 3.1 identifies the parameters required to characterize these respective source types. The table also indicates the respective metric units. The Point source option can be used to represent a heater-treater stack, incinerator stack, a flare stack and a tank vent. The Flare source option can be used to represent a flare pit or a flare stack. Area and Volume sources are not normally applicable to the type of sources associated with an oil battery.

Project 02-215W 13 RWDI West Inc.
Table 3. 1 Input parameters required to represent each source type.
Point Source Parameter Description Units
Emission Rate Mass emission rate of the pollutant (i.e., SO2 or H2S).
g/s
Stack Height Stack height above plant grade. m Stack Inside Diameter Inside diameter. m Stack Gas Exit Velocity
Exit velocity based on the volumetric flow rate. m/s
Stack Gas Exit Temperature
Temperature of the gas released. K
Ambient Air Temperature
Use the default value of 293 K for non- flares. Use 288 K for flare stacks. Use exit temperature for non-buoyant releases.
K
Receptor Height Above Ground
For ground level, use 0 m. Can be non-zero to represent a balcony or a roof.
m
Flare Source Parameter Description Units Emission Rate Mass emission rate of the pollutant (i.e., SO2). g/s Flare Stack Height Stack height above plant grade. m Stack Inside Diameter Inside diameter. m Total Heat Release Total heat release due to the combustion of the
gas stream to flare. cal/s
Receptor Height Above Ground
For ground level, use 0 m. Can be non-zero to represent a balcony or a roof.
m
Area Source Parameter Description Units Emission Rate Mass emission rate of the pollutant per unit area
(i.e., H2S). g/m2/s
Source Release Height Release height above ground. m Length Larger side of a rectangular source. m Width Smaller side of a rectangular source. m Receptor Height Above Ground
For ground level, use 0 m. Can be non-zero to represent a balcony or a roof.
m
Search through a range of wind direction?
Select Yes. SCREEN3 will consider a range of wind direction orientations relative to the rectangular source.
-
Volume Source
Parameter Description Units Emission Rate Mass emission rate of the pollutant (i.e., H2S) g/s Source Release Height Release height above ground. m Initial Lateral Dimension
Rectangular length ÷ 4.3. m
Initial Vertical Dimension
Vertical dimension ÷ 2.15. m
Receptor Height Above Ground
For ground level, use 0 m. Can be non-zero to represent a balcony or a roof.
m

Project 02-215W 14 RWDI West Inc.
Combustion Emission Sources
The primary combustion products due to a hydrocarbon fuel stream include carbon dioxide and water vapour from the hydrocarbons, and nitrogen from the entrained air. The products of combustion are much warmer than the ambient air and will rise. The increased plume height (hp) given by the sum of the physical stack height (Hp) and the plume rise (hr) will have the beneficial effect of reducing ground-level concentrations.
hr
hp
hr
hp
hr
hp
hr
hp
For the purposes of this Modelling Guideline, the primary combustion pollutant of concern is sulphur dioxide (SO2) that results from the combustion of hydrogen sulphide (H2S) in the fuel stream.
Heater-treater Stack Emissions
To replicate the plume rise from a heater-treater, the stack exit temperature and exit velocity are required. The volumetric flow rate of the products of combustion, which includes the entrained air will depend on:
• Fuel consumption rate. Can be obtained from manufacturer
specifications, i.e., the design heat output and heat exchanger efficiency.
• Fuel composition. Can be obtained from battery fuel gas analyses. • Operating parameters. The amount of excess air will affect the
exit temperature and the flow rate. • The completeness of the combustion. For the purposes of
calculating plume rise, 100% combustion can be assumed.
Mass and energy balance calculations can be used to estimate the stack exit temperature (°C) and the total volumetric stack gas flow rate (m3/s).
The stack exit temperature (Ts) required by SCREEN3 will be given by:
Ts(K) = Ts(°C) + 273.15

Project 02-215W 15 RWDI West Inc.
The exit velocity (Vs) required by SCREEN3 will be given by:
(K))T(m R(K)/s)T(mQ
(m/s)Vr
22s
s3
rs π
=
where: Qr = stack gas flow rate at reference conditions (m3/s) Rs = stack tip exit radius (m) Tr = reference temperature for Qr (typically Tr = 288 K).
The SO2 release rate is based on the reaction:
H2S + 3/2 O2 ⇒ SO2 + H2O
Complete combustion assumes that 1 kmole of H2S produces 1 kmole of SO2. On a volumetric basis 1 m3 of H2S produces 1 m3 of SO2. On a mass basis, 1 kg of H2S produces 1.880 kg of SO2, this result is based on a molecular mass of 34.076 for H2S and a molecular mass of 64.059 for SO2. Combustion calculations to determine exit velocity and SO2 release rates are normally based on current or proposed maximum flow rate conditions. If the actual flow rate and H2S values are much less than the maximum rates, then representative values at the normal operating conditions may be required in addition to the maximum values.
The stack height (m) and diameter (m) can be determined from on-site measurements or from as-built engineering drawings. The stack height is relative to grade and the diameter refers to the inside stack tip diameter.
Flare Stack Emissions
The primary difference between a heater-treater and the flare results from the location where the combustion takes place. For a heater-treater, the combustion takes placed in an appropriately designed combustion chamber prior to having the combustion products enter the stack. For a flare, the combustion takes place at the stack tip in the atmosphere. A portion of the heat release at the flare tip will by lost by radiation while the remaining amount will heat the products of combustion and the entrained air. The plume rise will therefore depend on the fraction of heat radiated. Depending on the flare type, the fraction of heat loss can range from the 10 to 15% range for a pure hydrogen or methane flame to 55% reported in a gas flare accompanied by an oil spray to produce a visible plume.
Two methods are available to replicate a flare stack with the SCREEN3 model:

Project 02-215W 16 RWDI West Inc.
• The first method uses the Flare option that requires the total heat
release (cal/s) and the SO2 emission rate (g/s). The SO2 emission rate is calculated in the same manner as for a process heater-treater (i.e., assuming complete conversion of H2S in the fuel to SO2). The SCREEN3 flare option assumes 55% heat radiation, leaving 45% contributing to plume rise.
• The second method uses the Point option with pseudo stack parameters that are selected to represent the same plume rise that would result from the Flare option. By using pseudo parameters, a different radiation assumption can be adopted. Specifically, a radiation value of 25% has been adopted elsewhere as being more representative. This assumption assumes 75% of the energy content contributes to the plume rise, resulting in a larger rise and smaller ground level concentrations relative to the 55% assumption.
The second method is recommended and a spreadsheet has been supplied to calculate the pseudo parameters based on the gas stream flow rate and the composition. The spreadsheet can account for two gas streams to obtain the required parameters for the combined gas stream.
Recent research has indicated that minimum heats of combustion in the 12 to 20 MJ/m3 range is required to ensure a stable flame. In some cases, a higher heat content gas can be required to ensure that the combined gas stream meets the minimum. As solution gas streams in Manitoba typically have heating values greater than 30 MJ/m3, the addition of a higher heat content gas is not required.
Flare Pit Emissions A ground based flare would behave in a manner similar to that of an
elevated flare without the advantage of an initial stack height. As a consequence the same approach can be adopted for a ground flare as for a regular flare with the exception that the physical stack height is set to 0 m.
Flare Spreadsheet A spreadsheet has been prepared (in Microsoft Excel format) to
calculate pseudo stack parameters (Figure 3.2). The user is required to provide the following:
• Flow rate of gas stream to flare. • Composition of gas stream to flare. • Flare stack height. • Flare stack tip diameter.
The spreadsheet provides the following parameters to be used as input for the Point option:

Project 02-215W 17 RWDI West Inc.
Figure 3. 2 Flare stack spreadsheet.

Project 02-215W 18 RWDI West Inc.
• The pseudo stack height (m) is based on the sum of the physical stack height and the flame height.
• A pseudo stack gas temperature of 1000 °C is assumed. • The actual exit velocity (m/s) based on the gas flow rate to the flare
and the flare tip cross-sectional area. • A pseudo diameter (m) based on ensuring the flare plume height is
equivalent to that associated with a conventional stack. • An ambient temperature of 288 K. Regardless of the meteorological
conditions, the user has to use this ambient temperature when using the Point option for a flare stack.
• The SO2 emission rate (g/s). For the regulatory purposes, the combustion conversion is assumed to be 100% and the radiation heat loss is assumed to be 25%.
Non-combustion Sources
A non-combustion gas stream vented to the atmosphere tends to be near ambient temperature and/or at a low velocity. As a consequence a non-combustion release will experience minimal benefits of plume rise. For the purposes of this guideline, the primary pollutant of interest is H2S that is contained in the solution gas.
Heater-treater Off Gas
During a process upset condition, the treater gas may be vented directly to the atmosphere without the benefit of combustion. This will result in the following:
• The pollutant of interest being H2S since none of the H2S will be converted to SO2.
• Minimal plume rise. Nonetheless, the Point source characterization parameters for this case will be required. It should be noted that the volume and composition of the gas that is flashed from the heater-treater may not be the same as that derived from upstream solution gas sampling or gas-to-oil ratios. The composition and release rate can be determined from process simulation models.
Tank Vents
Residual solution gas will be released from the oil in the oil product tank and to a lesser extent, from the water in the water storage tank. There are also facilities where excess treater gas is directed to the oil product tank. The solution gas in the respective tank headspaces can be assumed to be in equilibrium with the tank liquid. For facilities without a vapour recovery system, the headspace gas is released to the atmosphere when:
• The tank is filling which will force the gas out the vent by

Project 02-215W 19 RWDI West Inc.
displacement. • The exterior of the tank is heated due to solar radiation during the
day, causing the gas in the headspace to expand.
When the tank is being drained or during the night, the tank will be entraining ambient air into the headspace. The composition of the gas in the headspace will differ from that of the solution gas and can be determined by process simulation models.
In terms of initial dispersion, the emissions from the tank vents will differ from those associated with a Point source for two reasons:
• The tank gases will not benefit from any significant plume rise
since they will be released at near ambient temperature and the exit velocity will be extremely low.
• The tank structure can potentially create a turbulent wake downwind which can entrain the released gases.
For facilities with a vapour recovery system, the tank vapours are collected and used as process gas and/or directed to the flare.
Local Aerodynamic Effects
Local aerodynamic effects may have adverse influences on the plume rise and dispersion. Specifically:
• For high wind speed, low exit velocity conditions, the plume can be
partially entrained into a low-pressure wake that develops in the lee of the stack.
• Under certain atmospheric conditions, a building wake cavity can be produced downwind of a building. A plume can be entrained into this wake cavity resulting in localized high concentrations. Even if the plume escapes entrainment into the cavity, the cavity
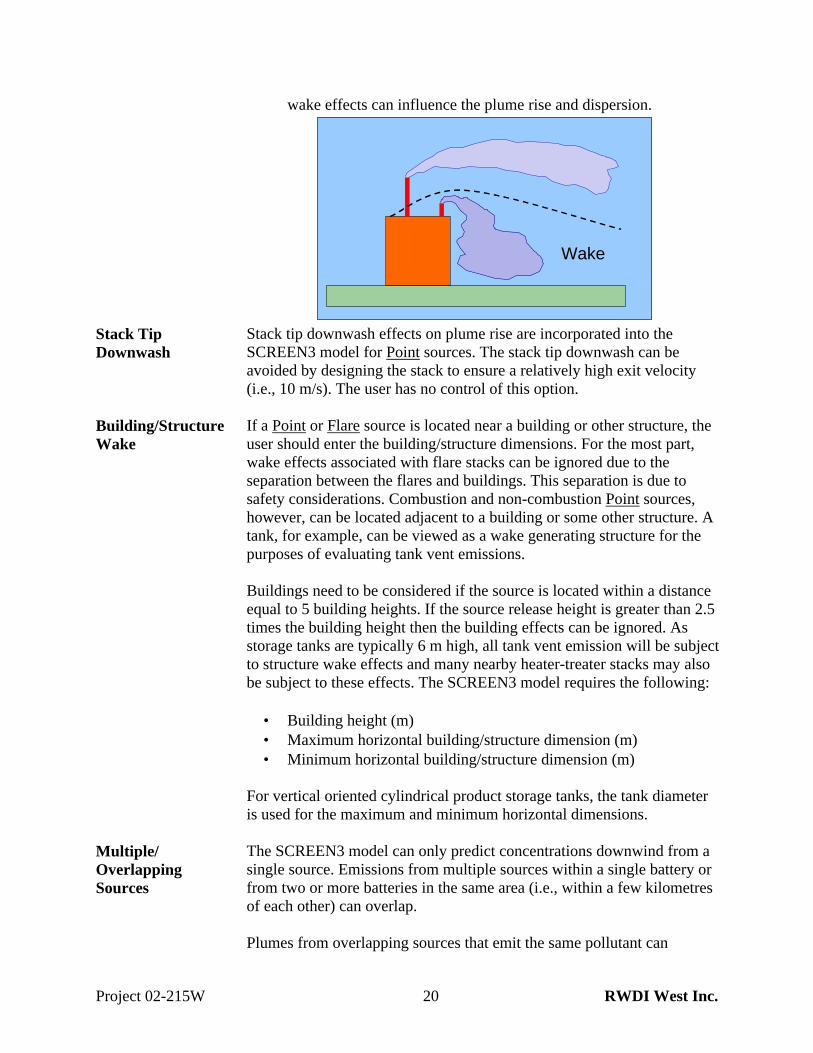
Project 02-215W 20 RWDI West Inc.
wake effects can influence the plume rise and dispersion.
WakeWake
Stack Tip Downwash
Stack tip downwash effects on plume rise are incorporated into the SCREEN3 model for Point sources. The stack tip downwash can be avoided by designing the stack to ensure a relatively high exit velocity (i.e., 10 m/s). The user has no control of this option.
Building/Structure Wake
If a Point or Flare source is located near a building or other structure, the user should enter the building/structure dimensions. For the most part, wake effects associated with flare stacks can be ignored due to the separation between the flares and buildings. This separation is due to safety considerations. Combustion and non-combustion Point sources, however, can be located adjacent to a building or some other structure. A tank, for example, can be viewed as a wake generating structure for the purposes of evaluating tank vent emissions. Buildings need to be considered if the source is located within a distance equal to 5 building heights. If the source release height is greater than 2.5 times the building height then the building effects can be ignored. As storage tanks are typically 6 m high, all tank vent emission will be subject to structure wake effects and many nearby heater-treater stacks may also be subject to these effects. The SCREEN3 model requires the following:
• Building height (m) • Maximum horizontal building/structure dimension (m) • Minimum horizontal building/structure dimension (m)
For vertical oriented cylindrical product storage tanks, the tank diameter is used for the maximum and minimum horizontal dimensions.
Multiple/ Overlapping Sources
The SCREEN3 model can only predict concentrations downwind from a single source. Emissions from multiple sources within a single battery or from two or more batteries in the same area (i.e., within a few kilometres of each other) can overlap. Plumes from overlapping sources that emit the same pollutant can

Project 02-215W 21 RWDI West Inc.
combine to produce ambient concentrations that are greater than those resulting from a single source. While multiple source dispersion models such as ISCST3, AERMOD or CALPUFF can handle overlapping plumes rigorously, the SCREEN3 model can be used to provide a first order estimate. The more rigorous models account for the source separation distances and the alignment due to site-specific winds.
Overlapping Method 1
The simplest method is to run the full meteorology option for each source and add the individual maximum predicted concentrations to determine a combined maximum value. This approach assumes the sources are similar in nature and are collocated. As the maximum predicted value for each source is often associated with a unique meteorological condition, the individual maxima may not occur with the same condition. As a consequence, the sum will be conservative in that the individual maxima may not occur at the same time.
Overlapping Method 2
Sources that emit the same pollutant from several stacks in a common facility (e.g., a heater-treater stack and a flare stack) can be analysed by assuming all the emissions originate from a single representative stack. For each stack compute the parameter M:
P(g/s)(K)T /s)(mQ (m)H
M s3
ss=
where: Hs = stack height (m) Qs = stack gas volumetric flow rate at stack conditions (m3/s) Ts = stack gas exit temperature (K) P = pollutant flow rate (g/s) The parameter M accounts for the relative importance of the plume height and the emissions rate. The stack that has the lowest parameter M is used as the representative stack. Specifically, the stack height, diameter, exit velocity and exit temperature for the stack with the lowest M value is used as input into the SCREEN3 model. The pollutant flow rate for the SCREEN3 model is taken as follows:
P = P1 + P2 + …Pn
which is the sum of all pollutant flow rates for all the individual stacks. The above approach essentially assumes that the pollutant flow rates for the representative stack are additive and that the physical and plume rise parameters are associated with the source with the lowest expected plume height. This conservative assumption will overstate the predicted values.
Overlapping The above approaches are likely to be extremely conservative for

Project 02-215W 22 RWDI West Inc.
Comment dissimilar stacks and if the sources are located more than 100 m apart. In this case, a more rigorous multiple source dispersion model such as ISCST3, AERMOD or CALPUFF would be more appropriate.
Volume to Mass Conversion
Many gas process calculations and measurements are undertaken on a volumetric basis (e.g., m3/d, m3/s). To be meaningful, a volumetric flow rate has to be referenced to a temperature and a pressure. The normal temperature and pressure (NTP) reference values used by the oil and gas industry are 15 °C (288.15 K) and 101.325 kPa (1 atmosphere). This compares to the standard temperature and pressure (STP) of 0 °C (273.15 K) and 101.325 kPa. By knowing the inlet oil flow rate (X), the gas-to-oil ratio (Y) and the fraction of H2S in the solution gas (Z); the inlet H2S, expressed on a volumetric basis (W), is:
=
s 3600
hh 24
dgasm
SHm oilmgasm
doilm
sSHm
32
3
3
332
3 ZYXW
The corresponding H2S mass flow rate can be calculated from knowing the molar mass (34.082 kg/kmole) and the molar volume (22.414 m3/kmole at STP) for H2S:
=
K288.15 K273.15
kgg 1000
SHm 22.414kmole
kmolekg 34.082
sSHm
(g/s) SH2
32
3
2
W
The temperature ratio converts the molar volume of 22.414 m3/kmole at 0°C to 15 °C. Because 1 kmole of H2S produces 1 kmole of SO2, the corresponding SO2 emission rate is:
=
K288.15 K273.15
kgg 1000
SHm 22.414kmole
kmolekg 64.065
sSHm
(g/s) SO2
32
3
2
W
where 64.065 kg/kmole is the molar mass for SO2.

Project 02-215W 23 RWDI West Inc.
4 METEOROLOGY
Meteorology Background
SCREEN3 is based on a Gaussian plume dispersion model as depicted in the following figure:
Features of this model are as follows:
• The wind direction is assumed to be uniform in space and time.
The location of the plume centreline is determined by a single wind direction, convention has the wind along the x-axis. The maximum ground-level concentration occurs directly below the plume centreline (or y = 0 m).
• The model considers a wide range of wind speeds from 1 to
20 m/s (3.6 to 72 km/h). In order to calculate plume rise and along wind dilution, winds are assumed to increase with increasing height above the ground.
• The crosswind concentration profile is assumed to be symmetrical
about the centreline and follow a “Gaussian” or “Normal” distribution. The standard deviation (σ) is a measure of the spread of this distribution. The associated crosswind plume spread is referred to as σY or “sigma-Y”.
• The vertical concentration profile is also assumed to be
symmetrical about the centreline and follow a Gaussian distribution. The standard deviation of the vertical spread is referred to as σZ or “sigma-Z”.

Project 02-215W 24 RWDI West Inc.
-4 -3 -2 -1 0 1 2 3 4
Y-σY-2σY σY 2σY-3σY 3σY
-4 -3 -2 -1 0 1 2 3 4
Y-σY-2σY σY 2σY-3σY 3σY
• The plume spreads (σy and σZ) can be enhanced or suppressed by increased or decreased levels of atmospheric turbulence, respectively. Mechanical and thermal processes can generate turbulence. Mechanical turbulence is related to wind speed. Thermal turbulence is related to solar intensity.
• For the purpose of dispersion modeling, meteorologists have
defined six levels of atmospheric turbulence, referred to as Pasquill-Gifford (PG) stability classes: − PG classes A, B and C (sometimes referred to as PG classes
1, 2 and 3) are associated with enhanced turbulence caused by daytime heating and are referred to as unstable conditions.
− PG class D (sometimes referred to as PG class 4) is associated with mechanically generated turbulence (i.e. high wind speeds) or overcast conditions (i.e., no heating or cooling). This is referred to as neutral conditions.
− PG classes E and F (sometimes referred to as PG classes 5 and 6) are associated with suppressed turbulence caused by nighttime cooling and are referred to as stable conditions.
Based on an Environment Canada analysis of meteorological data from Estevan Airport (Saskatchewan), PG classes occur with the following frequencies on an annual basis: Stability Unstable Neutral Stable
Class A B C D E F % 0.3 4.3 9.3 59.4 14.8 11.9 % 13.9 59.4 26.7

Project 02-215W 25 RWDI West Inc.
Large σY and σZ values are associated with unstable conditions and
small σY and σZ values are associated with stable conditions. Values of σY and σZ increase with increasing downwind distance as follows:
1
10
100
1000
10000
0.1 1 10 100
Downwind Distance (km)
Sig
ma
Y (m
)
A
F
1
10
100
1000
10000
0.1 1 10 100
Downwind Distance (km)
Sig
ma
Z (
m)
F
A
The relationships depicted in the above figures are incorporated into the SCREEN3 Dispersion Model.
Wind Direction The SCREEN3 model calculates maximum concentrations directly
below the plume centreline. Specifically, the location where the concentrations are calculated are assumed to be directly downwind of the emission source. On this basis, the SCREEN3 model does not require wind direction information.

Project 02-215W 26 RWDI West Inc.
Wind Speed and Stability Class
The wind speeds that are normally measured at height of 10 m are adjusted to plume height by SCREEN3 using a wind profile power law.
Below 10 m, the winds speeds are assumed to be equal to the 10 m level value.
The SCREEN3 model considers the range of wind speed, PG stability class concentrations depicted in the following matrix:
10-m Wind Speed (m/s) PG Class 1.0 1.5 2.0 2.5 3.0 3.5 4.0 4.5 5.0 8.0 10.0 15.0 20.0
A ü ü ü ü ü
B ü ü ü ü ü ü ü ü ü
C ü ü ü ü ü ü ü ü ü ü ü
D ü ü ü ü ü ü ü ü ü ü ü ü ü
E ü ü ü ü ü ü ü ü ü
F ü ü ü ü ü ü ü
The user for has three options related to the wind speed PG class matrix given in the table:
• The Full Meteorology option considers all the meteorological
combinations depicted in the matrix for each downwind distance. SCREEN3 only prints out the maximum concentration and associated conditions for each distance.
• The Single Stability Class option considers the range of wind speeds for the specified stability class (i.e., one of A through F). SCREEN3 only prints out the maximum concentration and associated conditions for each distance.

Project 02-215W 27 RWDI West Inc.
• The Single Stability Class and Wind Speed option considers one specified stability class and wind speed combination. The wind speed for each stability class has to be within the respective range indicated in the matrix.
Generally, the Full Meteorology option should be selected. The other two options may be used if specific meteorology conditions are of interest.
Mixing Height
For unlimited mixing, atmospheric turbulence causes the plume to spread above and below the plume centreline:
Unlimited MixingUnlimited Mixing
A limited mixing layer can be generated by thermal turbulence, which is determined by solar intensity or by mechanical turbulence, which is proportional to wind speed. A temperature inversion above the limited mixing layer prevents the vertical plume spread above this mixing layer, producing larger ambient concentrations:
Plume Trapping
Mixing Layer
Plume Trapping
Mixing Layer
Plume Trapping
Mixing Layer
Project 02-215W 28 RWDI West Inc.
The SCREEN3 model assumes the following:
• Only mechanical mixing heights are assumed • The mechanical mixing height (m) is assumed to be 320 times the
wind speed (m/s). • If the mechanical mixing height is less than the plume height, the
mixing height is taken as the plume height plus 1m. • Unlimited mixing is assumed for stable conditions.
The SCREEN3 user has no control for the selection of the mixing height.
Fumigation Fumigation is a general term to describe the rapid mixing of an elevated
concentrated plume on the ground. Two fumigation options can occur:
• Inversion Break-Up Fumigation. A ground-based inversion is assumed to occur prior to sunrise with the plume dispersing in the stable layer. After sunrise, a well-mixed layer increases in thickness. When this mixed layer reaches the plume, the plume is rapidly mixed to the ground resulting in relatively high, short-term concentrations.
• Shoreline Fumigation. Stable on-shore airflow can be associated
with large water bodies. The stable airflow is modified as it is transported over the land producing a well-mixed boundary layer. When a stable plume intersects the well-mixed layer, it can be rapidly mixed to the ground resulting in relatively high, short-term concentrations.
The SCREEN3 model will only consider fumigation for Point and Flare sources when the stack heights are greater then 10 m and Rural dispersion is assumed.
No user-specified inputs are required for the Inversion Breakup Fumigation option. The Shoreline Fumigation option should be selected if the emission source is within 3 km of a large water body. The user is required to provide the minimum distance between the source and the water body.
Rural and Urban Dispersion
Dispersion over urban areas will differ from that over rural areas for the following reasons:
• The increased roughness and mechanically generated turbulence
associated with urban areas will moderate extreme stability
Project 02-215W 29 RWDI West Inc.
conditions. • The heat capacity of the urban facilities (e.g., buildings and
roadways) will moderate the extreme heating and cooling compared to adjacent rural areas.
Due to the above-indicated effects, dispersion associated with Stability classes A and F will not occur in urban areas. The SCREEN3 user will be required to select either Rural or Urban dispersion. The appropriate classification will depend on the land use within 3 km of the source as follows:
• If industrial, commercial or residential land use exceeds 50%, use
the Urban dispersion option. • If population density is greater than 750 people/km2, use the
Urban dispersion option.
In selecting the dispersion option, priority should be given to the land use description rather than the population. The Urban dispersion option should be used for forest areas due to the increased roughness.
Ambient Temperature
The rise of a hot buoyant plume is proportional to the difference between the stack exit temperature and the ambient air temperature. The smaller the difference (i.e., as would occur during the summer), the smaller the plume rise and the more conservative the predicted concentrations. When using SCREEN3, the following temperatures should be selected:
• Use 288 K for all flare stack calculations due to the manner the plume rise is calculated.
• Use the default temperature of 293 K for all other sources when using the Full Meteorology option.
• Use the temperature representative of the specific meteorological conditions when using the Single Stability Class option or the Single Stability Class and Wind Speed option.

Project 02-215W 30 RWDI West Inc.
5 RECEPTORS AND TERRAIN
Terrain Types The model considers the potential for terrain to increase the ambient concentrations by considering a modified plume trajectory that forces the plume to approach, and in the extreme impinge on the terrain feature. The SCREEN3 model considers three terrain types:
FlatSimple ComplexFlatSimple Complex
• The Flat terrain option assumes that the airflow is parallel to the terrain for all sources.
• The Simple terrain option is for terrain heights that are greater than the stack base and are less than stack height. Not available for Area sources.
• The Complex terrain option is for terrain that exceeds the stack height. For Point and Flare sources only.
Flat Terrain Flat terrain or parallel airflow can generally be assumed for areas
that are flat, or for areas with a gentle slope (e.g., less than 5% or 50 m rise/1000 m distance) and no abrupt terrain features. Flat terrain is selected when the user responds to the “Simple terrain above stack base” input prompt with “No”. For flat terrain, the user can specify an Automated distance array by specifying minimum and maximum distances. The following distances are considered with the array:
• 100 m increments between 100 and 3000 m (30 distances). • 500 m increments between 3 and 10 km (14 distances). • 5 km increments between 10 and 30 km (4 distances). • 10 km increments between 30 and 50 km (2 distances).
The model will also iterate to determine the maximum value to the nearest meter. The minimum distance should correspond to plant fence line. The largest value allowed is 50 km.

Project 02-215W 31 RWDI West Inc.
The Discrete receptor option corresponding to specific residences or to provide a better resolution near the source can be selected. For example, this option can be used to determine the concentration at a residence located 3200 m downwind, or to determine the concentrations from 10 to 200 m in 10 m increments.
Simple Terrain For the Simple receptor option, the height of the plume above the ground is decreased by the height of the terrain. This has the effect of bringing the plume closer to the ground and increasing the predicted concentrations relative to the flat terrain assumption.
Complex Terrain For Complex receptor option, the model predicts maximum 24-h average concentrations using two methods: • The US EPA VALLEY model approach assumes stability class
F conditions with a wind speed of 2.5 m/s:
VALLEY AssumptionVALLEY Assumption
The associated 1-h concentration can be obtained by multiplying the VALLEY 24-h prediction by a factor of 4.
• A Simple terrain approach that assumes the terrain is truncated or chopped off at the physical stack height and full meteorology conditions:

Project 02-215W 32 RWDI West Inc.
Simple Terrain Assumption
Truncated Terrain
Simple Terrain Assumption
Truncated Terrain
The associated 1-h concentration can be obtained by multiplying the simple terrain, 24-h prediction by a factor of 2.5.
The complex terrain prediction is taken as the maximum of these two methods. The appropriate multiplier must be applied to compare to the 1-h ambient criteria. The user does not have any control over the meteorology option for complex terrain. The model user is required to provide the terrain elevation above stack base and the associated downwind distance for as many downwind distance combinations as required.

Project 02-215W 33 RWDI West Inc.
6 OUTPUT INTERPRETATION
Averaging Period The US EPA dispersion coefficients incorporated into the SCREEN3 model are assumed by the US EPA to represent one-hour average concentrations. This allows the dispersion model predictions to be compared directly to the one-hour average maximum ambient concentration criteria. For Complex terrain, the model predicts 24-hour averages. These can be adjusted to a 1-hour average using the adjustment factors given in the previous section.
Averaging Periods Longer than One Hour
The maximum predicted one-hour average concentrations can be used to estimate maximum concentrations for longer averaging periods. The SCREEN guide recommends the following “general case” multiplication conversion factors:
While the values provided are intended as a rough guide, the smaller factors (within the range) are more applicable to tall stacks and/or flat terrain and the larger factors (within the range) are more applicable to short stacks and/or complex terrain locations.
Averaging Period Multiplication Factor
1-h 1.0
3-h 0.9 ± 0.1
8-h 0.7 ± 0.2
24-h 0.4 ± 0.2
Annual 0.08 ± 0.02
Peak-To-Mean Ratio The models are designed to predict one-hour average concentrations. Over the one-hour period, concentrations can vary considerably, sometimes being less than the mean and other times exceeding the mean. Short-term (i.e., 5 minutes) concentrations in excess of an odour threshold may occur when the one-hour average is within an acceptable range.
For this reason, an understanding of peak concentrations may be of interest when dealing with pollutants that have an odour potential (i.e., H2S). A peak-to-mean ratio concept has been adopted to address this situation. As a rough guide a peak-to-mean value of 5 is recommended.

Project 02-215W 34 RWDI West Inc.
7 REGULATORY SUBMISSION
Submission Requirements
The clear communication of information between industry and regulatory staff will help expedite the review and approval process. From an air quality perspective, the following information will help the process: (1) Identification and Contact Information. Name and address of applicant. Contact person, telephone number and e-mail address. Battery Name and Permit No. (existing batteries). Type of application: New, Amendment (2) Facility Information Description of application request. Facility plot plan identifying emission sources. Inlet oil flow rate. Inlet gas to oil ratio. Composition of solution gas. (3) Emission Information For a flare stack: Stack height Stack diameter Volume of gas to flare Heat content of gas to flare SO2 emission rate For a heater-treater stack: Stack height Stack diameter Stack gas exit velocity Stack gas exit temperature SO2 emission rate Building/Structure height (if applicable) Building/Structure length (if applicable) Building/Structure width (if applicable) For a heater-treater upset event:
If a significant volume of gas will be vented in the event of a treater upset, the operator should model these emissions. In his case, the following are required: Stack height
Stack diameter

Project 02-215W 35 RWDI West Inc.
Stack gas exit velocity Stack gas exit temperature H2S emission rate Building/Structure height (if applicable) Building/Structure length (if applicable) Building/Structure width (if applicable) For a tank vent: Tank product Vent height Vent diameter Vent gas exit velocity Vent gas exit temperature H2S emission rate Tank height Tank diameter Description of the facility air pollution control practises. Rational for the selection or absence of pollution control practices (i.e., vapour recovery). (4) Ambient Predictions Maximum predicted H2S and SO2 concentrations associated with the facility. Description of modelling assumptions and supporting spreadsheet and SCREEN3 model output. Does facility meet ambient concentration criteria? If not, where are exceedances expected? What control actions and what timeline will be applied to be in compliance? Identification of public information program.

Project 02-215W 36 RWDI West Inc.
8 EXAMPLES
Input Cases: The following HEATER-TREATER examples are provided: Case Case 1 Case 2 Case 3 Case 4 Stack height (m) 6.1 6.1 6.1 6.1
Stack diameter (m) 0.30 0.30 0.30 0.30 Stack gas exit velocity (m/s) 2.5 2.5 2.5 2.5
Stack gas exit temperature (K) 573 573 573 573 SO2 emission rate (g/s) 0.5 0.5 0.5 0.5
Building/Structure height (m) 0.0 0.0 0.0 4.0 Building/Structure length (m) 0.0 0.0 0.0 3.0 Building/Structure width (m) 0.0 0.0 0.0 6.0 Meteorology Full Full Full Full
Ambient Temperature (K) 293 293 293 293 Dispersion Rural Urban Rural Rural
Minimum/Maximum Distances (m) 100 50000
100 50000
10 200
100 50000
Terrain Flat Flat Flat Flat Input values that have changed from the Base Case (Case 1) are shown in boldface text.
Interpretation: Case Case 1 Case 2 Case 3 Case 4
Maximum SO2 (µg/m3) 357.7 431.3 359.3 515.0
Downwind distance (m) 100 100 110 100
PG Stability Class C (3) D (4) C (3) D (4) 10-m Wind Speed (m/s) 1.5 1.0 1.5 2.0 Mixing Height (m) 480 320 480 640
Building Cavity SO2 (µg/m3) - - - 11710
Distance to Cavity Maximum (m) - - - 10 Input values that have changed from the Base Case (Case 1) are shown in boldface text.

Project 02-215W 37 RWDI West Inc.
02/03/02 20:03:49 *** SCREEN3 MODEL RUN *** *** VERSION DATED 96043 *** Heater-treater Stack SO2 Case 1 SIMPLE TERRAIN INPUTS: SOURCE TYPE = POINT EMISSION RATE (G/S) = .500000 STACK HEIGHT (M) = 6.1000 STK INSIDE DIAM (M) = .3000 STK EXIT VELOCITY (M/S)= 2.5000 STK GAS EXIT TEMP (K) = 573.0000 AMBIENT AIR TEMP (K) = 293.0000 RECEPTOR HEIGHT (M) = .0000 URBAN/RURAL OPTION = RURAL BUILDING HEIGHT (M) = .0000 MIN HORIZ BLDG DIM (M) = .0000 MAX HORIZ BLDG DIM (M) = .0000 THE REGULATORY (DEFAULT) MIXING HEIGHT OPTION WAS SELECTED. THE REGULATORY (DEFAULT) ANEMOMETER HEIGHT OF 10.0 METERS WAS ENTERED. BUOY. FLUX = .270 M**4/S**3; MOM. FLUX = .072 M**4/S**2. *** FULL METEOROLOGY *** ********************************** *** SCREEN AUTOMATED DISTANCES *** ********************************** *** TERRAIN HEIGHT OF 0. M ABOVE STACK BASE USED FOR FOLLOWING DISTANCES *** DIST CONC U10M USTK MIX HT PLUME SIGMA SIGMA (M) (UG/M**3) STAB (M/S) (M/S) (M) HT (M) Y (M) Z (M) DWASH ------- ---------- ---- ----- ----- ------ ------ ------ ------ ----- 100. 357.7 3 1.5 1.5 480.0 11.44 12.56 7.60 NO 200. 326.5 4 1.5 1.5 480.0 11.44 15.64 8.64 NO 300. 294.8 4 1.0 1.0 320.0 14.11 22.73 12.31 NO 400. 229.7 4 1.0 1.0 320.0 14.11 29.54 15.44 NO 500. 177.8 4 1.0 1.0 320.0 14.11 36.22 18.44 NO 600. 140.1 4 1.0 1.0 320.0 14.11 42.78 21.33 NO 700. 112.8 4 1.0 1.0 320.0 14.11 49.24 24.14 NO 800. 101.1 6 1.0 1.0 10000.0 22.03 28.01 12.81 NO 900. 103.1 6 1.0 1.0 10000.0 22.03 31.11 13.76 NO 1000. 102.8 6 1.0 1.0 10000.0 22.03 34.19 14.68 NO 1100. 100.4 6 1.0 1.0 10000.0 22.03 37.24 15.50 NO 1200. 97.28 6 1.0 1.0 10000.0 22.03 40.27 16.31 NO 1300. 93.72 6 1.0 1.0 10000.0 22.03 43.28 17.09 NO 1400. 89.96 6 1.0 1.0 10000.0 22.03 46.27 17.85 NO 1500. 86.15 6 1.0 1.0 10000.0 22.03 49.24 18.60 NO 1600. 82.38 6 1.0 1.0 10000.0 22.03 52.19 19.33 NO 1700. 78.72 6 1.0 1.0 10000.0 22.03 55.13 20.04 NO 1800. 75.19 6 1.0 1.0 10000.0 22.03 58.05 20.74 NO 1900. 71.83 6 1.0 1.0 10000.0 22.03 60.95 21.43 NO 2000. 68.63 6 1.0 1.0 10000.0 22.03 63.84 22.10 NO 2100. 65.62 6 1.0 1.0 10000.0 22.03 66.71 22.67 NO 2200. 62.80 6 1.0 1.0 10000.0 22.03 69.57 23.23 NO 2300. 60.16 6 1.0 1.0 10000.0 22.03 72.42 23.78 NO 2400. 57.69 6 1.0 1.0 10000.0 22.03 75.26 24.32 NO 2500. 55.37 6 1.0 1.0 10000.0 22.03 78.08 24.85 NO 2600. 53.19 6 1.0 1.0 10000.0 22.03 80.89 25.36 NO 2700. 51.15 6 1.0 1.0 10000.0 22.03 83.69 25.87 NO 2800. 49.22 6 1.0 1.0 10000.0 22.03 86.48 26.38 NO 2900. 47.41 6 1.0 1.0 10000.0 22.03 89.27 26.87 NO 3000. 45.70 6 1.0 1.0 10000.0 22.03 92.04 27.36 NO 3500. 38.70 6 1.0 1.0 10000.0 22.03 105.75 29.34 NO 4000. 33.35 6 1.0 1.0 10000.0 22.03 119.26 31.17 NO 4500. 29.16 6 1.0 1.0 10000.0 22.03 132.58 32.89 NO

Project 02-215W 38 RWDI West Inc.
5000. 25.81 6 1.0 1.0 10000.0 22.03 145.74 34.51 NO 5500. 23.07 6 1.0 1.0 10000.0 22.03 158.76 36.05 NO 6000. 20.80 6 1.0 1.0 10000.0 22.03 171.64 37.51 NO 6500. 18.90 6 1.0 1.0 10000.0 22.03 184.40 38.91 NO 7000. 17.27 6 1.0 1.0 10000.0 22.03 197.05 40.26 NO 7500. 15.92 6 1.0 1.0 10000.0 22.03 209.59 41.41 NO 8000. 14.74 6 1.0 1.0 10000.0 22.03 222.03 42.53 NO 8500. 13.71 6 1.0 1.0 10000.0 22.03 234.38 43.60 NO 9000. 12.80 6 1.0 1.0 10000.0 22.03 246.65 44.63 NO 9500. 11.99 6 1.0 1.0 10000.0 22.03 258.83 45.63 NO 10000. 11.27 6 1.0 1.0 10000.0 22.03 270.94 46.61 NO 15000. 6.867 6 1.0 1.0 10000.0 22.03 388.45 55.07 NO 20000. 4.917 6 1.0 1.0 10000.0 22.03 500.97 60.47 NO 25000. 3.791 6 1.0 1.0 10000.0 22.03 609.77 65.02 NO 30000. 3.064 6 1.0 1.0 10000.0 22.03 715.60 68.99 NO 40000. 2.219 6 1.0 1.0 10000.0 22.03 920.23 74.63 NO 50000. 1.728 6 1.0 1.0 10000.0 22.03 1117.43 79.32 NO MAXIMUM 1-HR CONCENTRATION AT OR BEYOND 100. M: 100. 357.7 3 1.5 1.5 480.0 11.44 12.56 7.60 NO DWASH= MEANS NO CALC MADE (CONC = 0.0) DWASH=NO MEANS NO BUILDING DOWNWASH USED DWASH=HS MEANS HUBER-SNYDER DOWNWASH USED DWASH=SS MEANS SCHULMAN-SCIRE DOWNWASH USED DWASH=NA MEANS DOWNWASH NOT APPLICABLE, X<3*LB *************************************** *** SUMMARY OF SCREEN MODEL RESULTS *** *************************************** CALCULATION MAX CONC DIST TO TERRAIN PROCEDURE (UG/M**3) MAX (M) HT (M) -------------- ----------- ------- ------- SIMPLE TERRAIN 357.7 100. 0. *************************************************** ** REMEMBER TO INCLUDE BACKGROUND CONCENTRATIONS ** ***************************************************

Project 02-215W 39 RWDI West Inc.
02/03/02 20:04:44 *** SCREEN3 MODEL RUN *** *** VERSION DATED 96043 *** Heater-treater Stack SO2 Case 2 SIMPLE TERRAIN INPUTS: SOURCE TYPE = POINT EMISSION RATE (G/S) = .500000 STACK HEIGHT (M) = 6.1000 STK INSIDE DIAM (M) = .3000 STK EXIT VELOCITY (M/S)= 2.5000 STK GAS EXIT TEMP (K) = 573.0000 AMBIENT AIR TEMP (K) = 293.0000 RECEPTOR HEIGHT (M) = .0000 URBAN/RURAL OPTION = URBAN BUILDING HEIGHT (M) = .0000 MIN HORIZ BLDG DIM (M) = .0000 MAX HORIZ BLDG DIM (M) = .0000 THE REGULATORY (DEFAULT) MIXING HEIGHT OPTION WAS SELECTED. THE REGULATORY (DEFAULT) ANEMOMETER HEIGHT OF 10.0 METERS WAS ENTERED. BUOY. FLUX = .270 M**4/S**3; MOM. FLUX = .072 M**4/S**2. *** FULL METEOROLOGY *** ********************************** *** SCREEN AUTOMATED DISTANCES *** ********************************** *** TERRAIN HEIGHT OF 0. M ABOVE STACK BASE USED FOR FOLLOWING DISTANCES *** DIST CONC U10M USTK MIX HT PLUME SIGMA SIGMA (M) (UG/M**3) STAB (M/S) (M/S) (M) HT (M) Y (M) Z (M) DWASH ------- ---------- ---- ----- ----- ------ ------ ------ ------ ----- 100. 431.3 4 1.0 1.0 320.0 14.11 15.86 13.98 NO 200. 165.2 4 1.0 1.0 320.0 14.11 30.88 27.29 NO 300. 138.2 6 1.0 1.0 10000.0 22.03 31.51 20.44 NO 400. 104.3 6 1.0 1.0 10000.0 22.03 41.11 25.70 NO 500. 79.64 6 1.0 1.0 10000.0 22.03 50.41 30.58 NO 600. 62.62 6 1.0 1.0 10000.0 22.03 59.44 35.12 NO 700. 50.67 6 1.0 1.0 10000.0 22.03 68.21 39.38 NO 800. 42.02 6 1.0 1.0 10000.0 22.03 76.73 43.39 NO 900. 35.58 6 1.0 1.0 10000.0 22.03 85.01 47.19 NO 1000. 30.64 6 1.0 1.0 10000.0 22.03 93.08 50.80 NO 1100. 26.76 6 1.0 1.0 10000.0 22.03 100.94 54.25 NO 1200. 23.67 6 1.0 1.0 10000.0 22.03 108.60 57.55 NO 1300. 21.14 6 1.0 1.0 10000.0 22.03 116.08 60.72 NO 1400. 19.05 6 1.0 1.0 10000.0 22.03 123.38 63.77 NO 1500. 17.31 6 1.0 1.0 10000.0 22.03 130.52 66.72 NO 1600. 15.82 6 1.0 1.0 10000.0 22.03 137.51 69.57 NO 1700. 14.55 6 1.0 1.0 10000.0 22.03 144.35 72.32 NO 1800. 13.46 6 1.0 1.0 10000.0 22.03 151.04 75.00 NO 1900. 12.50 6 1.0 1.0 10000.0 22.03 157.61 77.60 NO 2000. 11.66 6 1.0 1.0 10000.0 22.03 164.04 80.13 NO 2100. 10.92 6 1.0 1.0 10000.0 22.03 170.36 82.59 NO 2200. 10.26 6 1.0 1.0 10000.0 22.03 176.56 85.00 NO 2300. 9.664 6 1.0 1.0 10000.0 22.03 182.64 87.34 NO 2400. 9.133 6 1.0 1.0 10000.0 22.03 188.63 89.64 NO 2500. 8.653 6 1.0 1.0 10000.0 22.03 194.51 91.88 NO 2600. 8.218 6 1.0 1.0 10000.0 22.03 200.29 94.08 NO 2700. 7.822 6 1.0 1.0 10000.0 22.03 205.98 96.23 NO 2800. 7.460 6 1.0 1.0 10000.0 22.03 211.58 98.34 NO 2900. 7.128 6 1.0 1.0 10000.0 22.03 217.10 100.41 NO 3000. 6.822 6 1.0 1.0 10000.0 22.03 222.53 102.44 NO 3500. 5.603 6 1.0 1.0 10000.0 22.03 248.56 112.09 NO 4000. 4.739 6 1.0 1.0 10000.0 22.03 272.91 121.03 NO 4500. 4.098 6 1.0 1.0 10000.0 22.03 295.85 129.40 NO

Project 02-215W 40 RWDI West Inc.
5000. 3.604 6 1.0 1.0 10000.0 22.03 317.58 137.27 NO 5500. 3.213 6 1.0 1.0 10000.0 22.03 338.24 144.74 NO 6000. 2.897 6 1.0 1.0 10000.0 22.03 357.96 151.86 NO 6500. 2.636 6 1.0 1.0 10000.0 22.03 376.87 158.66 NO 7000. 2.417 6 1.0 1.0 10000.0 22.03 395.03 165.20 NO 7500. 2.231 6 1.0 1.0 10000.0 22.03 412.53 171.49 NO 8000. 2.071 6 1.0 1.0 10000.0 22.03 429.42 177.56 NO 8500. 1.932 6 1.0 1.0 10000.0 22.03 445.77 183.44 NO 9000. 1.811 6 1.0 1.0 10000.0 22.03 461.61 189.14 NO 9500. 1.703 6 1.0 1.0 10000.0 22.03 477.00 194.67 NO 10000. 1.607 6 1.0 1.0 10000.0 22.03 491.96 200.05 NO 15000. 1.027 6 1.0 1.0 10000.0 22.03 623.66 247.58 NO 20000. .7529 6 1.0 1.0 10000.0 22.03 733.35 287.40 NO 25000. .5940 6 1.0 1.0 10000.0 22.03 829.17 322.36 NO 30000. .4904 6 1.0 1.0 10000.0 22.03 915.27 353.89 NO 40000. .4016 4 1.0 1.0 320.0 14.11 1552.23 1553.16 NO 50000. .3571 4 1.0 1.0 320.0 14.11 1745.74 1750.00 NO MAXIMUM 1-HR CONCENTRATION AT OR BEYOND 100. M: 100. 431.3 4 1.0 1.0 320.0 14.11 15.86 13.98 NO DWASH= MEANS NO CALC MADE (CONC = 0.0) DWASH=NO MEANS NO BUILDING DOWNWASH USED DWASH=HS MEANS HUBER-SNYDER DOWNWASH USED DWASH=SS MEANS SCHULMAN-SCIRE DOWNWASH USED DWASH=NA MEANS DOWNWASH NOT APPLICABLE, X<3*LB *************************************** *** SUMMARY OF SCREEN MODEL RESULTS *** *************************************** CALCULATION MAX CONC DIST TO TERRAIN PROCEDURE (UG/M**3) MAX (M) HT (M) -------------- ----------- ------- ------- SIMPLE TERRAIN 431.3 100. 0. *************************************************** ** REMEMBER TO INCLUDE BACKGROUND CONCENTRATIONS ** ***************************************************

Project 02-215W 41 RWDI West Inc.
02/03/02 20:06:21 *** SCREEN3 MODEL RUN *** *** VERSION DATED 96043 *** Heater-treater Stack SO2 Case 3 SIMPLE TERRAIN INPUTS: SOURCE TYPE = POINT EMISSION RATE (G/S) = .500000 STACK HEIGHT (M) = 6.1000 STK INSIDE DIAM (M) = .3000 STK EXIT VELOCITY (M/S)= 2.5000 STK GAS EXIT TEMP (K) = 573.0000 AMBIENT AIR TEMP (K) = 293.0000 RECEPTOR HEIGHT (M) = .0000 URBAN/RURAL OPTION = RURAL BUILDING HEIGHT (M) = .0000 MIN HORIZ BLDG DIM (M) = .0000 MAX HORIZ BLDG DIM (M) = .0000 THE REGULATORY (DEFAULT) MIXING HEIGHT OPTION WAS SELECTED. THE REGULATORY (DEFAULT) ANEMOMETER HEIGHT OF 10.0 METERS WAS ENTERED. BUOY. FLUX = .270 M**4/S**3; MOM. FLUX = .072 M**4/S**2. *** FULL METEOROLOGY *** ********************************* *** SCREEN DISCRETE DISTANCES *** ********************************* *** TERRAIN HEIGHT OF 0. M ABOVE STACK BASE USED FOR FOLLOWING DISTANCES *** DIST CONC U10M USTK MIX HT PLUME SIGMA SIGMA (M) (UG/M**3) STAB (M/S) (M/S) (M) HT (M) Y (M) Z (M) DWASH ------- ---------- ---- ----- ----- ------ ------ ------ ------ ----- 10. .2393E-01 1 3.0 3.0 960.0 8.37 3.39 1.65 NO 20. 75.45 1 3.0 3.0 960.0 8.37 6.33 3.13 NO 30. 233.9 1 3.0 3.0 960.0 8.37 9.11 4.54 NO 40. 287.6 1 2.5 2.5 800.0 9.01 11.81 5.94 NO 50. 306.4 2 2.5 2.5 800.0 9.01 10.28 5.63 NO 60. 323.3 2 2.0 2.0 640.0 9.96 12.14 6.69 NO 70. 330.9 3 2.5 2.5 800.0 9.01 9.01 5.45 NO 80. 347.2 3 2.5 2.5 800.0 9.01 10.18 6.14 NO 90. 355.7 3 2.0 2.0 640.0 9.96 11.36 6.85 NO 100. 357.7 3 1.5 1.5 480.0 11.44 12.56 7.60 NO 110. 359.3 3 1.5 1.5 480.0 11.44 13.70 8.26 NO 120. 352.4 3 1.5 1.5 480.0 11.44 14.83 8.92 NO 130. 356.1 3 1.0 1.0 320.0 14.11 16.04 9.73 NO 140. 354.5 3 1.0 1.0 320.0 14.11 17.16 10.38 NO 150. 348.2 3 1.0 1.0 320.0 14.11 18.26 11.02 NO 160. 338.8 3 1.0 1.0 320.0 14.11 19.37 11.67 NO 170. 329.7 4 1.5 1.5 480.0 11.44 13.48 7.54 NO 180. 331.4 4 1.5 1.5 480.0 11.44 14.20 7.90 NO 190. 330.1 4 1.5 1.5 480.0 11.44 14.92 8.27 NO 200. 326.5 4 1.5 1.5 480.0 11.44 15.64 8.64 NO DWASH= MEANS NO CALC MADE (CONC = 0.0) DWASH=NO MEANS NO BUILDING DOWNWASH USED DWASH=HS MEANS HUBER-SNYDER DOWNWASH USED DWASH=SS MEANS SCHULMAN-SCIRE DOWNWASH USED DWASH=NA MEANS DOWNWASH NOT APPLICABLE, X<3*LB *************************************** *** SUMMARY OF SCREEN MODEL RESULTS *** *************************************** CALCULATION MAX CONC DIST TO TERRAIN PROCEDURE (UG/M**3) MAX (M) HT (M)

Project 02-215W 42 RWDI West Inc.
-------------- ----------- ------- ------- SIMPLE TERRAIN 359.3 110. 0. *************************************************** ** REMEMBER TO INCLUDE BACKGROUND CONCENTRATIONS ** ***************************************************

Project 02-215W 43 RWDI West Inc.
02/03/02 20:19:49 *** SCREEN3 MODEL RUN *** *** VERSION DATED 96043 *** Heater-treater Stack SO2 Case 4 SIMPLE TERRAIN INPUTS: SOURCE TYPE = POINT EMISSION RATE (G/S) = .500000 STACK HEIGHT (M) = 6.1000 STK INSIDE DIAM (M) = .3000 STK EXIT VELOCITY (M/S)= 2.5000 STK GAS EXIT TEMP (K) = 573.0000 AMBIENT AIR TEMP (K) = 293.0000 RECEPTOR HEIGHT (M) = .0000 URBAN/RURAL OPTION = RURAL BUILDING HEIGHT (M) = 4.0000 MIN HORIZ BLDG DIM (M) = 3.0000 MAX HORIZ BLDG DIM (M) = 6.0000 THE REGULATORY (DEFAULT) MIXING HEIGHT OPTION WAS SELECTED. THE REGULATORY (DEFAULT) ANEMOMETER HEIGHT OF 10.0 METERS WAS ENTERED. BUOY. FLUX = .270 M**4/S**3; MOM. FLUX = .072 M**4/S**2. *** FULL METEOROLOGY *** ********************************** *** SCREEN AUTOMATED DISTANCES *** ********************************** *** TERRAIN HEIGHT OF 0. M ABOVE STACK BASE USED FOR FOLLOWING DISTANCES *** DIST CONC U10M USTK MIX HT PLUME SIGMA SIGMA (M) (UG/M**3) STAB (M/S) (M/S) (M) HT (M) Y (M) Z (M) DWASH ------- ---------- ---- ----- ----- ------ ------ ------ ------ ----- 100. 515.0 4 2.0 2.0 640.0 9.96 8.28 7.23 HS 200. 404.9 4 1.0 1.0 320.0 14.11 15.73 11.05 HS 300. 300.9 4 1.0 1.0 320.0 14.11 22.73 14.08 HS 400. 224.0 4 1.0 1.0 320.0 14.11 29.54 17.13 HS 500. 171.0 4 1.0 1.0 320.0 14.11 36.22 20.07 HS 600. 134.3 4 1.0 1.0 320.0 14.11 42.78 22.92 HS 700. 124.8 6 1.0 1.0 10000.0 22.03 24.88 13.48 HS 800. 122.5 6 1.0 1.0 10000.0 22.03 28.01 14.41 HS 900. 116.4 6 1.0 1.0 10000.0 22.03 31.11 15.05 HS 1000. 111.9 6 1.0 1.0 10000.0 22.03 34.19 15.87 HS 1100. 107.0 6 1.0 1.0 10000.0 22.03 37.24 16.66 HS 1200. 102.0 6 1.0 1.0 10000.0 22.03 40.27 17.43 HS 1300. 97.07 6 1.0 1.0 10000.0 22.03 43.28 18.19 HS 1400. 92.29 6 1.0 1.0 10000.0 22.03 46.27 18.93 HS 1500. 87.72 6 1.0 1.0 10000.0 22.03 49.24 19.65 HS 1600. 83.39 6 1.0 1.0 10000.0 22.03 52.19 20.36 HS 1700. 79.31 6 1.0 1.0 10000.0 22.03 55.13 21.05 HS 1800. 75.47 6 1.0 1.0 10000.0 22.03 58.05 21.73 HS 1900. 71.89 6 1.0 1.0 10000.0 22.03 60.95 22.01 HS 2000. 68.59 6 1.0 1.0 10000.0 22.03 63.84 22.59 HS 2100. 65.52 6 1.0 1.0 10000.0 22.03 66.71 23.16 HS 2200. 62.65 6 1.0 1.0 10000.0 22.03 69.57 23.70 HS 2300. 59.98 6 1.0 1.0 10000.0 22.03 72.42 24.24 HS 2400. 57.48 6 1.0 1.0 10000.0 22.03 75.26 24.77 HS 2500. 55.14 6 1.0 1.0 10000.0 22.03 78.08 25.29 HS 2600. 52.96 6 1.0 1.0 10000.0 22.03 80.89 25.81 HS 2700. 50.90 6 1.0 1.0 10000.0 22.03 83.69 26.31 HS 2800. 48.97 6 1.0 1.0 10000.0 22.03 86.48 26.80 HS 2900. 47.16 6 1.0 1.0 10000.0 22.03 89.27 27.29 HS 3000. 45.62 6 1.0 1.0 10000.0 22.03 92.04 27.49 HS 3500. 38.62 6 1.0 1.0 10000.0 22.03 105.75 29.46 HS 4000. 33.29 6 1.0 1.0 10000.0 22.03 119.26 31.29 HS 4500. 29.11 6 1.0 1.0 10000.0 22.03 132.58 33.00 HS

Project 02-215W 44 RWDI West Inc.
5000. 25.76 6 1.0 1.0 10000.0 22.03 145.74 34.61 HS 5500. 23.03 6 1.0 1.0 10000.0 22.03 158.76 36.14 HS 6000. 20.77 6 1.0 1.0 10000.0 22.03 171.64 37.61 HS 6500. 18.87 6 1.0 1.0 10000.0 22.03 184.40 39.00 HS 7000. 17.27 6 1.0 1.0 10000.0 22.03 197.05 40.26 HS 7500. 15.92 6 1.0 1.0 10000.0 22.03 209.59 41.42 HS 8000. 14.74 6 1.0 1.0 10000.0 22.03 222.03 42.53 HS 8500. 13.71 6 1.0 1.0 10000.0 22.03 234.38 43.60 HS 9000. 12.80 6 1.0 1.0 10000.0 22.03 246.65 44.64 HS 9500. 11.99 6 1.0 1.0 10000.0 22.03 258.83 45.64 HS 10000. 11.27 6 1.0 1.0 10000.0 22.03 270.94 46.61 HS 15000. 6.867 6 1.0 1.0 10000.0 22.03 388.45 55.07 HS 20000. 4.917 6 1.0 1.0 10000.0 22.03 500.97 60.47 HS 25000. 3.791 6 1.0 1.0 10000.0 22.03 609.77 65.02 HS 30000. 3.064 6 1.0 1.0 10000.0 22.03 715.60 68.99 HS 40000. 2.219 6 1.0 1.0 10000.0 22.03 920.23 74.63 HS 50000. 1.728 6 1.0 1.0 10000.0 22.03 1117.43 79.32 HS MAXIMUM 1-HR CONCENTRATION AT OR BEYOND 100. M: 100. 515.0 4 2.0 2.0 640.0 9.96 8.28 7.23 HS DWASH= MEANS NO CALC MADE (CONC = 0.0) DWASH=NO MEANS NO BUILDING DOWNWASH USED DWASH=HS MEANS HUBER-SNYDER DOWNWASH USED DWASH=SS MEANS SCHULMAN-SCIRE DOWNWASH USED DWASH=NA MEANS DOWNWASH NOT APPLICABLE, X<3*LB **************************************** *** REGULATORY (Default) *** PERFORMING CAVITY CALCULATIONS WITH ORIGINAL SCREEN CAVITY MODEL (BRODE, 1988) **************************************** *** CAVITY CALCULATION - 1 *** *** CAVITY CALCULATION - 2 *** CONC (UG/M**3) = .1171E+05 CONC (UG/M**3) = .0000 CRIT WS @10M (M/S) = 2.37 CRIT WS @10M (M/S) = 99.99 CRIT WS @ HS (M/S) = 2.37 CRIT WS @ HS (M/S) = 99.99 DILUTION WS (M/S) = 1.19 DILUTION WS (M/S) = 99.99 CAVITY HT (M) = 6.41 CAVITY HT (M) = 4.91 CAVITY LENGTH (M) = 9.73 CAVITY LENGTH (M) = 3.40 ALONGWIND DIM (M) = 3.00 ALONGWIND DIM (M) = 6.00 CAVITY CONC NOT CALCULATED FOR CRIT WS > 20.0 M/S. CONC SET = 0.0 **************************************** END OF CAVITY CALCULATIONS **************************************** *************************************** *** SUMMARY OF SCREEN MODEL RESULTS *** *************************************** CALCULATION MAX CONC DIST TO TERRAIN PROCEDURE (UG/M**3) MAX (M) HT (M) -------------- ----------- ------- ------- SIMPLE TERRAIN 515.0 100. 0. BLDG. CAVITY-1 .1171E+05 10. -- (DIST = CAVITY LENGTH) BLDG. CAVITY-2 .0000 3. -- (DIST = CAVITY LENGTH) *************************************************** ** REMEMBER TO INCLUDE BACKGROUND CONCENTRATIONS ** ***************************************************

Project 02-215W 45 RWDI West Inc.
Input Cases: The following FLARE STACK examples are provided: Case Case 1 Case 2 Case 3
Case 4
Source Type Point Point Flare Point
Stack height (m) 5.0 5.0 5.0 5.0 Stack diameter (m) 0.076 0.076 0.076 0.076
Radiation Loss (%) 25 55 55 55 Pseudo height (m) 6.02 6.02 - 6.02
Pseudo Diameter (m) 0.972 0.753 - 0.190 Heat Release (cal/s) - - 82314 - Stack gas exit velocity (m/s) 1.28 1.28 - 20.0 Stack gas exit temperature (K) 1273 1273 - 1273
SO2 emission rate (g/s) 0.218 0.218 0.218 0.218 Meteorology Full Full Full Full
Ambient Temperature (K) 288 288 288 288
Dispersion Rural Rural Rural Rural Minimum/Maximum Distances (m) 100
5000 100 5000
100 5000
100 5000
Terrain Flat Flat Flat Flat Input values that have changed from the Base Case (Case 1) are shown in boldface text.

Project 02-215W 46 RWDI West Inc.
Interpretation: Case Case 1 Case 2 Case 3 Case 4
Maximum SO2 (µg/m3) 54 66 48 47
Downwind distance (m) 100 109 112 112 PG Stability Class 4 4 3 3 10-m Wind Speed (m/s) 15 8 4.5 4.5 Mixing Height (m) 4800 2560 1440 1440 Buoyancy Flux (m4/s3) 2.294 1.377 1.365 1.370 Momentum Flux (m4/s2) 0.088 0.053 0.832 0.817 Input values that have changed from the Base Case (Case 1) are shown in boldface text.
Case 1 is modelled as a Point source, assumes 25% radiation and uses an actual exit velocity. The exit velocity is low and hence the plume is subject to stack downwash. Case 2 is modelled as a Point source, assumes 55% radiation and uses an actual exit velocity. Less energy is available to contribute to the plume rise as indicated by the lower buoyancy and momentum fluxes that determine the plume rise. The lower plume rise produces greater ground level concentrations. Case 3 is modelled as a Flare source and the SCREEN3 model assumes 55% radiation and an exit velocity of 20 m/s. With this exit velocity, the plume is not subject to stack downwash. The buoyancy flux is virtually identical to Case 2, but the momentum flux (due to the exit velocity) is much larger. For low exit velocities, this representation, which is the default US EPA mode, does not account for downwash that can occur for low exit velocities. Case 4 is modelled as a Point source to represent Case 3 assumptions. The buoyancy flux, the momentum flux and the ground level concentrations are virtually identical to Case 3 demonstrating the equivalency of the Point and Flare methods.

Project 02-215W 47 RWDI West Inc.

Project 02-215W 48 RWDI West Inc.
02/07/02 21:21:21 *** SCREEN3 MODEL RUN *** *** VERSION DATED 96043 *** Flare SO2 25% Case 1 SIMPLE TERRAIN INPUTS: SOURCE TYPE = POINT EMISSION RATE (G/S) = .218000 STACK HEIGHT (M) = 6.0200 STK INSIDE DIAM (M) = .9720 STK EXIT VELOCITY (M/S)= 1.2800 STK GAS EXIT TEMP (K) = 1273.0000 AMBIENT AIR TEMP (K) = 288.0000 RECEPTOR HEIGHT (M) = .0000 URBAN/RURAL OPTION = RURAL BUILDING HEIGHT (M) = .0000 MIN HORIZ BLDG DIM (M) = .0000 MAX HORIZ BLDG DIM (M) = .0000 THE REGULATORY (DEFAULT) MIXING HEIGHT OPTION WAS SELECTED. THE REGULATORY (DEFAULT) ANEMOMETER HEIGHT OF 10.0 METERS WAS ENTERED. BUOY. FLUX = 2.294 M**4/S**3; MOM. FLUX = .088 M**4/S**2. *** FULL METEOROLOGY *** ********************************** *** SCREEN AUTOMATED DISTANCES *** ********************************** *** TERRAIN HEIGHT OF 0. M ABOVE STACK BASE USED FOR FOLLOWING DISTANCES *** DIST CONC U10M USTK MIX HT PLUME SIGMA SIGMA (M) (UG/M**3) STAB (M/S) (M/S) (M) HT (M) Y (M) Z (M) DWASH ------- ---------- ---- ----- ----- ------ ------ ------ ------ ----- 100. 53.97 4 15.0 15.0 4800.0 5.93 8.24 4.71 NO 200. 42.13 4 5.0 5.0 1600.0 11.59 15.73 8.80 NO 300. 33.33 4 4.0 4.0 1280.0 13.71 22.79 12.42 NO 400. 27.15 4 3.0 3.0 960.0 17.25 29.70 15.74 NO 500. 22.93 4 2.5 2.5 800.0 20.07 36.43 18.86 NO 600. 19.86 4 2.0 2.0 640.0 24.32 43.10 21.97 NO 700. 17.47 4 2.0 2.0 640.0 24.32 49.52 24.70 NO 800. 15.69 4 1.5 1.5 480.0 31.39 56.09 27.84 NO 900. 14.32 4 1.5 1.5 480.0 31.39 62.35 30.43 NO 1000. 13.01 4 1.5 1.5 480.0 31.39 68.55 32.98 NO 1100. 11.84 4 1.5 1.5 480.0 31.39 74.70 34.96 NO 1200. 11.11 6 1.5 1.5 10000.0 33.02 40.82 17.62 NO 1300. 11.40 6 1.5 1.5 10000.0 33.02 43.79 18.34 NO 1400. 11.57 6 1.5 1.5 10000.0 33.02 46.75 19.06 NO 1500. 11.89 6 1.0 1.0 10000.0 37.94 49.89 20.26 NO 1600. 12.15 6 1.0 1.0 10000.0 37.94 52.81 20.93 NO 1700. 12.33 6 1.0 1.0 10000.0 37.94 55.71 21.59 NO 1800. 12.43 6 1.0 1.0 10000.0 37.94 58.60 22.24 NO 1900. 12.48 6 1.0 1.0 10000.0 37.94 61.48 22.89 NO 2000. 12.49 6 1.0 1.0 10000.0 37.94 64.34 23.52 NO 2100. 12.38 6 1.0 1.0 10000.0 37.94 67.20 24.06 NO 2200. 12.25 6 1.0 1.0 10000.0 37.94 70.04 24.58 NO 2300. 12.11 6 1.0 1.0 10000.0 37.94 72.87 25.10 NO 2400. 11.95 6 1.0 1.0 10000.0 37.94 75.69 25.61 NO 2500. 11.79 6 1.0 1.0 10000.0 37.94 78.49 26.11 NO 2600. 11.61 6 1.0 1.0 10000.0 37.94 81.29 26.61 NO 2700. 11.43 6 1.0 1.0 10000.0 37.94 84.08 27.10 NO 2800. 11.25 6 1.0 1.0 10000.0 37.94 86.86 27.58 NO 2900. 11.06 6 1.0 1.0 10000.0 37.94 89.63 28.05 NO 3000. 10.87 6 1.0 1.0 10000.0 37.94 92.39 28.51 NO 3500. 9.883 6 1.0 1.0 10000.0 37.94 106.06 30.42 NO 4000. 9.006 6 1.0 1.0 10000.0 37.94 119.53 32.19 NO 4500. 8.237 6 1.0 1.0 10000.0 37.94 132.82 33.86 NO

Project 02-215W 49 RWDI West Inc.
5000. 7.564 6 1.0 1.0 10000.0 37.94 145.96 35.43 NO MAXIMUM 1-HR CONCENTRATION AT OR BEYOND 100. M: 100. 53.97 4 15.0 15.0 4800.0 5.93 8.24 4.71 NO DWASH= MEANS NO CALC MADE (CONC = 0.0) DWASH=NO MEANS NO BUILDING DOWNWASH USED DWASH=HS MEANS HUBER-SNYDER DOWNWASH USED DWASH=SS MEANS SCHULMAN-SCIRE DOWNWASH USED DWASH=NA MEANS DOWNWASH NOT APPLICABLE, X<3*LB *************************************** *** SUMMARY OF SCREEN MODEL RESULTS *** *************************************** CALCULATION MAX CONC DIST TO TERRAIN PROCEDURE (UG/M**3) MAX (M) HT (M) -------------- ----------- ------- ------- SIMPLE TERRAIN 53.97 100. 0. *************************************************** ** REMEMBER TO INCLUDE BACKGROUND CONCENTRATIONS ** ***************************************************

Project 02-215W 50 RWDI West Inc.

Project 02-215W 51 RWDI West Inc.
02/07/02 21:23:05 *** SCREEN3 MODEL RUN *** *** VERSION DATED 96043 *** Flare SO2 55% Case 2 SIMPLE TERRAIN INPUTS: SOURCE TYPE = POINT EMISSION RATE (G/S) = .218000 STACK HEIGHT (M) = 6.0200 STK INSIDE DIAM (M) = .7530 STK EXIT VELOCITY (M/S)= 1.2800 STK GAS EXIT TEMP (K) = 1273.0000 AMBIENT AIR TEMP (K) = 288.0000 RECEPTOR HEIGHT (M) = .0000 URBAN/RURAL OPTION = RURAL BUILDING HEIGHT (M) = .0000 MIN HORIZ BLDG DIM (M) = .0000 MAX HORIZ BLDG DIM (M) = .0000 THE REGULATORY (DEFAULT) MIXING HEIGHT OPTION WAS SELECTED. THE REGULATORY (DEFAULT) ANEMOMETER HEIGHT OF 10.0 METERS WAS ENTERED. BUOY. FLUX = 1.377 M**4/S**3; MOM. FLUX = .053 M**4/S**2. *** FULL METEOROLOGY *** ********************************** *** SCREEN AUTOMATED DISTANCES *** ********************************** *** TERRAIN HEIGHT OF 0. M ABOVE STACK BASE USED FOR FOLLOWING DISTANCES *** DIST CONC U10M USTK MIX HT PLUME SIGMA SIGMA (M) (UG/M**3) STAB (M/S) (M/S) (M) HT (M) Y (M) Z (M) DWASH ------- ---------- ---- ----- ----- ------ ------ ------ ------ ----- 100. 65.62 4 8.0 8.0 2560.0 7.41 8.26 4.75 NO 200. 56.82 4 4.0 4.0 1280.0 11.05 15.68 8.72 NO 300. 45.41 4 2.5 2.5 800.0 15.42 22.82 12.49 NO 400. 37.65 4 2.0 2.0 640.0 18.34 29.71 15.76 NO 500. 31.65 4 1.5 1.5 480.0 23.20 36.52 19.02 NO 600. 28.00 4 1.5 1.5 480.0 23.20 43.03 21.84 NO 700. 24.37 4 1.5 1.5 480.0 23.20 49.46 24.59 NO 800. 22.09 4 1.0 1.0 320.0 32.92 56.12 27.89 NO 900. 20.37 4 1.0 1.0 320.0 32.92 62.37 30.48 NO 1000. 18.65 4 1.0 1.0 320.0 32.92 68.57 33.02 NO 1100. 17.05 4 1.0 1.0 320.0 32.92 74.72 35.00 NO 1200. 16.47 6 1.0 1.0 10000.0 32.97 40.77 17.49 NO 1300. 16.94 6 1.0 1.0 10000.0 32.97 43.74 18.22 NO 1400. 17.24 6 1.0 1.0 10000.0 32.97 46.70 18.94 NO 1500. 17.40 6 1.0 1.0 10000.0 32.97 49.65 19.64 NO 1600. 17.44 6 1.0 1.0 10000.0 32.97 52.58 20.33 NO 1700. 17.38 6 1.0 1.0 10000.0 32.97 55.49 21.01 NO 1800. 17.25 6 1.0 1.0 10000.0 32.97 58.39 21.68 NO 1900. 17.06 6 1.0 1.0 10000.0 32.97 61.28 22.34 NO 2000. 16.82 6 1.0 1.0 10000.0 32.97 64.15 22.99 NO 2100. 16.50 6 1.0 1.0 10000.0 32.97 67.01 23.54 NO 2200. 16.15 6 1.0 1.0 10000.0 32.97 69.86 24.08 NO 2300. 15.81 6 1.0 1.0 10000.0 32.97 72.70 24.61 NO 2400. 15.46 6 1.0 1.0 10000.0 32.97 75.52 25.13 NO 2500. 15.11 6 1.0 1.0 10000.0 32.97 78.34 25.64 NO 2600. 14.77 6 1.0 1.0 10000.0 32.97 81.14 26.14 NO 2700. 14.43 6 1.0 1.0 10000.0 32.97 83.93 26.64 NO 2800. 14.09 6 1.0 1.0 10000.0 32.97 86.72 27.12 NO 2900. 13.77 6 1.0 1.0 10000.0 32.97 89.49 27.61 NO 3000. 13.45 6 1.0 1.0 10000.0 32.97 92.25 28.08 NO 3500. 11.94 6 1.0 1.0 10000.0 32.97 105.94 30.01 NO 4000. 10.68 6 1.0 1.0 10000.0 32.97 119.42 31.81 NO 4500. 9.615 6 1.0 1.0 10000.0 32.97 132.73 33.49 NO

Project 02-215W 52 RWDI West Inc.
5000. 8.718 6 1.0 1.0 10000.0 32.97 145.88 35.08 NO MAXIMUM 1-HR CONCENTRATION AT OR BEYOND 100. M: 109. 66.42 4 8.0 8.0 2560.0 7.41 9.01 5.15 NO DWASH= MEANS NO CALC MADE (CONC = 0.0) DWASH=NO MEANS NO BUILDING DOWNWASH USED DWASH=HS MEANS HUBER-SNYDER DOWNWASH USED DWASH=SS MEANS SCHULMAN-SCIRE DOWNWASH USED DWASH=NA MEANS DOWNWASH NOT APPLICABLE, X<3*LB *************************************** *** SUMMARY OF SCREEN MODEL RESULTS *** *************************************** CALCULATION MAX CONC DIST TO TERRAIN PROCEDURE (UG/M**3) MAX (M) HT (M) -------------- ----------- ------- ------- SIMPLE TERRAIN 66.42 109. 0. *************************************************** ** REMEMBER TO INCLUDE BACKGROUND CONCENTRATIONS ** ***************************************************

Project 02-215W 53 RWDI West Inc.
02/07/02 21:52:28 *** SCREEN3 MODEL RUN *** *** VERSION DATED 96043 *** Flare SO2 55% Case 3 SIMPLE TERRAIN INPUTS: SOURCE TYPE = FLARE EMISSION RATE (G/S) = .218000 FLARE STACK HEIGHT (M) = 5.0000 TOT HEAT RLS (CAL/S) = 82314.0 RECEPTOR HEIGHT (M) = .0000 URBAN/RURAL OPTION = RURAL EFF RELEASE HEIGHT (M) = 6.0199 BUILDING HEIGHT (M) = .0000 MIN HORIZ BLDG DIM (M) = .0000 MAX HORIZ BLDG DIM (M) = .0000 THE REGULATORY (DEFAULT) MIXING HEIGHT OPTION WAS SELECTED. THE REGULATORY (DEFAULT) ANEMOMETER HEIGHT OF 10.0 METERS WAS ENTERED. BUOY. FLUX = 1.365 M**4/S**3; MOM. FLUX = .832 M**4/S**2. *** FULL METEOROLOGY *** ********************************** *** SCREEN AUTOMATED DISTANCES *** ********************************** *** TERRAIN HEIGHT OF 0. M ABOVE STACK BASE USED FOR FOLLOWING DISTANCES *** DIST CONC U10M USTK MIX HT PLUME SIGMA SIGMA (M) (UG/M**3) STAB (M/S) (M/S) (M) HT (M) Y (M) Z (M) DWASH ------- ---------- ---- ----- ----- ------ ------ ------ ------ ----- 100. 46.93 3 5.0 5.0 1600.0 11.43 12.56 7.60 NO 200. 43.37 4 4.5 4.5 1440.0 12.03 15.66 8.67 NO 300. 39.24 4 3.0 3.0 960.0 15.04 22.76 12.36 NO 400. 34.33 4 2.0 2.0 640.0 19.55 29.71 15.75 NO 500. 29.93 4 1.5 1.5 480.0 24.06 36.51 19.01 NO 600. 26.84 4 1.5 1.5 480.0 24.06 43.03 21.83 NO 700. 23.57 4 1.5 1.5 480.0 24.06 49.46 24.58 NO 800. 21.95 4 1.0 1.0 320.0 33.07 56.11 27.88 NO 900. 20.26 4 1.0 1.0 320.0 33.07 62.36 30.46 NO 1000. 18.56 4 1.0 1.0 320.0 33.07 68.56 33.01 NO 1100. 16.98 4 1.0 1.0 320.0 33.07 74.71 34.99 NO 1200. 15.78 6 1.0 1.0 10000.0 33.38 40.77 17.50 NO 1300. 16.28 6 1.0 1.0 10000.0 33.38 43.75 18.23 NO 1400. 16.62 6 1.0 1.0 10000.0 33.38 46.71 18.95 NO 1500. 16.81 6 1.0 1.0 10000.0 33.38 49.65 19.65 NO 1600. 16.88 6 1.0 1.0 10000.0 33.38 52.58 20.34 NO 1700. 16.86 6 1.0 1.0 10000.0 33.38 55.49 21.02 NO 1800. 16.77 6 1.0 1.0 10000.0 33.38 58.39 21.69 NO 1900. 16.61 6 1.0 1.0 10000.0 33.38 61.28 22.35 NO 2000. 16.40 6 1.0 1.0 10000.0 33.38 64.15 23.00 NO 2100. 16.10 6 1.0 1.0 10000.0 33.38 67.01 23.55 NO 2200. 15.79 6 1.0 1.0 10000.0 33.38 69.86 24.08 NO 2300. 15.46 6 1.0 1.0 10000.0 33.38 72.70 24.61 NO 2400. 15.13 6 1.0 1.0 10000.0 33.38 75.52 25.13 NO 2500. 14.81 6 1.0 1.0 10000.0 33.38 78.34 25.64 NO 2600. 14.48 6 1.0 1.0 10000.0 33.38 81.14 26.15 NO 2700. 14.16 6 1.0 1.0 10000.0 33.38 83.94 26.64 NO 2800. 13.84 6 1.0 1.0 10000.0 33.38 86.72 27.13 NO 2900. 13.52 6 1.0 1.0 10000.0 33.38 89.49 27.61 NO 3000. 13.22 6 1.0 1.0 10000.0 33.38 92.25 28.09 NO 3500. 11.76 6 1.0 1.0 10000.0 33.38 105.94 30.02 NO 4000. 10.53 6 1.0 1.0 10000.0 33.38 119.43 31.81 NO 4500. 9.500 6 1.0 1.0 10000.0 33.38 132.73 33.50 NO 5000. 8.623 6 1.0 1.0 10000.0 33.38 145.88 35.09 NO
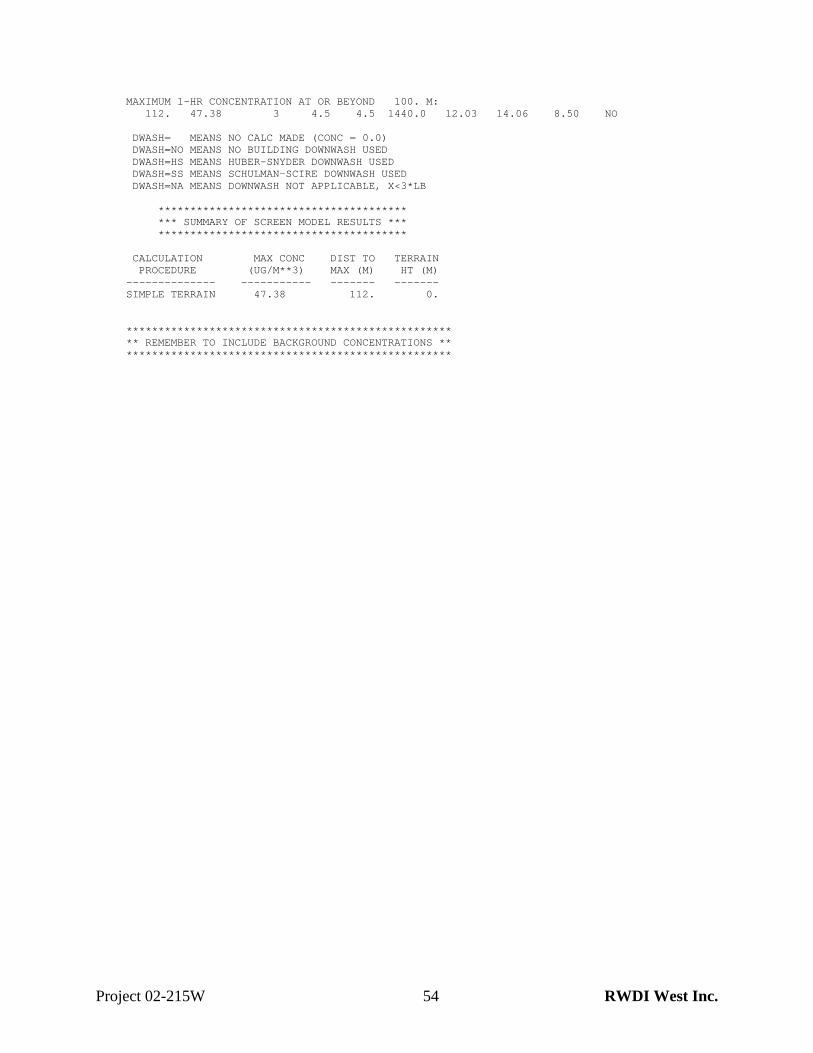
Project 02-215W 54 RWDI West Inc.
MAXIMUM 1-HR CONCENTRATION AT OR BEYOND 100. M: 112. 47.38 3 4.5 4.5 1440.0 12.03 14.06 8.50 NO DWASH= MEANS NO CALC MADE (CONC = 0.0) DWASH=NO MEANS NO BUILDING DOWNWASH USED DWASH=HS MEANS HUBER-SNYDER DOWNWASH USED DWASH=SS MEANS SCHULMAN-SCIRE DOWNWASH USED DWASH=NA MEANS DOWNWASH NOT APPLICABLE, X<3*LB *************************************** *** SUMMARY OF SCREEN MODEL RESULTS *** *************************************** CALCULATION MAX CONC DIST TO TERRAIN PROCEDURE (UG/M**3) MAX (M) HT (M) -------------- ----------- ------- ------- SIMPLE TERRAIN 47.38 112. 0. *************************************************** ** REMEMBER TO INCLUDE BACKGROUND CONCENTRATIONS ** ***************************************************
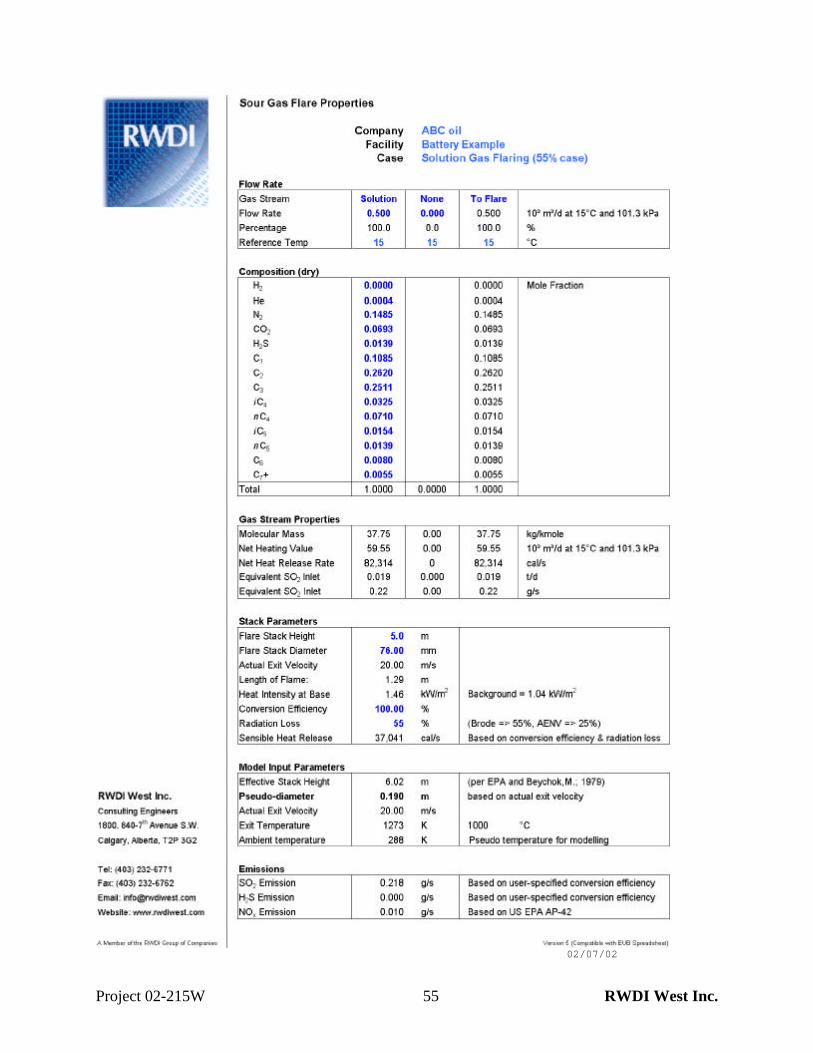
Project 02-215W 55 RWDI West Inc.
02/07/02

Project 02-215W 56 RWDI West Inc.
22:05:05 *** SCREEN3 MODEL RUN *** *** VERSION DATED 96043 *** Flare SO2 55% Case 4 SIMPLE TERRAIN INPUTS: SOURCE TYPE = POINT EMISSION RATE (G/S) = .218000 STACK HEIGHT (M) = 6.0200 STK INSIDE DIAM (M) = .1900 STK EXIT VELOCITY (M/S)= 20.0000 STK GAS EXIT TEMP (K) = 1273.0000 AMBIENT AIR TEMP (K) = 288.0000 RECEPTOR HEIGHT (M) = .0000 URBAN/RURAL OPTION = RURAL BUILDING HEIGHT (M) = .0000 MIN HORIZ BLDG DIM (M) = .0000 MAX HORIZ BLDG DIM (M) = .0000 THE REGULATORY (DEFAULT) MIXING HEIGHT OPTION WAS SELECTED. THE REGULATORY (DEFAULT) ANEMOMETER HEIGHT OF 10.0 METERS WAS ENTERED. BUOY. FLUX = 1.370 M**4/S**3; MOM. FLUX = .817 M**4/S**2. *** FULL METEOROLOGY *** ********************************** *** SCREEN AUTOMATED DISTANCES *** ********************************** *** TERRAIN HEIGHT OF 0. M ABOVE STACK BASE USED FOR FOLLOWING DISTANCES *** DIST CONC U10M USTK MIX HT PLUME SIGMA SIGMA (M) (UG/M**3) STAB (M/S) (M/S) (M) HT (M) Y (M) Z (M) DWASH ------- ---------- ---- ----- ----- ------ ------ ------ ------ ----- 100. 46.80 3 5.0 5.0 1600.0 11.44 12.56 7.60 NO 200. 43.26 4 4.5 4.5 1440.0 12.05 15.66 8.67 NO 300. 39.15 4 3.0 3.0 960.0 15.06 22.76 12.37 NO 400. 34.24 4 2.0 2.0 640.0 19.58 29.71 15.75 NO 500. 29.84 4 1.5 1.5 480.0 24.10 36.51 19.01 NO 600. 26.77 4 1.5 1.5 480.0 24.10 43.03 21.83 NO 700. 23.53 4 1.5 1.5 480.0 24.10 49.46 24.58 NO 800. 21.88 4 1.0 1.0 320.0 33.14 56.11 27.88 NO 900. 20.21 4 1.0 1.0 320.0 33.14 62.37 30.47 NO 1000. 18.52 4 1.0 1.0 320.0 33.14 68.57 33.02 NO 1100. 16.95 4 1.0 1.0 320.0 33.14 74.71 34.99 NO 1200. 15.96 6 1.0 1.0 10000.0 33.25 40.76 17.48 NO 1300. 16.46 6 1.0 1.0 10000.0 33.25 43.74 18.22 NO 1400. 16.78 6 1.0 1.0 10000.0 33.25 46.70 18.93 NO 1500. 16.97 6 1.0 1.0 10000.0 33.25 49.64 19.64 NO 1600. 17.04 6 1.0 1.0 10000.0 33.25 52.57 20.33 NO 1700. 17.01 6 1.0 1.0 10000.0 33.25 55.49 21.01 NO 1800. 16.90 6 1.0 1.0 10000.0 33.25 58.39 21.68 NO 1900. 16.74 6 1.0 1.0 10000.0 33.25 61.28 22.34 NO 2000. 16.53 6 1.0 1.0 10000.0 33.25 64.15 22.98 NO 2100. 16.21 6 1.0 1.0 10000.0 33.25 67.01 23.53 NO 2200. 15.89 6 1.0 1.0 10000.0 33.25 69.86 24.07 NO 2300. 15.56 6 1.0 1.0 10000.0 33.25 72.70 24.60 NO 2400. 15.23 6 1.0 1.0 10000.0 33.25 75.52 25.12 NO 2500. 14.90 6 1.0 1.0 10000.0 33.25 78.34 25.63 NO 2600. 14.57 6 1.0 1.0 10000.0 33.25 81.14 26.14 NO 2700. 14.24 6 1.0 1.0 10000.0 33.25 83.93 26.63 NO 2800. 13.91 6 1.0 1.0 10000.0 33.25 86.71 27.12 NO 2900. 13.60 6 1.0 1.0 10000.0 33.25 89.49 27.60 NO 3000. 13.29 6 1.0 1.0 10000.0 33.25 92.25 28.08 NO 3500. 11.81 6 1.0 1.0 10000.0 33.25 105.94 30.01 NO 4000. 10.58 6 1.0 1.0 10000.0 33.25 119.42 31.80 NO 4500. 9.535 6 1.0 1.0 10000.0 33.25 132.73 33.49 NO 5000. 8.652 6 1.0 1.0 10000.0 33.25 145.88 35.08 NO

Project 02-215W 57 RWDI West Inc.
MAXIMUM 1-HR CONCENTRATION AT OR BEYOND 100. M: 112. 47.26 3 4.5 4.5 1440.0 12.05 14.06 8.50 NO DWASH= MEANS NO CALC MADE (CONC = 0.0) DWASH=NO MEANS NO BUILDING DOWNWASH USED DWASH=HS MEANS HUBER-SNYDER DOWNWASH USED DWASH=SS MEANS SCHULMAN-SCIRE DOWNWASH USED DWASH=NA MEANS DOWNWASH NOT APPLICABLE, X<3*LB *************************************** *** SUMMARY OF SCREEN MODEL RESULTS *** *************************************** CALCULATION MAX CONC DIST TO TERRAIN PROCEDURE (UG/M**3) MAX (M) HT (M) -------------- ----------- ------- ------- SIMPLE TERRAIN 47.26 112. 0. *************************************************** ** REMEMBER TO INCLUDE BACKGROUND CONCENTRATIONS ** ***************************************************

Project 02-215W 58 RWDI West Inc.
Input Cases: The following TANK VENT examples are provided: Source Parameters Case 1 Case 2 Case 3 Case 4 Stack height (m) 10.31 10.31 10.31 10.31
Stack diameter (m) 0.076 0.076 0.076 0.076 Stack gas exit velocity (m/s) 0.00 0.00 0.00 0.5 Stack gas exit temperature (K) 293 293 293 303 H2S emission rate (g/s) 0.20 0.20 0.20 0.20
Tank height (m) 0.0 7.31 7.31 7.31 Tank Diameter (m) 0.0 3.34 3.34 3.34 Meteorology Full Full Full Full Ambient Temperature (K) 293 293 293 293
Dispersion Rural Rural Rural Rural Minimum/Maximum Distances (m) 100
5000 100 5000
10 200
10 200
Terrain Flat Flat Flat Flat
Input values that have changed from the Base Case (Case 1) are shown in boldface text.

Project 02-215W 59 RWDI West Inc.
Interpretation: Case Case 1 Case 2 Case 3 Case 4
Maximum H2S (µg/m3) 27 70 108 67
Downwind distance (m) 100 100 50 50 PG Stability Class C (3) F (6) F (6) F (6) 10-m Wind Speed (m/s) 1.0 1.0 1.0 1.0
Mixing Height (m) 320 10000 10000 10000
Building Cavity H2S (µg/m3) - 546 546 546
Distance to Cavity Maximum (m) - 546 546 546 Input values that have changed from the Base Case (Case 1) are shown in boldface text.
Case 1 assumes no exit velocity, an exit temperature equal to ambient and no tank wake effects. Case 2 assumes tank wake effects, which increases the ambient concentration predictions. Case 3 demonstrates that the maximum concentration is predicted to be closer to the tank vent than the 100 m minimum assumed for Cases 1 and 2. Case 4 shows the effects of assuming an exit velocity and assuming the gas exit temperature is 10 °C warmer than ambient.

Project 02-215W 60 RWDI West Inc.
02/08/02 12:37:14 *** SCREEN3 MODEL RUN *** *** VERSION DATED 96043 *** Tank H2S Case 1 SIMPLE TERRAIN INPUTS: SOURCE TYPE = POINT EMISSION RATE (G/S) = .200000E-01 STACK HEIGHT (M) = 10.3100 STK INSIDE DIAM (M) = .0760 STK EXIT VELOCITY (M/S)= .0000 STK GAS EXIT TEMP (K) = 293.0000 AMBIENT AIR TEMP (K) = 293.0000 RECEPTOR HEIGHT (M) = .0000 URBAN/RURAL OPTION = RURAL BUILDING HEIGHT (M) = .0000 MIN HORIZ BLDG DIM (M) = .0000 MAX HORIZ BLDG DIM (M) = .0000 THE REGULATORY (DEFAULT) MIXING HEIGHT OPTION WAS SELECTED. THE REGULATORY (DEFAULT) ANEMOMETER HEIGHT OF 10.0 METERS WAS ENTERED. BUOY. FLUX = .000 M**4/S**3; MOM. FLUX = .000 M**4/S**2. *** FULL METEOROLOGY *** ********************************** *** SCREEN AUTOMATED DISTANCES *** ********************************** *** TERRAIN HEIGHT OF 0. M ABOVE STACK BASE USED FOR FOLLOWING DISTANCES *** DIST CONC U10M USTK MIX HT PLUME SIGMA SIGMA (M) (UG/M**3) STAB (M/S) (M/S) (M) HT (M) Y (M) Z (M) DWASH ------- ---------- ---- ----- ----- ------ ------ ------ ------ ----- 100. 27.33 3 1.0 1.0 320.0 10.08 12.46 7.44 NO 200. 23.71 4 1.0 1.0 320.0 10.08 15.56 8.50 NO 300. 21.89 5 1.0 1.0 10000.0 10.08 16.89 8.70 NO 400. 21.81 6 1.0 1.0 10000.0 10.08 14.64 7.05 NO 500. 20.18 6 1.0 1.0 10000.0 10.08 17.97 8.40 NO 600. 17.71 6 1.0 1.0 10000.0 10.08 21.24 9.69 NO 700. 15.30 6 1.0 1.0 10000.0 10.08 24.46 10.93 NO 800. 13.27 6 1.0 1.0 10000.0 10.08 27.63 11.98 NO 900. 11.59 6 1.0 1.0 10000.0 10.08 30.78 12.98 NO 1000. 10.20 6 1.0 1.0 10000.0 10.08 33.88 13.95 NO 1100. 9.067 6 1.0 1.0 10000.0 10.08 36.96 14.82 NO 1200. 8.121 6 1.0 1.0 10000.0 10.08 40.01 15.66 NO 1300. 7.322 6 1.0 1.0 10000.0 10.08 43.04 16.47 NO 1400. 6.641 6 1.0 1.0 10000.0 10.08 46.05 17.26 NO 1500. 6.057 6 1.0 1.0 10000.0 10.08 49.03 18.03 NO 1600. 5.551 6 1.0 1.0 10000.0 10.08 51.99 18.78 NO 1700. 5.109 6 1.0 1.0 10000.0 10.08 54.94 19.52 NO 1800. 4.722 6 1.0 1.0 10000.0 10.08 57.87 20.23 NO 1900. 4.381 6 1.0 1.0 10000.0 10.08 60.78 20.94 NO 2000. 4.078 6 1.0 1.0 10000.0 10.08 63.68 21.63 NO 2100. 3.820 6 1.0 1.0 10000.0 10.08 66.56 22.21 NO 2200. 3.589 6 1.0 1.0 10000.0 10.08 69.42 22.78 NO 2300. 3.380 6 1.0 1.0 10000.0 10.08 72.28 23.34 NO 2400. 3.191 6 1.0 1.0 10000.0 10.08 75.12 23.89 NO 2500. 3.020 6 1.0 1.0 10000.0 10.08 77.95 24.42 NO 2600. 2.863 6 1.0 1.0 10000.0 10.08 80.76 24.95 NO 2700. 2.719 6 1.0 1.0 10000.0 10.08 83.57 25.47 NO 2800. 2.588 6 1.0 1.0 10000.0 10.08 86.36 25.98 NO 2900. 2.466 6 1.0 1.0 10000.0 10.08 89.15 26.48 NO 3000. 2.354 6 1.0 1.0 10000.0 10.08 91.92 26.98 NO 3500. 1.925 6 1.0 1.0 10000.0 10.08 105.65 28.98 NO 4000. 1.615 6 1.0 1.0 10000.0 10.08 119.17 30.84 NO 4500. 1.383 6 1.0 1.0 10000.0 10.08 132.50 32.57 NO

Project 02-215W 61 RWDI West Inc.
5000. 1.203 6 1.0 1.0 10000.0 10.08 145.67 34.21 NO MAXIMUM 1-HR CONCENTRATION AT OR BEYOND 100. M: 100. 27.33 3 1.0 1.0 320.0 10.08 12.46 7.44 NO DWASH= MEANS NO CALC MADE (CONC = 0.0) DWASH=NO MEANS NO BUILDING DOWNWASH USED DWASH=HS MEANS HUBER-SNYDER DOWNWASH USED DWASH=SS MEANS SCHULMAN-SCIRE DOWNWASH USED DWASH=NA MEANS DOWNWASH NOT APPLICABLE, X<3*LB *************************************** *** SUMMARY OF SCREEN MODEL RESULTS *** *************************************** CALCULATION MAX CONC DIST TO TERRAIN PROCEDURE (UG/M**3) MAX (M) HT (M) -------------- ----------- ------- ------- SIMPLE TERRAIN 27.33 100. 0. *************************************************** ** REMEMBER TO INCLUDE BACKGROUND CONCENTRATIONS ** ***************************************************

Project 02-215W 62 RWDI West Inc.
02/08/02 12:39:43 *** SCREEN3 MODEL RUN *** *** VERSION DATED 96043 *** Tank H2S Case 2 SIMPLE TERRAIN INPUTS: SOURCE TYPE = POINT EMISSION RATE (G/S) = .200000E-01 STACK HEIGHT (M) = 10.3100 STK INSIDE DIAM (M) = .0760 STK EXIT VELOCITY (M/S)= .0000 STK GAS EXIT TEMP (K) = 293.0000 AMBIENT AIR TEMP (K) = 293.0000 RECEPTOR HEIGHT (M) = .0000 URBAN/RURAL OPTION = RURAL BUILDING HEIGHT (M) = 7.3100 MIN HORIZ BLDG DIM (M) = 3.3400 MAX HORIZ BLDG DIM (M) = 3.3400 THE REGULATORY (DEFAULT) MIXING HEIGHT OPTION WAS SELECTED. THE REGULATORY (DEFAULT) ANEMOMETER HEIGHT OF 10.0 METERS WAS ENTERED. BUOY. FLUX = .000 M**4/S**3; MOM. FLUX = .000 M**4/S**2. *** FULL METEOROLOGY *** ********************************** *** SCREEN AUTOMATED DISTANCES *** ********************************** *** TERRAIN HEIGHT OF 0. M ABOVE STACK BASE USED FOR FOLLOWING DISTANCES *** DIST CONC U10M USTK MIX HT PLUME SIGMA SIGMA (M) (UG/M**3) STAB (M/S) (M/S) (M) HT (M) Y (M) Z (M) DWASH ------- ---------- ---- ----- ----- ------ ------ ------ ------ ----- 100. 69.96 6 1.0 1.0 10000.0 10.08 4.07 6.43 HS 200. 45.07 6 1.0 1.0 10000.0 10.08 7.73 7.81 HS 300. 33.17 6 1.0 1.0 10000.0 10.08 11.23 9.12 HS 400. 25.71 6 1.0 1.0 10000.0 10.08 14.64 10.38 HS 500. 20.76 6 1.0 1.0 10000.0 10.08 17.97 11.15 HS 600. 17.18 6 1.0 1.0 10000.0 10.08 21.24 12.19 HS 700. 14.49 6 1.0 1.0 10000.0 10.08 24.46 13.19 HS 800. 12.53 6 1.0 1.0 10000.0 10.08 27.63 13.89 HS 900. 10.91 6 1.0 1.0 10000.0 10.08 30.78 14.76 HS 1000. 9.610 6 1.0 1.0 10000.0 10.08 33.88 15.60 HS 1100. 8.543 6 1.0 1.0 10000.0 10.08 36.96 16.42 HS 1200. 7.657 6 1.0 1.0 10000.0 10.08 40.01 17.21 HS 1300. 6.912 6 1.0 1.0 10000.0 10.08 43.04 17.98 HS 1400. 6.279 6 1.0 1.0 10000.0 10.08 46.05 18.73 HS 1500. 5.736 6 1.0 1.0 10000.0 10.08 49.03 19.47 HS 1600. 5.265 6 1.0 1.0 10000.0 10.08 51.99 20.19 HS 1700. 4.855 6 1.0 1.0 10000.0 10.08 54.94 20.89 HS 1800. 4.494 6 1.0 1.0 10000.0 10.08 57.87 21.58 HS 1900. 4.250 6 1.0 1.0 10000.0 10.08 60.78 21.77 HS 2000. 3.973 6 1.0 1.0 10000.0 10.08 63.68 22.35 HS 2100. 3.726 6 1.0 1.0 10000.0 10.08 66.56 22.92 HS 2200. 3.503 6 1.0 1.0 10000.0 10.08 69.42 23.47 HS 2300. 3.302 6 1.0 1.0 10000.0 10.08 72.28 24.02 HS 2400. 3.120 6 1.0 1.0 10000.0 10.08 75.12 24.55 HS 2500. 2.954 6 1.0 1.0 10000.0 10.08 77.95 25.08 HS 2600. 2.802 6 1.0 1.0 10000.0 10.08 80.76 25.59 HS 2700. 2.664 6 1.0 1.0 10000.0 10.08 83.57 26.10 HS 2800. 2.536 6 1.0 1.0 10000.0 10.08 86.36 26.60 HS 2900. 2.444 6 1.0 1.0 10000.0 10.08 89.15 26.77 HS 3000. 2.336 6 1.0 1.0 10000.0 10.08 91.92 27.21 HS 3500. 1.912 6 1.0 1.0 10000.0 10.08 105.65 29.20 HS 4000. 1.605 6 1.0 1.0 10000.0 10.08 119.17 31.04 HS 4500. 1.375 6 1.0 1.0 10000.0 10.08 132.50 32.76 HS

Project 02-215W 63 RWDI West Inc.
5000. 1.197 6 1.0 1.0 10000.0 10.08 145.67 34.39 HS MAXIMUM 1-HR CONCENTRATION AT OR BEYOND 100. M: 100. 69.96 6 1.0 1.0 10000.0 10.08 4.07 6.43 HS DWASH= MEANS NO CALC MADE (CONC = 0.0) DWASH=NO MEANS NO BUILDING DOWNWASH USED DWASH=HS MEANS HUBER-SNYDER DOWNWASH USED DWASH=SS MEANS SCHULMAN-SCIRE DOWNWASH USED DWASH=NA MEANS DOWNWASH NOT APPLICABLE, X<3*LB **************************************** *** REGULATORY (Default) *** PERFORMING CAVITY CALCULATIONS WITH ORIGINAL SCREEN CAVITY MODEL (BRODE, 1988) **************************************** *** CAVITY CALCULATION - 1 *** *** CAVITY CALCULATION - 2 *** CONC (UG/M**3) = 546.1 CONC (UG/M**3) = 546.1 CRIT WS @10M (M/S) = 1.00 CRIT WS @10M (M/S) = 1.00 CRIT WS @ HS (M/S) = 1.01 CRIT WS @ HS (M/S) = 1.01 DILUTION WS (M/S) = 1.00 DILUTION WS (M/S) = 1.00 CAVITY HT (M) = 13.77 CAVITY HT (M) = 13.77 CAVITY LENGTH (M) = 8.42 CAVITY LENGTH (M) = 8.42 ALONGWIND DIM (M) = 3.34 ALONGWIND DIM (M) = 3.34 **************************************** END OF CAVITY CALCULATIONS **************************************** *************************************** *** SUMMARY OF SCREEN MODEL RESULTS *** *************************************** CALCULATION MAX CONC DIST TO TERRAIN PROCEDURE (UG/M**3) MAX (M) HT (M) -------------- ----------- ------- ------- SIMPLE TERRAIN 69.96 100. 0. BLDG. CAVITY-1 546.1 8. -- (DIST = CAVITY LENGTH) BLDG. CAVITY-2 546.1 8. -- (DIST = CAVITY LENGTH) *************************************************** ** REMEMBER TO INCLUDE BACKGROUND CONCENTRATIONS ** ***************************************************

Project 02-215W 64 RWDI West Inc.
02/08/02 12:44:19 *** SCREEN3 MODEL RUN *** *** VERSION DATED 96043 *** Tank H2S Case 3 SIMPLE TERRAIN INPUTS: SOURCE TYPE = POINT EMISSION RATE (G/S) = .200000E-01 STACK HEIGHT (M) = 10.3100 STK INSIDE DIAM (M) = .0760 STK EXIT VELOCITY (M/S)= .0000 STK GAS EXIT TEMP (K) = 293.0000 AMBIENT AIR TEMP (K) = 293.0000 RECEPTOR HEIGHT (M) = .0000 URBAN/RURAL OPTION = RURAL BUILDING HEIGHT (M) = 7.3100 MIN HORIZ BLDG DIM (M) = 3.3400 MAX HORIZ BLDG DIM (M) = 3.3400 THE REGULATORY (DEFAULT) MIXING HEIGHT OPTION WAS SELECTED. THE REGULATORY (DEFAULT) ANEMOMETER HEIGHT OF 10.0 METERS WAS ENTERED. BUOY. FLUX = .000 M**4/S**3; MOM. FLUX = .000 M**4/S**2. *** FULL METEOROLOGY *** ********************************* *** SCREEN DISCRETE DISTANCES *** ********************************* *** TERRAIN HEIGHT OF 0. M ABOVE STACK BASE USED FOR FOLLOWING DISTANCES *** DIST CONC U10M USTK MIX HT PLUME SIGMA SIGMA (M) (UG/M**3) STAB (M/S) (M/S) (M) HT (M) Y (M) Z (M) DWASH ------- ---------- ---- ----- ----- ------ ------ ------ ------ ----- 10. .0000 0 .0 .0 .0 .00 .00 .00 NA 20. 45.20 6 1.0 1.0 10000.0 10.08 .91 3.70 HS 30. 75.14 6 1.0 1.0 10000.0 10.08 1.33 4.37 HS 40. 96.57 6 1.0 1.0 10000.0 10.08 1.74 5.04 HS 50. 107.9 6 1.0 1.0 10000.0 10.08 2.14 5.71 HS 60. 95.86 6 1.0 1.0 10000.0 10.08 2.53 5.85 HS 70. 87.00 6 1.0 1.0 10000.0 10.08 2.92 6.00 HS 80. 80.12 6 1.0 1.0 10000.0 10.08 3.31 6.14 HS 90. 74.57 6 1.0 1.0 10000.0 10.08 3.69 6.29 HS 100. 69.96 6 1.0 1.0 10000.0 10.08 4.07 6.43 HS 110. 66.04 6 1.0 1.0 10000.0 10.08 4.45 6.57 HS 120. 62.63 6 1.0 1.0 10000.0 10.08 4.82 6.71 HS 130. 59.62 6 1.0 1.0 10000.0 10.08 5.19 6.85 HS 140. 56.94 6 1.0 1.0 10000.0 10.08 5.56 6.99 HS 150. 54.52 6 1.0 1.0 10000.0 10.08 5.92 7.13 HS 160. 52.31 6 1.0 1.0 10000.0 10.08 6.29 7.26 HS 170. 50.29 6 1.0 1.0 10000.0 10.08 6.65 7.40 HS 180. 48.42 6 1.0 1.0 10000.0 10.08 7.01 7.54 HS 200. 45.07 6 1.0 1.0 10000.0 10.08 7.73 7.81 HS DWASH= MEANS NO CALC MADE (CONC = 0.0) DWASH=NO MEANS NO BUILDING DOWNWASH USED DWASH=HS MEANS HUBER-SNYDER DOWNWASH USED DWASH=SS MEANS SCHULMAN-SCIRE DOWNWASH USED DWASH=NA MEANS DOWNWASH NOT APPLICABLE, X<3*LB **************************************** *** REGULATORY (Default) *** PERFORMING CAVITY CALCULATIONS WITH ORIGINAL SCREEN CAVITY MODEL (BRODE, 1988) ****************************************

Project 02-215W 65 RWDI West Inc.
*** CAVITY CALCULATION - 1 *** *** CAVITY CALCULATION - 2 *** CONC (UG/M**3) = 546.1 CONC (UG/M**3) = 546.1 CRIT WS @10M (M/S) = 1.00 CRIT WS @10M (M/S) = 1.00 CRIT WS @ HS (M/S) = 1.01 CRIT WS @ HS (M/S) = 1.01 DILUTION WS (M/S) = 1.00 DILUTION WS (M/S) = 1.00 CAVITY HT (M) = 13.77 CAVITY HT (M) = 13.77 CAVITY LENGTH (M) = 8.42 CAVITY LENGTH (M) = 8.42 ALONGWIND DIM (M) = 3.34 ALONGWIND DIM (M) = 3.34 **************************************** END OF CAVITY CALCULATIONS **************************************** *************************************** *** SUMMARY OF SCREEN MODEL RESULTS *** *************************************** CALCULATION MAX CONC DIST TO TERRAIN PROCEDURE (UG/M**3) MAX (M) HT (M) -------------- ----------- ------- ------- SIMPLE TERRAIN 107.9 50. 0. BLDG. CAVITY-1 546.1 8. -- (DIST = CAVITY LENGTH) BLDG. CAVITY-2 546.1 8. -- (DIST = CAVITY LENGTH) *************************************************** ** REMEMBER TO INCLUDE BACKGROUND CONCENTRATIONS ** ***************************************************
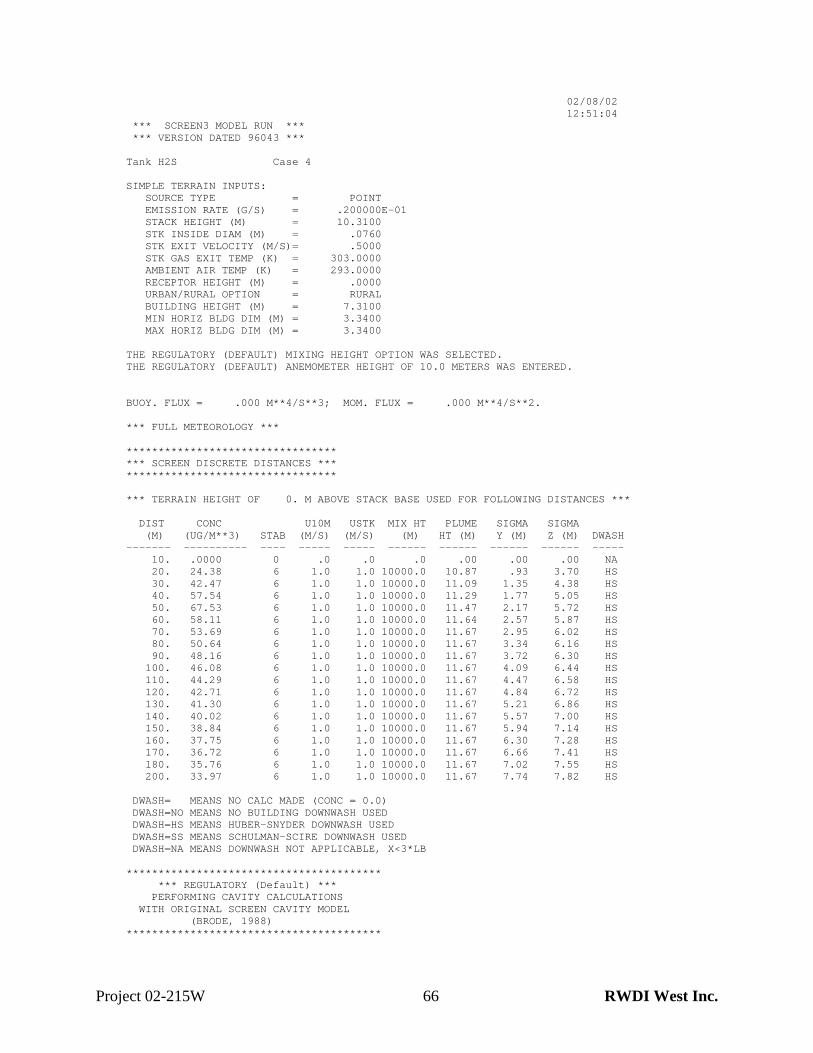
Project 02-215W 66 RWDI West Inc.
02/08/02 12:51:04 *** SCREEN3 MODEL RUN *** *** VERSION DATED 96043 *** Tank H2S Case 4 SIMPLE TERRAIN INPUTS: SOURCE TYPE = POINT EMISSION RATE (G/S) = .200000E-01 STACK HEIGHT (M) = 10.3100 STK INSIDE DIAM (M) = .0760 STK EXIT VELOCITY (M/S)= .5000 STK GAS EXIT TEMP (K) = 303.0000 AMBIENT AIR TEMP (K) = 293.0000 RECEPTOR HEIGHT (M) = .0000 URBAN/RURAL OPTION = RURAL BUILDING HEIGHT (M) = 7.3100 MIN HORIZ BLDG DIM (M) = 3.3400 MAX HORIZ BLDG DIM (M) = 3.3400 THE REGULATORY (DEFAULT) MIXING HEIGHT OPTION WAS SELECTED. THE REGULATORY (DEFAULT) ANEMOMETER HEIGHT OF 10.0 METERS WAS ENTERED. BUOY. FLUX = .000 M**4/S**3; MOM. FLUX = .000 M**4/S**2. *** FULL METEOROLOGY *** ********************************* *** SCREEN DISCRETE DISTANCES *** ********************************* *** TERRAIN HEIGHT OF 0. M ABOVE STACK BASE USED FOR FOLLOWING DISTANCES *** DIST CONC U10M USTK MIX HT PLUME SIGMA SIGMA (M) (UG/M**3) STAB (M/S) (M/S) (M) HT (M) Y (M) Z (M) DWASH ------- ---------- ---- ----- ----- ------ ------ ------ ------ ----- 10. .0000 0 .0 .0 .0 .00 .00 .00 NA 20. 24.38 6 1.0 1.0 10000.0 10.87 .93 3.70 HS 30. 42.47 6 1.0 1.0 10000.0 11.09 1.35 4.38 HS 40. 57.54 6 1.0 1.0 10000.0 11.29 1.77 5.05 HS 50. 67.53 6 1.0 1.0 10000.0 11.47 2.17 5.72 HS 60. 58.11 6 1.0 1.0 10000.0 11.64 2.57 5.87 HS 70. 53.69 6 1.0 1.0 10000.0 11.67 2.95 6.02 HS 80. 50.64 6 1.0 1.0 10000.0 11.67 3.34 6.16 HS 90. 48.16 6 1.0 1.0 10000.0 11.67 3.72 6.30 HS 100. 46.08 6 1.0 1.0 10000.0 11.67 4.09 6.44 HS 110. 44.29 6 1.0 1.0 10000.0 11.67 4.47 6.58 HS 120. 42.71 6 1.0 1.0 10000.0 11.67 4.84 6.72 HS 130. 41.30 6 1.0 1.0 10000.0 11.67 5.21 6.86 HS 140. 40.02 6 1.0 1.0 10000.0 11.67 5.57 7.00 HS 150. 38.84 6 1.0 1.0 10000.0 11.67 5.94 7.14 HS 160. 37.75 6 1.0 1.0 10000.0 11.67 6.30 7.28 HS 170. 36.72 6 1.0 1.0 10000.0 11.67 6.66 7.41 HS 180. 35.76 6 1.0 1.0 10000.0 11.67 7.02 7.55 HS 200. 33.97 6 1.0 1.0 10000.0 11.67 7.74 7.82 HS DWASH= MEANS NO CALC MADE (CONC = 0.0) DWASH=NO MEANS NO BUILDING DOWNWASH USED DWASH=HS MEANS HUBER-SNYDER DOWNWASH USED DWASH=SS MEANS SCHULMAN-SCIRE DOWNWASH USED DWASH=NA MEANS DOWNWASH NOT APPLICABLE, X<3*LB **************************************** *** REGULATORY (Default) *** PERFORMING CAVITY CALCULATIONS WITH ORIGINAL SCREEN CAVITY MODEL (BRODE, 1988) ****************************************

Project 02-215W 67 RWDI West Inc.
*** CAVITY CALCULATION - 1 *** *** CAVITY CALCULATION - 2 *** CONC (UG/M**3) = 546.1 CONC (UG/M**3) = 546.1 CRIT WS @10M (M/S) = 1.00 CRIT WS @10M (M/S) = 1.00 CRIT WS @ HS (M/S) = 1.01 CRIT WS @ HS (M/S) = 1.01 DILUTION WS (M/S) = 1.00 DILUTION WS (M/S) = 1.00 CAVITY HT (M) = 13.77 CAVITY HT (M) = 13.77 CAVITY LENGTH (M) = 8.42 CAVITY LENGTH (M) = 8.42 ALONGWIND DIM (M) = 3.34 ALONGWIND DIM (M) = 3.34 **************************************** END OF CAVITY CALCULATIONS **************************************** *************************************** *** SUMMARY OF SCREEN MODEL RESULTS *** *************************************** CALCULATION MAX CONC DIST TO TERRAIN PROCEDURE (UG/M**3) MAX (M) HT (M) -------------- ----------- ------- ------- SIMPLE TERRAIN 67.53 50. 0. BLDG. CAVITY-1 546.1 8. -- (DIST = CAVITY LENGTH) BLDG. CAVITY-2 546.1 8. -- (DIST = CAVITY LENGTH) *************************************************** ** REMEMBER TO INCLUDE BACKGROUND CONCENTRATIONS ** ***************************************************

Project 02-215W 68 RWDI West Inc.
Input Cases: The following RECEPTOR/SIMPLE TERRAIN examples are provided: Source Parameters Case 1 Case 2 Case 3 Case 4 Stack height (m) 12 12 12 12
Stack diameter (m) 0.30 0.30 0.30 0.30 Stack gas exit velocity (m/s)
2.5 2.5 2.5 2.5
Stack gas exit temperature (K)
573 573 573 573
SO2 emission rate (g/s) 0.5 0.5 0.5 0.5
Meteorology Full Full Full Full
Ambient Temperature (K) 293 293 293 293
Dispersion Rural Rural Rural Rural
Receptors Automated Automated Automated Discrete Terrain Flat Simple A Simple B Simple Elevations (Elevation: Distance Range)
0 m: 100 to 5000 m 10 m: 100 to 5000 m 0 m: 100 to 200 m 4 m: 200 to 500 m 6 m: 500 to 1000 m
10 m: 1000 to 5000 m
Various
Minimum/Maximum Distances (m)
100 5000
100 5000
100 5000
100 5000
Input values that have changed from the Base Case (Case 1) are shown in boldface text.

Project 02-215W 69 RWDI West Inc.
Interpretation: Case Case 1 Case 2 Case 3 Case 4
Maximum SO2 (µg/m3) 174 955 249 194
Downwind distance (m) 196 100 261 300 PG Stability Class C (3) D (4) D (4) D (4) 10-m Wind Speed (m/s) 1.0 2.0 1.0 1.0
Mixing Height (m) 320 640 320 320 Input values that have changed from the Base Case (Case 1) are shown in boldface text.
Case 1 is a base case flat terrain case assuming automated receptors between 100 and 5000 m. Case 2 conservatively assumes all terrain is 10 m above stack base for the automated receptors.. Case 3 treats the elevated receptors as a series of “steps”. Case 4 uses discrete receptors to represent the actual terrain. If the receptor spacing is too big, the user may not see the peak value.

Project 02-215W 70 RWDI West Inc.
02/09/02 13:01:49 *** SCREEN3 MODEL RUN *** *** VERSION DATED 96043 *** Receptor/Terrain Case 1 Flat SIMPLE TERRAIN INPUTS: SOURCE TYPE = POINT EMISSION RATE (G/S) = .500000 STACK HEIGHT (M) = 12.0000 STK INSIDE DIAM (M) = .3000 STK EXIT VELOCITY (M/S)= 2.5000 STK GAS EXIT TEMP (K) = 573.0000 AMBIENT AIR TEMP (K) = 293.0000 RECEPTOR HEIGHT (M) = .0000 URBAN/RURAL OPTION = RURAL BUILDING HEIGHT (M) = .0000 MIN HORIZ BLDG DIM (M) = .0000 MAX HORIZ BLDG DIM (M) = .0000 THE REGULATORY (DEFAULT) MIXING HEIGHT OPTION WAS SELECTED. THE REGULATORY (DEFAULT) ANEMOMETER HEIGHT OF 10.0 METERS WAS ENTERED. BUOY. FLUX = .270 M**4/S**3; MOM. FLUX = .072 M**4/S**2. *** FULL METEOROLOGY *** ********************************** *** SCREEN AUTOMATED DISTANCES *** ********************************** *** TERRAIN HEIGHT OF 0. M ABOVE STACK BASE USED FOR FOLLOWING DISTANCES *** DIST CONC U10M USTK MIX HT PLUME SIGMA SIGMA (M) (UG/M**3) STAB (M/S) (M/S) (M) HT (M) Y (M) Z (M) DWASH ------- ---------- ---- ----- ----- ------ ------ ------ ------ ----- 100. 152.9 1 1.0 1.0 320.0 19.91 26.95 14.13 NO 200. 174.3 3 1.0 1.0 320.0 19.87 23.73 14.21 NO 300. 151.6 4 1.0 1.0 320.0 19.80 22.72 12.30 NO 400. 149.2 4 1.0 1.0 320.0 19.80 29.54 15.43 NO 500. 130.3 4 1.0 1.0 320.0 19.80 36.21 18.43 NO 600. 110.3 4 1.0 1.0 320.0 19.80 42.78 21.33 NO 700. 93.08 4 1.0 1.0 320.0 19.80 49.24 24.14 NO 800. 78.98 4 1.0 1.0 320.0 19.80 55.62 26.87 NO 900. 67.62 4 1.0 1.0 320.0 19.80 61.92 29.55 NO 1000. 58.44 4 1.0 1.0 320.0 19.80 68.16 32.17 NO 1100. 51.96 6 1.0 1.1 10000.0 27.41 37.22 15.46 NO 1200. 53.16 6 1.0 1.1 10000.0 27.41 40.26 16.26 NO 1300. 53.60 6 1.0 1.1 10000.0 27.41 43.27 17.05 NO 1400. 53.49 6 1.0 1.1 10000.0 27.41 46.26 17.81 NO 1500. 52.96 6 1.0 1.1 10000.0 27.41 49.23 18.56 NO 1600. 52.13 6 1.0 1.1 10000.0 27.41 52.18 19.29 NO 1700. 51.08 6 1.0 1.1 10000.0 27.41 55.12 20.01 NO 1800. 49.89 6 1.0 1.1 10000.0 27.41 58.03 20.71 NO 1900. 48.61 6 1.0 1.1 10000.0 27.41 60.94 21.39 NO 2000. 47.27 6 1.0 1.1 10000.0 27.41 63.83 22.07 NO 2100. 45.82 6 1.0 1.1 10000.0 27.41 66.70 22.64 NO 2200. 44.40 6 1.0 1.1 10000.0 27.41 69.56 23.20 NO 2300. 43.01 6 1.0 1.1 10000.0 27.41 72.41 23.75 NO 2400. 41.67 6 1.0 1.1 10000.0 27.41 75.25 24.29 NO 2500. 40.38 6 1.0 1.1 10000.0 27.41 78.07 24.82 NO 2600. 39.13 6 1.0 1.1 10000.0 27.41 80.88 25.34 NO 2700. 37.93 6 1.0 1.1 10000.0 27.41 83.69 25.85 NO 2800. 36.78 6 1.0 1.1 10000.0 27.41 86.48 26.35 NO 2900. 35.68 6 1.0 1.1 10000.0 27.41 89.26 26.85 NO 3000. 34.62 6 1.0 1.1 10000.0 27.41 92.03 27.33 NO 3500. 30.00 6 1.0 1.1 10000.0 27.41 105.74 29.31 NO 4000. 26.32 6 1.0 1.1 10000.0 27.41 119.25 31.15 NO 4500. 23.34 6 1.0 1.1 10000.0 27.41 132.58 32.87 NO

Project 02-215W 71 RWDI West Inc.
5000. 20.89 6 1.0 1.1 10000.0 27.41 145.74 34.49 NO MAXIMUM 1-HR CONCENTRATION AT OR BEYOND 100. M: 196. 174.4 3 1.0 1.0 320.0 19.87 23.40 14.02 NO DWASH= MEANS NO CALC MADE (CONC = 0.0) DWASH=NO MEANS NO BUILDING DOWNWASH USED DWASH=HS MEANS HUBER-SNYDER DOWNWASH USED DWASH=SS MEANS SCHULMAN-SCIRE DOWNWASH USED DWASH=NA MEANS DOWNWASH NOT APPLICABLE, X<3*LB *************************************** *** SUMMARY OF SCREEN MODEL RESULTS *** *************************************** CALCULATION MAX CONC DIST TO TERRAIN PROCEDURE (UG/M**3) MAX (M) HT (M) -------------- ----------- ------- ------- SIMPLE TERRAIN 174.4 196. 0. *************************************************** ** REMEMBER TO INCLUDE BACKGROUND CONCENTRATIONS ** ***************************************************

Project 02-215W 72 RWDI West Inc.
02/09/02 13:07:00 *** SCREEN3 MODEL RUN *** *** VERSION DATED 96043 *** Receptor/Terrain Case 2 Simple A SIMPLE TERRAIN INPUTS: SOURCE TYPE = POINT EMISSION RATE (G/S) = .500000 STACK HEIGHT (M) = 12.0000 STK INSIDE DIAM (M) = .3000 STK EXIT VELOCITY (M/S)= 2.5000 STK GAS EXIT TEMP (K) = 573.0000 AMBIENT AIR TEMP (K) = 293.0000 RECEPTOR HEIGHT (M) = .0000 URBAN/RURAL OPTION = RURAL BUILDING HEIGHT (M) = .0000 MIN HORIZ BLDG DIM (M) = .0000 MAX HORIZ BLDG DIM (M) = .0000 THE REGULATORY (DEFAULT) MIXING HEIGHT OPTION WAS SELECTED. THE REGULATORY (DEFAULT) ANEMOMETER HEIGHT OF 10.0 METERS WAS ENTERED. BUOY. FLUX = .270 M**4/S**3; MOM. FLUX = .072 M**4/S**2. *** FULL METEOROLOGY *** ********************************** *** SCREEN AUTOMATED DISTANCES *** ********************************** *** TERRAIN HEIGHT OF 10. M ABOVE STACK BASE USED FOR FOLLOWING DISTANCES *** DIST CONC U10M USTK MIX HT PLUME SIGMA SIGMA (M) (UG/M**3) STAB (M/S) (M/S) (M) HT (M) Y (M) Z (M) DWASH ------- ---------- ---- ----- ----- ------ ------ ------ ------ ----- 100. 954.6 4 2.0 2.1 640.0 5.73 8.28 4.78 NO 200. 602.0 4 1.0 1.0 320.0 9.80 15.72 8.79 NO 300. 403.5 4 1.0 1.0 320.0 9.80 22.72 12.30 NO 400. 277.7 4 1.0 1.0 320.0 9.80 29.54 15.43 NO 500. 201.4 4 1.0 1.0 320.0 9.80 36.21 18.43 NO 600. 163.6 6 1.0 1.1 10000.0 17.41 21.69 10.64 NO 700. 165.1 6 1.0 1.1 10000.0 17.41 24.85 11.78 NO 800. 159.0 6 1.0 1.1 10000.0 17.41 27.98 12.76 NO 900. 150.8 6 1.0 1.1 10000.0 17.41 31.09 13.71 NO 1000. 141.9 6 1.0 1.1 10000.0 17.41 34.17 14.63 NO 1100. 132.7 6 1.0 1.1 10000.0 17.41 37.22 15.46 NO 1200. 124.0 6 1.0 1.1 10000.0 17.41 40.26 16.26 NO 1300. 115.9 6 1.0 1.1 10000.0 17.41 43.27 17.05 NO 1400. 108.4 6 1.0 1.1 10000.0 17.41 46.26 17.81 NO 1500. 101.5 6 1.0 1.1 10000.0 17.41 49.23 18.56 NO 1600. 95.19 6 1.0 1.1 10000.0 17.41 52.18 19.29 NO 1700. 89.42 6 1.0 1.1 10000.0 17.41 55.12 20.01 NO 1800. 84.14 6 1.0 1.1 10000.0 17.41 58.03 20.71 NO 1900. 79.30 6 1.0 1.1 10000.0 17.41 60.94 21.39 NO 2000. 74.88 6 1.0 1.1 10000.0 17.41 63.83 22.07 NO 2100. 70.93 6 1.0 1.1 10000.0 17.41 66.70 22.64 NO 2200. 67.32 6 1.0 1.1 10000.0 17.41 69.56 23.20 NO 2300. 63.99 6 1.0 1.1 10000.0 17.41 72.41 23.75 NO 2400. 60.93 6 1.0 1.1 10000.0 17.41 75.25 24.29 NO 2500. 58.10 6 1.0 1.1 10000.0 17.41 78.07 24.82 NO 2600. 55.48 6 1.0 1.1 10000.0 17.41 80.88 25.34 NO 2700. 53.05 6 1.0 1.1 10000.0 17.41 83.69 25.85 NO 2800. 50.79 6 1.0 1.1 10000.0 17.41 86.48 26.35 NO 2900. 48.69 6 1.0 1.1 10000.0 17.41 89.26 26.85 NO 3000. 46.73 6 1.0 1.1 10000.0 17.41 92.03 27.33 NO 3500. 38.94 6 1.0 1.1 10000.0 17.41 105.74 29.31 NO 4000. 33.15 6 1.0 1.1 10000.0 17.41 119.25 31.15 NO 4500. 28.72 6 1.0 1.1 10000.0 17.41 132.58 32.87 NO

Project 02-215W 73 RWDI West Inc.
5000. 25.22 6 1.0 1.1 10000.0 17.41 145.74 34.49 NO MAXIMUM 1-HR CONCENTRATION AT OR BEYOND 100. M: 100. 954.6 4 2.0 2.1 640.0 5.73 8.28 4.78 NO DWASH= MEANS NO CALC MADE (CONC = 0.0) DWASH=NO MEANS NO BUILDING DOWNWASH USED DWASH=HS MEANS HUBER-SNYDER DOWNWASH USED DWASH=SS MEANS SCHULMAN-SCIRE DOWNWASH USED DWASH=NA MEANS DOWNWASH NOT APPLICABLE, X<3*LB ******************************************** * SUMMARY OF TERRAIN HEIGHTS ENTERED FOR * * SIMPLE ELEVATED TERRAIN PROCEDURE * ******************************************** TERRAIN DISTANCE RANGE (M) HT (M) MINIMUM MAXIMUM ------- -------- -------- 10. 100. 5000. *************************************** *** SUMMARY OF SCREEN MODEL RESULTS *** *************************************** CALCULATION MAX CONC DIST TO TERRAIN PROCEDURE (UG/M**3) MAX (M) HT (M) -------------- ----------- ------- ------- SIMPLE TERRAIN 954.6 100. 10. *************************************************** ** REMEMBER TO INCLUDE BACKGROUND CONCENTRATIONS ** ***************************************************

Project 02-215W 74 RWDI West Inc.
02/09/02 13:10:15 *** SCREEN3 MODEL RUN *** *** VERSION DATED 96043 *** Receptor/Terrain Case 3 Simple B SIMPLE TERRAIN INPUTS: SOURCE TYPE = POINT EMISSION RATE (G/S) = .500000 STACK HEIGHT (M) = 12.0000 STK INSIDE DIAM (M) = .3000 STK EXIT VELOCITY (M/S)= 2.5000 STK GAS EXIT TEMP (K) = 573.0000 AMBIENT AIR TEMP (K) = 293.0000 RECEPTOR HEIGHT (M) = .0000 URBAN/RURAL OPTION = RURAL BUILDING HEIGHT (M) = .0000 MIN HORIZ BLDG DIM (M) = .0000 MAX HORIZ BLDG DIM (M) = .0000 THE REGULATORY (DEFAULT) MIXING HEIGHT OPTION WAS SELECTED. THE REGULATORY (DEFAULT) ANEMOMETER HEIGHT OF 10.0 METERS WAS ENTERED. BUOY. FLUX = .270 M**4/S**3; MOM. FLUX = .072 M**4/S**2. *** FULL METEOROLOGY *** ********************************** *** SCREEN AUTOMATED DISTANCES *** ********************************** *** TERRAIN HEIGHT OF 0. M ABOVE STACK BASE USED FOR FOLLOWING DISTANCES *** DIST CONC U10M USTK MIX HT PLUME SIGMA SIGMA (M) (UG/M**3) STAB (M/S) (M/S) (M) HT (M) Y (M) Z (M) DWASH ------- ---------- ---- ----- ----- ------ ------ ------ ------ ----- 100. 152.9 1 1.0 1.0 320.0 19.91 26.95 14.13 NO 200. 174.3 3 1.0 1.0 320.0 19.87 23.73 14.21 NO MAXIMUM 1-HR CONCENTRATION AT OR BEYOND 100. M: 196. 174.4 3 1.0 1.0 320.0 19.87 23.40 14.02 NO ********************************** *** SCREEN AUTOMATED DISTANCES *** ********************************** *** TERRAIN HEIGHT OF 4. M ABOVE STACK BASE USED FOR FOLLOWING DISTANCES *** DIST CONC U10M USTK MIX HT PLUME SIGMA SIGMA (M) (UG/M**3) STAB (M/S) (M/S) (M) HT (M) Y (M) Z (M) DWASH ------- ---------- ---- ----- ----- ------ ------ ------ ------ ----- 200. 248.4 3 1.0 1.0 320.0 15.87 23.73 14.21 NO 300. 242.8 4 1.0 1.0 320.0 15.80 22.72 12.30 NO 400. 201.2 4 1.0 1.0 320.0 15.80 29.54 15.43 NO 500. 160.7 4 1.0 1.0 320.0 15.80 36.21 18.43 NO MAXIMUM 1-HR CONCENTRATION AT OR BEYOND 200. M: 261. 249.4 4 1.0 1.0 320.0 15.80 20.08 10.98 NO ********************************** *** SCREEN AUTOMATED DISTANCES *** ********************************** *** TERRAIN HEIGHT OF 6. M ABOVE STACK BASE USED FOR FOLLOWING DISTANCES *** DIST CONC U10M USTK MIX HT PLUME SIGMA SIGMA (M) (UG/M**3) STAB (M/S) (M/S) (M) HT (M) Y (M) Z (M) DWASH ------- ---------- ---- ----- ----- ------ ------ ------ ------ ----- 500. 175.3 4 1.0 1.0 320.0 13.80 36.21 18.43 NO
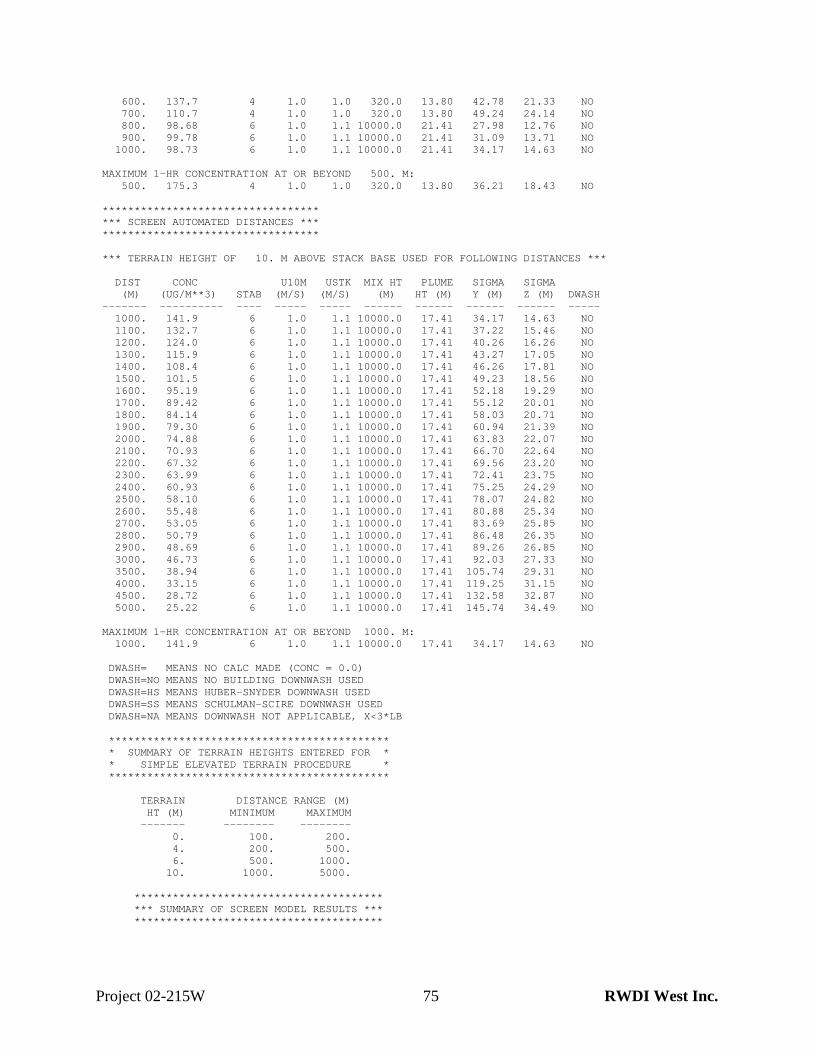
Project 02-215W 75 RWDI West Inc.
600. 137.7 4 1.0 1.0 320.0 13.80 42.78 21.33 NO 700. 110.7 4 1.0 1.0 320.0 13.80 49.24 24.14 NO 800. 98.68 6 1.0 1.1 10000.0 21.41 27.98 12.76 NO 900. 99.78 6 1.0 1.1 10000.0 21.41 31.09 13.71 NO 1000. 98.73 6 1.0 1.1 10000.0 21.41 34.17 14.63 NO MAXIMUM 1-HR CONCENTRATION AT OR BEYOND 500. M: 500. 175.3 4 1.0 1.0 320.0 13.80 36.21 18.43 NO ********************************** *** SCREEN AUTOMATED DISTANCES *** ********************************** *** TERRAIN HEIGHT OF 10. M ABOVE STACK BASE USED FOR FOLLOWING DISTANCES *** DIST CONC U10M USTK MIX HT PLUME SIGMA SIGMA (M) (UG/M**3) STAB (M/S) (M/S) (M) HT (M) Y (M) Z (M) DWASH ------- ---------- ---- ----- ----- ------ ------ ------ ------ ----- 1000. 141.9 6 1.0 1.1 10000.0 17.41 34.17 14.63 NO 1100. 132.7 6 1.0 1.1 10000.0 17.41 37.22 15.46 NO 1200. 124.0 6 1.0 1.1 10000.0 17.41 40.26 16.26 NO 1300. 115.9 6 1.0 1.1 10000.0 17.41 43.27 17.05 NO 1400. 108.4 6 1.0 1.1 10000.0 17.41 46.26 17.81 NO 1500. 101.5 6 1.0 1.1 10000.0 17.41 49.23 18.56 NO 1600. 95.19 6 1.0 1.1 10000.0 17.41 52.18 19.29 NO 1700. 89.42 6 1.0 1.1 10000.0 17.41 55.12 20.01 NO 1800. 84.14 6 1.0 1.1 10000.0 17.41 58.03 20.71 NO 1900. 79.30 6 1.0 1.1 10000.0 17.41 60.94 21.39 NO 2000. 74.88 6 1.0 1.1 10000.0 17.41 63.83 22.07 NO 2100. 70.93 6 1.0 1.1 10000.0 17.41 66.70 22.64 NO 2200. 67.32 6 1.0 1.1 10000.0 17.41 69.56 23.20 NO 2300. 63.99 6 1.0 1.1 10000.0 17.41 72.41 23.75 NO 2400. 60.93 6 1.0 1.1 10000.0 17.41 75.25 24.29 NO 2500. 58.10 6 1.0 1.1 10000.0 17.41 78.07 24.82 NO 2600. 55.48 6 1.0 1.1 10000.0 17.41 80.88 25.34 NO 2700. 53.05 6 1.0 1.1 10000.0 17.41 83.69 25.85 NO 2800. 50.79 6 1.0 1.1 10000.0 17.41 86.48 26.35 NO 2900. 48.69 6 1.0 1.1 10000.0 17.41 89.26 26.85 NO 3000. 46.73 6 1.0 1.1 10000.0 17.41 92.03 27.33 NO 3500. 38.94 6 1.0 1.1 10000.0 17.41 105.74 29.31 NO 4000. 33.15 6 1.0 1.1 10000.0 17.41 119.25 31.15 NO 4500. 28.72 6 1.0 1.1 10000.0 17.41 132.58 32.87 NO 5000. 25.22 6 1.0 1.1 10000.0 17.41 145.74 34.49 NO MAXIMUM 1-HR CONCENTRATION AT OR BEYOND 1000. M: 1000. 141.9 6 1.0 1.1 10000.0 17.41 34.17 14.63 NO DWASH= MEANS NO CALC MADE (CONC = 0.0) DWASH=NO MEANS NO BUILDING DOWNWASH USED DWASH=HS MEANS HUBER-SNYDER DOWNWASH USED DWASH=SS MEANS SCHULMAN-SCIRE DOWNWASH USED DWASH=NA MEANS DOWNWASH NOT APPLICABLE, X<3*LB ******************************************** * SUMMARY OF TERRAIN HEIGHTS ENTERED FOR * * SIMPLE ELEVATED TERRAIN PROCEDURE * ******************************************** TERRAIN DISTANCE RANGE (M) HT (M) MINIMUM MAXIMUM ------- -------- -------- 0. 100. 200. 4. 200. 500. 6. 500. 1000. 10. 1000. 5000. *************************************** *** SUMMARY OF SCREEN MODEL RESULTS *** ***************************************
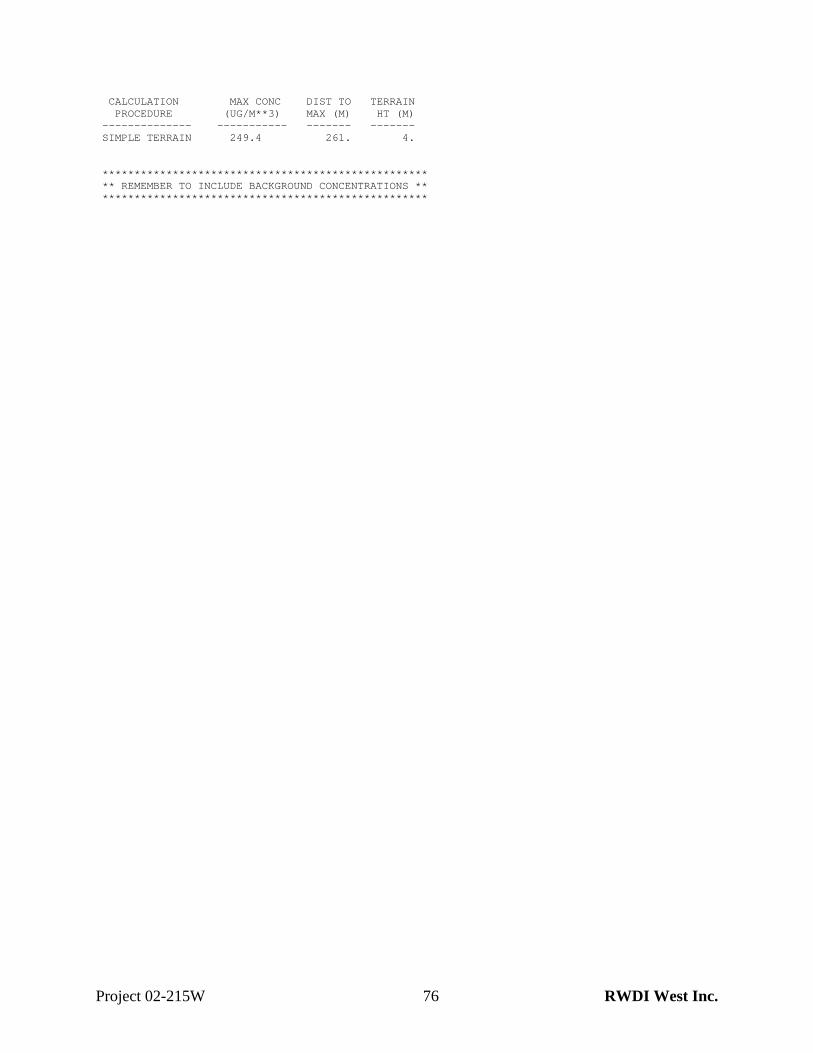
Project 02-215W 76 RWDI West Inc.
CALCULATION MAX CONC DIST TO TERRAIN PROCEDURE (UG/M**3) MAX (M) HT (M) -------------- ----------- ------- ------- SIMPLE TERRAIN 249.4 261. 4. *************************************************** ** REMEMBER TO INCLUDE BACKGROUND CONCENTRATIONS ** ***************************************************
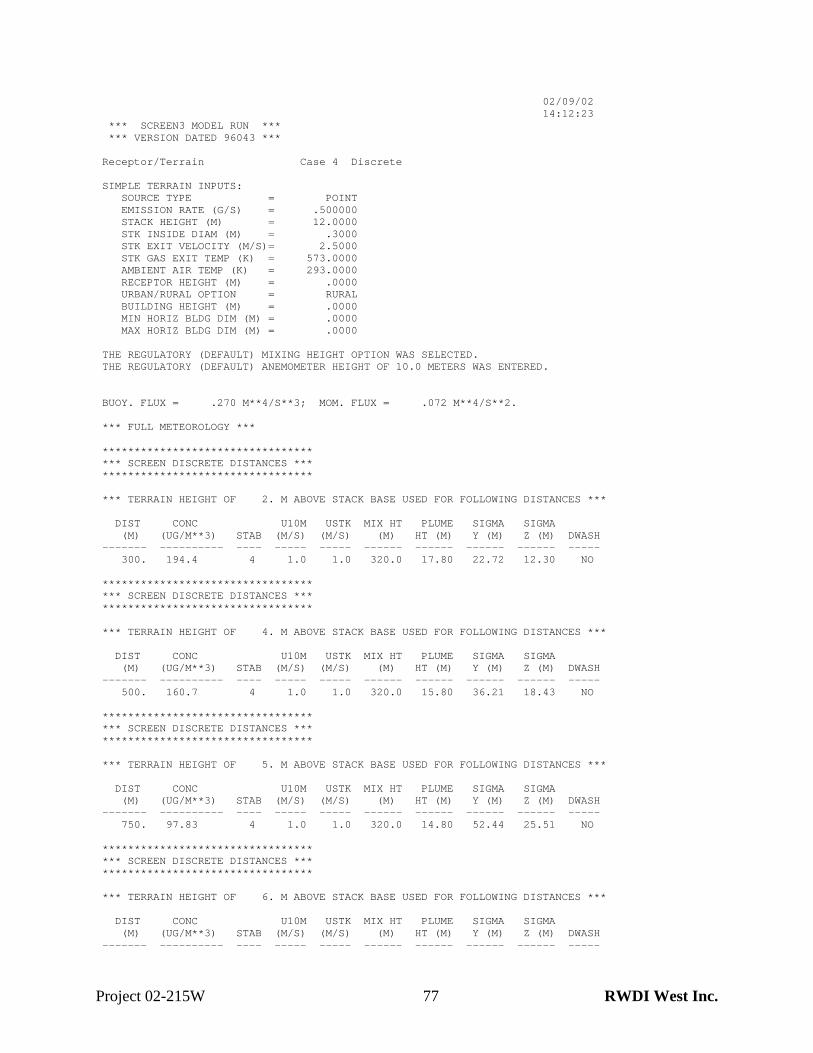
Project 02-215W 77 RWDI West Inc.
02/09/02 14:12:23 *** SCREEN3 MODEL RUN *** *** VERSION DATED 96043 *** Receptor/Terrain Case 4 Discrete SIMPLE TERRAIN INPUTS: SOURCE TYPE = POINT EMISSION RATE (G/S) = .500000 STACK HEIGHT (M) = 12.0000 STK INSIDE DIAM (M) = .3000 STK EXIT VELOCITY (M/S)= 2.5000 STK GAS EXIT TEMP (K) = 573.0000 AMBIENT AIR TEMP (K) = 293.0000 RECEPTOR HEIGHT (M) = .0000 URBAN/RURAL OPTION = RURAL BUILDING HEIGHT (M) = .0000 MIN HORIZ BLDG DIM (M) = .0000 MAX HORIZ BLDG DIM (M) = .0000 THE REGULATORY (DEFAULT) MIXING HEIGHT OPTION WAS SELECTED. THE REGULATORY (DEFAULT) ANEMOMETER HEIGHT OF 10.0 METERS WAS ENTERED. BUOY. FLUX = .270 M**4/S**3; MOM. FLUX = .072 M**4/S**2. *** FULL METEOROLOGY *** ********************************* *** SCREEN DISCRETE DISTANCES *** ********************************* *** TERRAIN HEIGHT OF 2. M ABOVE STACK BASE USED FOR FOLLOWING DISTANCES *** DIST CONC U10M USTK MIX HT PLUME SIGMA SIGMA (M) (UG/M**3) STAB (M/S) (M/S) (M) HT (M) Y (M) Z (M) DWASH ------- ---------- ---- ----- ----- ------ ------ ------ ------ ----- 300. 194.4 4 1.0 1.0 320.0 17.80 22.72 12.30 NO ********************************* *** SCREEN DISCRETE DISTANCES *** ********************************* *** TERRAIN HEIGHT OF 4. M ABOVE STACK BASE USED FOR FOLLOWING DISTANCES *** DIST CONC U10M USTK MIX HT PLUME SIGMA SIGMA (M) (UG/M**3) STAB (M/S) (M/S) (M) HT (M) Y (M) Z (M) DWASH ------- ---------- ---- ----- ----- ------ ------ ------ ------ ----- 500. 160.7 4 1.0 1.0 320.0 15.80 36.21 18.43 NO ********************************* *** SCREEN DISCRETE DISTANCES *** ********************************* *** TERRAIN HEIGHT OF 5. M ABOVE STACK BASE USED FOR FOLLOWING DISTANCES *** DIST CONC U10M USTK MIX HT PLUME SIGMA SIGMA (M) (UG/M**3) STAB (M/S) (M/S) (M) HT (M) Y (M) Z (M) DWASH ------- ---------- ---- ----- ----- ------ ------ ------ ------ ----- 750. 97.83 4 1.0 1.0 320.0 14.80 52.44 25.51 NO ********************************* *** SCREEN DISCRETE DISTANCES *** ********************************* *** TERRAIN HEIGHT OF 6. M ABOVE STACK BASE USED FOR FOLLOWING DISTANCES *** DIST CONC U10M USTK MIX HT PLUME SIGMA SIGMA (M) (UG/M**3) STAB (M/S) (M/S) (M) HT (M) Y (M) Z (M) DWASH ------- ---------- ---- ----- ----- ------ ------ ------ ------ -----

Project 02-215W 78 RWDI West Inc.
1000. 98.73 6 1.0 1.1 10000.0 21.41 34.17 14.63 NO ********************************* *** SCREEN DISCRETE DISTANCES *** ********************************* *** TERRAIN HEIGHT OF 8. M ABOVE STACK BASE USED FOR FOLLOWING DISTANCES *** DIST CONC U10M USTK MIX HT PLUME SIGMA SIGMA (M) (UG/M**3) STAB (M/S) (M/S) (M) HT (M) Y (M) Z (M) DWASH ------- ---------- ---- ----- ----- ------ ------ ------ ------ ----- 2500. 54.73 6 1.0 1.1 10000.0 19.41 78.07 24.82 NO ********************************* *** SCREEN DISCRETE DISTANCES *** ********************************* *** TERRAIN HEIGHT OF 10. M ABOVE STACK BASE USED FOR FOLLOWING DISTANCES *** DIST CONC U10M USTK MIX HT PLUME SIGMA SIGMA (M) (UG/M**3) STAB (M/S) (M/S) (M) HT (M) Y (M) Z (M) DWASH ------- ---------- ---- ----- ----- ------ ------ ------ ------ ----- 5000. 25.22 6 1.0 1.1 10000.0 17.41 145.74 34.49 NO DWASH= MEANS NO CALC MADE (CONC = 0.0) DWASH=NO MEANS NO BUILDING DOWNWASH USED DWASH=HS MEANS HUBER-SNYDER DOWNWASH USED DWASH=SS MEANS SCHULMAN-SCIRE DOWNWASH USED DWASH=NA MEANS DOWNWASH NOT APPLICABLE, X<3*LB ******************************************** * SUMMARY OF TERRAIN HEIGHTS ENTERED FOR * * SIMPLE ELEVATED TERRAIN PROCEDURE * ******************************************** TERRAIN DISTANCE RANGE (M) HT (M) MINIMUM MAXIMUM ------- -------- -------- 2. 300. -- 4. 500. -- 5. 750. -- 6. 1000. -- 8. 2500. -- 10. 5000. -- *************************************** *** SUMMARY OF SCREEN MODEL RESULTS *** *************************************** CALCULATION MAX CONC DIST TO TERRAIN PROCEDURE (UG/M**3) MAX (M) HT (M) -------------- ----------- ------- ------- SIMPLE TERRAIN 194.4 300. 2. *************************************************** ** REMEMBER TO INCLUDE BACKGROUND CONCENTRATIONS ** ***************************************************

Project 02-215W 79 RWDI West Inc.
Input Cases: The following RECEPTOR/COMPLEX TERRAIN examples are provided:
Source Parameters Case 1 Case 2 Stack height (m) 12 12 Stack diameter (m) 0.30 0.30
Stack gas exit velocity (m/s) 2.5 2.5 Stack gas exit temperature (K) 573 573
SO2 emission rate (g/s) 0.5 0.5 Meteorology Full Full
Ambient Temperature (K) 293 293
Dispersion Rural Rural
Receptors Discrete Discrete Terrain Complex Complex and
Simple
Elevation Range: Distance Range
13 to 50 m: 100 to 250 m
3 to 50 m: 300 to 2200 m
Input values that have changed from the Base Case (Case 1) are shown in boldface text.

Project 02-215W 80 RWDI West Inc.
Interpretation: Case Case 1 Case 2
“VALLEY Model” Complex Predictions
Maximum 24-h average SO2 (Valley) (µg/m3) 14.52 14.52
Maximum 1-h average SO2 (Valley) (µg/m3) 58.1 58.1
Downwind distance (m) 300 300
“Simple” Complex Predictions
Maximum 24-h average SO2 (Simple) (µg/m3) 181.3 181.3
Maximum 1-h average SO2 (Simple) (µg/m3) 453 453
Downwind distance (m) 300 300
PG Stability Class D (4) D (4)
10-m Wind Speed (m/s) 1.0 1.0
Simple Predictions
Maximum 1-h average SO2 (µg/m3) - 580.2
Downwind distance (m) - 250 PG Stability Class - D (4) 10-m Wind Speed (m/s) - 1.0 Mixing Height (m) - 320 Output values that have changed from the Base Case (Case 1) are shown in boldface text.
The VALLEY Model” 24-h average complex terrain predictions must be multiplied by 4.0 to obtain a 1-h average prediction. The “Simple” 24-h average predictions must be multiplied by 2.5 to obtain a 1-h average prediction. Case 1 was run assuming complex terrain. Case 2 was run assuming the Case 1 complex terrain and for simple terrain.

Project 02-215W 81 RWDI West Inc.
02/09/02 14:30:15 *** SCREEN3 MODEL RUN *** *** VERSION DATED 96043 *** Receptor/Complex Terrain Case 1 COMPLEX TERRAIN INPUTS: SOURCE TYPE = POINT EMISSION RATE (G/S) = .500000 STACK HT (M) = 12.0000 STACK DIAMETER (M) = .3000 STACK VELOCITY (M/S) = 2.5000 STACK GAS TEMP (K) = 573.0000 AMBIENT AIR TEMP (K) = 293.0000 RECEPTOR HEIGHT (M) = .0000 URBAN/RURAL OPTION = RURAL THE REGULATORY (DEFAULT) MIXING HEIGHT OPTION WAS SELECTED. THE REGULATORY (DEFAULT) ANEMOMETER HEIGHT OF 10.0 METERS WAS ENTERED. BUOY. FLUX = .270 M**4/S**3; MOM. FLUX = .072 M**4/S**2. FINAL STABLE PLUME HEIGHT (M) = 23.4 DISTANCE TO FINAL RISE (M) = 151.3 *VALLEY 24-HR CALCS* **SIMPLE TERRAIN 24-HR CALCS** TERR MAX 24-HR PLUME HT PLUME HT HT DIST CONC CONC ABOVE STK CONC ABOVE STK U10M USTK (M) (M) (UG/M**3) (UG/M**3) BASE (M) (UG/M**3) HGT (M) SC (M/S) ----- ------- ---------- ---------- ------ ---------- ------ -- ---- ---- 13. 300. 181.3 14.52 23.4 181.3 7.8 4 1.0 1.0 14. 600. 87.45 10.26 23.4 87.45 15.4 6 1.0 1.1 15. 700. 83.64 8.660 23.4 83.64 15.4 6 1.0 1.1 17. 800. 77.79 7.391 23.4 77.79 15.4 6 1.0 1.1 20. 900. 71.84 6.375 23.4 71.84 15.4 6 1.0 1.1 24. 1000. 5.554 5.554 23.4 .0000 .0 0 .0 .0 28. 1200. 4.351 4.351 23.4 .0000 .0 0 .0 .0 30. 1400. 3.511 3.511 23.4 .0000 .0 0 .0 .0 35. 1600. 2.901 2.901 23.4 .0000 .0 0 .0 .0 40. 1800. 2.444 2.444 23.4 .0000 .0 0 .0 .0 45. 2000. 2.091 2.091 23.4 .0000 .0 0 .0 .0 50. 2200. 1.825 1.825 23.4 .0000 .0 0 .0 .0 *************************************** *** SUMMARY OF SCREEN MODEL RESULTS *** *************************************** CALCULATION MAX CONC DIST TO TERRAIN PROCEDURE (UG/M**3) MAX (M) HT (M) -------------- ----------- ------- ------- COMPLEX TERRAIN 181.3 300. 13. (24-HR CONC) *************************************************** ** REMEMBER TO INCLUDE BACKGROUND CONCENTRATIONS ** ***************************************************
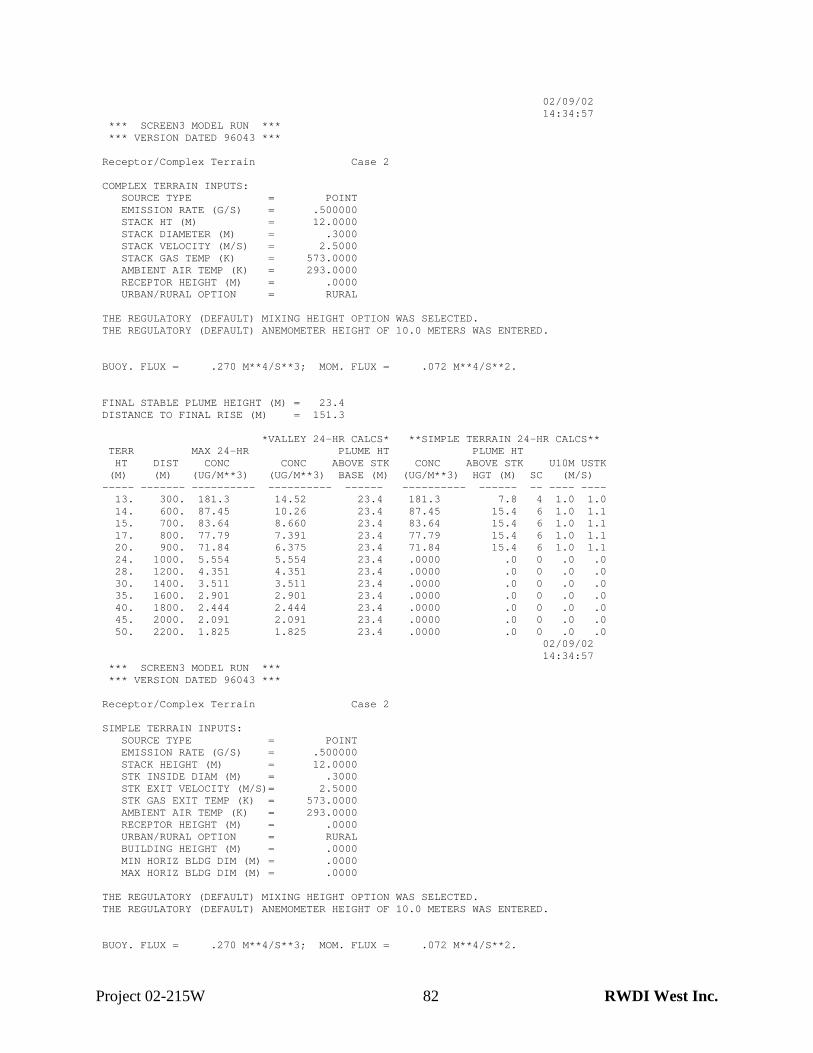
Project 02-215W 82 RWDI West Inc.
02/09/02 14:34:57 *** SCREEN3 MODEL RUN *** *** VERSION DATED 96043 *** Receptor/Complex Terrain Case 2 COMPLEX TERRAIN INPUTS: SOURCE TYPE = POINT EMISSION RATE (G/S) = .500000 STACK HT (M) = 12.0000 STACK DIAMETER (M) = .3000 STACK VELOCITY (M/S) = 2.5000 STACK GAS TEMP (K) = 573.0000 AMBIENT AIR TEMP (K) = 293.0000 RECEPTOR HEIGHT (M) = .0000 URBAN/RURAL OPTION = RURAL THE REGULATORY (DEFAULT) MIXING HEIGHT OPTION WAS SELECTED. THE REGULATORY (DEFAULT) ANEMOMETER HEIGHT OF 10.0 METERS WAS ENTERED. BUOY. FLUX = .270 M**4/S**3; MOM. FLUX = .072 M**4/S**2. FINAL STABLE PLUME HEIGHT (M) = 23.4 DISTANCE TO FINAL RISE (M) = 151.3 *VALLEY 24-HR CALCS* **SIMPLE TERRAIN 24-HR CALCS** TERR MAX 24-HR PLUME HT PLUME HT HT DIST CONC CONC ABOVE STK CONC ABOVE STK U10M USTK (M) (M) (UG/M**3) (UG/M**3) BASE (M) (UG/M**3) HGT (M) SC (M/S) ----- ------- ---------- ---------- ------ ---------- ------ -- ---- ---- 13. 300. 181.3 14.52 23.4 181.3 7.8 4 1.0 1.0 14. 600. 87.45 10.26 23.4 87.45 15.4 6 1.0 1.1 15. 700. 83.64 8.660 23.4 83.64 15.4 6 1.0 1.1 17. 800. 77.79 7.391 23.4 77.79 15.4 6 1.0 1.1 20. 900. 71.84 6.375 23.4 71.84 15.4 6 1.0 1.1 24. 1000. 5.554 5.554 23.4 .0000 .0 0 .0 .0 28. 1200. 4.351 4.351 23.4 .0000 .0 0 .0 .0 30. 1400. 3.511 3.511 23.4 .0000 .0 0 .0 .0 35. 1600. 2.901 2.901 23.4 .0000 .0 0 .0 .0 40. 1800. 2.444 2.444 23.4 .0000 .0 0 .0 .0 45. 2000. 2.091 2.091 23.4 .0000 .0 0 .0 .0 50. 2200. 1.825 1.825 23.4 .0000 .0 0 .0 .0 02/09/02 14:34:57 *** SCREEN3 MODEL RUN *** *** VERSION DATED 96043 *** Receptor/Complex Terrain Case 2 SIMPLE TERRAIN INPUTS: SOURCE TYPE = POINT EMISSION RATE (G/S) = .500000 STACK HEIGHT (M) = 12.0000 STK INSIDE DIAM (M) = .3000 STK EXIT VELOCITY (M/S)= 2.5000 STK GAS EXIT TEMP (K) = 573.0000 AMBIENT AIR TEMP (K) = 293.0000 RECEPTOR HEIGHT (M) = .0000 URBAN/RURAL OPTION = RURAL BUILDING HEIGHT (M) = .0000 MIN HORIZ BLDG DIM (M) = .0000 MAX HORIZ BLDG DIM (M) = .0000 THE REGULATORY (DEFAULT) MIXING HEIGHT OPTION WAS SELECTED. THE REGULATORY (DEFAULT) ANEMOMETER HEIGHT OF 10.0 METERS WAS ENTERED. BUOY. FLUX = .270 M**4/S**3; MOM. FLUX = .072 M**4/S**2.

Project 02-215W 83 RWDI West Inc.
*** FULL METEOROLOGY *** ********************************* *** SCREEN DISCRETE DISTANCES *** ********************************* *** TERRAIN HEIGHT OF 3. M ABOVE STACK BASE USED FOR FOLLOWING DISTANCES *** DIST CONC U10M USTK MIX HT PLUME SIGMA SIGMA (M) (UG/M**3) STAB (M/S) (M/S) (M) HT (M) Y (M) Z (M) DWASH ------- ---------- ---- ----- ----- ------ ------ ------ ------ ----- 100. 221.3 2 1.0 1.0 320.0 16.91 19.40 10.84 NO ********************************* *** SCREEN DISCRETE DISTANCES *** ********************************* *** TERRAIN HEIGHT OF 5. M ABOVE STACK BASE USED FOR FOLLOWING DISTANCES *** DIST CONC U10M USTK MIX HT PLUME SIGMA SIGMA (M) (UG/M**3) STAB (M/S) (M/S) (M) HT (M) Y (M) Z (M) DWASH ------- ---------- ---- ----- ----- ------ ------ ------ ------ ----- 150. 312.4 3 1.0 1.0 320.0 14.87 18.26 11.02 NO ********************************* *** SCREEN DISCRETE DISTANCES *** ********************************* *** TERRAIN HEIGHT OF 8. M ABOVE STACK BASE USED FOR FOLLOWING DISTANCES *** DIST CONC U10M USTK MIX HT PLUME SIGMA SIGMA (M) (UG/M**3) STAB (M/S) (M/S) (M) HT (M) Y (M) Z (M) DWASH ------- ---------- ---- ----- ----- ------ ------ ------ ------ ----- 200. 455.1 4 1.0 1.0 320.0 11.80 15.72 8.79 NO ********************************* *** SCREEN DISCRETE DISTANCES *** ********************************* *** TERRAIN HEIGHT OF 12. M ABOVE STACK BASE USED FOR FOLLOWING DISTANCES *** DIST CONC U10M USTK MIX HT PLUME SIGMA SIGMA (M) (UG/M**3) STAB (M/S) (M/S) (M) HT (M) Y (M) Z (M) DWASH ------- ---------- ---- ----- ----- ------ ------ ------ ------ ----- 250. 580.2 4 1.0 1.0 320.0 7.80 19.25 10.56 NO DWASH= MEANS NO CALC MADE (CONC = 0.0) DWASH=NO MEANS NO BUILDING DOWNWASH USED DWASH=HS MEANS HUBER-SNYDER DOWNWASH USED DWASH=SS MEANS SCHULMAN-SCIRE DOWNWASH USED DWASH=NA MEANS DOWNWASH NOT APPLICABLE, X<3*LB ******************************************** * SUMMARY OF TERRAIN HEIGHTS ENTERED FOR * * SIMPLE ELEVATED TERRAIN PROCEDURE * ******************************************** TERRAIN DISTANCE RANGE (M) HT (M) MINIMUM MAXIMUM ------- -------- -------- 3. 100. -- 5. 150. -- 8. 200. -- 12. 250. -- *************************************** *** SUMMARY OF SCREEN MODEL RESULTS *** *************************************** CALCULATION MAX CONC DIST TO TERRAIN

Project 02-215W 84 RWDI West Inc.
PROCEDURE (UG/M**3) MAX (M) HT (M) -------------- ----------- ------- ------- SIMPLE TERRAIN 580.2 250. 12. COMPLEX TERRAIN 181.3 300. 13. (24-HR CONC) *************************************************** ** REMEMBER TO INCLUDE BACKGROUND CONCENTRATIONS ** ***************************************************