dispersed generation using novel algorithm for …
TRANSCRIPT

POWER QUALITY IMPROVEMENT OF DISTRIBUTION SYSTEM WITH DISPERSED GENERATION USING NOVEL ALGORITHM FOR DETECTION AND
CONTROL OF ISLANDING PROCESS
By
HASHAM KHAN Submitted to the Faculty of the Electrical and Electronic Engineering
University of Engineering and Technology Taxila in partial fulfillment of the requirements for
the Degree of
DOCTOR OF PHILOSOPHY
2009
Dissertation Approved:
Professor Dr. Muhammad Ahmad Choudhry
Dissertation Adviser
Professor Dr.Atta Ullah Solangi Member
Dr.Zia Ahmad Member
Dr.Saeed- Ur- Rehman
Member
2009 Taxila, Pakistan

iv
POWER QUALITY IMPROVEMENT OF DISTRIBUTION SYSTEM WITH DISPERSED GENERATION USING NOVEL ALGORITHM FOR DETECTION AND
CONTROL OF ISLANDING PROCESS
By Hasham Khan
Dr. Muhammad Ahmad Choudhry, Advisor
Electrical Engineering Department
ABSTRACT
Distribution engineers investigate economical and technical feasibility of new capacity expansion alternatives. Distributed generation (DG) can be used effectively to support the customer’s power quality requirements. DG is an imperative tool that can partially replace the need to erect new generating stations in order to cope with the increasing load demands. However, numerous complexities arise like parallel operation of DG within existing system, phenomena of islanding and its detection, micro grid operation, monitoring and control etc. Several techniques have been developed for the effective detection of islanding. These techniques have numerous deficiencies. First of all, a majority of these islanding detection techniques have been developed only for balanced three phase load. No single-phase load and unbalanced three phase loads have been considered. Secondly, successful transfer into autonomous micro grid operation requires islanding detection and a subsequent change in control strategy of micro grid DG units. Thirdly, this operation causes large amount of current flow out of the micro grid into the fault, resulting in severely depressed micro grid bus voltage. In this research work, the emphasis is to improve these problems and overcome the drawbacks of existing techniques. The aims and objectives of this study are to develop a novel islanding detection technique, reliable, effective and efficient operation of DG in coordination with main utility network as well as power quality improvement for essential load. In order to improve the power quality of distribution network and to detect the islanding phenomena with DG, innovative techniques are required to implement the solution and mitigate the problems effectively. In this research study, using an analytical approach, two algorithms have been designed; a comprehensive algorithm for the implementation of distributed generation (IDG) by finding the optimal size and location of

v
DG for power quality improvement and a new islanding detection algorithm (NIDA) for islanding detection under multiple distributed generation scenarios. The proposed algorithms can be utilized effectively to enhance the feeder performance having randomly distributed loads. The algorithms have been designed in “C language” and are based upon the power quality improvement of distribution feeder in terms of node voltage profile enhancement, power loss reduction and islanding detection in multi-DG scenario. The newly designed algorithms outperform the conventional approaches, which encounter numerous complexities during their implementation. The designed algorithms have the capabilities to operate under uniform and non-uniform loads with low power factor for both single DG and multi-DG scenario. The suggested algorithms have been implemented on different feeders including, 11kV feeder, 12.5kV feeder and IEEE 34 bus feeder. The feeders have been simulated in “C-language” and the results have been verified. The simulation results show that the algorithms can be implemented efficiently to detect the islanding phenomena and enhance the distribution system performance in terms of node voltage profile improvement and power loss reduction.

vi
ACKNOWLEDGMENTS I am greatly indebted to Professor Dr. Muhammad Ahmad Choudhry for his kind guidance, valuable suggestions and technical assistance that enabled me to carryout this research. My sincere thanks to Mr. Aftab Shah Computer Programmer UET Taxila for his precious assistance till the end of research work. This work was made possible by the help of Engr. Said Gafar, Executive Engineer WAPDA regarding the data collection. I would like to appreciate the encouragement and prayers of my parents, wife and children who never let me alone throughout this work. Dedication to my brother Professor Dr. Amir Khan Chairman, department of Geography, Urban and Regional Planning, Peshawar for his moral support and guidance . Thanks to Technical Education, N.W.F.P Industry department for kind permission and assistance. I am also grateful to all of my colleagues and friends for their assistance. The enormous coordination and cooperation of Professor Muhammad Tariq Awan and Professor Engr. Sirage Munier Ex-Director General Technical Education and Manpower Training during the research has really assisted and encourage me to complete the research successfully. I pay my humblest and sincere thanks to my committee members Dr.Zia Ahmad, Dr. Attaullah Solongi and Dr. Saeed ur Rehman for their interest and useful encouragement.

vii
TABLE OF CONTENTS
LISTOFTABLES XII
LISTOFFIGURES XIII
NOMENCLATURE XV
INTRODUCTION 1
1.1 Power quality 1
1.2 Distributed generation 3
1.3 Islanding Phenomena 4
1.4 Micro Grid Operation 5
1.5 Problem Statement 6
1.6 Scope of study 7
1.7 Objective 9
POWER QUALITY 11
2.1 Introduction 11
2.2 Objectives of Power Quality 12
2.3 Causes of Power Quality Deformation 13 2.3.1 Capacitor Switching 13 2.3.2 Momentary Fault 14
2.4 Long Duration Voltage Variations 14
2.5 Short term Voltage Variations 16
2.6 Power Quality Indices 17 2.6.1 Interruption 18 2.6.2 Transients 20 2.6.3 Voltage Sag 22 2.6.4 Voltage Swell 24 2.6.5 Waveform Distortion 25
2.7 Voltage Fluctuations 31

viii
2.8 Frequency Variation 32
2.9 Voltage Imbalance 33
2.10 Harmonic Distortion 33 2.10.1 Effects of Harmonic Distortion 34 2.10.2 Causes of Harmonic Distortion 35 2.10.3 Remedial Measures 35
2.11 Flicker 35 2.11.1 Causes of Flicker 36 2.11.2 Mitigation Techniques 36
2.12 Voltage Drop 37
2.13 Voltage Drop Criteria 38
2.14 Effects of Voltage Drop 38
2.15 Causes of Voltage Drop 38 2.15.1 Nature and Type of Load 38 2.15.2 Design of Electrical Installations/Equipments 39 2.15.3 Layout of Distribution System 40 2.15.4 Poor Maintenance of Distribution System 41
2.16 Improvement Techniques 41 2.16.1 Capacitor Application 42 2.16.2 Re‐Conductoring 43 2.16.3 Bifurcation 43 2.16.4 Load Balancing 43 2.16.5 Feeder Reconfiguration 44
2.17 Implication of Poor Power Quality 44
2.18 Custom Power Solutions 44
2.19 Advantages of Power Conditioning 45
2.20 Summery 45
DISTRIBUTED GENERATION 47
3.1 Introduction 47
3.2 Background 49
3.4 DG Technologies 53 3.4.1 Reciprocating Engines 53 3.4.2 Micro ‐Turbine 53 3.4.3 Photo‐voltaic 53 3.4.4 Fuel Cells 54 3.4.5 Wind Turbine System 54

ix
3.4.6 Bio‐Mass Based DG System 55 3.4.7 Small Hydroelectric Power System 55
3.5 DG Applications 56 3.5.1 Continuous Power 56 3.5.2 Combined Heat and Power 56 3.5.3 Peak Power 56 3.5.4 Green Power 57 3.5.5 Premium Power 57 3.5.6 Transmission and Distribution Deferral 58 3.5.7 Ancillary Service Power 58
3.6 Significance of DG in Power Quality 58 3.6.1 Combine Heat and Power 59 3.6.2 Low Cost Energy 59 3.6.3 Peak Shaving 59 3.6.4 Standby Power 59
3.7 Integration of DG and Power Quality 60
3.8 Location of DG 60
3.9 Benefits of DG 61 3.9.1 Customer’s Benefits 62 3.9.2 Electric Utility Benefits 63 3.9.3 National Benefits 65 3.10.1 Complexities in Interconnection 67 3.10.2 Technical Issues 68 3.10.3 Commercial and Planning Issues 69 3.10.4 High Financial Cost and Power Quality Issues 69
3.11 Impacts of DG 71 3.11.1 Low Voltage due to DG Just Down Stream of a Regulator with LDC 71 3.11.2 High Voltage due to DG 73 3.11.3 Interfacing with Utility System 73 3.11.4 Interaction with Regulating Equipment 73
3.12 Voltage Regulation by DG 74
3.13 Summery 74
ISLANDING PROCESS 76
4.1 Introduction 76
4.2 Significance of Islanding Detection 78
4.3 Effects of Islanding Phenomena 79
4.4 Causes of Islanding Processes 83
4.5 Impacts on Power Quality 84

x
4.6 Islanding Detection Techniques 84
4.7 Passive Islanding Detection Techniques 85 4.7.1 Voltage Based Islanding Detection Techniques 86 4.7.2 Frequency Based Islanding Detection Techniques 87 4.7.3 Rate of Change of Frequency (ROCOF) 89 4.7.4 Vector Shift 89 4.7.5 Phase Jump Detection (PJD) 90 4.7.6 Voltage Harmonic Detection 90
4.8 Active Islanding Detection Techniques 91 4.8.1 Output Power Variation 91 4.8.2 Impedance Measurement 92 4.8.3 Sliding Mode Frequency Shift (SMFS) 92 4.8.4 Active Frequency Drifts (AFD) 93
4.9 Other Methods 94 4.9. 1 Reactance Insertion 95 4.9.3 Supervisory Control and Data Acquisition (SCADA) 96 4.9. 4 Phase Measurement Units 96 4.9. 5 Comparison of Rate of Change of Frequency (COROCOF) 96 4.9. 6 Transfer Tripping Scheme 97
4.10 Review of existing Islanding Detection Techniques 97
4.11 Summery 101
ALGORITHMS AND SIMULATION RESULTS 103
5.1 Introduction 103
5.2 DG for Performance Enhancement of Distribution Feeder 106
5.3 Voltage Profile Improvement (EPI) Of Distribution Feeder 107
5.4 Effect of Voltage Profile Improvement on Feeder Performance 110
5.5 Distribution Feeder Performance Enhancement Analyses by IDG Algorithm 110 5.5.1 Power Loss and Voltage Drop without DG 113 5.5.2 Power Loss and Voltage Drop with DG 114 5.5.3 Optimal Placement of DG 115 5.5.4 Implementation of IDG Algorithm 115 5.5.5 Salient Features of the IDG Tool 123
5.6 Case Study 1 123 5.6.1 Step 1 125 5.6.2 Step 2 125 5.6.3 Step 3 130
5.7 Case study 2 131 5.7.1 Step 1 131 5.7.2 Step 2 135

xi
5.8 Case study 3 140
5.9 New Islanding Detection Algorithm (NIDA) 145
5.10 Salient Features of the NIDA 147
5.11 Case Study 4 147 5.11.1 Step 1 150 5.11.2 Step 2 150 5.11.3 Step 3 152
5.12 Case Study 5 157 5.12.1 Step 1 158 5.12.2 Step 2 158
5.13 Case Study 6 164 5.13 1 Step 1 166 5.13 2 Step 2 168
5.10 Summery 169
CHAPTER VI 172
CONCLUSION 172
FUTUREWORK 175
REFERENCES 176
APPENDIX A 185
IDG algorithm 185
Salient Features of the IDG Tool 188
APPENDIX B 190
NIDA 190
Salient Features of the NIDA 192
APPENDIX C 193
LIST OF PUBLICATIONS 193

xii
LIST OF TABLES Table ........................................................................................................................ Page Table 1.1 Power Quality Indices ................................................................................. 2 Table 4.1 Merits and Demerits of Existing Islanding Detection Techniques 100 Table 5.1 11kv Feeder Data used in the Analysis 123 Table 5.2 Existing System Results without DG ...................................................... 125 Table 5.3 Existing System Results with DG ........................................................... 126 Table 5.4 Simulation Results with DG .................................................................... 127 Table 5.5 Comparison of Voltage Drop and Power Loss without and with DG ..... 129 Table 5.6 Tariff wise Number of Consumers .......................................................... 130 Table 5.7 Input Data for modified IEEE 34 bus System ......................................... 133 Table 5.8 Existing System analyses for non-uniformly distributed load w/o DG ... 135 Table 5.9 Existing System analyses for non-uniformly distributed load w DG ...... 136 Table 5.10 Simulation Results for non-uniformly distributed load w DG ................ 137 Table 5.11 Comparison of Voltage Drop and Power Loss without and with DG ..... 138 Table 5.12 Input Data for 11 nodes 12.5kv system ................................................... 139 Table 5.13 Existing System analyses for uniformly distributed load without DG .... 141 Table 5.14 Existing System analyses for uniformly distributed load with DG ......... 141 Table 5.15 Simulation Results for uniformly distributed load with DG ................... 142 Table 5.16 Comparison of Voltage Drop and Power Loss without and with DG ..... 143 Table 5.17 Islanding with Single DG at Node No.30 ................................................ 152 Table 5.18 Islanding with Two DGs at Node No.14 and 30 ..................................... 154 Table 5.19 Islanding with Single DG at Node No.15 ................................................ 158 Table 5.20 Islanding with Two DGs at Node No.7 and 15 ....................................... 160 Table 5.21 Simulation Results of 11 Node System for U/D load with DG ............... 165 Table 5.22 Simulation Results of 11 Node System for U/D load with DG ............... 166

xiii
LIST OF FIGURES Figure ....................................................................................................................... Page Figure 1.1 Power Quality Triangle .............................................................................2 Figure 2.1 A Typical Voltage Waveform showing over Voltage ............................14 Figure 2.2 Sinusoidal Voltage Waveform showing under Voltage ..........................15 Figure 2.3 Momentary Interruption caused due to Equipment Malfunction ............18 Figure 2.4 Sinusoidal Voltage Waveform showing Voltage Sag .............................22 Figure 2.5 Illustration of Voltage Swell on a Typical Sinusoidal Waveform ..........23 Figure 2.6 Illustration of DC Offset caused due to Operation of Non-Linear Loads24 Figure 2.7 Harmonic waveform distortion due to operation of non-linear loads 26 Figure 2.8 Illustration of Notching due to Electrical Disturbances .........................28 Figure 2.9 Waveform Presentation of Electrical Noise caused due to various
Electrical Disturbances ...........................................................................30 Figure 2.10 Illustration of Voltage Fluctuations caused due Variation in Electric
Current ....................................................................................................31 Figure 2.11 Typical Frequency Variations caused by Heavy Electric Load ..............32 Figure 3.1 Circuit Diagram of Main Source and DG ...............................................48 Figure3.2 Traditional Concept of Generating Electrical Energy ............................50 Figure 3.3 New Concept of Generating Electrical Energy .......................................51 Figure 3.4 DG Site to Relive Feeder over Load Constraint .....................................60 Figure 3.5 DG may Help Reduce Voltage Sags on Load Bus .................................63 Figure 3.6 Stands Alone DG ....................................................................................66 Figure 3.7 DG Connected in Parallel with Utility Main Source ..............................67 Figure 3.8 Installation of Utility Regulating Device to Control the Voltage ...........71 Figure 4.1 Islanding (Micro-Grid) Formations during the Fault on Utility
Main Grid ................................................................................................75 Figure 4.2 Formation of Unintentional Islanding on Utility Main Grid ..................78 Figure 4.3 Formation of Intentional Islanding on Distribution Network .................82 Figure 4.4 Islanding Detection Techniques ..............................................................84 Figure 4.5 Typical Power Line Carrier Communication Circuit used
for Islanding Detection ...........................................................................94 Figure 5.1 Model Diagram of Feeder without DG ................................................111 Figure 5.2 Model Diagram of Feeder with DG ......................................................111 Figure 5.3 Flowchart for Calculating the Drop and Power Loss, without and with
DG .........................................................................................................121 Figure 5.4 Single Line Diagram of Panian Feeder .................................................110 Figure 5.5 Modified Single Line Diagram of Feeder under Study ........................124 Figure 5.6 Voltage Profile without and with DG ...................................................128 Figure 5.7 Power Loss Curve without and with DG ..............................................128

xiv
Figure 5.8 Single line diagram of IEEE 34 bus system..........................................131 Figure 5.9 Modified single line diagram of IEEE 34 bus system ..........................131 Figure 5.10 Voltage Profile of modified IEEE 34 node system with and w/o DGs132 Figure 5.11 Modified single line diagram of IEEE 34 bus system with DGs ..........134 Figure 5.12 Power loss curve of modified IEEE 34 node system with & w/o DG ..138 Figure 5.13 Single line diagram of 11 node feeder with DG at optimal location ....140 Figure 5.14 Voltage Profile of 11 node feeder with and without DG ........................140 Figure 5.15 Power loss curve of 11 node feeder without and with DG .....................142 Figure 5.16 Flowchart Diagrams for NIDA with Multi-DG Scenario .....................148 Figure 5.17 Voltage Profile for Existing System with DGs .....................................150 Figure 5.18 Power Loss Curve for Existing System with DGs ................................150 Figure 5.19 Voltage Profile for Islanding Detection with Single DG Scenario .......152 Figure 5.20 Islanding Formations with Single and Multi-DG Scenarios .................153 Figure 5.21 Power Loss Curve for Islanding Detection with Single DG Scenario ..155 Figure 5.22 Voltage Profile for Islanding Detection with Multi- DG Scenario .......155 Figure 5.23 Power Loss Curve for Islanding Detection with Multi-DG Scenario ...156 Figure 5.24 Voltage Profile for Islanding Detection of IEEE 34 bus system with Single DG Scenario ...............................................................................158 Figure 5.25 Power Loss Curve for Islanding Detection of IEEE 34 bus system with Single DG Scenario 159 Figure 5.26 Voltage Profile for Islanding Detection of IEEE 34 bus system with Multi- DG Scenario 161 Figure 5.27 Power Loss Curve for Islanding Detection of IEEE 34 bus system with Multi- DG Scenario 161 Figure 5.28 Islanding Formations of IEEE 34 bus system with Single and .................. Multi-DG Scenarios ..............................................................................162 Figure 5.29 Single line diagram of 11 node radial distribution feeder with DG at node10 ...................................................................................................164 Figure 5.30 Islanding formations of 11node radial distribution feeder at node no 10 ...............................................................................................................165 Figure 5.31 Voltage profile for islanding detection of 11 node radial distribution Feeder ....................................................................................................166 Figure 5.32 Power loss curve for islanding detection of 11 node radial distribution Feeder ....................................................................................................167

xv
NOMENCLATURE AFD Active Frequency Drift islanding method AM Amplitude Modulation ANSI American National Standards Institute BI Benefit Index for distributed generation BWVPI Benefits weighting factors for voltage profile improvement BWLLR Benefits weighting factors for line loss reduction BWEIR Benefits weighting factors for environmental impact reduction Ckva Three phase rating of capacitor COROCOF Comparison of rate of change of frequency CVQC Customer Voltage quality criterion DG Distributed Generation Discos Distribution Companies Di Length of distribution line “i” dEx Incremental Voltage drop dExDG Incremental Voltage drop with DG dI/dt Change in segment current without DG dIDG/dt Change in segment current with DG DER Distributed Energy resources DNO Distribution network operator DR Distribution resources Edrop Voltage drop Es Voltage at sending end of the feeder Er Voltage at receiving end of the feeder Ex Voltage at distance “x” from sending end of the feeder Edrop Voltage drop EP Voltage profile without DG EPDG Voltage profile with DG EPII1 Voltage profile improvement index EP2 Modified Voltage profile index EPII2 Modified Voltage profile improvement index Enom Nominal value of Voltage in per unit Emax Maximum value of Voltage in per unit Emin Minimum value of Voltage in per unit Ei Any value of Voltage in per unit at node “i” EPRI Electric Power Research Institute EMI Electromagnetic interferences EIRI Environmental impact reduction index

xvi
EPS Electric Power System FM Frequency modulation fTh Inter-harmonic frequency fo Load operating frequency fs Fundamental of ac main frequency fr Resonance frequency H Moment of inertia for DG Hz Hertz IDG Implementation of Distributed Generation Ic Full load current of capacitor bank i(t) Inrush current in time domain I(s) Inrush current in Laplace domain IL Peak demand load at fundamental frequency IEEE Institute of Electrical and Electronic Engineers I Current in ampere Ih Amplitude of current waveform at harmonic “h” IT Information Technology IEC International Electro-technical Commission I2R Heat or Power loss IA,i Per unit current in line “i” with the application of DG Ix Line current at any location “x” Igrid Total current at utility grid IN Load connected to “N” node in ampere I0,1, I1,2,…IN, N+1 Current flowing in nth segment of the feeder in ampere IZ Voltage drop KV Line to line Voltage Kvar Rating of capacitor in kilovolts ampere reactive kVLL Line to line voltage in kilovolts kVA Apparent power in kilovolts ampere kVALR Motor locked rotor kVA kVASC System short-circuit kVA at motor kW Active power in kilowatts Ki Weighting factor at ith node of the distribution network LLRI Line loss reduction index LLwith DG Line loss with DG LLwithout DG Line loss without DG LDC Line drop compensator LTC Load taps changing Li Load supplied at ith node in per unit L0,1, L1,2,…Ln,n+1 Inductance of nth segment of feeder in Henry per unit length Mh rms value of the harmonic component “h” of the quantity “M”

xvii
MW Active power in Megawatts MLDC Multiple line drop compensator ms Millisecond NDZ None detection zone NIDA New islanding detection algorithm NWFP North West Frontier province NEC National Electrical Code P Active power Ploss Power loss Ploss DG Power loss with DG PCC Point of common coupling PDG Power generated by DG in standard units Ps Power received from distribution system in standard units PEi with DG Amount of emissions with DG for ith pollutant PEi without DG Amount of emissions without DG for ith pollutant PJD Phase jump detection PLCC Power line carrier communication PESCO Peshawar electricity supply corporation PQ Power Quality PQD Power Quality distortion Pu Per unit PST Short term evaluation of flicker sensitivity PLT Long term evaluation of flicker sensitivity q High quality load factor Ri Resistance of line “i” R0,1, R1,2,…Rn,n+1 Resistance of nth segment of feeder in Ω per unit length RLC Resistive inductive and capacitive load rms Root mean square value ROCOF Rate of change of frequency SL Absolute value of load complex power SCADA Supervisory control and data acquisition SCR Silicon control rectifier SPC Static power convertor SMPS Switch mode power supply SMFS Sliding mode frequency shift STS Static transfer switch SLP Successive linear programming technique SQP Successive quadratic programming technique TDD Total distortion factor THD Total harmonic distortion UETT University of Engineering and Technology Taxila

xviii
ULTC Under load tap changer UPS Uninterruptible power supply Vrms Root mean square value of Voltage V (pu) Actual system Voltage in per unit Vh Amplitude of Voltage waveform at harmonic component “h” Vd Voltage drop Vr Voltage at the receiving end of distribution feeder Vs Voltage at the Sending end of distribution feeder Vp Magnitude of positive sequence Voltage Vn Magnitude of negative sequence Voltage WAPDA Pakistan Water and Power Development Authority X Total line reactance X0,1, X1,2,…Xn,n+1 Length of nth segment of feeder in meter Xs Short circuit reactance at fundamental frequency XLM Reactance of LM at fundamental frequency Xca Reactance of Ca at fundamental frequency ZLDC Compensating impedance of LDC Z Impedance

1
CHAPTER I
INTRODUCTION
1.1 Power quality
With the advent of new sophisticated and sensitive electronic/electrical equipment, the electric power quality (PQ) has become an area of active research since last few decades. There are many reasons, responsible for its importance. The deregulation of electric power industry and awareness of customers regarding the power quality, to ensure the proper and continued operation of sensitive equipment and processes are the major factors contributing to the growing importance to the area [1]. In competitive environment, businesses are not accepting product loss and defects caused by power supply problems. The occurrence of short outages will play a pivotal role in the relations between a utility and its customers. Pressures from consumers will compel utilities to mitigate power quality problems in the network. M.M. Morcos and J.C.Gomez expresse power quality as any occurrence manifested in voltage, current or frequency deviation resulting in damage, upset, or failure of customer’s equipment [2]. Timothy J. Browne and G. T. Heydt define electric power quality as the ability of electric power system to supply energy to a load in such form that the customer may utilize that energy without any equipment failure [3]. Dugan, Mc Granhan, Santoso and Beaty are of the opinion that the term power quality can be illustrated by those characteristics of electric power distribution system which are considered to be responsible for the smooth functioning of electric equipments are terms as power quality. Elaborating it further, one can state the power quality as an electric power problem manifested in voltage, current or frequency deviations that results in failure of load side electric equipments [4]. From electric utility point of view, the power quality is the supply of electrical power as per specified standards, whereas from the end user sight, it is the smooth functioning of electrical equipment without any disruption. The innovative technologies are often so sensitive that glitches for a fraction of a second can throw a factory floor into disarray. The main participants of power quality interest are electric utilities, equipment manufacturers, and electric customers as expressed in the power quality triangle depicted in Fig.1.1. In order to achieve the complete perfection in the smooth functioning of electric power distribution system, perfect coordination among the participants of power quality triangle is vital. The increased concern for power quality is mainly because of the availability of sophisticated and advanced technologies including computers and electronic equipments, deregulation of power industry, complicated industrial

2
processes, equipment sensitivity, and complex interconnection of systems. The major causes of power quality problems are related to operation of electric power distribution system and the operation of customer’s equipment [5].
Fig1.1 Power quality triangle
Mostly, non- linear loads including the converters, pulse modulated loads, adjustable speed drives, fluorescent and other discharge lighting, some rotating loads, certain components which employ magnetic circuits and starting of some heavy loads like arc furnaces, electric welding plants, and high power switching devices are the main causes of power quality problems.
Table 1.1 Power quality indices
Power quality Indices
Causes Utility-side solution Customer-side solution
Voltage Sag Lightning strike, Tree or
Animal contact Dynamic voltage restorer, Static
conditioner Line conditioner, UPS
Overvoltage Fault on another phase, Load
rejection Dynamic voltage restorer, Fault current
limiter, High energy surge arrester Line conditioner, Voltage
regulator, UPS
Interruption Blown fuse, Breaker
operation Solid state circuit breaker, static
condenser UPS, Motor Gen set
Transient Lightning strike, Utility
switching High energy surge arrester
Line conditioner, Surge suppresser
Harmonic distortion
Nonlinear loads, Ferro-resonance
Filter, Static condenser, Dynamic voltage restorer
Filter, Line conditioner
Electrical noise Improper customer wiring or
grounding
Filter, Line conditioner, Grounding, Shielding
In order to avoid interference, excessive voltage drop, power losses and mal-function of electric loads, a proper power quality assessment of distribution system is essential [6]. Different indices are used to quantify electric power quality. The main indices presently utilized in electric power quality are interruptions, transients, voltage sag, voltage swell, waveform distortion, voltage fluctuations, and frequency variations. These indices usually provide different methods to measure and quantify the level of electrical service and the benefits of enhancing the standard of supply circuits.
Utilities Manufacturers
Customer

3
However, few of these indices are incapable of accommodating transients, non-periodic signals and the complexities arising due to three phase circuits [7]. Some of the power quality indices, with causes and remedial measures are illustrated in Table1.1 [8]. All the relevant power quality indices are prerequisites for assessing the site and system performance with respect to power quality. These indices eventually facilitate the task of system operators with their obligation to report the power quality performance. As the system operators are at the risk of being exposed to the penalty payment for excursions in quality beyond the objective values, it is essential that the objectives are seen not only as achievable but also as being cost effective for all customers. Optimizing the power quality performance of electrical system is one of the objectives of system operator. The role of regulator is to ensure that these objectives are achieved in a cost effective manner. If customers expect power quality to be an intrinsic characteristic of the product, also, they want it at the lowest price. In the deregulated and competitive environment, the trend of using small scale modular generation is gradually increasing in the industrial community. In prospect, surely, there are local-area distribution system, interconnecting local generation and variety of power electronics to bring the supply of distribution system up to the expected of power quality and reliability. The industrial sector is passing through a transition phase in the competitive market place; such type of value-added services can open up additional business opportunities. Custom power along with the competitive forces of wheeling and distributed generation points the way to electric power distribution system of the 21st century [8].
1.2 Distributed generation
The Dispersed Generation (DG) in the distribution network is playing an important role in the operation of Distribution Companies (Discos). DG technologies have an important role in the electric distribution system structure, design, up-gradation issues and power quality problems. Electric utility planners endeavor to develop new planning strategies for their network in order to serve the load growth and provide their customers with a reliable electric supply. Traditional capacity planning studies for the future load demand were carried out by enhancing capacity and expanding the existing transmission infrastructure. The competitive market forces drive the electric utility planners to investigate the economical and technical feasibility of new capacity expansion alternatives. The Distributed Generation option is enjoying a global popularity to offset the future load growth [9]. The DG can be described as small scale generating unit located in the vicinity of load center. A wide variety of DG Technologies are being considered as an alternative to the capacity addition by the researchers. A few of them are, Reciprocating engines, Micro-turbine, Photovoltaic, Fuel cells, Wind turbines, Bio-mass, and small hydroelectric power plant. Generally, electric utility or the customers can install DG units within their service jurisdiction. Because of the availability of such a flexible option at the distribution

4
voltage level, the distribution network is now being transformed from passive network to an active one. The benefits of DG technologies and their effects on the electricity market make it a credible alternative in the Disco’s planning and decision making. However, considering the extremely high cost of un-served power to the society, investment in DG becomes an attractive option. The importance of DG has been accepted and realized by the power system engineers. From distribution system planning point of view, DG is a feasible alternative to increase capacity in the environment of competitive electricity market. Utilities have recognized the DG as an imperative tool that can partially replace the need to erect new generating stations in order to meet the increasing load demand. Furthermore, customers also rely on the DG to meet their increasing electricity needs, and reducing their costs. A recent study by the electric power research institute (EPRI) indicates that by the year 2010, 25% of the new generation will be that of distributed generation type. Another study in the National gas foundation concludes that the figure may be as high as 30%. The integration of DG with the utility distribution network offers a number of technical, environmental and economical benefits. Moreover, such integration allows distribution utilities to improve the network performance by reducing its losses. The existing DG units are utilized to supply active power to their network or the customers [10]. The main reasons behind the expected growth of DG are:
1. Deregulation in power market, which encourages public investment to sustain the development in power demand.
2. Emergence of new generation techniques with small ratings, ecological benefits and increased profitability which can be combined with heat generation.
3. Saturation of existing networks and continuous growth demands. 4. Issue of the right of the way for transmission lines.
The technical merits associated with the implementation of distributed generation include voltage support, energy loss reduction, release of system capacity, and improved utility system reliability. On the other hand the parallel operation of DG with the existing system, islanding detection, micro grid operation, difficulties in the operation and control of the different types of DG are still the main challenges associated with the use of DGs in distribution systems [11]. DG has the ability to resolve many customers’ problems, especially from power quality point of view. DG is used to provide electricity service at a high level of reliability and power quality than conventional grid power system. DG may protect sensitive loads from momentary voltage variations. It can provide uninterruptible power supply to ride through any sort of outage until primary or secondary power is restored. It is friendly with the environment, promotes renewable energy resources, improves system power factor, and power quality in terms of node voltage drop and power loss reduction.
1.3 Islanding Phenomena
An islanding is the scenario where dispersed generators could be severed off from the utility networks, but continued to operate after the disconnection of utility supply. The

5
phenomena of islanding complicate the reconnected utility of the circuit and pose a hazard to utility personnel [12]. The protective system should operate within a minimum time, half a second, following the occurrence of islanding. Several techniques have been presented to guard against the islanding phenomena. A simple method is to monitor the auxiliary contacts of all circuit breakers on the utility system between its main sources of generation and dispersed generating units. This method is easy to grasp but difficult to implement due to non-comprehensive monitoring system. The other techniques used to detect islanding process are active methods and the passive methods. In the active technique, a specific control circuit is used to reproduce variations in the outputs of dispersed generators. When loss of grid happens, the designated deviation will be enlarged to activate the relays and initiate the islanding. However, if the utility’s main source remains connected with the load, this deviation is relatively insufficient to operate the protective relays. The passive methods are based on the measurement of power system parameters such as rate of change of frequency, phase displacement monitoring and system fault level monitoring, voltage magnitude and impedance monitoring, voltage unbalance and total harmonic distortions in the current. The concept of this technique lies in the fact that a loss of mains will result in the variations in system voltage, current or frequency in almost all circumstances. Hence by monitoring the variations in these parameters the occurrence of islanding can be sensed in the dispersed generating units. It is worth mentioning that when the amount of power mismatches between generations and load within the island is not significant, it remains an unsettled question that either passive or active method cannot completely guard against islanding. Another technique used to identify islanding event for DG is with self commutated static power converter (SPC).
The method is based on the monitoring of magnitude deviation and sign change in|| lP
f
.
Where, f is change in frequency and || lP is magnitude of change in load power.
However, the performance of system becomes poor when the power mismatch is less notable [13]. The islanding operation of the DG can also be detected by two new parameters i.e., voltage unbalance & total harmonic distortion (THD) of current. This method enhances the performance of the conventional approaches and overcomes their demerits [14]. However, this method does not properly equalize the voltage magnitude, phase and frequency of the DG output power with the distribution network, which increases the operation time.
1.4 Micro Grid Operation
The term micro grid can be described as a small power system with a single or multiple generators and loads. It has two general categories.
1) System that is intended to always operate isolated from a large utility grid.
6
2) Systems that are normally connected to a large utility grid.
Conceptually, the isolated micro-grid is like a scaled down version of a large-scale utility grid. To supply reliable and quality power, the micro-grid must have mechanisms to regulate voltage and frequency in response to the changes occurring in customer loads and disturbances. The DG penetration in an isolated micro grid is, by definition, 100% power come form the DG. For grid connected micro grid, the distinction between the grid and micro-grid is more delicate. The basic concept is that a well-defined sub- system contains loads and local DG. The micro grid can be designed in such a way that it can either operate in isolation from the main grid or it can perform its function within the utility grid. A micro grid is formed when an electrical region capable of autonomous operation is islanded from the rest of the grid. For example, a distribution sub-station along with its feeders that serves both DG units and local loads. Formation of micro grid resulting from an islanding process can be due to disturbances such as a fault and its subsequent switching incidents. The micro-grid is to remain operational in an autonomous mode after islanding and meet the corresponding load requirements. Micro-grid can also be defined as a low voltage distribution system to which small modular generation systems are to be connected. Micro-grid corresponds to an association of electrical loads and small generation systems through a 440 V distribution network. This means that loads and sources are physically close to each other, so that a micro-grid can correspond for instance to the network of a small urban area, any industry or a commercial area [15].
1.5 Problem Statement
With the advent of new technologies, electric utility planners continuously endeavor to develop new planning strategies for their distribution systems in order to serve the load growth and provide their customers with a reliable electric power. In the era of competitive electricity market, distribution engineers are striving to explore the technical feasibility of alternative generation. DG is one out of the available options. DGs have the capability to partially replace the need to erect new generating stations in order to cope with the increasing load demands. However, numerous complexities arise like parallel operation of DG with existing system, phenomena of islanding and its detection, micro-grid operation, monitoring and control etc. Several techniques have been developed for the effective detection of islanding. These techniques have the following deficiencies.
1) Majority of these islanding detection techniques have been developed for balanced/uniform three phase load. No single-phase load and unbalanced three phase loads have been considered.
2) No control/protection strategy has been developed for transient over voltages/currents. Successful transfer into autonomous micro-grid operation requires islanding detection and a subsequent change in control strategy of micro-grid DG units.

7
3) This operation causes large amount of current flow out of the micro grid into the fault, resulting severely depressed micro grid bus voltage.
It has been observed that during the design of electric power distribution system, the engineers are forced to adopt some unrealistic assumptions to make the models more acceptable. Uniform load distribution, uniform feeder size, constant loads, equal spacing, and unity power factor are the most common assumptions made in the simulation process. However, in the real life, the situation is quiet different from these assumptions. Under such circumstances, a cumbersome job is required by the engineers in the real world of electric power distribution system. The urban and the rural distribution feeders in developing and under developing countries are extremely over loaded due to many reasons. The use of undersized conductors, substandard jointing practices, and remote location of transformers from loads, rapid increase in the domestic power consumption, incorrect assessment of consumer load, fast expansion in the industrial sector and the growing demand of electric power in suburbs are the most common reasons seriously encountered by distribution engineers. The stated reasons have created many problems both for the electric utilities as well as the consumer, like; unscheduled load shedding, excessive voltage drop, huge power losses, frequent failures in protective systems, and financial losses (consumer / utilities). In such scenarios, the utilization of locally available resources (DGs) provides considerable relief to generation, transmission, and distribution networks in a very cost effective way.
1.6 Scope of study
The distribution of electrical power to electric customer is the most important aspect of socioeconomic progress in modern age. With the advent of latest and sophisticated electronic equipment, the demand of reliable and uninterruptible electric power supply has increased all over the world. To provide electric power and service of desired quality according to international standard to every customer at the lowest possible cost, it is impossible without optimizing voltage drop and power loss in the distribution network. The deregulation of electric power industry and awareness of customers regarding the power quality to ensure the proper and continued operation of sensitive equipment and processes are the major factors contributing to the growing importance to the area. The concern about power quality is mainly because of the availability of sensitive and latest technologies including computer and electronic devices, deregulation of electric power industry, complicated industrial processes, equipment sensitivity, and complex interconnection of system. DGs are considered to provide electricity service at a high level of reliability and power quality than conventional electric power system. DGs can protect sensitive loads from momentary voltage variations and provide uninterruptible power supply until primary or secondary power is restored. DGs are environment friendly, promote renewable energy resources, improve system power factor and power quality in terms of node voltage drop

8
and power loss. Different phenomena of islanding (micro-grid) formations during the fault condition complicate the utility networks. Various techniques have been presented to monitor the islanding processes. The urban and the rural distribution feeders in developing and under developing countries are extremely over loaded due to many reasons. The use of undersized conductors, substandard jointing practices, and remote location of transformers from load, rapid increase in the domestic power consumption, incorrect assessment of consumer load, fast expansion in the industrial sector and the growing demand of electric power in urban and rural areas are the most common reasons seriously encountered by distribution engineers. These reasons have created many difficulties for the electric utilities and consumer. Unscheduled load shedding, excessive voltage drop, huge power losses, frequent failures in protective system, and financial losses are few out of many. Under such circumstances, the utilization of locally available resources provides considerable relief to generation, transmission, and distribution networks in a very cost effective way. To enhance the power quality of distribution network with DG, a novel technique is required to implement and overcome the problem of voltage drop and power loss. In this context a comprehensive algorithm for the implementation of DG to identify its optimal size and location for power quality improvement has been designed in this research work. The algorithm for the implementation of Distributed Generation (IDG) has been developed to identify the optimal size and location of DG in the distribution system. The proposed algorithm can be utilized effectively to increase the feeder performance having non-uniformly distributed load. The feeders having different categories of load have been simulated in C-language and the results have been verified. In the event of micro-grid formation, new islanding detection algorithm (NIDA) for multiple distributed generation scenarios has been developed. The algorithm is designed in C language and is based upon the node voltage profile improvement and power loss reduction. The proposed algorithm overcomes the problems of conventional approaches, which have many difficulties to detect the islanding. The non-uniform distribution of electric load, unity power factor, complexities during the design of interface control and the functioning of the system in multi–DG scenarios are the main obstacles, encountered by the distribution engineers during the implementation of existing islanding detection techniques. NIDA is capable of functioning under all sorts of above mentioned complexities. The simulation results illustrate that the algorithm can be implemented successfully to detect the islanding phenomena and increase the distribution system performance in terms of node voltage improvement and power loss reduction. The examination of where to best locate any new distributed generation site and which means of interface to adopt as suggested by Dr. Mohamed A.Zodhy, professor Electrical and Computer Engineering Department Oakland University. As mentioned above, the designed algorithms are written in C–language and based upon analytical approach. During any fault or abnormal condition, proposed algorithm automatically identifies the optimal size and location. The simulation results also indicate that the DG can form micro-grid and provide uninterruptible power supply to sensitive load without deteriorating the power quality in term of voltage drop and power loss.
9
1.7 Objective
In order to improve the power quality of distribution network with DG, a novel technique is required to implement and overcome the problem of voltage drop and power loss. The distribution system performance can not be improved without optimal placement of DG. In this context a comprehensive algorithm for the implementation of DG has to be developed for identifying its optimal size and location for power quality. To detect the islanding process in the distribution system is crucial to control the micro grid operation. The conventional approaches have some difficulties to detect the islanding operation. The non-uniform distribution of electric loads, unity power factor, complexities during the design of interface control and the functioning of the system in multi–DG scenarios are the most common obstacles, seriously faced by the distribution engineers during the implementation of existing islanding detection techniques. Proposed novel algorithm must outperform the conventional approaches by functioning efficiently to detect the islanding phenomena and enhance the distribution system performance in terms of node voltage improvement and power loss reduction. Keeping these points in view, the aims and objectives of this research work are formulated as below:
1) To develop a novel islanding detection technique. 2) Reliable, effective and efficient operation of DG in coordination with main utility
network and hence, the consumers will be benefited. 3) Power quality improvement for essential load.
The main frame of this research work comprises of six chapters. Chapter 1 is the introduction which illustrates briefly about power quality, distributed generation, and islanding detection. The significance of micro-grid formation, problem statement scope of study and objectives of research work have been highlighted Chapter 2 is about power quality and deals with different power quality indices, their impacts on electric power distribution system and the objectives of power quality. The occurrence of voltage drop in electric power distribution system, its effects and remedial measures, causes of poor power quality and the significance of power quality improvements have also been highlighted.
Chapter 3 delineates distributed generation technologies, its background and resurgence. The application of DG, integration with power quality, benefits, the impacts of DG and main issues related to its operation have been narrated.
Chapter 4 enumerates the islanding phenomena, significance of islanding detection, the effects and causes of islanding detection. The impact of islanding detection on power quality, different types of islanding detection techniques and their review has been carried out.

10
Chapter 5 illustrates simulation and the results of the different case studies performed during the analyses. The salient features of novel algorithms developed for power quality improvement of distribution network have been elaborated.
Chapter 6 comprises of the conclusions, future work and the references are listed at the end.
11
CHAPTER II
POWER QUALITY 2.1 Introduction
Electric power quality is an emerging area of research in the field of electric power distribution system. It has acquired intensified importance since the advent of highly sensitive electrical and electronic equipment [1]. The power quality in the latest power distribution system mainly stresses on the issues of sinusoidal waveform fidelity, absence of high and low voltage fluctuations and other ac waveform distortion. M.M. Morcos and J.C.Gomez, enumerates power quality issue as any occurrence manifested in voltage, current or frequency deviation that results in damage, upset or failure of customer’s equipment [2]. Timothy J. Browne and G. T. Heydt viewed electric power quality as the capacity of electric power system to supply electrical energy to any electric load such that the customer may utilize that energy without any equipment failure [3]. Dugan, Mc Granhan, Santoso and Beaty illustrate the term power quality as those characteristics of electric power distribution system which are considered to be responsible for the smooth functioning of electric equipments. Elaborating it further, one can state the power quality as an electric power problem manifested in voltage, current or frequency deviations that results in failure of load side electric equipments [16]. From electric utility point of view, the power quality is the supply of electrical power as per specified standards, whereas from the end user sight, it is the smooth functioning of electrical equipments without any disruption. In the deregulated and competitive environment, both the electric utilities as well as the customers are becoming increasingly concerned about the quality of electric power. The major reason for increased concerns is that the availability of sophisticated technology has developed extremely sensitive electrical/electronic equipment. Any sort of variation in electrical parameters greatly changes the characteristics of such delicate equipment. Secondly, the innovation in the application of some electrical appliances has been restricted because of extra emphasis on increasing the efficiency of electric power distribution system. Thirdly, the awareness about power quality problems like transients, flicker, sag, and interruption has increased rapidly in the last decade. Lastly, the expansion in the electric power distribution system and the utilization of latest electrical systems has increased the sensitivity of distribution system. Under such circumstances, failure of any electrical equipment may cause significant impact on the over all performance of electric power distribution system. In today’s competitive environment, industrial consumers strive to increase their production with reliable electric supply. Industrialists need efficient equipments and machines that help them to increase their production rapidly. Majority of these applications face the power disruptions and usually become the cause of power quality problems. In most countries, commercial power is made available via nation- wide- grids,

12
interconnecting many generating stations to the loads. The main grid must supply basic national needs of residential, lightening, heating, refrigeration, air- conditioning as well as critical supply to government, industrial, financial, commercial, medical and communication communities. Commercial power literally enables today’s modern world to function at its busy pace. Sophisticated technology has reached deeply into our homes and careers. With the advent of e-commerce, it is continually changing the way we interact with rest of the world. Critical technologies demand power that is free of interruptions [17]. In industrial automatic processing, whole production lines go out of control, creating hazardous situation for on site personnel and expensive material waste. Loss of processing in a large financial corporation can cost thousands of irrecoverable dollars per minute of down time, as well as many hours of recovery time to follow. Widespread use of electronic equipments to control the massive and costly industrial processes has increased the awareness of power quality. The study of power quality and the way to control it is a concern for electric utilities and electricity consumers. Equipments have become more sensitive to even minor changes in the power supply [18]. This chapter deals with different power quality indices, their impacts on electric power distribution system, causes of poor power quality and the significance of power quality improvement.
2.2 Objectives of Power Quality
Today, the power quality objectives have become more and more explicit either in the form of agreements negotiated with customers, or in the form of definite goals agreed with the regulators. In fact, number of regulators already has planned to establish the power quality objectives to be met by the electricity supply systems. In some countries, regulators may even impose penalties in case of non-observance of power quality objectives. It is the key feature of meeting power quality targets that the interested parties agree on the methods of gathering and presenting the power quality data. All the relevant power quality indices are prerequisites for assessing site and system performance with respect to power quality. These indices eventually facilitate the task of system operators with their obligation to report the power quality performance. As the system operators are at the risk of being exposed to the penalty payment for excursions in quality beyond the objective values, it is essential that the objectives are seen not only as achievable but also as being cost effective for all customers. Optimizing the power quality performance of electrical system is one of the objectives of system operator. The role of regulator is to ensure that this objective is carried out in a cost effective manner. If customers expect power quality to be an intrinsic characteristic of the product simultaneously, they also want it at the lowest price [19].

13
2.3 Causes of Power Quality Deformation
The proliferation of microelectronic processors in a wide range of equipment, from domestic appliances to automated industrial and medical diagnostic systems, has increased the vulnerability of such equipment to power quality problems. These problems include a variety of electrical disturbances, which may originate in several ways and have very different effects on various kinds of sensitive loads. In the operation of conventional equipment like lights and constant speed motors, the minor variations in electric power were neglected. Such variation may bring the whole factories to standstill. There are many causes of power quality problems, few of them are illustrated as under. 2.3.1 Capacitor Switching
Capacitor switching is very common in electric power distribution system. It generally causes transient over voltage that disrupts manufacturing electrical machinery. In distribution feeders having heavy loads, capacitors are switched by time clock more frequently. Usually, the power system source is inductive; the capacitor overshoots and rings at natural frequency of the system. The initial change in voltage will not go completely to zero on account of the impedance between the monitoring point and the switch capacitor. Electric utility capacitor switching are transients which are in the range of 1.3 to 1.4 Pu. These transients propagate into the local distribution system and pass through distribution transformer into consumers load. Such transients cause the miss-operation of electronic power conversion devices. The fundamental full load current for capacitor bank is enumerated as follow:
LL
c*kV
φkI
3
3var (2.1)
Where,
cI = Full load current of capacitor bank
vark = Rating of capacitor bank
LLkV = Line voltage Capacitor is subjected practically to two harmonics i.e. is fifth and seventh. The voltage distortions for respective harmonics are 4% and 3%.The resultant harmonic currents are 20% and 21% respectively. An inductance in series with power factor correction bank will reduce the transient voltage at consumer’s bus to reasonable levels. It will also provide correction for the displacement power factor, control harmonic distortion levels within the facility and limit the capacitor switching transients.
14
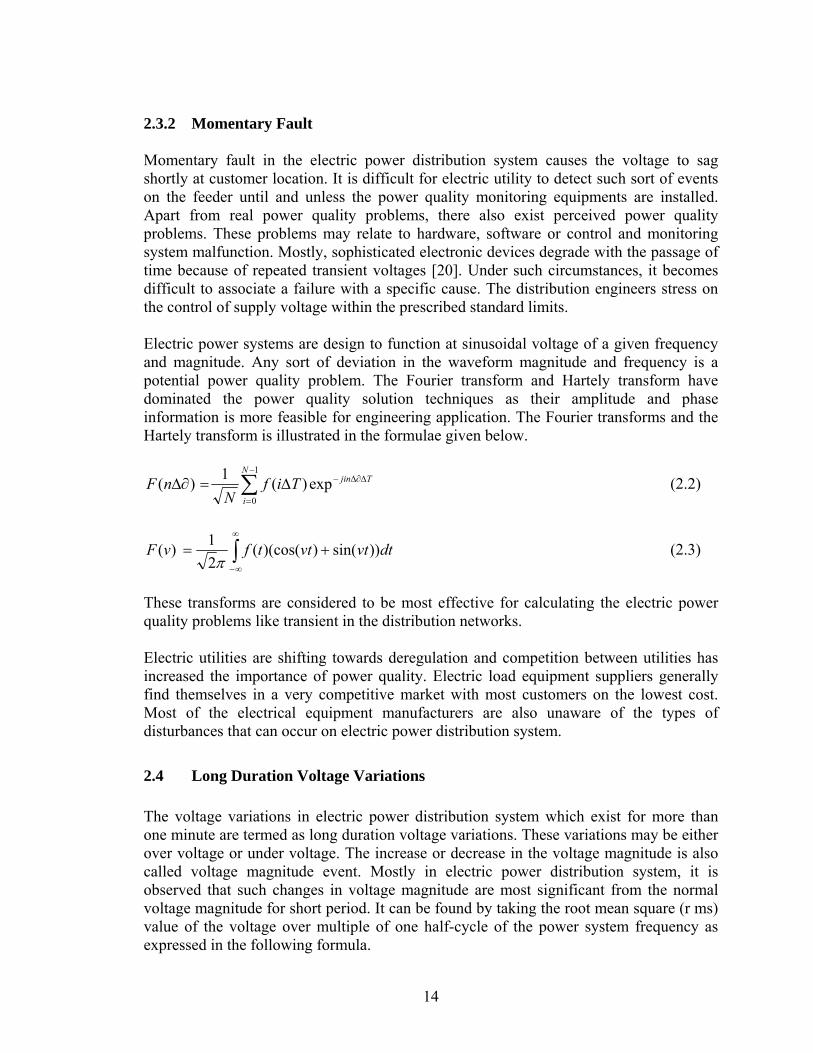
2.3.2 Momentary Fault Momentary fault in the electric power distribution system causes the voltage to sag shortly at customer location. It is difficult for electric utility to detect such sort of events on the feeder until and unless the power quality monitoring equipments are installed. Apart from real power quality problems, there also exist perceived power quality problems. These problems may relate to hardware, software or control and monitoring system malfunction. Mostly, sophisticated electronic devices degrade with the passage of time because of repeated transient voltages [20]. Under such circumstances, it becomes difficult to associate a failure with a specific cause. The distribution engineers stress on the control of supply voltage within the prescribed standard limits. Electric power systems are design to function at sinusoidal voltage of a given frequency and magnitude. Any sort of deviation in the waveform magnitude and frequency is a potential power quality problem. The Fourier transform and Hartely transform have dominated the power quality solution techniques as their amplitude and phase information is more feasible for engineering application. The Fourier transforms and the Hartely transform is illustrated in the formulae given below.
TjinN
i
TifN
nF
exp)(1
)(1
0
(2.2)
dtvtvttfvF ))sin())(cos((2
1)(
(2.3)
These transforms are considered to be most effective for calculating the electric power quality problems like transient in the distribution networks. Electric utilities are shifting towards deregulation and competition between utilities has increased the importance of power quality. Electric load equipment suppliers generally find themselves in a very competitive market with most customers on the lowest cost. Most of the electrical equipment manufacturers are also unaware of the types of disturbances that can occur on electric power distribution system.
2.4 Long Duration Voltage Variations
The voltage variations in electric power distribution system which exist for more than one minute are termed as long duration voltage variations. These variations may be either over voltage or under voltage. The increase or decrease in the voltage magnitude is also called voltage magnitude event. Mostly in electric power distribution system, it is observed that such changes in voltage magnitude are most significant from the normal voltage magnitude for short period. It can be found by taking the root mean square (r ms) value of the voltage over multiple of one half-cycle of the power system frequency as expressed in the following formula.

15
N
Krms tKVN
V1
2 )(1
(2.4)
Where,
ttK There are many reasons of such variations; load variations and switching operations are the most prominent one. Fig.2.1 A typical voltage waveform showing over voltage
An over voltage is an increase in the rms ac voltage greater than 110 percent at the rated supply/ line power frequency for a period of more than one minute. The waveform of over voltage is illustrated in Fig.2.1. There are many reasons of over voltage in the electric power distribution system [21]. The overloading of distribution system, energizing capacitor bank, and switching of large size loads mostly causes the over voltage in the low voltage distribution networks. In rare cases, the negligence of electric utility while maintaining the voltage regulation and incorrect tap setting of transformers in the substation is also responsible for over voltage in the low voltage distribution networks. The under voltage in the electric power distribution system is the decrease in the value of ac r.m.s voltage to 90 percent at a power frequency for more than one minute duration. Under voltage is mainly caused by;
1) Overloading of distribution networks
Over voltage

16
2) Switching on large electric loads, 3) Switching off capacitor banks
Over/under voltage can be eliminated by the installation and operation of appropriate voltage regulation equipments [22]. If the power supply of distribution system remains off for a period of more than one minute, the interruption is of permanent nature and special remedial measures are required from electric utility. The waveform of under voltage is displayed in Fig.2.2. Fig.2.2 Sinusoidal voltage waveform showing under voltage Most of electric utilities try to maintain the service voltage to an end user within ±5% of nominal voltage. Some sensitive loads have more stringent voltage limits for proper operation.
2.5 Short term Voltage Variations
These are the variations in the r.m.s value of voltage from normal voltage for a period greater than 0.5 ac cycles but less than or equal to one minute. Short term voltage variations must not be mixed with steady state changes in the wave form like harmonics, notches, noise etc which can have duration within the range of a short duration, but typically repeat for each cycle of sinusoidal waveform. Short term variations are caused by fault condition such as the energizing of large electric loads that require starting current that is a multiple of the operating current and loose connections in the current carrying circuit conductor. These currents are also called inrush currents as they occur after the energizing heavy loads like three phase electric machines and transformers etc. Because of the large amplitude, the magnetic circuit may saturate and non linear effect may occur. The time domain inrush current is presented in the equation depicted below.
Under Voltage

17
)sin()cos(exp)( tCtBAti oot (2.5)
In Laplace domain,
2222)(
o
o
o s
C
s
Bs
s
AsI
(2.6)
This current is caused by nonlinearities in the transformer B-H magnetization curve and such other heavy electric machines. Short term variations are mostly of 0.5 cycles to 30 cycles to 3 seconds interval [21].
2.6 Power Quality Indices
Different indices are used by distribution engineers for the quantification of electric power quality. These indices have general properties that they are relatively easy to calculate and are calculated using standardized procedures [23]. Modeling power system components in a way feasible for handling waveforms characteristic of different phenomena like switching of loads, notches, impulses and the occurrence of other higher frequencies is a cumbersome job for distribution engineers. A confounding factor is that many of these system components are being operated with load currents and bus voltages which were probably not originally envisioned. Particularly distribution transformers are complex because the windings may behave as distributed parameters systems rather than lumped systems. It is possible to write an index of power quality, known as total harmonic distortion (THD). It is valid only for periodic wave which possesses the Fourier series. THD is a measure of effective value of harmonic components of distorted waveform. THD can be calculated either for voltage or for current. Mathematically, it can be expressed as below.
max
1
2
1
1h
hh
MM
THD (2.7)
Where,
hM =rms value of the harmonic component h of the quantity M .
The r ms value of the distorted waveform is the square root of the sum of the square. The THD is zero for perfect sinusoidal waveform. As the distortion increases, the THD becomes indefinitely large. The THD is related to rms value of the waveform as follows.
max
1
2h
hh
MRMS = 211
THDM (2.8)

18
The THD provides idea of how much extra heat is released when distorted voltage is applied across a resistive load and additional losses caused by the current flowing through conductor. This index is often used to describe the voltage harmonic distortion. The variation in the THD over a period of a time often follows a distinct pattern representing the non-linear load behavior in the system. Current distortion level can be characterized by THD value. Sometimes small current may have high THD but no threat to the system. The magnitude of harmonic is low, even though its relative current distortion is high. To avoid this difficulty, quality engineers refer THD to the fundamental of peak demand load current. This is called total demand distortion (TDD) and serves as the basis for guide lines in IEEE standard 519-1992, recommended practice and requirements for harmonic control in electric power distribution system. Total demand distortion is presented in the following formula.
max2
21 hh h
I
LI
TDD (2.9)
Where LI = Peak demand load at fundamental frequency component determinant at PCC. Majority of these indices are interpreted and applied by distribution engineers. IEEE enumerates the power quality indices in to following categories.
1) Interruptions 2) Transients 3) Voltage sag 4) Voltage swell 5) Waveform distortion 6) Voltage fluctuations 7) Frequency variations
2.6.1 Interruption If supply voltage decreases below a specified limit of 0.1 per unit for time duration of more than one minute, the event is known as an interruption. Control malfunction, equipments failure, and power system faults are few out of many reasons which cause the interruptions. These interruptions are also known as outages. Waveform of Fig.2.3 illustrates the occurrence momentary interruption. Interruptions may be instantaneous, momentary, and temporary or sustained. Duration range for different types of interruptions is as follow.
1) Instantaneous: 0.5 to 30 cycles 2) Momentary: 30 cycles to 2 seconds 3) Temporary: 2 seconds to 2 minutes 4) Sustained: greater than 2 minutes

19
An interruption, whether it is instantaneous, momentary, temporary, or sustained can cause disruption and damage, most probably to industrial customers. A home, or small business computer user, could lose valuable data when information is corrupted from loss of power to their equipments. Probably more detrimental is the loss that the industrial customer can sustain because of interruptions. Many industrial processes count on the constant motion of certain mechanical components. When these components shutdown suddenly from an interruption, it can cause equipment damage, ruination of product, as well as the cost associated with down time, cleanup and restart. Fig2.3 Momentary interruption caused due to equipment malfunction Solutions to help against interruptions vary, both in effectiveness and cost. The first effort should go in to eliminate the likelihood of potential problems. Good design and maintenance of utility system are, of course, essential. This is also applied to industrial customer’s system design, which is often as extensive as the utility system. Voltage interruptions can be eliminated from power by conditioning equipments and uninterruptible power supply (UPS) systems involving battery storage [20]. Protection from interruptions larger than energy storage capability of UPS can be provided from on site generation. Typically, this has taken the form of emergency standby diesel generators. Integration of other kinds of distributed generation (DG) particularly those types that have far lower emissions of criteria pollutants and are thus considered to be more suitable for continuous operation than diesel generators. When power goes out, these forms of alternate power can take over. A computer is the best example of this. When computer is plugged in, it is powered from the wall receptacle and a trickle of energy is passed through computer internal battery to charge it. When computer is unplugged, the battery instantly takes over, providing continuity in power to the computer. Recent innovations in switching technologies allow standby energy systems to be switched on within a half cycle. The term “sustained interruption” describe a situation in a commercial utility system where automatic protective devices, cannot bring power
Interruption

20
back on- line and manual interruption is required. Whereas, outage actually refer to the state of component where it has failed to function as expected. 2.6.2 Transients It is considered to be the most damaging type of power disturbance. There are two types of transients, impulsive and oscillatory [24]. Impulsive transients are sudden peak events that raise the voltage and current levels in either a positive or negative direction. Impulsive transients can be very fast events of short-term duration. Impulsive transients are characterized by their rise and decay times. These phenomena can also be described by their spectral contents. For example, a 1.2/50µs, 2000V impulsive transient rises to its peak value of 2000V in 1.2µs, decay to half its peak value in 50 µs. Due to high frequencies involved, impulsive transients are damped quickly by resistive circuit components and are not conducted far from their source. Oscillatory transient is a sudden, non power frequency change in the steady state condition of voltage, current, or both, that include both positive and negative polarity values. An oscillatory transient consists of a voltage or current whose instantaneous value changes polarity rapidly. Wave shapes applicable to transient and general test conditions are described in ANSI/IEEE C62.4 standard. The energy associated with voltage or current is equal to the integral of instantaneous power, depicted below.
t
dpt t
didvtE0
)(0 0
)(2)(2)( (2.10)
When the energy of a signal over an infinite interval is finite, the signal is termed as an energy signal. When the average power of a signal in an interval [0, T] is finite,
T
average dvT
P0
2 )(1 (2.11)
The signal )(tv is known as power signal, whereas energy signal is one-sided and represented by equation as shown below.
)(exp)( tutv t (2.12) Where )(tu is unit-step function The energy content of )(tv is
2
1exp
0
dtE vt (2.13)

21
Power signal )()( tCostv (2.14)
2
1)(
2
1 2
0
2 dttCosPaverage
(2.15)
For power system transient, the energy or the power of transient is the measure of the intensity of the signal. The frequency spectrum itself, )()( wvtv explain the wave
effectively. The Parseval, s theorem defines the energy of the wave,
dttvE )(2 (2.16)
It is valid for two sided signals t . The inverse of Fourier transform of )(wv is )(tv .
)(exp)(2
1)( wdjwtwvtv
(2.17)
Therefore,
)(exp)(
2
)(wtdjwtwv
tvE
Or
dwwvwvdtdwjwttvE )()(
2
1exp)(
2
1
Or
dWwVdwwVwVdttvE
2|)(|
2
1)(*)(
2
1)(2
(2.18)
Where )()(* wvwv In this way the energy contents of energy signals may be evaluated in either the time domain or frequency domain. There are five different types of transients as depicted below.
1) Rectangular pulse ]]2
t-u[t-]
2
t[u[t)(
Ctv

22
2) Triangular pulse ]]2
T-u[t-][u(t)
T
2C-[Cu(t)]-]
2
t[u[t]
T
2C[C)(
tttv
3) Exp: pulse
))2lnf
-u(t-(u(t)*]1f
tC(2exp[-u(t))-ln2)(u(t]]
ln2-t-
exp[[12)(
r
Ctv r
r
4) Rise/decay time
5) ]]2
-u[t-][u(t)2C
-[Cu(t)]-]2
t[u[t]
T
2C[C)(
TKt
TKttv
6) Damped sinusoid )(4
TCexp*]
T
t2[exp)( tuSin
ttv
These transients can be explained with the help of following indices. The amplitude or crest value signal C, the area of the impulse, the area of the square of the signal E, and the maximum rate of rise of signal R.
2.6.3 Voltage Sag Voltage sag is the reduction of ac voltage at a given frequency for duration of 0.5 cycles to 1.0 minutes. Sags are usually caused by system faults, and are often the result of switching on loads with heavy startup currents. Voltage sag and short duration power outages account for 92% of power quality problems encountered by industrial customers [25]. Common causes of sags include starting of large size loads and remote fault clearing performed by utility equipment. Eighty percent sags exist for about 3 cycles until the substation protective device is able to interrupt the fault. Typical fault clearing time ranges from 3 to 30 cycles, depending upon the fault current magnitude and the type of over current protective devices. Voltage sags can cause over heating in motors and can lead to the failure of non linear loads such as computer power supplies. The voltage sag severity during the starting of heavy electric machines (induction motors etc) badly disrupt the performance of sensitive loads. The voltage sag in per unit of nominal system voltage is calculated as follow.
SCLR
SCsag kVAkVA
kVApuVpuV
*)()( (2.19)

23
Where,
)( puV Actual system voltage, in per unit nominal
LRKVA Motor locked rotor kVA
SCKVA System short-circuit kVA at motor
Electric power utilities are facing many complaints about the quality of electric power due to voltage sags and interruptions. Mostly the industrial customers have sensitive loads and are relying on the industrial processes to achieve maximum productivity to remain competitive in the market. Hence, an interruption and sag have significant economic impact on the utility and customer. Equipment within an end-user facility may have different sensitivity to voltage sags. It depends on the type and nature of the load, control setting and their applications [26]. However, it is difficult to point out which characteristics of given voltage sag are most likely to cause equipment failure. The common characteristics include duration, magnitude, phase shift, three phase voltage unbalance during the sag event, and the point on the wave at which the sag initiates and terminates. The waveform shown in Fig.2.4 expresses the occurrence of voltage sag in the electric power distribution system. Fig.2.4 Sinusoidal waveform showing voltage sag
Devices like under voltage relays, motor drive control, process control and many other types of automated processes are sensitive to the magnitude of sag only. All those electric appliances which use electronic power supplies are sensitive to both voltage sag magnitude as well as sag duration. However, there are some appliances, which are affected by sag characteristics other than magnitude and duration. For end users with
Voltage Sag

24
sensitive processes, the voltage sag ride-through capability is usually the most important characteristic to consider. These loads can generally be impacted upon by a very short duration events and all voltage sag conditions last for at least 4 to 5 cycles. In order to eliminate the effects of voltage sag, electric utility, manufacturers and customers can take the necessary remedial measures all together. Several ideas could easily be incorporated into the consumer’s equipment procurement specifications to help alleviate problems associated with voltage sags. Equipment manufacturers should have voltage sag ride-through capability curves available to their customers so that an initial evaluation of the equipment can be performed. In case, the equipment is critical in nature, the manufacturer must make sure that adequate ride-through capability is included when equipment is purchased. The equipment should at least be able to ride-through voltage sags with a minimum voltage of 70 percent. 2.6.4 Voltage Swell Voltage swell is an increase in ac voltage for duration of 0.5 cycles to 1 minute’s. The common sources of swell are high impedance neutral connection, sudden load reduction and a single phase fault on a three phase system. Fig.2.5 Illustration of voltage swells on a typical sinusoidal waveform The voltage swell may cause the data error, flickering of lights, degradation of electrical contacts, damage to semiconductor devices, and insulation degradation. Power line conditioners, UPS systems and Ferro-resonant control transformer are common solutions to the voltage swell related problems. Over voltage condition may draw high current and cause the unnecessary tripping of down stream circuit breaker as well as overheating and stress on equipment. Voltage swell on a typical sinusoidal waveform is shown in Fig 2.5.
Voltage Swell

25
2.6.5 Waveform Distortion In electric power quality, usually the waveform distortion can be illustrated as the change (steady state) of waveform from its ideal sinusoidal waveform at a specified power frequency. Mainly, it can be characterized by the spectral content of the deviation. Wave form distortion can be classified in to following five major types [16].
1) DC offset 2) Harmonics 3) Inter-harmonics 4) Notching 5) Noise
In particular application, mostly the existence of direct voltage or current in alternating quantity of electric power distribution system is termed as dc offset. Geometric disturbances, electronic power devices like convertors, rectifiers and incandescent light bulb life extenders are the major causes of dc offset. The presence of dc in ac networks has drastic effects on costly electrical equipments like transformers. This effect is usually responsible for additional heating in transformer by biasing its core which not only deteriorates the efficiency but also reduces the life of equipment. A dc offset is illustrated in Fig. 2. 6. Fig.2.6 Illustration of DC offset caused due to operation of non-linear loads The solution to dc offset problems is to replace the faulty equipment that is the source of problem. Having very modular, user replaceable, equipment can greatly increase the ease to resolve dc offset problems caused by faulty equipment with less costs than those required for specialized repair technical’s. Harmonic distortion is the corruption of the fundamental sine wave at frequencies that are multiples of the fundamental. It periodic voltage )(tv of period T is resolved into a Fourier series,

26
)1
0cos(
0)(
ii
tiwi
aatv (2.20)
The individual terms in the sum are termed as harmonic, 0a is a dc term. The
fundamental frequency related to the period T is represented asT
w2
0 . The
fundamental frequency component of current and voltage are present in the sinusoidal waveform. The rms values are expressed as:
12
1VVrms , and
12
1II rms ,
Where,
1V = The amplitude of voltage waveform
1I = The amplitude of current waveform The rms values of the waveforms are computed as the square root of the sum of rms squares of all individual components as illustrated below.
max22
322
212
12)max
1 2
1(
hVVVV
hV
h
hrms
V
(2.21)
max22
322
212
12)max
1 2
1(
hIIII
hI
h
hrms
I
(2.22)
Where,
hV = The amplitude of the voltage waveform at harmonic component h .
hI = The amplitude of the current waveform at harmonic component h .
In the sinusoidal waveform, the harmonic components hV and hI all are zero. The active
power consumed by electric load is expressed as

27
T
dttitvT
P0
)()(1
(2.23)
The equation is valid for sinusoidal and non sinusoidal conditions. Symptoms of harmonics problems include overhead transformers, neutral conductors, and other electrical distribution equipments as well as the tripping of the circuit breakers and loss of synchronization on timing circuits that are dependant upon a clean sine wave triggered the zero cross over point. Fig.2.7 Harmonic waveform distortion due to operation of non-linear electric loads Harmonic problem has been significant problem with information technology (IT) equipment in the past, due to the nature of switch-mode power supplies (SMPS). These non linear loads and many other capacitive designs, instead of drawing over each full half cycle “Sip” power at each positive and negative peaks of the voltage wave. The return current, because it is only short-term, combines on the neutral with all other returns from SMPS using each of three phases in the typical distribution system. An overloaded neutral can lead to extremely high voltages on the legs of the distribution power, leading to heavy damage to attached equipments. At the same time, the loads of these multiples (SMPS) are drawn at the very peaks of each voltage half cycle, which has often led to transformer saturation and consequent heating. Other sources of harmonics are variable speed drives, lightning ballasts and large legacy UPS systems [20]. A typical harmonic waveform distortion is depicted in Fig. 2.7. Methods used to mitigate this problem include over sizing the neutral conductors, installing K-rated transformers, and harmonic filters. Many new information technology (IT) equipment power supplies have been designed with power factor corrected power supplies operating as linear, non-harmonic loads. These power supplies do not produce the waste current of harmonics.

28
Sometimes voltage or current having components that are not integral multiples of the frequency at which the supply system is designed to operate are called inter-harmonics. This non-integral multiple of fundamental frequency is known as inter-harmonic frequency ( ihf ).
0fhf iih ,
Where,
ih is non integer number larger than unity. Inter harmonic frequencies are two adjacent
harmonic frequencies. These inter harmonics appears in pair at the following frequencies,
,4,2 00 ss ffff
Where,
0f and sf are the load operating frequency and the fundamental of the ac main frequency,
respectively. Inter-harmonics are usually the result of a signals imposed on the supply voltage by electrical equipments such as static frequency converters, induction motors and arcing devices. Cyclo-converters create some of the most significant inter-harmonics supply power problems. The most noticeable effect of inter-harmonics is visual flickering of displays and incandescent lights, as well as causing possible heat and communication interference. The periodic voltage disturbance caused by the electronic devices, such as variable speed drive, light and dimmers are termed as notching [20]. It is caused by the normal operation of power electronic devices when current is communicated from one phase to another. The frequency components associated with notching can be quite high and may not be readily characterized with measurement equipment normally used for harmonic analysis. Usually notching occurs when current communicates from one phase to another. In this period a momentary short circuit occurs between two phases, pulling the voltage as close to zero as permitted by the system impedance. Notching also occurs when silicon control rectifiers (SCR) are used in electric power distribution system for the control of sensitive equipments. Practically, notching are irregularities in the voltage wave form. Notching appears when one phase SCR is turned off and the next phase SCR turned on. During this small interval of time, a short circuit exists between the two phases. This results in the current going high and voltage going low. The usual consequences of notching are system halts, data loss and data transmission problems.

29
Fig.2.8 Illustration of notching due to electrical disturbances One solution to notching is to move the load away from equipment causing the problems. UPSs and filters equipments are also viable solutions. Mostly C-filters are used to low-pass broad band filters in reducing multiple harmonics frequencies from heavy loads. They can eliminate steady state and time varying harmonic and inter-harmonic frequencies, generated by non-linear loads. Filter components can be computed as narrated below.
22
)(
)()(
TF
T
cmTF
hR
h
XhR
R
)1
)((
)()( 22
T
T
T
cm
T
cmTF
caLm
h
h
h
Xh
XhR
XX
,
Where,
1)(
12
TSF
STF
hI
XhR
SX Short circuit reactance at fundamental frequency
LMX Reactance of ML at fundamental frequency
caX Reactance of aC at fundamental frequency
Sensitive equipment connected to some voltage source as the equipment producing the notching can be protected by the installation of an impedance reactor. A waveform affected by notching is depicted in Fig. 2.8.

30
Electrical noise is unwanted voltage or current superimposed on the power system voltage or current waveform. It deals mostly to probabilistic phenomenon. In electrical engineering, the term essentially means a stochastic process in which voltage or current is stochastic. Three functions describe noise. Time function itself )(tV , its frequency
spectrum )(wV , and probability density function of the process, )(vfv .The two other
characteristic functions are also used to explain electrical noise. They are;
1) dvvjvv
fV
exp)()( (2.24)
2) |))(ln()( VV (2.25)
The propagation of noise waveform is determined by convolution in the time domain, or by multiplication in the frequency domain,
)()(0
)()()( wIwZt
dtitztv (2.26)
Where,
)(tz = The impulse response between a current at a point A and a voltage at point B.
)(ti = The current at point A.
)(tv = The voltage at point B. If )(ti is the noise source, the above expression are used to calculate the voltage in the network due to noise.
Electrical noise or electromagnetic interferences (EMI) consists of high frequency, low voltage signals coupled onto power line. Noise can come from a variety of natural and manmade sources. Natural sources include lightning, static electricity and solar radiation. Manmade sources include power line, automobile ignition, fluorescent lights, computers, industrial process controls, electronic test equipment, biomedical instruments, communication media and climatic control systems [20]. A waveform of noise is shown in Fig.2.9. Noise can also be generated by power electronic devices, control circuits, arc welders, switching power supplies, radio-transmitters, loads with solid state devices and so on. Poorly grounded sites make the system more susceptible to noise.

31
Fig.2.9 Waveform presentation of electrical noise caused due to various electrical disturbances
Noise can cause various problems such as data errors, equipment malfunction, long term component failure, hard disc failure, and distorted video displays. Radio frequency line filters, capacitors or inductors can be installed at equipment level to lessen susceptibility to EMI. Different approaches are used to control noise. Few methods are, isolate the load via UPS, install a grounded, shielded transformer, relocate the load away from interference source, install noise filters and cable shielding [16].
2.7 Voltage Fluctuations
Voltage fluctuation is a systematic variation of the voltage wave form or series of random voltage changes, of small dimensions, namely 95 to 105% of the nominal at a low frequency, generally below 25Hz.These voltage variations do not exceed the voltage ranges specified by American National Standard Institute (ANSI) that is 84.1 of o.9 to 1.1 pu. Voltage fluctuations are presented in Fig.2.10. Any load exhibiting significant current variations can cause voltage fluctuation. Arc furnaces are the most common cause of voltage fluctuation on the transmission and distribution. One symptom of this problem is flickering of incandescent lamps. Removing the offending load, relocating the sensitive equipment or installing power line conditioning or UPS devices is a method to resolve this problem. The voltage fluctuation wave form is shown in Fig.9.

32
Fig.2.10 Illustration of voltage fluctuations caused due variation in electric current
2.8 Frequency Variation
Frequency variation is extremely rare in stable utility power systems, especially systems interconnected via a power grid. Where sites have dedicated standby generators or poor power infrastructure, frequency variation is more common especially if the generator is heavily loaded. Frequency variation may cause motor to run faster or slower to match the frequency of the input power. According to IEEE standard 1547 TM, the frequency of electric power distribution system must be within the range of 59.3Hz to 60.5Hz. To correct this problem, all generated power sources and other power sources causing the frequency variation should be assessed, then repair, corrected or replaced. Typical frequency variations are depicted in Fig.2.11. Fig.2.11 Typical frequency variations caused by heavy electric load
Frequency Variation

33
2.9 Voltage Imbalance
A voltage imbalance is not a type of wave form distortion. However, because it is essential to be aware of imbalance when assessing power quality problems, simply put, a voltage imbalance is when supplied voltages are not equal. While these problems can be caused by external utility supply, the common source of voltage imbalances is internal, and caused by facility loads. More specifically, this is known to occur in three phase power distribution systems where one of the legs is supplying power to single phase equipment, while system is also supplying power to three phase loads. Greater imbalances may cause excessive heat to motor components and the intermittent failure of motor controllers. The ANSI standard recommends that the electric supply system should be designed and operated to limit the maximum voltage imbalance to 3% under no load condition [27]. Mathematically voltage imbalance can be illustrated, using formula given below.
)(PercentV 100voltageAverage
voltageaveragefromdeviationMaximum (2.27)
A quick way to assess the state of voltage imbalance is to take the difference between the highest and lowest voltages of three phase supply voltage. Remedial measure for voltage imbalance involves reconfiguring loads, or having utility changes made to the incoming voltages.
2.10 Harmonic Distortion
If the voltage or current wave shape is not sinusoidal, it is considered distorted. Harmonic distortion implies that there are higher frequencies than standard frequency that define the power flow. These higher frequencies can disrupt, degrade and damage the equipment [28]. Harmonic distortions mainly occur due to non linear loads in electric power and distribution system. In non linear devices, current is not proportional to applied voltage. Any change in the voltage significantly changes the voltage wave form. Small variation in the voltage greatly changes the current. This abrupt change in current significantly changes the waveform which is mainly because of harmonic distortion. The end user suffers more from harmonic problems than does the utility. Industrial user with adjustable speed drives, arc furnaces, induction furnaces are more susceptible to problems stemming from harmonic distortion. Arc lighting, fluorescent lamps, electronic devices including convertors are other major sources of harmonic distortion in electric power distribution system [20]. IEEE 519 standard provides guide lines for maximum voltage distortion and harmonic current limit at point of common coupling [24]. For uniform linearly increasing/decreasing load patterns of radial distribution feeder, permissible voltage distortion 3% nominal voltage and voltage harmonic magnitude 3% are considered to be tolerable [29]. The total voltage distortion for distribution feeder having bus voltage

34
below 69kV must not exceed 5.0%. Voltage distortion ( hV ) caused to harmonic current is
computed as follow.
hh IjwRCLCw
jwLRV )
1(
2
(2.28)
Where,
)(2 1hfw
,4,3,2h
1f Fundamental frequency of power system 2.10.1 Effects of Harmonic Distortion Mostly non linear loads are considered to be the sources of harmonic currents. The injection of these currents into supply system can adversely affect the utility system. Electric equipment like transformers, motors, and capacitor banks are usually over loaded by these harmonic current, causing the excessive power losses and over heating. Interferences with telecommunication networks and errors in power metering are the other adverse effects of harmonic currents. Unintentional partial discharge or other processes relating to harmonic distortion, gives rise to noise )(tw superimposed on the sinusoidal current,
)()cos()( 0 twtwIti m (2.29)
The energy associated )(ti is,
dttiE )(2 (2.30)
Using the Parseval, s theorem, energy related to the Fourier transform of )(ti is,
)())()(()( 00 wWwwwwIwI m (2.31)
dwm
IdwE
2|W(w)|2|I(w)|
2
1
(2.32)
From the above equations, another term called power quality distortion (PQD) may be defined as,

35
dw
mI
mI
mIE
PQD 2|W(w)|1
22
(2.33)
The presence of capacitance and inductance in the distribution circuits sometimes develops resonance in the networks. Under such situations, the voltage waveforms are distorted badly, causing serious damage to capacitor banks. Voltage harmonic distortion can adversely affect the performance of electric motors. Degradation in the efficiency, high-pitched noises and overheating are the prominent indicators of voltage harmonic distortion. Similarly, harmonic currents generated by non linear loads can interfere with the communication circuits affecting the accuracy of demand meters. 2.10.2 Causes of Harmonic Distortion Harmonic distortion occurs when; source of harmonic currents is too great, source of harmonic currents is of too long duration and the response of the system magnifies one or more harmonics to a greater degree than can be tolerated. 2.10.3 Remedial Measures
1) Minimize the harmonic currents produced by loads.
2) Install the harmonic filters.
3) Modify the frequency response of the system.
2.11 Flicker
It is the modulation of voltage wave form frequencies of less than 25Hz [20]. According to IEC 61000-4-15 and the IEEE 1453-2004 standard, it is detectable to human eye as a variation in light output from standard bulbs. Flicker can be divided in to two types, the cyclic flicker and the non cyclic flicker. Cyclic flicker is created by periodic voltage fluctuation in the system whereas the non cyclic flicker is the result of occasional voltage fluctuation in the distribution system. Usually, the flicker signals are specified as percentage of the normal working voltage.
100mod%0
minmax
V
VVulationVoltage (2.34)
Where,
maxV =Maximum value of modulating signal.
minV =Minimum value of modulating signal.

36
0V =Average value of normal operating voltage.
Flicker is normally expressed as a percent of total change in voltage with respect to average voltage over a certain period of time. The intensity of flicker can be determined by the frequency contents. Typical frequency range is from 0.5 to 30Hz, with observable magnitudes starting at less than 1.0 percent. According to IEEE standard 519TM-1992 [B5], flicker is considered objectionable when it either causes a modulation of the light level of lamps sufficient to be irritating to humans, or causes equipment miss-operation. Flicker level evaluation can be divided in to two types, short term evaluation of flicker severity )( STP and long term evaluation of flicker severity )( LTP .
sssssST PPPPPP 5010311.0 08.028.00657.00525.00314.0
Where,
ssss PPPPP 5010311.0 ,,,, are flicker levels that are exceeded 0.1, 1.0, 3.0, 10.0, and 50.0% of
time
N
PP
N
iSTi
LT
1
3
3 , Where N = Number of STP reading and determine by duty cycle of
flicker producing loads. 2.11.1 Causes of Flicker Large electric loads like Electric furnaces, wielding plants, induction machines, etc are the main sources of flicker in electric power distribution system [20]. A heavy electric load causes considerable variations in current over a short period of time, resulting in flicker. Sudden increase in load increases the current in the distribution line which, in turn, increases the voltage drop across the line. As a result the bus voltage reduces abruptly. This change in magnitude of voltage and frequency causes reasonable amount of flicker. Large industrial load located at the end of a weak distribution network can also be the source of flicker. 2.11.2 Mitigation Techniques Many options are available to alleviate flicker problem. The application of Static capacitors, power electronic- based switching devices and enhancement in the system capacity are few out of them. Flicker effect can also be minimized by modifying the design of motors and using advance solid state technologies. The application of series reactors with heavy load minimizes flicker to considerable extent. Static Var compensators can be used to eliminate the flicker and correct the power factor. Static Var compensators are also very effective in controlling the voltage fluctuations at rapidly

37
varying loads. Electronic-based thyristor switched capacitors are used to supply the reactive power to power system in a very short period of time which can minimize the effect of rapid load variations.
2.12 Voltage Drop
One of the most important constraints on distribution system design is the voltage level of the customer intake point. It is particularly for the vast majority of customers taking supplies at low voltage at different locations and it can indicate the strong and weak parts of network. In distribution system, voltage drop is the arithmetic difference between the sending end and receiving voltages which is the most feasible value of voltage drop [27]. If,
SV = Sending end voltage
RV = Receiving end voltage, then
SV = RV + Line drop (Vd ) (2.35)
For distribution line of length L, the percent voltage drop can be calculated as;
100**)sincos(
3% LV
IXIRVd
(2.36)
Where, V = The line rated voltage In terms of KVAs,
100**)(10
)sincos(3%
2L
kV
IXIRkVVd
(2.37)
For the precise voltage measurements [30] the following formula may used
22 )cossin(sincos IRIXVIXIRVV SSR (2.38)
In general any voltage can be used for distribution of electrical energy. However, due to technical and economic reasons, standard voltages have been used which are the part of international standards. The distribution of electrical energy to customer is the most important aspect of socioeconomic progress in modern civilization. The demand of electrical energy is continually rising all over the world, especially in rural areas of the developing countries. To provide energy and service of the desire quality according to international standard to every customer at the lowest possible cost, it is impossible without optimizing voltage drop on the distribution system.

38
2.13 Voltage Drop Criteria
In electric power distribution system, voltage drop depends upon numerous factors. The type and nature of conductor, the size of conductor and the length of circuit are the few out of many. The supply conductor, if not of reasonable size, will cause excessive voltage drop in an electrical circuit. The voltage drop is in direct proportion to the circuit length. Proper starting and running of motors, lighting equipment, and other loads having inrush currents should be considered. The NEC recommends that the steady-state voltage drop in power, heating, or lighting feeder be no more than 3%, and the total drop including feeders and branch circuits be no more than 5% overall [31].
2.14 Effects of Voltage Drop
Poor performance of equipments, overheating, nuisance tripping of over current protective devices and excessive burnouts are the sign of unsatisfactory voltage at customer’s terminals. Abnormally low voltage occurs at the end of long circuits and high voltage is expected at the beginning of circuits close to the source of supply, especially under lightly loaded conditions such as at night and over weekends. When the voltage at the terminals of utilizing equipment deviates from the value of nameplate of electrical appliances, the performance and the operating life of the equipment is affected. The effect may be minor or prominent depending on the characteristics of the equipment and amount of the voltage drop deviation from the nameplate rating. Generally performance conforms to the utilization voltage limits specified in American National Standard Institute (ANSI) but it may vary for specific items of voltage sensitive equipment [31].
2.15 Causes of Voltage Drop
Voltage drop in electric power distribution system can occur because of various factors. Few of them are mentioned as below [32].
2) Nature and Type of Load, 3) Design of Electrical Installations/Equipments, 4) Layout of Installations, 5) Poor maintenance of the system, 6) Undersize and Lengthy Service Lines.
2.15.1 Nature and Type of Load Most of the distribution system loads are of domestic, residential, commercial, industrial and agriculture nature. Domestic load mostly consists of lights, fans, air conditioners, heaters and motors etc. The industrial and agriculture loads mainly comprise of induction motors and small lighting. Majority of electric loads (Transformers, generators, motors,

39
fans and induction furnaces) are of inductive nature and reactive power is needed for their magnetization. As the power factor is the ratio of active power to apparent power. Therefore, for low power factor, the system has to provide more apparent power (kVA) for the same active power (kW). This decrease in apparent power enhances current demand which has two fold effects. It not only increases the heat (I2 R) losses in the distribution lines and other related equipments but also increases the voltage drop in electric power distribution system. 2.15.2 Design of Electrical Installations/Equipments The design of electrical installations and equipments includes 11kV primary distribution lines, distribution transformers, secondary distribution lines, service mains, and electric meters. Heat loss in the conductors of primary distribution lines is one of the major factors which contribute to voltage drop. Distribution feeders are traditionally designed on the basis of voltage drop and line losses were not considered as design parameters. Most of the third world countries are underdeveloped, lack financial resources, thickly populated having overloaded distribution lines and undersized conductors. Before designing the system, load data is collected and future load forecasts are made. Because of unavailability of latest simulation and design facilities, there are chances of errors in the data collection and load forecasting in the under-developed countries. On the basis of incorrect data, the distribution system becomes heavily overloaded which results in excessive voltage drop in the distribution system. It is obvious that majority of distribution transformers have their maximum efficiency of the load ranging from 40% to 50% load. In most of electric utilities of underdeveloped countries, the distribution transformers are overloaded which incur undesired voltage drop. In electric utility of Pakistan water and power development authority (WAPDA), more than 60% of transformers are unbalanced with lengthy secondary distribution lines. If 10kVA transformer, with unbalanced load from 25% to 30% on three phases, heat losses of transformer are increased by 5% to 6%, causing sever voltage drop. The power losses vary with the distribution circuit configuration. Normally, it depends upon the resistance of network and distribution transformers. If distribution feeder loads are modeled as constant current, the losses in transformers can be neglected as they are not varying with current. Under such scenario, the power losses in distribution transformer can be represented as;
N
ii
Ii
RTF
P1
2 (2.39)
The overall power losses are

40
b
N
jj
Ij
RTF
PP1
2 (2.40)
Where,
iR Resistance of the ith transformer
jR Resistance of jth branch,
N Substation where transformers of iA rated power are installed
bN Branches of distribution network,
iI and jI are the relevant currents
As mentioned earlier, mostly underdeveloped countries are deficient of financial resources, lack of advance technology and because of improper planning, the undersized conductors are heavily overloaded and load distribution is unbalanced. Under such circumstances, heat losses cross the standard limits, resulting undesired voltage drop. The service cables usually contribute very small fraction of voltage drop owing to their limited lengths and higher current carrying capacity. However, if the length of service cable is increased or many connections are allowed on the same service cable, the voltage drop may increase many fold. In many residential areas of underdeveloped countries, particularly in villages, underdeveloped areas, unregistered private housing societies and “Katchi abadies” vast network of secondary distribution cable and chain services are found. The quality of electric supply in such unplanned areas is extremely poor and high voltage drops are noticed. 2.15.3 Layout of Distribution System Geographical layouts of 11kV primary and secondary lines and the location of distribution transformers have great bearing on voltage drop. In most cases, due to lack of planning lines are laid in such haphazard manner that the line length involved is much greater than the shortest possible route to a locality which causes increased voltage drop in the lines. The location of transformers also has significant effect on the voltage drop. In such cases of lengthy 11kV, secondary lines where high currents flow through across them, increase the voltage drop to large extent.

41
2.15.4 Poor Maintenance of Distribution System Poor maintenance of distribution system involves, connectors of transformers and lines, leakage through tree branches adjacent to lines, old and deteriorated service cable, improper sag, any foreign material hanging over or near the line conductors and improper clearance. In majority of cases, the size of cable/conductor used for connectors between secondary distribution lines terminals of transformers and the bus-bar /secondary distribution line is much lower than the required capacity. Similarly the size of conductor used for connectors between main line and tee-off lines or between two segments of a line is of smaller capacity than the line itself. Another factor of increased voltage drop in primary distribution lines/secondary distribution lines is the use of substandard jointing practices. The undersized and loose joint of connectors causes huge amount of hidden power loss and voltage drop. These losses and voltage drops are untraceable and cannot be even though off. In many cases, the branches of trees which are very near to primary distribution lines/secondary distribution lines come in contact with live conductors, causing leakage to earth. This leakage of current causes voltage drop and interruption. Practically it has been observed that some of the existing service cables are old deteriorated, undersized and need to be replaced. Some times, because of utility over look these cables are allowed to remain in operation, by supplying electrical energy to a number of customers. Under such circumstances, sufficient voltage drop has been detected. In rural areas, it has been observed that foreign material like kites, threads etc, and hanging over the line become wet during the rainy season, providing easy path for leakage current. Such leakage of current not only causes the interruption but also contribute to reasonable amount of voltage drop. Improper clearance between line conductors and earth/building and between connectors also contributes to voltage drop. It is also observed that in rural areas of under developed countries, the lengthy and undersize service lines are being utilized. Such undersize and lengthy service lines are also considered responsible for the occurrence of voltage drop.
2.16 Improvement Techniques
Many techniques can be utilized for eliminating voltage drop in electric power distribution system. Few of them are;
1) Capacitor application
2) Re-Conductoring
3) Bifurcation
42
4) Load balancing
5) Reconfiguration
2.16.1 Capacitor Application In ac supply, if the load is of purely resistive nature then the apparent power will be equal to the active power. But in case of inductive loads, the active power is less than apparent power. It means that inductive load draws two types of power. One is called active power and other is reactive power. If reactive power is eliminated, then apparent power becomes equal to active power. The total elimination of reactive power from the system is difficult; rather it can be compensated partially by the application of capacitor [33]. Lagging current usually causes greater voltage drop. This is primarily due to the fact that the reactance of the line is generally greater than resistance. Shunt capacitors are utilized to counteract this voltage drop by producing a “voltage rise” across the line. This voltage rise is given by following formula.
210%
kV
LXCkvaVrise
(2.41)
Where; Ckva =Three phase rating of capacitor. X =Line reactance per mile. L =Distance from substation. kV =Line to line voltage. The installation of capacitor also improves the power factor which in turn reduces the line losses. The application of capacitor in the distribution system provides many benefits [34]. The Reduction in voltage drop, enhancement of overall system voltage, improvement in system voltage regulation, release of system capacity, reduction in the distribution system overloading, increase in system efficiency, reduction in line current, and power factor improvement are the most distinguishable advantages of capacitor utilization in the distribution system.
The other benefits of capacitor application include; reduction of power loss in the distribution system distribution, elimination of capital expenditure involved in system rehabilitation and reactive power compensation.

43
2.16.2 Re-Conductoring Re-Conductoring of distribution feeder is another effective method of voltage improvement and voltage drop reduction. However, this method is costly as it involves the replacement of high impedance small capacity conductor by low impedance high capacity conductor. This technique is recommended only when the benefit cost ratio of re-conductoring is equal or greater than unity. Cost is reduced on the installation of new and dismantling of existing conductor. The benefits include reduction of voltage drop and saving in energy losses for a period of about five years and return value of the dismantled conductor. 2.16.3 Bifurcation Bifurcation is applied to distribution feeder when it is highly overloaded and simple capacitor application and other techniques do not provide the desired results. The existing feeder is replaced by two or more feeders as per requirement of the locality to supply a portion of the existing area. In this method the re-allocation of loads is carried out. Additional feeder(s) are constructed either from the same grid or from another nearby grid station depending on the economic justification and achievement of maximum benefits. This method is costly as it involves the construction of new feeder(s). 2.16.4 Load Balancing This technique is economically feasible and can be accomplished quickly. Load unbalance on the distribution feeder occurs when single phase loads and single phase transformers are not effectively divided among the three phases. If these loads are symmetrically distributed among the three phases of the system, considerable reduction in voltage drop can be achieved. For optimal operation of the distribution feeder, load upon transformers should be distributed equally on the bases of their rated power. To this effect, a load balance index ( bL ) for distribution transformer is illustrated as;
N
j
njt
N
jjtN
init
itb
A
A
A
A
NL
1,
1,
1 ,
,1 (2.42)
Where,
itA , Module of the complex power injected in the network through ith transformer
n
itA , Rated power of ith transformer

44
2.16.5 Feeder Reconfiguration Network or feeder reconfiguration is the process of altering the topological structure of distribution feeders by changing the open/close status of sectionalizing and tie switches. Reconfiguration of distribution feeder can be used as a planning as well as time control tool. Modifying the redialistics of distribution feeder from time to time, by changing the open/closed status of these switches can improve the path of power flow. To be better serve varying locations and time dependent factors of distribution loads. Transfer of load from heavily loaded feeder to lightly loaded feeder improves the operating condition of overall distribution feeder. Feeder reconfiguration allows the transfer of load from heavily loaded feeder to relatively lightly loaded feeder. Such transfers are effective not only in altering the level of loads on the feeders being switched but also in improving the voltage profile along the feeders.
2.17 Implication of Poor Power Quality
Poor power quality in electric power distribution system has many implications. It increases in the line and equipment current leading to additional ohmic losses. The excessive line and equipment current enhances the capital investment. In most of the cases, this increase of current also brings significant changes in the operating temperature of distribution network and electric appliances which not only reduce the life of equipments but also deteriorate the power quality of the system. The losses in the system increases which intern minimizes the efficiency of the distribution system. The numbers of outages in the system increases and severely deteriorates the quality of production in the industry. The frequent malfunction of equipments may also lose the production completely. The distribution engineers try utmost to eliminate the implications of poor power quality by implementing the proper and effective system designs.
2.18 Custom Power Solutions
In the deregulated environment, the manufacturers are less willing to put up with products loss and defects caused by power supply problems. Small outages play significant role in relations among the utilities and customers. Under such circumstances the utilities are bound to mitigate the new and sterner concept of power quality [35]. Custom power solution is implemented on the utility side of the meter and for preference integrates measures on the customer’s side as well. The Majority of the power conditioning devices is custom built to meet certain customer technical performance requirement and target cost. The technical performance is driven by statutory and regulatory requirements, compliance to standard etc. In many cases, the major driver is the financial incentive arising out of the power conditioning. To ensure the optimality of the solution, it is essential to capture all the performance requirements, cost and benefit elements and arrive at an optimal solution.

45
2.19 Advantages of Power Conditioning
The advantages of the power conditioning can be classified into technical and non-technical types. Technical merits are those that accrue due to improvements in operating efficiency and are directly related to basic laws of physics and are invariant with policies and guidelines to greater extent. The reduction of current in line and equipment minimizes the ohmic losses due to reactive power compensation and harmonic filtering is one example out of many. Non technical benefits are those which can be obtained because of fiscal income due to regulatory norms and compliance and are largely dependent upon the existing policies and norms. Although some of the non technical advantages have their roots in technical aspects of power conditioning, largely depend upon utility policies. The general merits of power quality improvement include;
1. Minimization of line and equipment currents, losses and thus lowered energy bill. 2. Release of blocked capacity and consequent avoided cost of capital investment. 3. Power factor improvement and avoided penalty for low power factor. 4. Reduction in maximum demand and reduction in demand charges. 5. Benefits in taxes such as accelerated depreciation benefits for installation of
power conditioning or energy saving devices. 6. Voltage profile improvement and consequent effective operation of electrical
devices. 7. Elimination of harmonic distortion and consequent reduction in copper loss, core
loss and stray loss. 8. Prevention of malfunction of equipment and avoided loss of production. 9. Elimination of unplanned outages and reduction in loss of production and
revenue. 10. Reduction in failure of equipment due to reduced electrical and thermal stresses. 11. Increased life and reliability of electrical devices due to lower operating
temperatures and lower losses.
2.20 Summery
Electric power quality is an electric power problem manifested in voltage, current or frequency deviations those results in failure of load side electric equipments. From electric utility point of view, the power quality is the supply of electrical power as per specified standards, whereas from the end user sight, it is the smooth functioning of electrical equipments without any disruption. In the deregulated and competitive environment, both the electric utilities as well as the customers are becoming increasingly concerned about the quality of electric power. The major reason for increased concerns is the availability of sophisticated technology that has developed extremely sensitive electrical/electronic equipment. Any sort of variation in electrical parameters greatly changes the characteristics of such delicate equipments. Widespread use of electronics in

46
the system from home electronics to the control of massive and costly industrial processes has increased the awareness of power quality. The study of power quality and way to control it is a concern for electric utilities and electricity consumers. Equipments have become more sensitive to even minute changes in the power supply. Different indices are used by distribution engineers for the quantification of electric power quality. These indices have general properties that they are relatively easy to calculate and are calculated using standardized procedures. Majority of these indices are interpreted and applied by distribution engineers. The proliferation of micro-electronic processors in a wide range of equipment, from domestic appliances to automated industrial and hospital diagnostic systems, has increased the vulnerability of such equipment to power quality problems. These problems include a variety of electrical disturbances, which may originate in several ways and have very different effects on various kinds of sensitive loads. Distributed Generation (DG) is said to be power generation paradigm of the new era because of its ability to resolve many customer problems, especially from power quality point of view. DG is used to provide electricity service at a high level of reliability and power quality than conventional grid power system. DG is capable of protecting sensitive loads from momentary voltage variations. It can provide uninterruptible power supply to ride through any sort of outage until primary or secondary power is restored. It is environmental friendly, promotes renewable energy resources, improves system power factor, and power quality in terms of node voltage drop and power loss reduction. A DG system provides protection from long term outages. Power quality system needs to include important design criteria that relates to system hardening. It is necessary to understand the business mission and the tolerance for outage. To eliminate the power quality and reliability disruptions, a facility may seek to minimize its energy prices by introducing DG.
47
CHAPTER III
DISTRIBUTED GENERATION
3.1 Introduction
There is no conflict on the definition of Distributed Generation (DG). Majority of the electrical engineers define it on the basis of voltage level. Many others illustrate it on the principle that DG is connected to the circuit from which customer loads are supplied directly. Some are of the opinion that DG can be defined on the basis of some basic characteristics. Others define DG as all generating units with a maximum capacity of 50MW to 100MW, that are usually connected to distribution network and they are neither centrally planned nor dispatch. The IEEE, on the other hand, define DG as the generation of electricity by facilities that are sufficiently smaller than central generating plants so as to allow interconnection at nearly any point in electric power system. International Energy Agency, in turn, considers DG as the units producing power on customer’s site and supplying it directly to the local distribution network. Still other define DG as relatively small generating units of 30MW or less, which are sited at or near customer sites to meet specific customer needs, to support economic operation of distribution grid or both[36-38]. From operational point of view, DG has two basic types, dc source such as fuel cells, photovoltaic, and battery storage and the other is high frequency ac source such as micro-turbine. In either case, the source is required to be interface with utility ac network, using voltage source inverter. There is an urgent need to control the flow of real and reactive power (P, Q) between DG and utility main grid. The value of P relies on the power angle, and Q on the magnitude of converters output voltage, V. The system power P and voltage E can also be control independently. The basic coupling equations are;
sinwL
VEP , cos
2
wL
VE
wL
VQ (3.1)

48
Line to line voltage for DG is presented as;
)sin(wtwKV vLL (3.2)
Where,
vK =Voltage constant
w = Electrical angular frequency The dc bus voltage regulation for full wave rectifiers with constant current output can be expressed as;
dcdc IV
3wL-|V|
3LL (3.3)
Equation 3.2 and 3.3 allow expressing the dc voltage as a function of angular frequency and current.
dcadcDG wIKVE (3.4)
Where the open circuit dc voltage, DGE is;
wKE bDG (3.5)
Where constants, aK and bK are define as;
/rad/sec] [3
L
K a
V/rad/sec] [3
v
b
KK
Equation 3.4 illustrates the electro-mechanical nature of the system. Input power can be expressed as function of dcI
2dcadcbdcdc wIKwIKIVP (3.6)
Distributed Generation (DG) is an emerging concept in the electricity generation which represents a feasible alternative for electricity supply instead of traditional centralized power generation concept. The liberation of energy market and new condition in the energy field are leading towards the finding more ways of energy production and

49
management. The electricity market place is passing through a tremendous transformation as it moves towards a more competitive environment. The combination of utility restructuring, technology evolutions, recent environmental policies provide the basis for DG to progress as an essential electrical energy option in near future. Utility restructuring opens energy markets, allowing the customer to select the energy provider, methods of delivery and attended services [39]. The major drivers of restructuring are that the need for electricity is escalating locally as well as internationally [40]. The recent developments in the technologies have made tremendous gain in the performance of small and modular distributed generations which are much cost effective. World wide Environmental concerns have placed premium on the efficiency and environmental performance. Also a deep concern has been developed regarding the reliability and quality of electric power [41]. Under such circumstances, the Distributed Generation has attracted the attention of distribution engineers.
3.2 Background
DG is said to be any electric power production technology that is integrated within electric power distribution systems, available near the load connected locally, typically smaller than30MW. The concept of DG contradict with the traditional centralized power generation concept, where the bulk of electricity is generated in large power stations and is transmitted to electric customers through transmission and distribution line. Whereas, central power systems remain critical to the global energy supply, their flexibility to adjust to changing energy needs is limited. A simple circuit of utility main and DG is presented in Fig.3.1. DG is connected to point of common coupling (PCC) through static switch.
Fig3.1 Circuit diagram of main source and DG

50
The distribution system power capacity sP is expressed as;
DGPu
Ps
P (3.7)
Where,
uP = Power received from distribution system in standard units.
DGP = Power generated by DG in standard units
uP can be treated as a large generated power located at the substation site. DGP is the
expected contribution of all online DG where
N
iiDG PP
1
(3.8)
Where,
Pi Power out put of DG unit i in standard units N = Number of working DG units. Some times, in distributed electricity system micro generators are connected directly to local loads like factories, households, offices and lower to distribution networks. The non traditional model of DG has diverted the attention because of its potential to cost effectively increase system capacity while meeting the industry restructuring objective of market driven, customer oriented solution. Normally DG systems, capable of operating on a broad range of gas-fuels, offer clean, efficient, reliable and flexible on-site power alternative. Such an emerging portfolio of DG options being offered by electric companies and independent power producers is changing the way customers view energy [42].Especially DG appears very attractive to planning engineers, regulators and the market generally because it provides the option of reducing investment in transmission and distribution systems and also reducing the energy losses. Technologies such as micro-turbine are available in capacities under 100kW. Large scale power plants, no longer have significantly lower costs than smaller plants. Investors have interest in the future of DG, not only for cost savings but also for additional reliability and power quality that it may provide to whole electric utility system. DG may play significant role in further innovations in wholesale and retail markets, in reducing the cost of electricity when traditional supply is tight or market demand is more.

51
3.3 Resurgence of DG
In the competitive and deregulated environment, from the few decades the norm for electric power industry in developed nations has been to generate power in large centralized generating stations and to distribute the power to customers through transformers, transmission lines and distribution lines. This system is commonly known as the “wire” system. Although, the actual electrical power systems, consisting of relatively small generators configured in isolated islands used DG. Distributed Generation has attracted the attention of power engineers because it is economically feasible, environmental friendly, defers transmission and distribution lines expenses and provides electric power locally near customer’s terminals [43]. This led to a spurt in the largely because of economies of scale development of Distributed Generation facilities. In early 90s interest in DG was increased with the development of improved DG technologies and deregulation of power industries allowing more power producers to participate in the market. The generation was planned in such a fashion that it could satisfy the demand. Later on, the increasing energy demand was satisfied installing big generating plants, generally near the primary energy sources and the generated power was transmitted through transmission lines. In this traditional concept the electricity production has the four stages (generation, transmission, distribution and consumption) as mentioned in Fig.3.2.
Fig.3.2 Traditional concept of generating electrical energy On the other hand, there is no need of transmission system for distributed generation as they are located close to the loads. Consequently it changes the tendency of circuit topology. In the new concept of electrical energy generation, the power flow is not unidirectional like the Fig.2. On contrary, distributed generation provides a new scheme
Stage2
Stage4
Stage3
Generation
Transmission
Consumption
Distribution
Stage1 Power

52
as presented in Fig.3.3. In this scheme, one part of the demanded energy is provided by the conventional central generation, while another is supplied by distributed generation. The emergence of highly sensitive loads and customer’s awareness about the quality of power require much greater reliability than can be achieved by existing distribution system (wires system) delivery alone has created a demand for local generation to complete the gap [44]. Fig.3.3 New concept of generating electrical energy
In the competitive environment, because of numerous problems faced during the implementation of existing distribution system, wires are still considered to be very effective and durable compared to generation technologies. Properly installed wire system remains function smoothly for years to come with almost negligible repair and
Generation
Transmission
Consumption
Distribution
Distribution
DG
Power

53
maintenance. The innovation in the technologies would allow the generation to be as widely dispersed as the load and interconnected power grids could be small [45].
The purpose of deregulating electric utilities is not only to achieve better prices for power but enabling new technologies to cope with the growing demand for electric generation effectively.
3.4 DG Technologies
Many countries practice different DG technologies for small scale generation according to the availability of the sources locally [46]. Some of these are briefly mentioned below. 3.4.1 Reciprocating Engines
Reciprocating technology was developed more than a century ago, and is still widely utilized in a broad array of applications. The engines used are from less than 5 to over 5000kW, mostly fueled by diesel, natural gas, etc. Development efforts are continued to improve the efficiency and to reduce the emission levels. It is cheap as compared to other technologies. Reciprocating engines are mainly used for backup power, support the transmission and distribution system in emergencies, peak shaving and for cogeneration purposes. It is quite popular with end users for emergency and backup power. The main disadvantage of this technology is the emission of poisonous gases during its operation. Consequently it minimizes the operating time to a few hours. Natural gas fired engines causes less pollution as compared to diesel engines .On the whole, this technology have consistent performance characteristics over a wide range of environmental conditions as it is less sensitive to ambient condition [46].
3.4.2 Micro -Turbine In context of DG technologies, it is considered to be a new and emerging technology with model ranging from 30 to 200kW. Micro turbines are just entering the marketplaces. The emission level is comparatively less than reciprocating engines but they are expensive. Because of it low efficiency, it is not generally cost competitive for electricity alone. Mostly, commercial and industrial facilities micro turbines have compact packaging and have low emissions and are normally considered as environmental friendly. This technology is preferably used for combine heat and power application. It has the ability to utilize different types of fuels. 3.4.3 Photo-voltaic It is commonly known as solar panels, widely available for both commercial and domestic use. They are available in the range of less than 5kw and more units can be combined to form a system of any size. They produce no emission and require minimal maintenance. However, they are in developing stage and are costly. Less expensive components and advancements in the manufacturing process are required to eliminate the

54
economic barriers now impeding wide-spread use of photo-voltaic systems. They are being used in remote locations without grid connections. Once installed, the incremental, cost of electric generation is low. It has high initial cost but still it is favored by many environmentalists as being environmental friendly [43]. 3.4.4 Fuel Cells Fuel cells are very efficient as well as have very low emission levels. They act like a battery and provide electricity by combining hydrogen and oxygen electrochemically without combustion. However, battery is a storage device for energy that is eventually used up and must be recharged; the fuel cell is permanently fed with fuel and an oxidant, so that the electrical power generation continues. The end product is pure water; the electrochemical reaction generates electricity and heat without any flame. A single cell may provide less than one volt, so a series of fuel cells are normally “stacked” one on another to increase the out put power. The basic cell has two electrodes separated by electrolyte. One of the electrodes is supplied with fuel, while the other with oxygen by simply pumping air in. This technology occupies relatively less space, very quite, and has virtually no harmful emission during operation. They can use for combined heat and power application. It produces dc power for which an inverter is required to convert it into ac power. The main drawback is it cost. This technology is ten times more expensive than reciprocating engines. 3.4.5 Wind Turbine System This system ranges in size from less than 5 to over 1000kW. This technology provides relatively less expensive way to produce electricity. It’s depend on variable and somewhat unpredictable wind, are unsuitable for continuous power needs. Development efforts look to pair wind turbines with battery storage systems that can provide power in that period when the turbine is not running. Wind turbines are used in remote areas and which are not connected to grid [47]. The main issue with wind generation is the voltage regulation. It tends to be located in sparsely populated areas where the grid system is relatively weak.
dSL VVV (3.9)
Where,
LV = Load voltage,
SV = Source voltage,
dV = Voltage drop in the line impedance

55
The implementation of basic circuit laws gives, the magnitude of the rms load phase voltage, | | LV can be expressed as function of infinite bus voltage, load complex power, total line reactance and power factor as;
6
|S|)1(4V|S|129V|)S|2(3V | |
2L
222sL
4sL
2s
BXXBX
VL (3.10)
Where,
sV = Infinite bus voltage,
| | LS = Absolute value of load complex power,
X = Total line reactance
B = (PF)-11) ( 2L
nL (3.11)
in which loadfactor power leadingFor 1
loadfactor power laggingFor 2
Ln
3.4.6 Bio-Mass Based DG System Economic drivers for use of locally available non-conventional energy sources are important for DG. Biomass is most suited for distributed electricity generation as it offers a number of advantages. It is renewable, widely and locally available and has the potential to provide significant employment in rural areas. It has ability to produce “firm” power that can be dispatched conveniently. It has also amenability to storage and use as per power demand. It has similar combustion characteristics which may even enable partial co-firing with coal. There is no need for elaborated pre-firing preparation. 3.4.7 Small Hydroelectric Power System Small hydroelectric system depends on the availability suitable water flow, where the resource exists. It provides cheap, clean and pollution free electric generation. A well designed small hydroelectric power system can blend with its surroundings and have minimal negative environmental impacts [43]. For rural electrification projects, especially in those areas of villages where perennial source of water is available, such small hydroelectric system is very effective. The advantages include;
1) It is a continuous and renewable source of electric energy.
2) Environmental friendly, no heat or emission of toxic gases.
3) No fuel cost and with low operating and maintenance costs, inflation proof.

56
4) Offer reliable and flexible operation.
5) Have long life.
6) No warm-up period is required.
3.5 DG Applications
DG is currently used by some customers to provide some or all of their electricity needs. There are some customers who utilize DG to minimize demand charges imposed by their electric utility, while other use it to provide primary power or eliminate environmental emissions. DG can also be used by some electric utilities to enhance their distribution system [48]. Many other applications for DG solutions exist. Some of them are; Continuous power, combined heat and power, Peak power, Green power, Premium power, Transmission and Distribution deferral, and Ancillary service power 3.5.1 Continuous Power In this application DG is operated to allow a facility to generate some or all of its power on a relatively continuous basis. Currently, DG is being utilized most often in a continuous power capacity for industrial application such as food manufacturing, plastics, rubber, metals and chemical production commercial sector usage, whiles a fraction of total of industrial usage, includes different sectors like grocery stores and hospitals. 3.5.2 Combined Heat and Power Some of DG waste heat is used for water heating, space heating, steam generation or thermal needs. To some extent, this thermal energy can also be used to operate special cooling equipment. DG characteristics for combined heat and power include;
1) High usable thermal output.
2) Low variable maintenance cost.
3) Low emission
3.5.3 Peak Power For this application, DG is operated between 200-3000 hours per year to reduce over all electricity cost. DG units can be operated to reduce utility’s demand charges and differ the buying of electricity during high price periods or to allow for lower rates from power providers by smoothing side demands. Important DG characteristics for peak power include;
1) Low installed cost.
2) Quick start up.

57
3) Low fixed maintenance cost.
Peak power applications can offer by those energy companies to clients who want to reduce the cost of buying electricity during high price periods. The most common applications are in educational facilities, lodging, miscellaneous retail sites and some industrial facilities with peak load profiles. 3.5.4 Green Power DG units are operated by a facility to reduce environmental emissions from generating its power supply. Some of distinguishing characteristics for green power application are; Low emission, high efficiency, low variable maintenance cost. Green power can also be used by energy companies to supply customers who want to purchase power generated with low emission. 3.5.5 Premium Power DG is used to provide electricity service at a high level of reliability and power quality than typically available from the grid. The growing premium power market presents utilities with an opportunity to provide a value-added service to their clients. Customers typically demand uninterrupted power for a variety of applications. Premium power can be utilized as emergency power system, standby power system and true premium power system. Premium power as an emergency provides electricity within a specified time frame to replace the normal source during it failure or outage. It is an independent system. This system is particularly used to provide power to critical loads whose failure would result in property damage and threatened health and safety. Customers include apartments, offices, hospitals, commercial buildings, hotels, schools and wide range of public gathering places. Premium power when utilized as a standby power, it acts an independent system and provides electricity to replace the normal source if it fails and thus allows the customer’s entire facility to continue to operate satisfactorily. Such a system is essential for customers like airports, fire and police stations, military bases, prisons, water supply and sewage treatment plants, natural gas transmission and distribution system and dairy farms. Customers who demand uninterruptible power, free of all power quality problems, use premium power as true premium power system. Power of such quality is not available directly from the grid. It requires both auxiliary power conditioning equipments and either auxiliary or standby power. Alternatively, a DG technology can be used as the primary power source and the grid can use as a backup. This technology is used by mission critical system like airlines, banks, insurance companies, communication stations, hospitals and nursing homes. It characteristics includes; quick startup, low installed cost, and low fixed maintenance cost.
58
3.5.6 Transmission and Distribution Deferral In some cases, placing DG in strategic locations can help delay the purchase of new transmission or distribution system and equipment such as distribution lines and substations. The main characteristics are; cheap installation, and low fixed and maintenance cost The utilization of DG facilitates the electric utility to generate electric power near the load, power flows are reduced and the up-gradation of distribution network is eliminated. The benefit obtained in the form of time value is expressed as;
)f
11(
fC
i
ife
B
(3.12)
Where,
fC = Revenue requirement to upgrade the feeder f without DG
= Real interest rate
if = Time by which the investment on the distribution feeder f is differed by the firm operation of DG located at bus I during peak load hours. The quantification of this benefit relies on electric utility cost structure, expansion strategies, the type and the nature of feeder. 3.5.7 Ancillary Service Power Usually DG is used by an electric utility to provide ancillary services at the transmission or distribution level. In deregulated environment, DG applications are preferred over the existing technologies. Ancillary services include spinning and non-spinning reserves.
3.6 Significance of DG in Power Quality
Modern electric power supply system comprise of complicated grid of many electrical components including power generation supply, transmission, voltage control, distribution with multiple points of supply and use. The complicated interaction of components of the grid leads to temporal changes in the characteristics of the power that an individual customer sees at its service panel. These variations range from nearly instantaneous to an extended period of outage. Taken as a whole, the presence or absence of such variation is termed as low or high power quality [49]. The degree to which power is provided with and without interruptions is termed as low to high reliability. The latest advancement in the technologies has changed the nature of business and power

59
consumption over time with the introduction and widespread use of sensitive electronic devices, a greater reliance on computers programmable logic controller for controlling industrial processes, and a need for constant communications with customers, suppliers, and financial information. As a result of these changes, some businesses and even some residential customers experience economic losses or make investments in custom power systems that can both condition and supplement purchased power so that sensitive systems may not get damaged or interrupted [50]. The manufacturer, distribution, scale and installation of this equipment and the business that utilizes it are referred to as the premium power market. Mostly, DG is considered to be a modular power generation at or near customer site and loads. The location and application of DG can potentially provide economic values. Such values that can be achieved by DG are as follows. 3.6.1 Combine Heat and Power An important benefit of DG is that the thermal energy that is not usually used when backup generation is implemented can be utilized for process heat requirement. This dual use of thermal and electrical energy can make combined heat and power more cost effective for customers than separately buying electric power and fuel for thermal needs.
3.6.2 Low Cost Energy
If there are no or low fuel costs or if customer is remote from or not connected to central power grid, a DG system can provide lower energy costs than central station generation even without heat recovery. The energy costs depend on the price for fuel ( FP ), price
for importing electricity ( eiP , ), and price at which electricity is fed ( feP , ). The cost
function horizon of N, is therefore given as;
))(( ,,,,,,,
1
0,2,1 femkfemkfemkeiF
N
mmkmk PPPffCost
(3.13)
The decision variables in the cost optimization are mkfemkeimkmk andff ,,,,,2,1 ,,, .
3.6.3 Peak Shaving DG can be applied affectively to minimize demand charges by the local utility by providing only during peak periods [36]. The application can both reduce the customers overall energy costs by reducing peak demand and contribute to enhance the capacity of the central power system to serve other customers although no utility that we are aware of is compensating the DG owner for this benefit.
3.6.4 Standby Power
DG can support customers operation during periods of extended outage of grid. These systems take over emergency loads during grid outage [36].

60
3.7 Integration of DG and Power Quality
The integration of DG and power quality can be achieved through many elements. Few of them are Fast response from energy storage to protect the load from momentary voltage variations, conversion of stored energy into clean power, Seamless or soft transfer to the alternate power source and back again, control for synchronization and paralleling between systems, immediate isolation from any grid disturbances, sufficient amount of stored energy to ride through an outage until primary or secondary power is restored, and ability of DG system to provide clean power to critical loads. A standby generator provides protection from long term outages. Power quality system need to include important design criteria that relates to system hardening. It is also essential to understand the business mission and the tolerance for outage. Separate from needs to avoid power quality and reliability disruptions, a facility may seek to decrease its energy costs by installing DG.
3.8 Location of DG
The location of DG in electric power distribution system has great influence on its performance and efficiency [51]. It must be available as and when needed. For capacity relief and basic power supply issues, the substation is the ideal location for DG. However, if DG is required for the support of distribution network, it must be installed away from substation. It will also relieve capacity constraints on transmission and distribution system. This application is becoming more common as a means to defer expansion of the conventional distribution system. The capacity relief benefit is nullified when distribution system is upgraded and no longer has any constraints. Sometimes optimal DG location problem is solved similar to shunt capacitor location on distribution feeders. The application of DG to relieve feeder capacity constraint is illustrated in Fig.3.4. Many of the algorithms have been designed for this purpose. Most of them utilize the same rule of thumb, for example if load is uniformly distributed along the feeder, the optimal location for loss reduction and capacity relief is approximately two-thirds of the way down to the main feeder [52]. For multi-DG scenario further computer programming and analysis are required. Practically it has been noticed that utility does not have a choice in the feeder having DG connected. This is given for customer-owned generation and the problem is determined if the location has any capacity related value to the power delivery system. Different algorithms can be employed to evaluate the problems. Distribution networks are very complex and constrained by very small area that may affect the large geographical area. Most of the feeders are radials and there is generally not a constraint so severe that the DG application will allow the severing of additional load several times greater than the size of generator. Optimum location of DG not only minimizes the power loss but also enhances the quality of power in terms of node voltage profile improvement and voltage drop reduction [53].
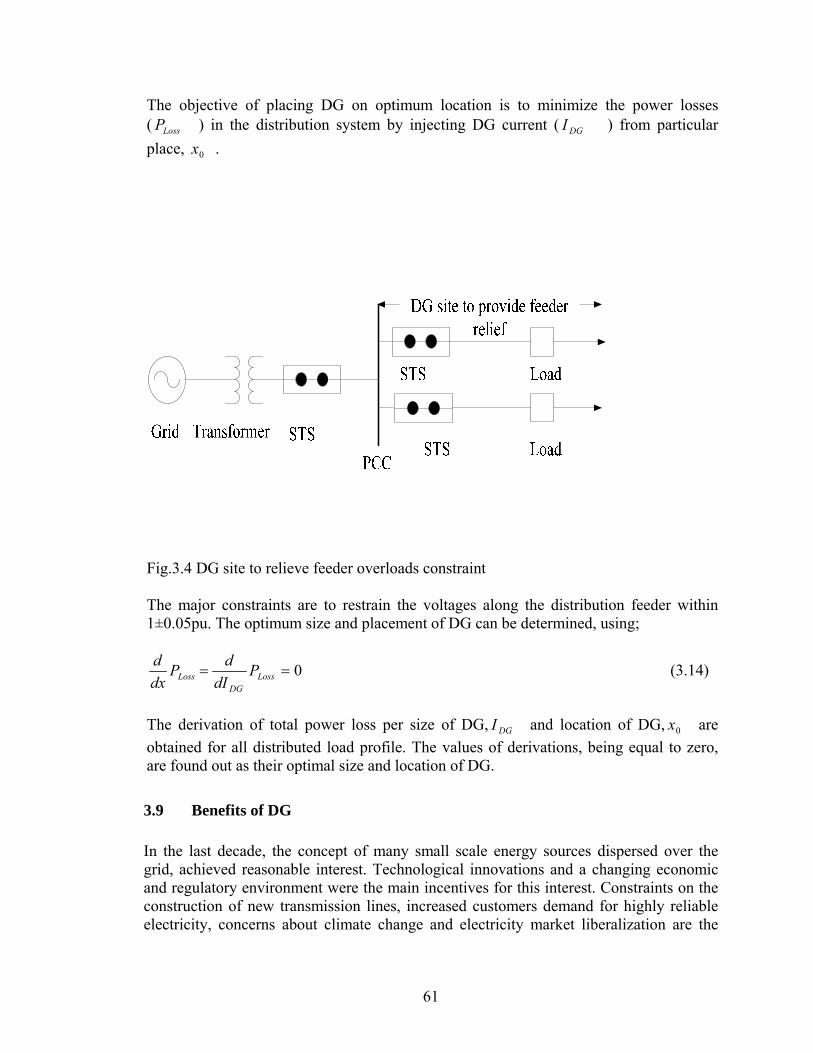
61
The objective of placing DG on optimum location is to minimize the power losses ( LossP ) in the distribution system by injecting DG current ( DGI ) from particular
place, 0x .
Fig.3.4 DG site to relieve feeder overloads constraint
The major constraints are to restrain the voltages along the distribution feeder within 1±0.05pu. The optimum size and placement of DG can be determined, using;
0 LossDG
Loss PdI
dP
dx
d (3.14)
The derivation of total power loss per size of DG, DGI and location of DG, 0x are
obtained for all distributed load profile. The values of derivations, being equal to zero, are found out as their optimal size and location of DG.
3.9 Benefits of DG
In the last decade, the concept of many small scale energy sources dispersed over the grid, achieved reasonable interest. Technological innovations and a changing economic and regulatory environment were the main incentives for this interest. Constraints on the construction of new transmission lines, increased customers demand for highly reliable electricity, concerns about climate change and electricity market liberalization are the
62
major drivers for the development of DG. These technologies have numerous advantages [42, 43, 48, and 54]. They are classified into following three types. 3.9.1 Customer’s Benefits
DG is considered to be power generation paradigm of modern era because of its ability to resolve many customers’ problems, especially from power quality point of view. DG is used to provide electricity service at a high level of reliability and power quality than conventional grid power system. It is environmental friendly, promotes renewable energy resources, improve system power factor, and improved power quality in term of node voltage profile improvement and power loss reduction. Node voltage profile improvement is achieved, using the voltage profile index (VPI ) as;
withoutDG
withDG
VP
VPVPI (3.15)
N
iiii kLVVP
1
, (3.16)
Where,
11
N
iik
withDGVP = Voltage profile with DG
withoutDGVP =Voltage profile without DG
iV = Voltage magnitude at bus i in per unit
iL = Load at bus i in per unit
N = Total number of load buses in the distribution system
ik = Weighting factor
Many other benefits can be accrued by customers; few of them are listed below.

63
1) Properly located, installed and operated DG can improve the reliability of electric supply, essential to business and industry. It is extremely important for sensitive and critical loads where the interruption of service is unacceptable economically.
2) New innovation in DG technologies provides opportunities of selecting the right energy solution while using DG.
3) Utilization of DG in electric power distribution system offers a best stand-alone power option for areas where transmission and distribution infrastructure does not exist or is too expensive to build.
4) DG may offer efficiency gains for on-site application by avoiding line losses, and using both electricity and the heat produced in power generation for processes or heating and air conditioning.
5) As DG(s) are small modular units and because of their flexibility in operation, enables savings on electricity rates by self generation during high-cost peak power periods and adopting relatively low cost interruptible power rates.
6) DG(s) are considered to be environmental friendly, as they promote renewable energy sources, less-polluting forms of fossil energy.
7) These sources of electric generation offer customers a choice in satisfying their particular energy needs.
8) Provides locations flexibility by virtue of small size, superior environmental performance and fuel flexibility.
9) DG(s) provide improved power quality in terms of node voltage drop and power loss reduction.
DG may help to eliminate the sag problem. It depends on the type of technology, location and interconnection of DG. Fig.3.5 demonstrates the case in which DG is connected on the load side of the main source. During the voltage sag, DG can help support the voltage magnitudes. It influences the sags at its own load bus, supported by the impedance of the service transformer that provides some isolation to the source of sag on the utility system. 3.9.2 Electric Utility Benefits DG can minimize line losses under heavy load condition. Electric utility is bound to shift the cost of line losses to customers in terms of high energy cost. These losses can be reduced by applying line loss reduction index ( LLRI ) as;

64
withoutDG
withDG
LL
LLLLRI (3.17)
Where,
M
iiiiAwithDG DRILL
1
2, (3.18)
Where,
iAI , = Per unit current in line i with the application of DG
iR = Resistance of line i
iD = Length of line i
M = Number of lines in the distribution system
Fig.3.5 DG may help reduce voltage sags on load bus.
65
M
iiiLwithoutDG DILL
1
2, (3.19)
Where,
iLI , = Per unit line length in the line i without DG
withDGLL = Line loss with DG
withoutDGLL = Line loss without DG
DG limits capital exposure and risk because of size, location flexibility, and rapid installation time afforded by the small, modularly constructed, environmental friendly and flexible systems. 1) Eliminates unnecessary capital expenditure can be prevented by closely matching
capacity increases to growth in demand.
2) DG avoids major investments in transmission and distribution upgrades by sitting new generation near the customer [55].
3) It offers a relatively low cost entry point into a new and competitive market.
4) Opens markets in remote areas without power because of environmental concerns.
5) DG can be utilized affectively for peak shaving.
6) Provide power for grid ancillary services.
7) Used as a mean to explore the cheap sources of fuel
3.9.3 National Benefits DG technologies that relied on renewable energy sources could yield environmental benefits in the form of reduced emissions of pollutants and greenhouse gases if those technologies displaced utility-supplied power, much of which is generated from coal. Technologies that rely on conventional fuels would yield environmental benefits if they resulted in a shift to less-polluting energy source. High efficiency technologies could yield benefits by reducing the amount of energy required to produce a unit of electricity. DG responds to increasing energy demands and pollutant emission concerns while providing low cost, reliable energy essential to maintaining competitiveness in the world market. In this regard, an environmental impact reduction index ( EIRI ) is introduced which is stated as;
DGwithouti
DGwithii PE
PEEIRI (3.20)

66
Where,
DGwithiPE = Amount of emissions with DG for thi pollutant
outDGwithiPE = Amount of emission without DG for thi pollutant
Overall DG benefit index ( BI ) is formulated as
)()())((EIRI
BW
LLRI
BWVPIIBWBI EIRLLP
VPI (3.21)
Where,
1BW0
1BW0
1BW0
EIR
LLR
VPI
(3.22)
and,
EIRLLRVPI BWBWBW (3.23)
Where,
VPIBW = The benefits weighting factors for voltage profile improvement
LLRBW = The benefits weighting factors for line-loss reduction,
EIRBW = The benefits weighting factors for environmental impact reduction
DG establishes a new industry worth billions of dollars in sales and thousands of jobs and enhances productivity through improved reliability and quality of power delivered, valued at billions of dollars per year. DG ensures access to the grid for distributed generators under uniform technical and contractual terms and charges for interconnection that are based on economic costs so that owners know in advance the requirements for parallel interconnection and manufacturers can design standard packages to meet the technical requirements [56]. DG establishes prices that owners of distributed generators both pay and receive for electricity at levels consistent with utilities wholesale hourly costs to deliver power to different locations, and set uniform, explicit rates for standby electricity service based on costs. In this way the owner can decide between the purchasing or generating power on the basis of price that reflect the utilities incremental costs of serving them and set uniform requirements for emissions, land use, and building codes, based on electric
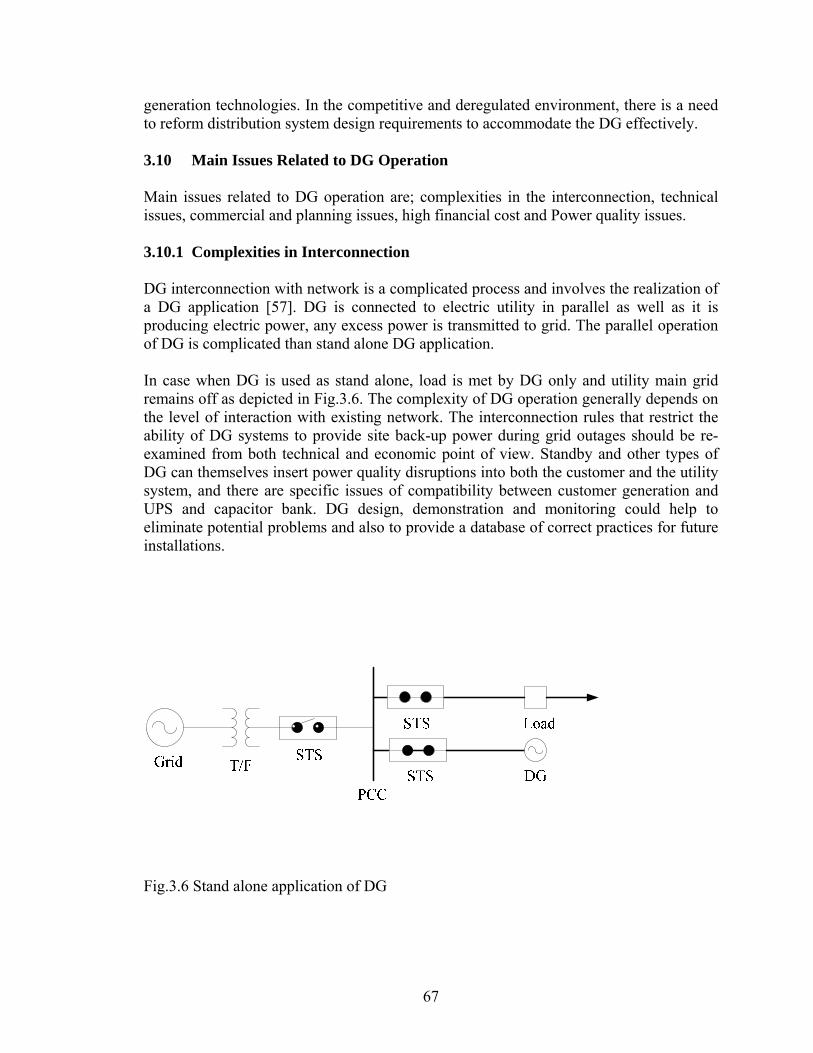
67
generation technologies. In the competitive and deregulated environment, there is a need to reform distribution system design requirements to accommodate the DG effectively. 3.10 Main Issues Related to DG Operation Main issues related to DG operation are; complexities in the interconnection, technical issues, commercial and planning issues, high financial cost and Power quality issues. 3.10.1 Complexities in Interconnection DG interconnection with network is a complicated process and involves the realization of a DG application [57]. DG is connected to electric utility in parallel as well as it is producing electric power, any excess power is transmitted to grid. The parallel operation of DG is complicated than stand alone DG application. In case when DG is used as stand alone, load is met by DG only and utility main grid remains off as depicted in Fig.3.6. The complexity of DG operation generally depends on the level of interaction with existing network. The interconnection rules that restrict the ability of DG systems to provide site back-up power during grid outages should be re-examined from both technical and economic point of view. Standby and other types of DG can themselves insert power quality disruptions into both the customer and the utility system, and there are specific issues of compatibility between customer generation and UPS and capacitor bank. DG design, demonstration and monitoring could help to eliminate potential problems and also to provide a database of correct practices for future installations.
Fig.3.6 Stand alone application of DG
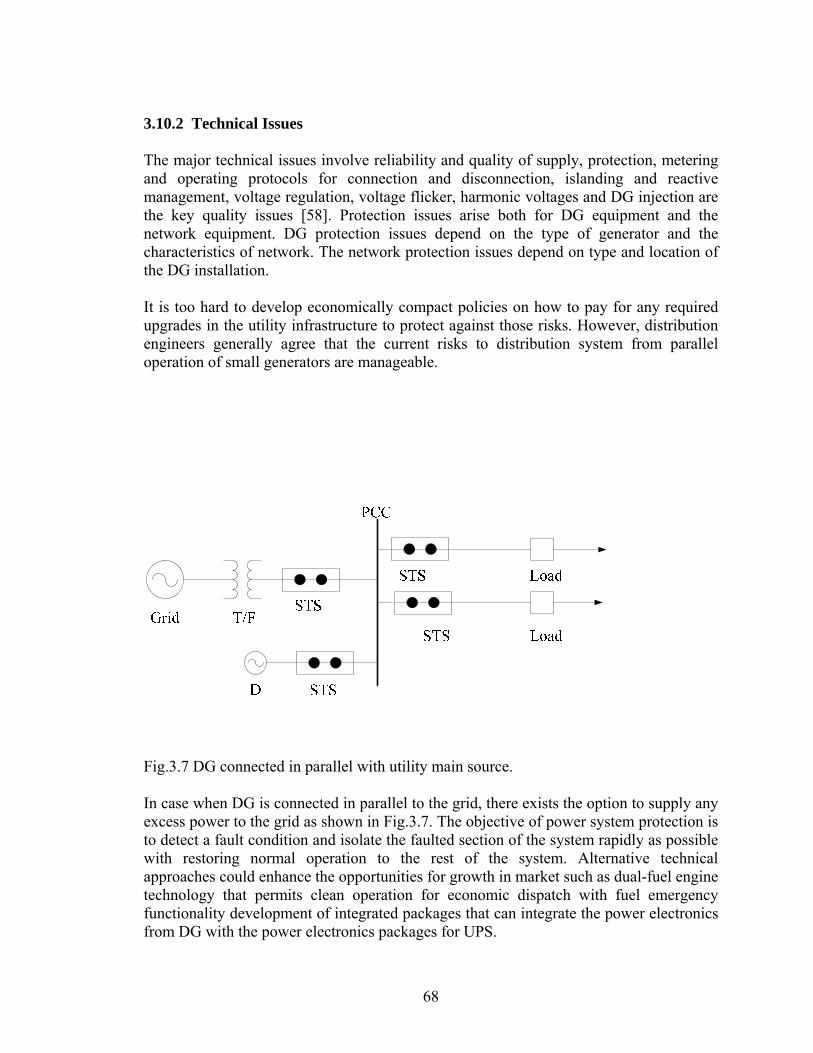
68
3.10.2 Technical Issues The major technical issues involve reliability and quality of supply, protection, metering and operating protocols for connection and disconnection, islanding and reactive management, voltage regulation, voltage flicker, harmonic voltages and DG injection are the key quality issues [58]. Protection issues arise both for DG equipment and the network equipment. DG protection issues depend on the type of generator and the characteristics of network. The network protection issues depend on type and location of the DG installation. It is too hard to develop economically compact policies on how to pay for any required upgrades in the utility infrastructure to protect against those risks. However, distribution engineers generally agree that the current risks to distribution system from parallel operation of small generators are manageable.
Fig.3.7 DG connected in parallel with utility main source. In case when DG is connected in parallel to the grid, there exists the option to supply any excess power to the grid as shown in Fig.3.7. The objective of power system protection is to detect a fault condition and isolate the faulted section of the system rapidly as possible with restoring normal operation to the rest of the system. Alternative technical approaches could enhance the opportunities for growth in market such as dual-fuel engine technology that permits clean operation for economic dispatch with fuel emergency functionality development of integrated packages that can integrate the power electronics from DG with the power electronics packages for UPS.

69
Connecting DG to a distribution network introduces a source of energy at a point where there may not have been a source before. This may increase the “fault level” in the distribution system and may complicate fault detection and violation. In a typical urban network, DG may be connected at voltage levels ranging from 240v single phase to 11kv (line to line). The goal of protection design in the presence of DG is to maintain the pre-existing standard of network reliability, security and quality, coordinate with existing network protection and provide reasonable backup .Protection engineers recommend the use of dedicated quality protection devices rather than relay on DG control equipment that is used in normal operation [59]. 3.10.3 Commercial and Planning Issues It is concluded that uncertainties surround the cost and benefits of DG. In certain circumstances, DG may be able to defer network augmentation costs, reduce network losses and improve distribution system security and quality of supply. DG may impose additional power system operating costs and require investment in network assets. The difference in views may be inevitable, providing innovative nature of DG and its potential to radically change the electricity industry. However, the shared nature of electricity industry operation and investment also contribute by blurring accountabilities and thus blurring both the nature of appropriate commercial obligations and assessments of whether those obligations have been met. Internationally, solutions are being pursued through uniform business practices and regulatory protocols, although this process is hampered by the rudimentary nature of retail electricity markets in which both customers and DG participate. Prior to the introduction of DG, distribution network planners only had to consider the effects of supply from the main grid generators. DG introduces energy sources in distribution networks where they had not existed before. The key issue to distribution engineers is to estimate and forecast the optimal location and the magnitude of DG connected to electric power distribution system [51]. More cost-effective and packaged protection systems are needed to provide all of the necessary protection functions that local utilities require for interconnection of DG. Best practices guide need to develop for DG operation in a premium power environment. 3.10.4 High Financial Cost and Power Quality Issues One of the major remaining issues is the relatively high capital costs per kW installed power compared to large central plants. Imbalances between demand and supply of electricity cause the system frequency to deviate from rated value of 50Hz. These deviations should be kept within very narrow margins. The installation and connection of DG units is also likely to affect the system frequency.

70
The impact on the local voltage level of DG connected to distribution grid can be significant. The introduction of DG may change the voltage level of distribution system [60]. Mostly the voltage harmonics at individual buses are enumerated based on the total voltage drop from utility grid to that bus. Using the principle of superposition theorem, no fundamental frequency source will be present in the distribution network when a harmonic is evaluated. Therefore, determining voltage drop is just like finding the harmonic voltage produced. The allowable utility grid current, evaluate the total demand that can be supplied by DGs along the distribution feeder before the voltage harmonic limit at the tail end exceeded the permissible limit. For uniform feeder loading, the line current ( (x) LI ) at any location “x” on the distribution network is presented as;
) L
x-(1I(x) gridL I (3.24)
Where,
gridI = Total current at the utility grid
L = length of distribution feeder
The voltage drop at the tail end of the feeder due to this line current is;
L
LgridgridLLgridgriddist LZZIdxxIZZIV0
)5.0())(( (3.25)
or
)5.0( LZZ
VI
Lgrid
distgrid
(3.26)
Where,
LZ = Line impedance
gridZ = Impedance of electric utility grid
distV = Worse case voltage distortion
For linearly increasing load,
) L
x-(1I(x)
2
2
gridL I (3.27)

71
)6667.0( LZZ
VI
Lgrid
distgrid
(3.28)
The value of distV can be calculated as narrated in equation (3.25)
For linearly decreasing load,
)() L
x-(1I(x)
2
12
2
gridL xL
xII L (3.29)
Where, L1I is the function of utility grid current and the length of the feeder.
5.0
L1 L
II grid (3.30)
)3333.0( LZZ
VI
Lgrid
distgrid
(3.31)
The value of distV can be calculated as narrated in equation (3.25)
3.11 Impacts of DG
DG can improve the regulation or causes the problems with regulation. The main ways that DG can cause regulation problems are; low voltage due to DG just down stream of a regulator with LDC, High voltage due to DG, Interfacing with utility system and interaction with regulating equipment. 3.11.1 Low Voltage due to DG Just Down Stream of a Regulator with LDC Line drop compensation (LDC) is the technique commonly applied by load tap changing (LTC) transformer controllers and line voltage regulators to control the voltage on the distribution system based on the line current [61]. Under heavy load, a generator just down stream of the generator will reduce the observed load on the feeder. This leads to lower voltage downstream of the regulator. In order to mitigate the problem, a utility voltage regulating device is installed on the utility side as illustrated in Fig.3.8.
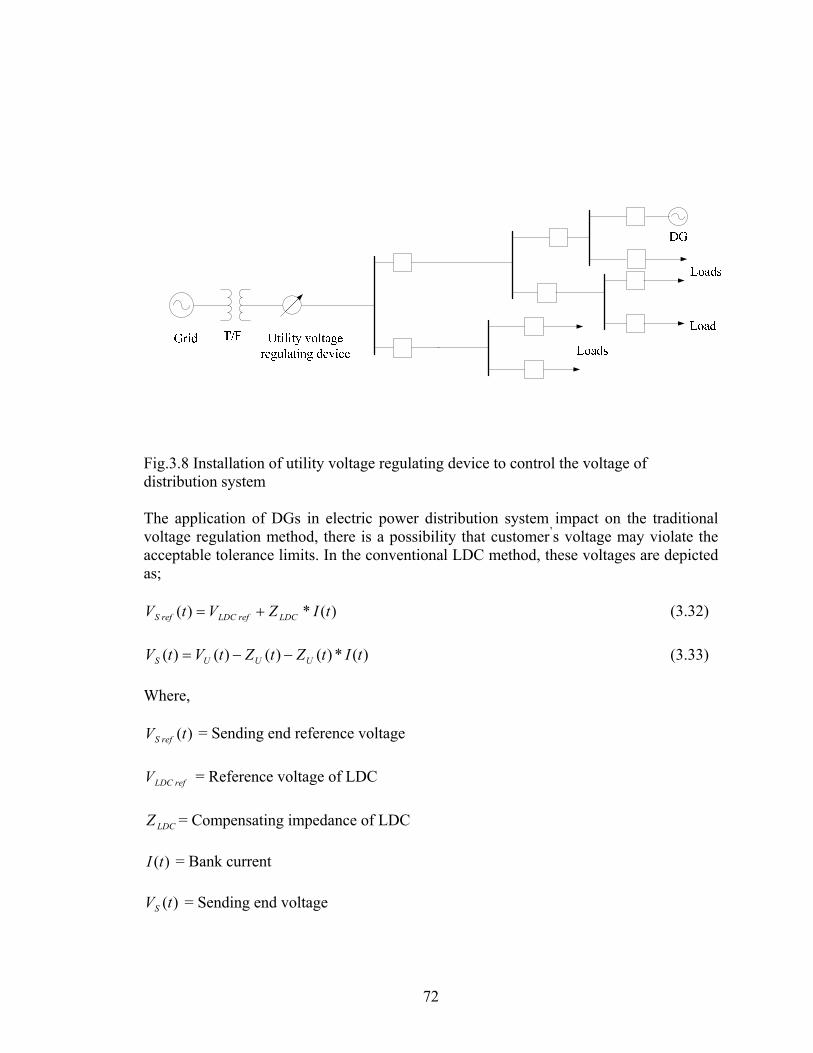
72
Fig.3.8 Installation of utility voltage regulating device to control the voltage of distribution system The application of DGs in electric power distribution system impact on the traditional voltage regulation method, there is a possibility that customer’s voltage may violate the acceptable tolerance limits. In the conventional LDC method, these voltages are depicted as;
)(*)( tIZVtV LDCrefLDCrefS (3.32)
)(*)()()()( tItZtZtVtV UUUS (3.33)
Where,
)(tV refS = Sending end reference voltage
refLDCV = Reference voltage of LDC
LDCZ = Compensating impedance of LDC
)(tI = Bank current
)(tVS = Sending end voltage

73
)(tVU = Secondary voltage of utility transformer when tap is located in the kth position
)(tZU = Impedance of utility transformer when tap is located in the kth position
Under load tap changer (ULTC) transformer and voltage regulator are used to keep the sending end voltage to the sending end reference voltage [62]. In order to keep the utility voltage within permissible limits during overloading, multiple line drop compensation (MLDC) voltage regulation method that determines tap position of ULTC transformers are used instead of LDC. The tap changing number of MLDC method is more than the conventional LDC method. The frequent tap changing operation of ULDC may impact on its functional life time and customer’s voltage fluctuation. 3.11.2 High Voltage due to DG High voltages may be caused by reversed power flow. Under light load for a location where the primary voltage is already high, the voltage rise can be enough to push the voltage above nominal limits. This can even happen for a small DG located on the secondary because of voltage drop along the service drop, the secondary wiring, and the distribution transformer 3.11.3 Interfacing with Utility System The matter of great concern here is the impact of DG on the electric power distribution system power quality. It has been observed that energy conservation technology may play some role in the power quality. Majority of the power quality problems relates to the types of electrical system interface [63]. Few of them are;
1) The power variations from renewable sources such as wind and solar can cause voltage fluctuations.
2) Few of fuel cells and micro-turbines do not accept the step changes in the loads. It becomes essential to supplement them with battery to obtain the improved reliability.
3) Sometimes the starting of reciprocating engines can cause persistent and irritating type of flicker.
3.11.4 Interaction with Regulating Equipment If the DG has varying output, it may change the system voltage or current flows enough to cause a regulator tap change or an operation of a switched capacitor. DG that has feedback to control voltage may interact negatively to the utility regulation equipment. There may be undesirable cycling of regulation devices and noticeable power quality impacts under such conditions.
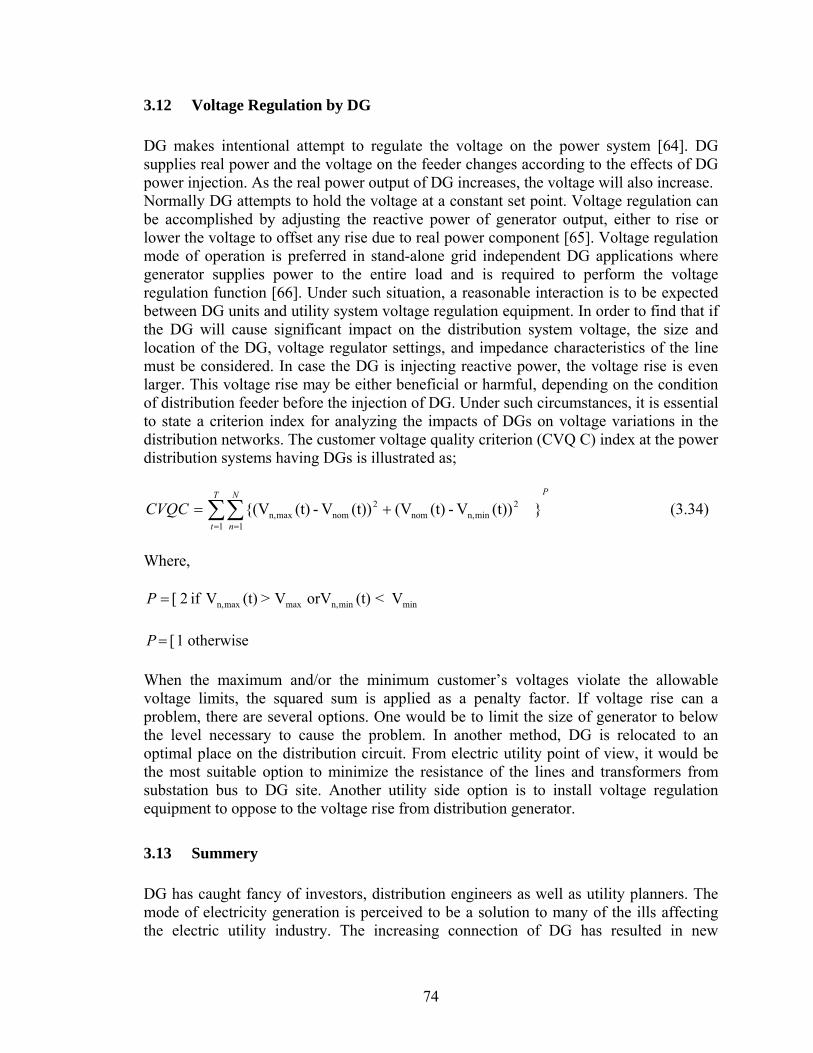
74
3.12 Voltage Regulation by DG
DG makes intentional attempt to regulate the voltage on the power system [64]. DG supplies real power and the voltage on the feeder changes according to the effects of DG power injection. As the real power output of DG increases, the voltage will also increase. Normally DG attempts to hold the voltage at a constant set point. Voltage regulation can be accomplished by adjusting the reactive power of generator output, either to rise or lower the voltage to offset any rise due to real power component [65]. Voltage regulation mode of operation is preferred in stand-alone grid independent DG applications where generator supplies power to the entire load and is required to perform the voltage regulation function [66]. Under such situation, a reasonable interaction is to be expected between DG units and utility system voltage regulation equipment. In order to find that if the DG will cause significant impact on the distribution system voltage, the size and location of the DG, voltage regulator settings, and impedance characteristics of the line must be considered. In case the DG is injecting reactive power, the voltage rise is even larger. This voltage rise may be either beneficial or harmful, depending on the condition of distribution feeder before the injection of DG. Under such circumstances, it is essential to state a criterion index for analyzing the impacts of DGs on voltage variations in the distribution networks. The customer voltage quality criterion (CVQ C) index at the power distribution systems having DGs is illustrated as;
T
t
PN
n
CVQC1 1
2minn,nom
2nommaxn, (t))V-(t)(V(t))V-(t)(V (3.34)
Where,
V <(t)orV V> (t)V if 2 [ minminn,maxmaxn,P
otherwise1 [ P
When the maximum and/or the minimum customer’s voltages violate the allowable voltage limits, the squared sum is applied as a penalty factor. If voltage rise can a problem, there are several options. One would be to limit the size of generator to below the level necessary to cause the problem. In another method, DG is relocated to an optimal place on the distribution circuit. From electric utility point of view, it would be the most suitable option to minimize the resistance of the lines and transformers from substation bus to DG site. Another utility side option is to install voltage regulation equipment to oppose to the voltage rise from distribution generator.
3.13 Summery
DG has caught fancy of investors, distribution engineers as well as utility planners. The mode of electricity generation is perceived to be a solution to many of the ills affecting the electric utility industry. The increasing connection of DG has resulted in new

75
challenges for modeling technique and assessing power quality of newly introduced DG unit on the distribution system. The combination of utility restructuring, technology evolutions, recent environmental policies provide the basis for DG to progress as an essential electrical energy option in near future. Utility restructuring opens energy markets, allowing the customer to select the energy provider, methods of delivery and attended services. The non traditional model of DG has diverted the attention because of its potential to cost effectively increase system capacity while meeting the industry restructuring objective of market driven, customer oriented solution. Such an emerging portfolio of DG options being offered by electric companies and independent power producers is changing the way customers view energy. Especially DG appears very attractive to planning engineers, regulators and the market generally because it provides the option of reducing investment in transmission and distribution systems and also reducing the energy losses. DG may play significant role in further innovations in wholesale and retail markets, in reducing the cost of electricity when traditional supply is tight or market demand is more. DG technologies that relied on renewable energy sources could yield environmental benefits in the form of reduced emissions of pollutants and greenhouse gases if those technologies displaced utility-supplied power, much of which is generated from coal. DG establish prices that owners of distributed generators both pay and receive for electricity at levels consistent with utilities wholesale hourly costs to deliver power to different locations, and set uniform, explicit rates for standby electricity service based on costs. Connecting DG to a distribution network introduces a source of energy at a point where there may not have been a source before. This may increase the “fault level” in the distribution system and may complicate fault detection and violation. The key issue to distribution engineers is to estimate and forecast the optimal location and the magnitude of DG connected to electric power distribution system. Furthermore, DG(s) can be used to enhance the quality of service in terms of node voltage profile improvement, power loss reduction both with the utility connected as well as in the islanding mode of operation.

76
CHAPTER IV
ISLANDING PROCESS
4.1 Introduction
Traditionally, utility electric power systems (EPS) were not designed to accommodate active generation and storage at the distribution level. The technologies and the operational concepts to properly integrate distribution resources (DR) into existing EPS continue to be further developed to completely realize benefits and to avoid negative impacts on system reliability and safety. According to IEEE standards for interconnecting distributed resources with EPS (1547 TM ), resources of electric power which are not directly connected to a bulk power system are referred as distribution resources (DR). These sources include both generators as well as energy storage technologies. All the generation facilities connected to an area EPS through a point of common coupling (PCC) are known as distributed generation (DG) [67].
Utility main grid Fault
Fig 4.1 Islanding (Micro-grid) formation during the fault on utility main grid
Islanding can be defined as the condition in which portion of utility system that contains both electric loads and distributed resources remains energized while isolated from the remainder of the utility system. It is one of the important issues for distribution system having DG(s) due to human as well as system safety [68]. When fault occurs on utility main grid, the operation of Static transfer switch (STS) isolate the distribution resource from it along with sensitive load, forming micro-grid as expressed in Fig.4.1. In the deregulated and competitive environment, the demand for secure and optimized electric generation is increasing rapidly. Under such circumstances, the utilization of DG
STS Sensitive Load
Islanded portion of the network
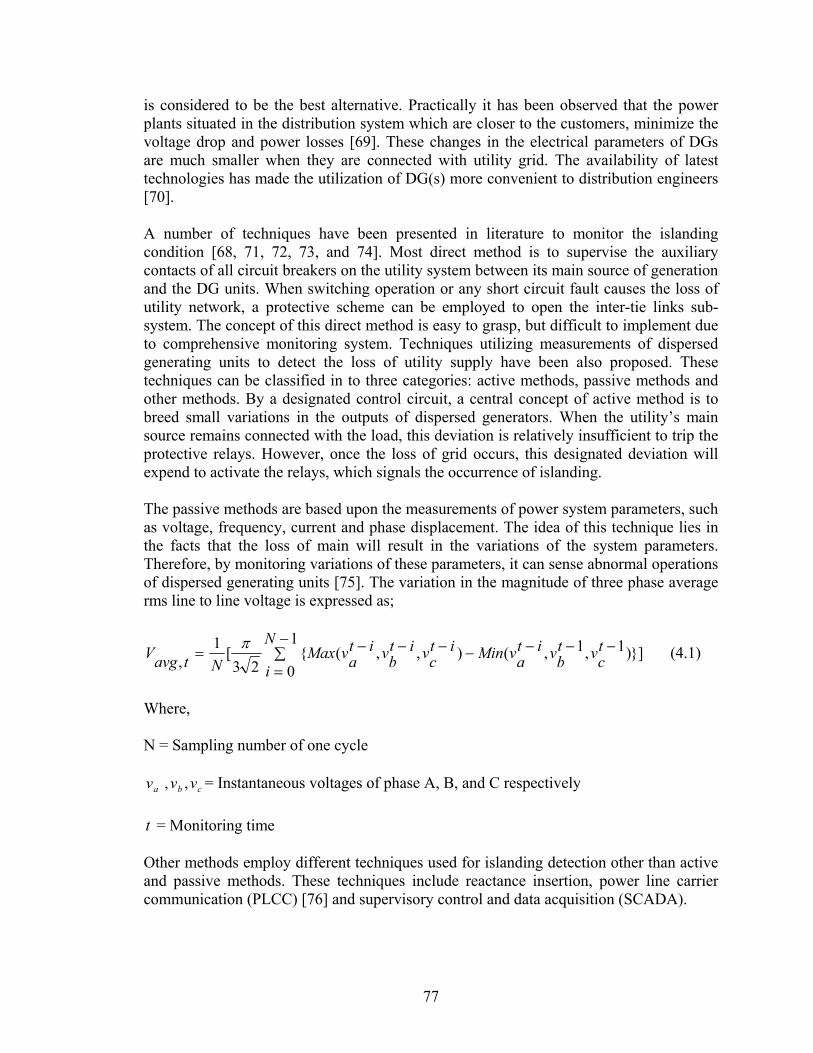
77
is considered to be the best alternative. Practically it has been observed that the power plants situated in the distribution system which are closer to the customers, minimize the voltage drop and power losses [69]. These changes in the electrical parameters of DGs are much smaller when they are connected with utility grid. The availability of latest technologies has made the utilization of DG(s) more convenient to distribution engineers [70]. A number of techniques have been presented in literature to monitor the islanding condition [68, 71, 72, 73, and 74]. Most direct method is to supervise the auxiliary contacts of all circuit breakers on the utility system between its main source of generation and the DG units. When switching operation or any short circuit fault causes the loss of utility network, a protective scheme can be employed to open the inter-tie links sub-system. The concept of this direct method is easy to grasp, but difficult to implement due to comprehensive monitoring system. Techniques utilizing measurements of dispersed generating units to detect the loss of utility supply have been also proposed. These techniques can be classified in to three categories: active methods, passive methods and other methods. By a designated control circuit, a central concept of active method is to breed small variations in the outputs of dispersed generators. When the utility’s main source remains connected with the load, this deviation is relatively insufficient to trip the protective relays. However, once the loss of grid occurs, this designated deviation will expend to activate the relays, which signals the occurrence of islanding. The passive methods are based upon the measurements of power system parameters, such as voltage, frequency, current and phase displacement. The idea of this technique lies in the facts that the loss of main will result in the variations of the system parameters. Therefore, by monitoring variations of these parameters, it can sense abnormal operations of dispersed generating units [75]. The variation in the magnitude of three phase average rms line to line voltage is expressed as;
1
0])1,1,(),,(
23[
1,
N
i
tc
vtb
vita
vMinitc
vitb
vita
vMaxNtavg
V
(4.1)
Where, N = Sampling number of one cycle
cba vvv ,, = Instantaneous voltages of phase A, B, and C respectively
t = Monitoring time Other methods employ different techniques used for islanding detection other than active and passive methods. These techniques include reactance insertion, power line carrier communication (PLCC) [76] and supervisory control and data acquisition (SCADA).

78
The literature research of the past indicates the different control techniques used to detect the phenomena of islanding. Majority of these techniques are based upon the assumptions of unity power factor and uniformly distributed loads. The types of loads and their distribution (uniform/non uniform) in the distribution networks greatly determine the behavior of the distribution system. H.H.Zeineldin, E.F.EI Saadany and M.M.A. Salama have presented the active islanding detection technique in which power factor can be improved by providing active and reactive power from DG to electric loads [77]. It is difficult to implement this technique for the system having power factor other than unity because the design of interface control is more complicated. Furthermore, the technique presented is only applicable to resistive, inductive and capacitive (RLC) loads. H.H.Zeineldin, Ehab F Saadany and M.M.A. Salama have suggested a new interface control strategy in which the impacts of DG on islanding detection are examined [78].Vivk Menon and M.Hashem Nehrir have introduced a hybrid islanding detection [79]. The technique presented is based on the principles of power factor, voltage unbalance and total harmonic distortion. This technique is suitable for synchronously rotating DGs only. M A Redfern and J I Barrett have proposed a microprocessor-based algorithm for islanding protection, which may fail during the severe load variations [80]. Sung II Jang and Kwang -Ho KIm have implemented the islanding detection method based on voltage unbalance and total harmonic distortion of current [81]. During the simulation it has been observed that mostly the variations in these parameters are too small to detect the phenomena of islanding. Due to one or other reason when there is sudden collapse on utility grid, system restoration takes considerable time. However, even if a part of distribution system remains in service along with DG, supplying a portion of distribution network is termed as micro grid. Formation of micro grid due to islanding process can be due to disturbances, such as fault and its subsequent switching [82].The detailed review of literature reflects that in majority of cases some unrealistic assumptions are usually adopted to make the models more manageable. However, much computational work is to be faced in the real world of electric power distribution system challenges. In this research work, review of different islanding detection techniques has been carried out. Conventional approaches have many difficulties to detect the islanding operation. The non-uniform distribution of electric loads, unity power factor, complexities during the design of interface control and functioning of the system in multi–DG scenarios are the most common obstacles, seriously faced by the distribution engineers during the implementation of existing islanding detection techniques.
4.2 Significance of Islanding Detection
If a part of power system forms an uncontrolled island, there is a risk that personnel sent out for maintenance work in the island system get in contact with the live parts of the equipments. This can cause severe injuries and death. In the event of unintentional islanding, utility network should be design in such a way that it must be able to detect the phenomena and isolate it from remainder of the grid immediately. Normally,

79
unintentional islanding occurs because of natural disaster or abrupt system fault by switching operation of protective devices as illustrated in the Fig. 4.2 [83]. Utility main grid Fig 4.2 Formation of unintentional islanding on utility main grid To avoid the over voltage and damages from inrush currents, it is important to disconnect DG units before automatic re-closing is adopted [84]. An islanding detection system has to be discriminative between islanding and other events in the electric power distribution system. The detection system has to be reliable and quick in operation.
4.3 Effects of Islanding Phenomena
The non detection of islanding phenomena may adversely affect the utility networks. It is not only harmful to the life of operating staff but also uneconomical to electric power distribution system. It reduces the useful life of system to considerable extent. The quality of power is deteriorated and failure of customer’s electric appliances enhanced. The different effects [71, 72, and 85] of the islanding phenomena can be enumerated as:
1) Maintenance personnel may be harmed when arriving to service the energized isolated feeder.
2) Utility customer equipments may be damaged due to uncontrolled voltage and frequency excursion.
3) Switching, measuring devices and other costly electrical equipments may be damaged due to unsynchronized re-closure.
4) Automatic re-closing devices may malfunction.
STS
Natural fault Islanded portion of the network
Load

80
5) The overall parameters of electric utilities including voltage, current, frequency and power factor may change seriously.
6) The voltage drop and power loss may increase considerably. 7) The overall performance and power quality of the system can be reduced. 8) The utility has no control over the voltage and frequency in the Island. 9) Islanding may interfere with restoration of normal services by the utility.
10) The reliability of the system decreases, mostly due to increase in the non detection zone (NDZ).
Non detection zone is a region of measurements where an islanding event can occur but the detection of the said event goes unnoticed. It can be presented in the form of power mismatch or in terms of R, L and C of load. In case of constant current controlled inverter DG, any change in power or load resistance causes variation in the voltage at point of common coupling (PCC). It is expressed as;
IRV or RIV (4.2) Where, V = voltage at PCC
V = Change in voltage at PCC R = Resistance at PCC
R = Change in resistance at PCC I = Current at PCC Most of DGs operates at unity power factor, therefore reactive power is fixed at zero. Under such circumstances, frequency variations can be expressed as;
LCr
1 or
LCfr 2
1 (4.3)
Where,
rf = Resonance frequency
For RLC load, P
VR
23 (4.4)

81
Where, power (P) is constant and any partial change in resistance result the change in voltage as;
V
RPV
6
(4.5)
It is important to mention that for any change in resistance, the change in voltage is different for different type of interface for same initial loading, causing variation in NDZ [86]. The current wave form can be expressed as;
)2()2()()()()( 111 TtuTtiTtuTtititi (4.6) Where,
)()(22)(1 iiii TtuTtfSintfSinti
Applying Laplace transform
22exp1
exp1)(
1exp1
1)(
is
i
sT
isT
sITs
sI
(4.7)
The impedance of RLC load in frequency domain is depicted as;
220
20
011
)4
11()
2(
1)(
ff
fsLR
QQs
s
Q
R
sCsZ
(4.8)
Voltage for parallel RLC circuit can be expressed as;
2)24
11
0(2)
20(
022exp1
exp1)()()(
fQf
Q
ss
fQ
R
is
iTs
isT
sZsIsV
(4.9)
The expression for steady state voltage waveform can be obtained by the application of inverse Laplace transform

82
0
0)(])([sin
)(-exp-)(])([sin
)(exp
2K
)[sin)(][sin
1)(
nn
it-nT-Tu
it-nT-Ta
ci
t-nT-Tt-nTut-nTa
cnTt
iα]u(t-nT-T)
ib(t-nT-TnTtub(t-nT)
Ktv
(4.10) Where,
,4
11
20fQ
a
ib ,
fQc
20
,
])([tan0
01
i
ifQ ,
]14[tan22
0
22021
i
ifQ
,
2
0
02
1
)(1
i
ifQ
RK
,
)(1
)(14
)(
0
02
2
0
02
22
0
02
2
i
if
i
if
fi
if
Q
Q
RK
In order to achieve upper limit of NDZ in the quality factor ( fQ ) verses resonant
frequency ( 0f ), first select a value for fQ and 00 2 f . Then for
),(2 max ffi the value of v from equation (4.9) when, max
1
fTt , the value of
fQ and 0f are the boundary of the NDZ when 0)( Tv

83
The importance of islanding operation originates from security factor. Having a feeder energized when utility operators are carrying out repairing work may be hazardous [69]. Many utility networks utilize automatic circuit re-closing. When a short-circuit fault occurs, the utility is disconnected after a specific time the switching device interrupts the current again. If the distribution network remains energized and a re-closing of the switching between utility network and low voltage distribution network occurs, power system equipments may get damage partially or completely because of frequency phase and magnitude variations between utility and the island.
4.4 Causes of Islanding Processes
Among the causes of system islanding, malfunctions of protective equipments and multiple tripping of distribution lines triggered by natural disasters are the most common. From operational point of view, islanding may be intentional and unintentional A stand-alone application is an intentional case, where island is desired and planned. An unintentional island occurs when switching device between the distributed energy resources (DER) and the rest of utility grid is opened and DER continues to feed the distribution system.
Fig 4.3 Formation of intentional islanding on distribution network Intentional islanding is the planned outage on the system. Usually, it is required during the period of repair and maintenance, extension in the distribution system, power management and the replacement of distribution system equipment as depicted in the Fig. 4.3. It has been estimated that 80% of the supply interruptions faced by consumers are because of failures that occur in the distribution network [87].
Islanded portion of the network
DG
Load Fault
Grid

84
4.5 Impacts on Power Quality
Passive islanding detection devices measures, while active islanding detection both perturbs the output as well as measures it. Any sort of perturbation in the output is closely related to power quality. Therefore, small variation in the output parameters causes the degradation in the power quality for which the implementation of additional function is needed. Large active power variation causes poor power quality such as voltage flicker and grid instability. Intentional islanding can improve the quality of supply indices and reliability. Furthermore, additional revenue to DG owners can be achieved due to increased power supply during network outage (islanding), and customer satisfaction due to reduction of frequency and duration of interruptions from outages in the distribution network [88]. Intentional islanding is possible without causing difficulties, if Power Island contains at least one generating unit that controls the voltage of energized grid section, thus maintaining the power quality of electric supply at the customer’s terminals. The most prominent advantage of passive islanding detection is that it does not influence the power quality of electric power distribution system [78]. The passive methods do not affect the waveform of the high voltage. Power quality issues like voltage dip, spikes, electrical noise and other associated problems do not exist during its implementation.
4.6 Islanding Detection Techniques
From operational point of view, islanding may be intentional and unintentional. Unintentional Islanding is, either caused by switching operation of protective devices or tripping of distribution lines triggered by natural disasters [79].
In majority of the cases, the intentional Islanding has been planned in advanced by the distribution engineers. Extension in the distribution system, repair and maintenance, power management and the replacement of distribution system equipments are among the main causes of intentional islanding. Distribution system equipments have been designed to cope with the situation and DG(s) are well suited to control voltage, frequency and power in the islanded grid. Intentional islands are usually designed for industrial plants, for example steel mills, paper mills and sugar mills are mostly capable of producing a large part of their electricity and need internally. During thunderstorms or in bad weather conditions these plants can switch to internal electricity production and isolate themselves from utility main grid forming an electric island (micro grid). By doing so the risk of disturbances due to sever weather conditions affecting the vulnerable processes are reduced.
The best example of intentional islanding is emergency backup powering the hospitals where a blackout can cause a significant amount of damage particularly in the events of open-heart surgery. In order to ensure continuous electricity supply, most hospitals have emergency generators and uninterruptible power supply with battery storage.

85
Fig 4.4 illustrates the detailed classification of islanding. Intentional Islanding can also be classified in to following three main types [81, 89, 73-74, 90].
1. Passive Islanding Detection techniques.
2. Active Islanding Detection techniques.
3. Other Islanding Detection techniques.
Fig.4.4 Islanding detection techniques
4.7 Passive Islanding Detection Techniques
The principle of passive Islanding detection methods is to monitor the selected system variables such as the voltage at DG terminals, frequency of DG terminal voltage, phase displacement, impedance and other characteristics [77]. In passive schemes, the system

86
parameters are measured, compared logically with preset values and is determined whether the utility section has been islanded or not. These methods are simplest and most direct to implement in a utility system, but have security and sensitivity problems and inherently create non detection zones (a region of measurements where an islanding event can occur but the detection of said event goes unnoticed). The most significant advantage of passive islanding detection is that it does not influence the power quality of electric power distribution system [78]. The use of DG(s) to supply a portion of distribution network could bring many benefits to DG owner, distribution network operator (DNO) and customers. Intentional islanding can improve the quality of supply indices and reliability. Additional revenue to DG owners can be achieved due to increased power supplied during network outage, and customer satisfaction due to reduction of frequency and duration of interruptions from outages in the distribution network. The passive methods do not affect the waveform of the high voltage. Power quality issues like voltage dip, spikes, electrical noise and other associated problems do not exist during its implementation. Some of the passive Islanding detection methods are briefly discussed below. 4.7.1 Voltage Based Islanding Detection Techniques The voltage relay measures the magnitude at DG unit and trips the generator if the voltage has been abnormal during certain time. The relay can respond to both under and over voltage situations. However, normally the method relies on an unbalance between reactive power production and consumption after the loss of mains. This unbalance leads to a change in voltage level, which can be measured locally [75]. During the islanding condition (micro grid) voltage at PCC becomes unbalanced which is detected. If the value of this unbalance is beyond a specified value, occurrence of islanding is detected. Voltage imbalance is expressed as;
%100*p
n
V
VVI (4.11)
Where, VI = %age voltage imbalance
pV = Magnitude of positive sequence voltage
nV = Magnitude of negative sequence voltage
It is worth mentioning that voltage relays do not violate the ride-through demands of the applicable grid code. Therefore, setting has to be chosen such that the level and time delay do not trip the generating unit unless the voltage has excursed outside the limit. Sometimes the change in voltage alone can not detect the islanding effectively.

87
Particularly when local load closely matches the DG output power and voltage and frequency shift is not sufficient to exceed the DG voltage and frequency limits [91]. 4.7.2 Frequency Based Islanding Detection Techniques In the steady state, the frequency is the same in the entire electric power distribution system. A frequency relay takes its decision based on the frequency of the voltage at DG Plant. If frequency rises above or drops below predetermined limits for a certain time then the plant is tripped from the utility main supply. Mostly, DGs are connected in parallel with utility main grid through tie lines. During the occurrence of fault if tie lines are disconnected then utility main and DG become two independent systems. If, P is
the change in power due to increase of load LP , the total change in power TP can be presented as;
PPP LT (4.12) The frequency characteristics of utility main system and DG system can be expressed as;
U
UU P
fK
, (4.13)
DG
DGDG P
fK
(4.14)
Where,
UP = The out of balance power of utility main system
DGP = The out of balance power of DG system,
Uf = The frequency of utility main grid
DGf = The frequency of DG
The values of UK and DGK are inversely proportional to the DG capacity connected to
the network. Any expansion in the system, minimizes the values of UK and DGK . At the
occurrence of islanding, if it is assumed that the net power change shifted from utility main to DG system is SP for an extra load variation of LP in DG system, then
DG
L
DG
S
DG
DG
f
P
f
P
f
P
(4.15)
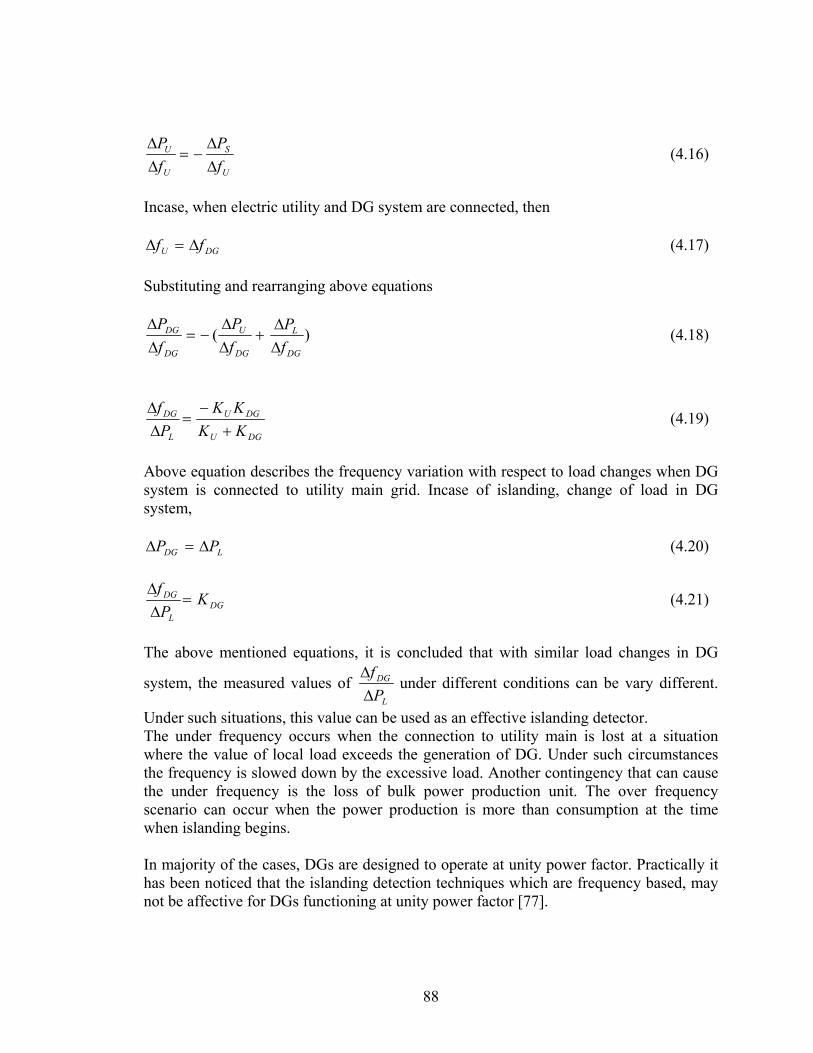
88
U
S
U
U
f
P
f
P
(4.16)
Incase, when electric utility and DG system are connected, then
DGU ff (4.17)
Substituting and rearranging above equations
)(DG
L
DG
U
DG
DG
f
P
f
P
f
P
(4.18)
DGU
DGU
L
DG
KK
KK
P
f
(4.19)
Above equation describes the frequency variation with respect to load changes when DG system is connected to utility main grid. Incase of islanding, change of load in DG system,
LDG PP (4.20)
DGL
DG KP
f
(4.21)
The above mentioned equations, it is concluded that with similar load changes in DG
system, the measured values of L
DG
P
f
under different conditions can be vary different.
Under such situations, this value can be used as an effective islanding detector. The under frequency occurs when the connection to utility main is lost at a situation where the value of local load exceeds the generation of DG. Under such circumstances the frequency is slowed down by the excessive load. Another contingency that can cause the under frequency is the loss of bulk power production unit. The over frequency scenario can occur when the power production is more than consumption at the time when islanding begins. In majority of the cases, DGs are designed to operate at unity power factor. Practically it has been noticed that the islanding detection techniques which are frequency based, may not be affective for DGs functioning at unity power factor [77].

89
4.7.3 Rate of Change of Frequency (ROCOF) Rate of change of frequency implies to use such a relay which uses the time derivative of frequency to detect the phenomena of islanding [78]. The difference between the load and production affects the speed derivative. The rate of change of frequency is illustrated as;
fHP
P
dt
dfROCOF
DG2
(4.22)
Where,
P = Power mismatch at DG side
DGP = Rated generation capacity of DG
H = Moment of inertia for DG During the operation, ROCFOF relay constantly monitors the system voltage waveform and only operates when ROCFOF is greater than predetermined interval of time. The relay should be able to distinguish between islanding condition and others. The implementation of this method is much effective for greater power mismatch. On contrary, it fails to perform its function when DG capacity matches the local loads [92]. Furthermore, if production and load are in perfect balance just after a switch to an operation has occurred, the speed derivative will be small and difficult to detect. The utility main frequency will not be affected significantly. Hence the ROCOF relay will not be able to detect islanding. 4.7.4 Vector Shift During the occurrence of islanding, the current from utility main is lost and the DG takes the whole load. The increase in total current causes to change the DG terminals voltage which in turn increases the load angle. The increased load angle corresponds to a time lagged zero crossing of the voltage. The vector shift relay utilizes this by comparing the number of cycle. The sudden change in time implies the change in load angle. In a 50Hz system the nominal period time is 20ms. It is worth mentioning that there are so many other events which are responsible for change in load angle other than the islanding processes. Such events could be short-circuits or sudden changes in the impedance of utility main. In order to differentiate between the short circuits and generator startup, an under-voltage relay is normally used to block the vector shift relay. Much computational work is involved in the implementation of this technique which may increase the chances of errors in the results, hence rendering this method impractical.

90
4.7.5 Phase Jump Detection (PJD) The principle of phase jump detection is to monitor the phase difference (sudden phase jump) between phase of the utility voltage and DG current [89]. In the presence of grid, the utility can be assumed as a stiff voltage source providing sinusoidal voltage at system voltage and frequency. While operating as a power conditioner, DG regulates sinusoidal waveform current impressed into utility main. Phase of DG current is synchronized with the phase of utility voltage through phase lock loop (PLL) circuit [81]. However at the instance of the main grid failure, if active and reactive mismatch is large, phase of the voltage at DG terminal is instantaneously shifted so as to balance the active and reactive power between DG and the load. This causes the phase error due to the presence of an inductive load after the utility is disconnected. When this phase error exceeds the phase threshold value (φerr >φTh) islanding is confirmed. The size of non detection zone (NDZ) can be reduced by setting small phase threshold (φTh). The phase criterion for PJD is illustrated as;
th0
01 ])
1[R(tan
LC (4.23)
Where, R = Load resistance ( ) C = Load capacitance ( F µ ) L = Load inductance ( H )
0 = Utility voltage frequency (rad/sec)
However, too small phase threshold (φTh) can result in nuisance tripping during the startup of large inductive loads (Induction motors) or switching of power factor correction capacitor. Therefore, it becomes hard to select the appropriate value of threshold that can provide reliable islanding detection [77]. Furthermore, this method fails when power factor of load is near to unity. 4.7.6 Voltage Harmonic Detection The working principle of voltage harmonic distortion is to detect total harmonic distortion (THD) of the voltage at DG terminals [79]. In the presence of utility, utility can be considered as a stiff voltage source providing essentially a sinusoidal waveform voltage. However, after utility disconnected, voltage harmonic distortion at the point of common coupling (PCC) becomes significant due to interaction between high impedance of islanding loads and harmonic currents from sources such as DG itself, nonlinear power electronic loads and non linear excitation current of distribution power transformer. If the total harmonic distortion (THD) is higher than the threshold, an occurrence of islanding

91
can be confirmed [81].This method of detection is effective to detect islanding because it does not rely on active and reactive power mismatch at the instance of utility disconnection. However, in this method more computational work is involved than any
other method. High quality load factor (L
CRq ) serve as low pass filter having very
low impedance for wide range of frequency. It results in low total harmonic distortation (THD <5%) to appear and it possibly lead to failure of detection. Furthermore, appropriate harmonic threshold is difficult to find hence rendering this method as impractical.
4.8 Active Islanding Detection Techniques
The principle of active islanding method is to slightly perturb the system variables such as voltage and frequency at DG terminals and simultaneously observe their impacts. Islanding is detected in the electric power distribution system when the observed variables are forced out of thresholds [65]. The injected disturbance enhances the dependability and the non detection zone (NDZ) can be reduced significantly. The islanding can be made faster than in the case of passive detection. The issues with implementing an active detection scheme are not only the fact that the scheme has to be incorporated into the control without varying the functionality of the original control but also because of the way these schemes are designed. These schemes manipulate continuously the output states of the system in such a fashion that the disturbances could be monitored affectively during any abnormal conditions. The active techniques work very well, but the drawbacks are that the outputs of distribution system are varied continuously which are being absorbed by the utility main as well as by DG and loads. This can lead to system wide complications because if the DG is perturbing, for example ±5% of its out put current, and when DG system starts to reach output power levels of hundreds of kilowatts and even into megawatts range, then ±5% perturbation is no longer trivial. On the other hand, if the output of DG(s) is kept to low tens of kilowatts, when a multitude of DG(s) are integrated into utility, the effects of these perturbations can become cumulative. Generally these methods have better reliability but they are difficult to implement and are costly. Few of these methods are briefly mentioned below. 4.8.1 Output Power Variation The principle of out put variation method is to periodically vary real power output supplied by DG to utility. Islanding is detected, if a change in the voltage at DG terminals escapes threshold value [77]. Let the real output be expressed in average real power Pav and real power variation ∆P as
avPP ∆P (4.24)
Voltage variation,
1)1/( LPPV (4.25)

92
Real power variation ∆P must be set at least ±0.2pu so that change in voltage at DG terminal is out of the threshold after disconnection of utility, hence confirming the occurrence of islanding. This method of islanding detection is robust and capable of reducing the size of NDZ to zero when single DG is connected to utility. However, it fails to detect the islanding when multiple DGs are connected to utility main and are operating independently. In addition, large real power variation ∆P causes poor power quality such as voltage flicker and grid instability. 4.8.2 Impedance Measurement In this method the real power output is periodically varied while simultaneously determining the grid impedance by calculating a rate of change of the voltage at DG terminal with respect to DG current. Islanding is confirmed, if a significant increase in grid impedance above the predetermined threshold is recorded. The implementation of this method needs a precise value of grid impedance which may not be known, hence causing this method as impractical. 4.8.3 Sliding Mode Frequency Shift (SMFS) In sliding mode frequency shift method, the frequency of DG output is forced to move up or down by controlling the phase angle of the DG current. Islanding can be identified, if the frequency is out of the predetermined threshold [89]. In this method, phase angle of current is controlled as a function of frequency deviation of the last cycle ( 1vkf ) from rated frequency of utility main grid gf . Hence,
]t)(f[2sin2 1-vk SMFSk Ii (4.26)
Where,
)2
sin(g
fm
f
gff
mSMFS
(4.27)
Where,
mf = Frequency at which maximum phase shift m occurs. During the occurrence of fault
on utility main, the frequency of micro grid will shift from rated value gf when
gffdf
SMFSd
gffdf
loadd
|<|
(4.28)

93
Therefore,
2
12
f
gm
mQ
ff
(4.29)
Where,
fQ = Maximum value of frequency at which islanding has to be detected. Using phase
criteria, NDZ can be detected,
[ tan 1 ])(0
0
f
f
f
fQ is
isf = )
2sin(
gm
gism ff
ff
(4.30)
Thus,
0Q
])([tan 20
f
SMFS20 is
isis ffff
f
(4.31)
This method has the capability to reduce the NDZ almost to zero and can be implemented effectively [93]. It provides excellent compromise between effectiveness and output power quality. However, it possibly fails to detect islanding, if starting phase angle matches with the load phase angle at a frequency located within the threshold. It also fails, if a rate of change of the starting phase angle with respect to the frequency is less than that of the load line. 4.8.4 Active Frequency Drifts (AFD) The principle of active frequency drift method is to force the frequency of DG output up or down by using positive feed back to accelerate the frequency of the DG current. Islanding can be confirmed, if the frequency is out of the threshold [62]. In AFD method, the current frequency f is increased above the voltage frequency in the previous
cycle )( 1 fff vkik , maintaining the inverter current to zero from the end of its
negative semi-cycle until the positive zero crossing of the voltage. The current in each cycle is presented as;
]t)(f[2sin2 1-vk fIik (4.32)
During the occurrence of islanding and steady state condition, the inverter phase angle can be expressed as;
2
2/ AFD
v
z
T
t (4.33)

94
Where,
))(
()1
()1
()1
()1
(fff
f
ffffft
ivz
ff
fft zAFD
Where,
AFD Inverter angle
With the implementation of phase criteria ( AFDLOAD )
ff
f
f
f
f
f
is
is
is
])(Q [tan0
0f
1 (4.34)
Thus,
0])([tan 2
0AFD2
0 isf
isis ffQ
fff
(4.35)
It is very effective method and can eliminate a NDZ near to zero [82]. However, method fails to detect the islanding, if phase offset generated by perturbing the frequency matches with the load phase angle at frequency within the threshold.
4.9 Other Methods
In these methods, the techniques employed are different than those used for active and passive methods. Communication has been considered to be most expensive [79]. Traditionally only utility owned wires and channels subscribed from telephone companies have been considered. Today radio transmission (FM or AM) and optic fibers can be added to the list. Internet has made it possible to communicate the same information to a wide range of equipments. These methods include reactance insertion, power line carrier communication (PLCC), supervisory control and data acquisition (SCADA), Phase measurement units, comparison of rate of change of frequency (COROCOF) and Transfer Tripping Scheme. Generally, these methods are costly to implement.

95
4.9. 1 Reactance Insertion In this method, low value impedance (such as a capacitor bank) is connected to a distribution feeder within a short delay time after a utility is disconnected. The capacitor bank supplies additional reactive power to the load and unbalance reactive power between the DG and the load. On the other hand, if the frequency is below the threshold, an occurrence of islanding is confirmed. Other types of impedances such as a low value resistance can be used to unbalance real power between the DG and the load during the occurrence of islanding. If the drop in voltage occurred is below the threshold, Islanding is confirmed. This method is highly effective for islanding. A NDZ can be eliminated, if a capacitor bank is properly installed and coordinated. But it has slow response compared to active method. Further more, cost of implementation is excessive because every disconnection switch must be equipped with a switchable capacitor bank. 4.9. 2 Power line Carrier Communication (PLCC) The principle of power line carrier communication is to use a low energy communication signal sent by a transmitter at utility side throughout power distribution network. Line discontinuity is acknowledged and an occurrence of islanding can be confirmed. The use of continuous communication signal is preferred since it is more reliable and simpler than an intermittent signal for continuity test. With an intermittent signal, loss of signal due to discontinuity or cessation of the transmission can not be distinguished without encoding and decoding a signal. In addition, the signal should be of low frequency so that it can propagate well in the power line without having troubles with line inductance.
DG Utility
Fig.4.5 Typical power line carrier communication circuit used for islanding detection
Receiver
Local load
Transmitter
S T STransformer

96
A sub-harmonic signal is also preferable because it can not be mistakenly produced by customer loads. Power line carrier communication circuit sends low energy signals continuously along the power line through transmitter on grid side and the receiver at DG side can detect the islanding condition by sensing the presence or absence of signals. A typical circuit used to detect the islanding condition, using PLCC technique is presented in Fig. 4.5. Use of power line carrier communication has several advantages. It does not degrade the power quality. The NDZ can be eliminated. However, such a system is expensive. It is economical only in high density distributed generation areas. 4.9.3 Supervisory Control and Data Acquisition (SCADA) The principle of the supervisory control and data acquisition (SCADA) is to monitor states of entire distribution system such as voltage, frequency and other characteristics and enable rapid response to eliminate islanding. When DG is installed, a voltage sensing device must be installed in the local part of the utility. Voltage information is sent through communication links to the central station. After utility is disconnected, if the voltage can be detected from the disconnected area, the occurrence of the islanding is confirmed. Corrective measures must be arranged to eliminate islanding so that utility personnel are not injured while serving isolated feeders and out of phase re-closure can be avoided. This method is highly effective to detect the islanding and a NDZ is eliminated, if the system is properly instrumented and controlled [72]. However, cost of implementation is very high expensive because each DG installed needs separate instrumentation and communication to send necessary information to the central station. 4.9. 4 Phase Measurement Units The system consists of two units, one at utility substation and the other at DG plant. At substation voltage angles are measured and time stamped before being sent to the receiver at DG plant. It can easily be determined then if DG plant is synchronized with grid or not, confirming the islanding detection. However, a load with a zero phase angle at utility frequency will not produce a reasonable phase error when utility is disconnected, thus the method will fail to detect the occurrence of islanding. 4.9. 5 Comparison of Rate of Change of Frequency (COROCOF) Comparison of Rate of Change of Frequency (COROCOF) changes at two locations in the grid. At the substation the rate of change of frequency is measured and a block signal sent to the DG plant if the value has exceeded a limit. At DG plant the rate of change of frequency is also determined. If no block signal has been received when frequency change has been discovered, the DG plant is tripped. The practical implementation of

97
technique is difficult as much computational work is involved in the design of the interface control. 4.9. 6 Transfer Tripping Scheme Transfer Tripping Scheme can be considered as a decentralized version of SCADA system. Logic circuits use information of circuit breaker states to determine if a part of the grid has been islanded. The result is then transmitted to DG plant. The practical implementation of this method is uneconomical due to the involvement of costly equipments.
4.10 Review of existing Islanding Detection Techniques
The detailed review of literature reflects that many algorithms have been developed for islanding detection of distribution feeders. Jun Yin, Chris Peter Diduch and Liucheng Chang have expressed the islanding detection algorithm, based on the proportional power spectral density [68]. Algorithm is robust, against the load variations and has fast response during the occurrence of islanding process. However, due to mass load switching and fault, frequency variations may occur. This inevitably will cause large proportional power spectral density in low frequency band of grid periods, leading to a nuisance trip for islanding. A voltage based active islanding detection method for distributed power generation system has been examined and explained by Wen-jung Chiang, Hurng-Liahng Jou, Jinn- ChangWu and Ya-Tsung Feng [71]. The moment the interruption occurs on utility main, power is supplied by DG to the local load connected. At that instant, the change in the amplitude of voltage initiates the operation of proposed islanding detection method. The authors have observed the voltage variations by connecting different type of loads including resistive(R), resistive-inductive (RL), resistive-capacitive (RC) and resistive, inductive and capacitive (RLC) respectively. But the effect of inductive and capacitive loads separately connected with DG at the instance of grid failure, have not been analyzed. Furthermore, under load varying conditions, the output current of DG cannot be controlled to a predetermined value which may cause power quality problems. Shyh-Jier Huang and Fu-Sheng Pai have developed an algorithm, based on the self-commutated static power converters [75]. The computational procedure involves the sampling of input data including the input voltage and current for each branch and variations in the frequency and power. During the occurrence of the islanding, the changes in the frequency and power are compared with their predetermined threshold values. The incorrect selection of threshold values may prolong the computational time, causing an adverse effect on the results. Thorough investigation of the algorithm further delineates the difficulties faced during its implementation for distribution system having more than one DG. In majority of cases, DG(s) are designed to operate at unity power factor. It has been observed practically that the islanding detection techniques which are frequency dependent may not be operated affectively when DG is designed with unity power factor

98
[77]. Unfortunately these methods suffer from two main drawbacks of the choice of suitable threshold and a large non detection zone (NDZ). An active islanding detection for an inverter-based DG is presented by H.HZeineldin, E.F.EI-Saadany and M.M A Salama in which an effort has been made to explore the effects of using DGs to improve the local load power factor, through reactive power injection, on the NDZ of over and under voltage protection and over and under frequency protection for islanding detection method [77]. Although the proposed islanding detection technique is robust and has negligible NDZ but still it faces serious complexities during both the interface control design as well as parameters selection. As much computational work is involved in determining the parameters, the algorithm may fails to provide the accurate results in case of wrong parameters selection. A hybrid islanding detection technique has been developed by Vivek.Menon and M.Hashem Nehrir in which power flow and voltage unbalance detection techniques are combined to detect the islanding phenomena [79]. The disadvantage of this method lies in the inaccurate selection of frequency set point for power flow in the system. No proper criterion has been developed to select the frequency set point. The wrong restoration of frequency set point during the islanding detection may adversely affect the system. Other important issue relating to frequency set point is the selection of unity power factor for DG. Frequency based islanding detection techniques may not operate affectively at unity power factor. A new digital protection algorithm for islanding detection has been elaborated by M.A Redfern, J I Barret and Ousta [80]. The algorithm detects the islanding by monitoring the fluctuations in the DG output power caused by disturbances and differentiating between the response experienced when the main source is connected with DG and that when DG is operating in isolation (Micro-grid). During the operation of the algorithm, the operation time may increase if the trip setting (Ks) is wrongly selected. The results may also change drastically under the varying load conditions. Sung II Jang and Kwang-Ho Kim have presented an islanding detection method for DG using voltage unbalance method and total harmonic distortion of current [81]. The proposed algorithm is applicable only for single DG case. F.Katiraei, M.R.Iravani and P.W.Lehn have framed micro-grid autonomous operation during and subsequent to islanding process in which appropriate control strategy for power electronically interfaced DG unit can ensure stability of the micro-grid and maintained voltage quality at designated buses [84]. The suggested method is applicable only for balanced load. Furthermore, it can not be implemented for a case where we have more than one DG. A new control strategy was implemented for intentional islanding of DG by H.Zeineldin and E.F.EI-Saadany [88]. The method delineates the hybrid passive islanding for DG. The simulation results show that the interface control is not capable of operating in islanding condition despite the fact that the DG capacity is enough to supply the load. At the moment the islanding mode is operated, the spikes occur in the active and reactive power, frequency and voltage. If duration of spikes is more than pre-determined value, it will affect the operation of islanding detection algorithm and will also deteriorate the power quality of DG. Guiliang Yin has developed a distributed generation islanding detection method, based on artificial immune system. In this research paper two modules (T and B) have been
99
constructed on the functions of T and B cells of immune system [91]. Based upon these values, digital signal processing system has been established. The algorithm is difficult to implement particularly because of much computational complexity involved. Sung II Jang and K.H Kim have designed a new islanding detection algorithm for DGs interconnected with utility networks based upon the voltage unbalance and voltage magnitude [94].The test results were shown for IEEE 34 bus model in which DG was installed at bus number 840 and circuit breaker was opened between bus number 834 and 860, forming an island with single DG. Similar islanding was achieved by the installation of single DG at bus number 832 and 858, separately. The results are valid only for single DG scenario. No test cases were performed for islanding having more than one DG. Khalil EI-Arroudi, Geza Joos, Innocent Kamwa and Donald T Mc Gills have developed an intelligent based approach to islanding detection in DG [94]. The technique presented can be implemented successfully with high degree of accuracy for multi-DG system and has the ability to optimize the threshold values for various system parameters. However, much computational work is involved in the implementation of technique which may prolong the operating time and adversely affect the results. The data mining approach for setting the threshold of protective relays during the islanding detection of DG was suggested by Khalil EI-Arroudi and Geza Joos [95]. The technique can be applied to optimize threshold values of the four parameters including frequency, voltage, rate of change of frequency and rate of change of power for different protective devices. Although the data mining approach is very flexible in selecting the type and number of the system parameters, however, the extraction of setting rules from constructed model is too difficult. A relay trip signal is issued only when the measured values exceed the threshold and holds for a preset time-delay. The inaccurate adjustment of preset time-delay may also affect the optimal threshold values for various system parameters. Morris Brenna, George C. Lazaroiu, Gabrio Superti-Furga, and Enrico Tironi have explained the utilization of new control strategy for bidirectional front end converter for grid-connected DG units. The technique based on the evaluation of inductor-flux error trajectory which allows predicting the next commutation instance for islanding detection [96]. The control is fast and its feasibility and applicability has been confirmed by utilizing electronically interfaced DG(s). During the implementation of this technique, two drawbacks have been noticed. Firstly, the technique is frequency dependent which can not be utilized effectively for DG(s) having non unity power factor. Secondly, the interfaced control design is much complicated and difficult to implement under load varying conditions. Luiz A.C.Lopes and Yongzheng Zhang discussed the degradation of the performance of active frequency drifting islanding detection methods in multi-inverter system [97]. The cost and the complexity of such islanding detection methods are low but they present significant NDZs where they fail to detect the islanding. The analyses carried out are based solely on RLC load and the technique is designed for unity power factor only.LI Yongli,LI Shengwei, BAI Shibin and NIU Chongxuan have solicited an algorithm for islanding detection based on reactive power compensation for micro-grid. The algorithm works effectively with small NDZ and has faster operation time [98]. The complete investigation of simulation result enumerates that the proposed algorithm is designed for RLC type loads only. No test cases have been performed for non linear
100
loads. The implementation of algorithm also based on constant value of load parameters. The algorithm also fails to detect the islanding phenomena when difference between the load power and inverter based DG power is small. It has been observed that for effective islanding, the frequency must be within the allowable range otherwise, the algorithm fails to perform its functions during micro-grid. HOU Meiyi, GAO Houlei, LIU Bingxu and ZOU Guibin have developed vector shift method for islanding detection in which the impacts of both the active power imbalance and load variation on vector shift method are evaluated [99]. During the occurrence of islanding, the instantaneous values of the terminal voltage jump to other values and the phase position is changed. As a result, the cycle is either shorter or longer depending on whether there is an excess or deficit of active power in the islanded system. Such variation of the cycle duration results in a proportional variation of the terminal voltage phase angle . This behavior of terminal voltage is called vector shift. During simulation, it has been noticed that at the time of utility main failure if the load remaining on the island is equal to the output of the DG, the frequency variation and vector shift may not be sufficient to operate the protective system. Furthermore, it is unable to differentiate between false loss of main and other types of intentional or unintentional system disturbances. If the value of vector shifts angle and the active power imbalance changes behind their threshold values than this method of islanding detection will either take longer time to detect the occurrence of islanding or it will fail completely. The method is also unable to function in case of varying load conditions. It has also been observed that voltage at point of common coupling is different from sinusoidal voltage due to the presence of non-linear loads [100]. If after islanding detection, destabilization, and elimination the system performance still suffers, what active control devices can be added or switched as pointed out by Dr. Mohamed A.Zodhy, professor Electrical and Computer Engineering Department Oakland University. The application of newly designed algorithms (IDG and NIDA) stabilizes the overall operation of distribution system as; DG(s) are implemented in either heavily overload conditions or micro-grid formation during the occurrence of fault. If there is any power quality problem, the tool incorporates another DG until and unless all the parameters are brought within the international standard limits. In case of control equipments, the utility has the provision of sophisticated electronic devices, like static transfer switches (STS) and dynamic voltage restorers (DVRs). Keeping in view all the above mentioned problems, a new islanding detection algorithm (NIDA) has to be designed for radial distribution feeder of electric power distribution system, which can be implemented for islanding detection under uniform and non uniform loads and with power factor other than the unity, operating in multi-DG scenario. The algorithm should be incorporated with distribution feeder whose performance has to be enhanced by the implementation of DG(s) having optimal sizes and locations. According to IEEE standards, the voltage magnitude of all nodes of distribution feeder must not exceed the rated value that is ±5%.

101
Table No 4.1 Merits and demerits of existing islanding detection techniques
No Technique Merits Demerits
1 Islanding detection algorithm based on proportional power spectral density
Robust, fast response, can be applied for variable load
Unable to function under fast frequency variation
2 Voltage based islanding detection method Effective only for specific loads only
Cause power quality problems
3 Algorithm based on self commutated static power convertor
Fast response Difficult to select the threshold value
4 Hybrid islanding detection technique Small NDZ Difficult to select frequency set point, cannot work on non-unity power factor
5 Active islanding detection method for inverter based DG
Improve power factor, robust, small NDZ
Complex interface control, difficult parameter selection
6 New digital protection algorithm Simple, easy to apply on utility and micro-grid
Difficult to select trip setting, work only for variable load
7
Islanding detection method based on voltage unbalance and THD
Easy to implement Effective for single DG
8 Micro grid autonomous operation Economical Applicable for balance load
9 New control strategy Fast operation power quality problems
10 Islanding detection based on artificial immune system
Accurate Complicated, much computational work
11 New islanding detection algorithm Effective for single DG Failed under DG scenario
12 Intelligent based islanding detection Accurate, optimize threshold values effectively
Greater operating time, much computational work
13 Active frequency drift islanding detection in multi-inverter system
Economical, easy to implement
Significant N D Z
14 Reactive power compensation based islanding detection algorithm
Fast operation, small N D Z Cannot be used for non linear loads
15 Vector shift method for islanding detection Easy to implement Unable to detect false loss of main, prolong time, unable under load varying condition
4.11 Summery
Many techniques have been presented to monitor the phenomena of islanding. These techniques can be classified into three categories: active methods, passive methods and other methods. From operational point of view, Islanding may be intentional and unintentional. Unintentional Islanding is, either caused by switching operation of protective devices or tripping of distribution lines triggered by natural disasters. However, the intentional islanding is planned, in advanced by the distribution engineers. Extension in the distribution system, repair and maintenance, power management and the

102
replacement of distribution system equipments are among the main causes of intentional islanding. The non-uniform distribution of electric loads, unity power factor, complexities during the design of interface control and the functioning of the system in multi–DG scenarios are the most common obstacles, seriously faced by the distribution engineers, during the implementation of existing islanding detection techniques. The importance of islanding detection originates from security reasons. Having a feeder energized when utility operators carrying out repairing work may be hazardous. If the distribution network remains energized and a re-closing of the switching between utility network and low voltage distribution network occurs, power system equipments may get damage partially or completely because of frequency phase and magnitude variations between utility and the island. Among the causes of system islanding, malfunctions of protective equipments and multiple tripping of distribution lines triggered by natural disasters are the most common. Passive islanding detection devices measures, while active islanding detection both perturbs the output as well as measure it. Any sort of perturbation in the output is closely related to power quality. Therefore, small variation in the output parameters causes the degradation in the power quality for which the implementation of additional function is needed. The most prominent advantage of passive islanding detection is that it does not influence the power quality of electric power distribution system. The passive methods do not affect the waveform of the high voltage. Power quality issues like voltage dip, spikes, electrical noise and other associated problems do not exist during its implementation. The detailed review of literature reflects that many algorithms have been developed for islanding detection of distribution feeders. Majority of them can not be implemented practically due to many problems. Keeping in view all the above mentioned problems, a new islanding detection algorithm has to be designed for radial distribution feeder of electric power distribution system, which can be implemented for islanding detection under uniform and non uniform loads and with power factor other than the unity, operating in multi-DG scenario. The algorithm should be incorporated with distribution feeder whose performance has to be enhanced by the implementation of DG(s) having optimal sizes and locations. In stringent environmental and deregulated conditions, the desired goal can be achieved by enumerating the passive islanding detection techniques in the presence of DG(s) which can not only enhance the reliability but also improve the power quality.

103
CHAPTER V
ALGORITHMS AND SIMULATION RESULTS
5.1 Introduction
In the competitive deregulated environment, the Distributed Generation (DG) offers a feasible alternative to traditional sources of electric power for residential, commercial, and industrial application. Recent interest in the DG infrastructure is increasing globally because of its cost effectiveness. The installation of small generating unit affects the operation of electric utility system in terms of its performance improvement and reliability. Keeping this in view, the classical modeling and analyzing techniques must be revised. In past various optimization techniques for voltage profile improvement, loss reduction, and optimal placement of DG in electric distribution system had been proposed [43 and 101, 102, 103, 105,]. The mathematical analysis techniques include Gradient techniques, Successive Quadratic Programming (SQP) techniques, Karush Kuhn-Tucker non-linear programming techniques, and Successive Linear Programming (SLP) techniques [106, 107]. Majority of these techniques have the problem of excessive convergence time and premature convergence. The detailed review of literature reflects that in majority of cases some unrealistic assumptions are often adopted to make the models more manageable. Such assumptions are commonly made for radial distribution networks. Uniform load distribution, uniform feeder size, constant loads, equal spacing, and unity power factor are few examples of these assumptions. Whereas, heavy computational burden is needed to face the real world electric distribution system challenges. Practically, it has been observed that majority of distribution feeders are lengthy, heavily overloaded, having limited provision for future expansion and feeding non-uniform loads with non-unity power factor. In such scenario, the electric consumers are facing many problems because of excessive voltage drop and power loss [105]. Poor equipment performance, overheating, nuisance tripping of over current protective devices and excessive burnouts are signs of unsatisfactory voltage profile. Unlimited voltage variation directly deteriorates the equipment life. Several large industrial consumers have experienced substantial financial loss as a result of lapses in the quality of electricity supply. Non-uniform loads, use of under sized conductors, remote location of transformers from load centers, sub-standard jointing practices, and the long length of the distribution feeder

104
are major causes of voltage drop. Continuously increasing demand of electricity and the proliferation of different non-linear loads such as rectifiers, switch mode power supplies, arc furnaces and other switching converters have also deteriorated the quality of voltage for consumers having sensitive equipment. Lack of financial resources, unavailability of better technology and the non-implementation of long term planning has made the distribution system more problematic. Haphazard distribution of electric loads over the feeders, in general and mixed nature of loads on the feeder causes severe problems of power quality i.e. the voltage drop and power loss. Such problems are detrimental to the consumers as well as to the electric utilities. In the deregulated and competitive environment, the stringent environmental regulations, the increasing prices of material and transportation expenses are making the construction of large power stations economically unfeasible. In order to achieve optimized electricity production, increased production and improve security of electric supply to consumers, DG is an excellent alternative. Power plant located in the distribution system geographically closer to the customer minimizes the distribution losses [69]. The recent technological advancement in the exploitation of DG has greatly attracted the attention of distribution engineers [70]. DG must be capable of maintaining the voltage and frequency within standardized permissible limit. As the demand for more reliable and secure distribution power systems with greater power quality steadily increases, the concept of DG has become progressively more popular, especially among the electric service providers. It is envisaged that within the coming decade there will be significant changes in the distribution system configuration. This will include a large growth and expansion in the DG capacity. A study by electric power research institute (EPRI) indicates that by the year 2010, DGs will account for up to 25% of all new generating capacity in United States. The research conducted by National gas foundation estimates that the utilization of DG may increase up to 30% [120]. The use of DGs to supply portion of network could essentially provide many benefits to the DG owners, distribution network operators and consumers. Additional revenue to DG owners can be achieved due to increased power supplied during the network outage [89]. During the operation of the electric power distribution system, when fault occurs on utility main grid, the operation of sophisticated electronic switches isolate the distribution resources from it along with sensitive loads, forming island (micro-grid) [121]. If a part of distribution system forms an uncontrolled island, there is security risk for maintenance staff. Under such scenario, it is very essential to detect the islanding formation. Many techniques have been presented to monitor the islanding. The most direct method is to supervise the auxiliary contacts of all circuit breakers on the utility system between its main source of generation and the DG units. When switching operation or any short circuit fault causes the loss of utility network, a transfer trip or relay scheme can be employed to open the inter-tie links sub-system. The concept of this direct method is easy to grasp, but difficult to implement due to comprehensive monitoring system. These techniques can be divided in to three categories: active methods, passive methods and other methods. Most of these methods work well for large number of load cases but when tested by applying a particular worst case tested circuit in order to simulate the power

105
island, some special load cases can always be identified under which the particular methods fail to detect the power island. By a designated control circuit, a central concept of active method is to breed small variations in the outputs of dispersed generators. When the utility’s main source remains connected with the load, this deviation is relatively insufficient to trip the protective relays. However, once the loss of grid occurs, this designated deviation will enlarge to activate the relays, which signals the occurrence of islanding. The passive methods are based upon the measurements of power system parameters, such as voltage, frequency, current and phase displacement. The idea of this technique lies in the facts that the loss of main will result in the variation of system parameters. Therefore, by monitoring variations of these parameters, it can sense abnormal operations of dispersed generating units. Other methods employ different techniques for islanding detection other than active and passive methods. These techniques include reactance insertion, power line carrier communication (PLCC) and supervisory control and data acquisition (SCADA). Majority of these techniques are based upon the assumptions of unity power factor and uniformly distributed loads. The types of loads and their distribution (uniform/non uniform) in the distribution networks greatly determine the behavior of the distribution system. During the simulation it has been observed that mostly the variations in these parameters are too small to detect the phenomena of islanding. Due to one or other reason when there is sudden collapse on utility grid, system restoration takes considerable time. However, even if a part of distribution system remains in service along with DG, supplying a portion of distribution network is termed as micro grid. Formation of micro grid due to islanding process can be due to disturbances, such as fault and its subsequent switching. In view of the above, the corrective action under such situation has to be instantaneous and drastic to protect the system from total failure. However, much computational work is to be faced by distribution engineers in the real world of electric power distribution system challenges [122]. Under such circumstances, it is essential to design tools for power quality improvement of distribution feeders in terms of node voltage profile improvement and power loss reduction as well as islanding detection. In this context, a comprehensive algorithm for the implementation of distributed generation (IDG) has been developed to identify the optimal size and location of DG in the distribution system. The proposed algorithm can be utilized effectively to increase the feeder performance having non-uniformly distributed loads. The feeder has been simulated in C-language and the results have been verified. As far as islanding detection is concerned, a new islanding detection algorithm (NIDA) for multiple distributed generation scenarios has been developed. The algorithm is designed in C language and is based upon the node voltage profile improvement and power loss reduction. The propose algorithm outperforms the conventional approaches, which have some difficulties to detect the islanding operation. The non-uniform distribution of electric loads, unity power factor, complexities during the design of interface control and the functioning of the system in multi–DG scenarios are the most common obstacles, seriously faced by the distribution engineers during the

106
implementation of existing islanding detection techniques. NIDA has the capabilities to function under uniform and non-uniform loads with power factor other than unity for both single DG as well as multi-DG scenarios. The simulation results show that the algorithm can be implemented efficiently to detect the islanding phenomena and enhance the distribution system performance in terms of node voltage improvement and power loss reduction
5.2 DG for Performance Enhancement of Distribution Feeder
Distributed Generation (DG) is a concept of installing and operating small electric generators connected directly to the distribution network or at the customer side. The term DG can be described as small scale generating unit located in the vicinity of load centers [54, 108, 109, and 110]. The small size and the modularity of DG support a potentially broad range of customer and grid-sited applications where base power plants would prove to be impractical. A wide verity of DG technologies such as wind turbines, fuel cells, and photovoltaic can be considered as an alternative to capacity addition [108]. The main reasons for the expected penetration of DG includes the trend of restructuring in electric power utilities, availability of new generation technologies with small ratings and overloading of existing networks [54]. Presently, the electric utilities are exploring potential applications for DGs at the utility-side of network. Consequently, they are fully integrated with the distribution system. Generally, DG has shown excellent performance in the areas having high density of electrical loads. They have also performed well in rural and isolated areas where the distribution feeder exceeds standard limits and voltage profile may be improved through installation of a feasible DG technology. These technologies become feasible where the availability of electricity from the national grid is not a viable option [111]. DGs are predicted to play a vital role in the electric power distribution system of the future. Due to rapid growth in the population, there has been tremendous increase in electric power consumption rates and high load densities. The growth and need for more flexible electric systems, changing regulatory and economic scenarios, energy saving, environmental impacts and need to protect the sensitive load against network disturbances are providing impetus to the development of DGs based on a variety of alternate generation technologies. The purpose of these technologies is to cope up with increasing demand of electricity in certain areas and render certain activities self-sufficient in terms of power production. Significant benefits can be accrued by integrating DG with utility network [112]. The technical requirements for large scale and reliability enhancing integration of DG into the existing distribution system depend upon the evolution of the markets. These markets include that of customer-driven (Back-up generation), utility distribution system enhancement, local micro-grid, interconnected local micro-grids, and interconnected local micro-grids with utility network [113]. In certain cases, interconnections of micro-grids and utility networks are based on agreeable and standardized guidelines that allow customer micro-grids to participate in competitive energy and ancillary services markets [114].

107
Distributed Generation is used mainly for selected applications in response to specialized customer needs. Backup or emergency generators owned by customers provide electricity when the electric utility is not available. Uninterruptible Power Supplies (UPSs) are also used for critical loads. With the advent of modern power electronics and control technologies, the emphases will be to extend the operating hours of DG(s). DGs are required to install in various sizes and utility location throughout the grid to meet the following needs:
1) Voltage profile improvement
2) Line loss reduction
3) Improved feeder performance and enhanced power reliability
4) Environmental friendly
5) Relieved Transmission and Distribution congestion
6) Reduce the operating cost due to peak shaving
7) Minimize the Operation and Maintenance cost
8) Energy needs
9) Improve grid asset utilization
5.3 Voltage Profile Improvement (EPI) Of Distribution Feeder
The proper size and placement of DG in the distribution network reduces the voltage drop and power loss significantly. The recent advancement in the power electronics and control technology with increasing demand for electricity has made the DG, a viable alternative for performance improvement of distribution feeder. To keep the tail end customers voltage within permissible limits, DGs are installed in the distribution network. DG can provide portion of real and reactive power to the load which intern decreases the current along the feeder segment. This reduction of current causes voltage boost in magnitude at customer terminals. To quantify the benefits of voltage profile improvement, a voltage profile improvement index has been introduced which states that the ratio of voltages at different nodes with DG connected to the system to the voltages at different nodes without DG connection under similar load conditions. Mathematical notation is shown in equation (5.1)
EP
EPEPII DG (5. 1)
Where,

108
EPII = Voltage profile improvement index.
DGEP = Voltage at different nodes with DG
EP = Voltage at different nodes without DG connection under similar load conditions. The expression should be used only after defining the maximum and minimum allowable limits which are %5 of the nominal voltage rating [31]. In per unit system the nominal voltage ratings are:
max
min
1.00 . .
1.05 . .
0.95 . .
nomE p u
E p u
E p u
Where,
nomE Nominal value of voltage in per unit
maxE Maximum value of voltage in per unit
minE Minimum value of voltage in per unit
Taking only the magnitude of voltage, the voltage profile improvement (EP1) for the i th node can be expressed as:
min max
min max
( )( )
( )( )i i
inom nom
E E E EEP
E E E E
(5.2)
Where,
iE Any value of voltage in per unit at i th node. The over all voltage profile index of the
system is
11
1 n
ii
EP EPN
(5.3)
Where,
N Number of nodes The voltage profile improvement index EPII stated in (1) can be rewritten as;

109
11
1
withDG
withoutDG
EPEPII
EP (5.4)
To achieve the accuracy in the results a weighting factor based on importance of different loads is chosen. Normally, all nodes are equally weighted for which value of weighting factor (K) can be taken as 1 based on the analyses of the result. Keeping in view of weighting factor, the equation (5.2) can be modified as
min max2
min max 1
( )( )
( )( )i i i i
i n
nom nom i iK
E E E E L KEP
E E E E L K
(5.5)
Where,
2iEP Voltage profile at i th node with weighting factor
iL Load supplied at i th node in per unit
iK Weighting factor at i th node
The over all voltage profile index expressed in equation (5.3) can be rewritten as
2 21
n
iiEP EP
(5.6)
The corresponding voltage profile improvement index will be
22
2
withDG
withoutDG
EPEPII
EP (5.7)
The general expression for the voltage profile of the distribution system can be rewritten as;
1
n
i i iiEP E L K
(5.8)
Where, EP Voltage profile
iE Voltage of i th node in per unit
iL Load supplied at i th node in per unit

110
n Number of node
iK Weighting factor of ith node
The general equation of voltage profile is valid only when all the node voltages are within permissible limit %)5( of the nominal voltage rating. The voltage profile index is 0 at 0.95 per unit and 1.05 per unit and has maximum value of 1.0 when all the node voltages are at their nominal values. If any node voltage falls below or rises above the nominal voltage, the over all voltage profile of the system is affected adversely, indicating the exact picture of the effect of DG on the over all distribution system. The voltage profile of individual nodes will be negative if node voltage falls below Emin or rises above the Emax, resulting reduction of the over all voltage profile index of the system.
5.4 Effect of Voltage Profile Improvement on Feeder Performance
Practically it has been noticed that the majority of the distribution feeders are unbalanced, heavily over loaded, lengthy and utilizes unequal conductor size. In such circumstances, the voltage drop and power loss in various segments of the feeder crosses the standard tolerance limit. As a result, the poor voltage profile adversely affects power quality of the electric utility. To avoid such situation, an analytical approach is adopted to remedy the situation in the presence of IDG algorithm. The application of IDG algorithm enables to grasp the conflicting nature of non-uniformly distributed load which mainly causes the feeder performance issues. It is known that by improving the voltage profile of distribution feeder the active and reactive power losses are reduced [115]. The addition of DG to distribution network at optimal location can improve the voltage profile which in turn increases the operating efficiency of distribution feeder [116]. The problems of voltage drop and power loss are minimized and the over all performance of the system is enhanced.
5.5 Distribution Feeder Performance Enhancement Analyses by IDG Algorithm
In the existing competitive environment utilities are facing pressure of deregulation in the electric industry and the power quality awareness of the customers. It has become essential to enhance the feeder performance in terms of voltage drop and power loss reduction. Mostly the rural feeders of developing and underdeveloped countries are lengthy and overloaded with non-uniform loads. In order to test IDG tool, three different radial distribution feeders have been taken as case study. The radial distribution network of 11kV Panian feeder of Haripur sub-division in the jurisdiction of Peshawar electricity supply corporation (PESCO), Pakistan has been taken as case study. The data regarding the feeder segment length and non-uniform load connected to each node is collected by the field survey. Using this data, the single line diagram is constructed as depicted in Fig 5.4. For convenience, the single line diagram has been reduced to 38 nodes, by adding the loads of laterals and sub laterals as shown in Fig 5.5. However, it does not affect the analysis of the feeder.

111
0 1 2 4 9 10 18 20 23 25 28 31 37
147 148 150 152 156 157 161 162 163 164 165 166
167
168
48
500MCM
132 KV Haripur Grid Station
D DD DD D D D D D D D
RDD DDD
3
6
5
R R
R
R
7R
13
1112 R
RR
R
R
14R
17 16 15R R
19
R
22
21 24
R R RR
R
27
26
R
R
30
29
R
33
32
3436 35R R
R
39
38
40
56
55
54
52
51
46
45
43
41
D
42R
44R
47R
R
R
50
49
RR
R
R
R
R
R
R
R
R
R71 69 68 65 60 58 57
R R R R
59RR
R
63
61
64
62RR
67
6670
111110
10099
9897
9089
8878
72
D
D
D
D
D
D
D
D
D 77
76
75
74
73
R
R
R
R
R84 83 82 79RRRR
8180
R
R
86 85
87
RRR
8R
96 95 94 93 92 91R
R R R
R
R R
R RR R
109 108 107 106 105 103R R RR R
102
101
R
R
R
104R
113 112D D123 122 121 118 117 116DD D DD
114
R
R119
R115
R 120124
126
127
G
G
G
128 130 133 134 135 138 139 140G
129
R
R 125131
132
R
R
R R R R
137136
RR
R
R R
D
D
D
D
141
145
144
143142
R
146 149 151
155
154
153
160
159
158R R R
R
R
R
R
R
R R R R RR
R
R
200
100
50
50
25
50
25 25502550
5050
100
25
100
2525
100
50
50
100
53
50
25
25
50
100
5050
25
100
100
2550
25
50
50
5050
50
50
50
5025
50
50
50
25
100
50
50
25
50
100
100
100
100
100
7525
5050200
10025100
25
50200100
50100
5025
25
50
200
50
50
10050502550
100
505050
50
25 5050
50
50
200
25
100
50
100
25
100100
50
10050
50
50 50
50
100 100
10050
25
200
50
50
25
50
25
50
200
50
25
25
50 25 50 50
25
DRG
132 KV Haripur Grid Station
Distribution TransformerNode
A C S R Dog conductorA C S R Rabbit conductorA C S R Gaffer conductorConductor segment
Fig5.4 Single line diagram of 11kV Panian feeder of PESCO Haripur sub-division To simplify the analyses, the radial distribution feeder is divided in to various segments between different nodes. Using the analytical method, the parameter values of these feeder segments including resistance, inductance, inductive reactance, impedance, and the power factor are calculated. To make our analysis more realistic, the power factor is taken as 0.9 in this particular case. Instead of using uniform loads, non-uniform loads are considered at each node. The current in each feeder segment is calculated by the application of Kirchoff’s current law. Capacitance and conductance of each segment is neglected due to its shorter length. All the parameter values are listed in Table I. In order to quantify the effects of non-uniformly distributed load, model diagrams of distribution feeder without and with DG are simulated as illustrated in Fig. 5.1 and Fig. 5.2, respectively.

112
Fig. 5.1 Model Diagram of Distribution Feeder without DG
Fig 5.2 Model Diagram of Distribution Feeder with DG The detailed analyses have been completed in three stages. In first stage, the voltage drop and power losses are analytically calculated without DG. In second stage, the voltage drop and power losses are determined analytically with DG connected to the system. The difference of both readings (without and with DG) is listed in Table V, showing the performance improvement of distribution feeder. In third stage, the simulations were performed again for above two stages in an algorithm (IDG) programmed in C language and the results were verified using the analytical approach. The distribution feeder is tested against some pre-determined planning criteria as a minimum requirement. That ensures the distribution system design to meet specified standard guidelines for distribution system. According to IEEE standards, the voltage magnitude at all nodes of distribution feeder should be ±5% of rated value [31]. In order to bring the voltage drop at each node of the feeder to its specified limits, IDG tool is developed in which there is a provision of determining the size, position, and number of DGs required meeting standards and specification for performance of the feeder. In this

113
particular case the 11kV is selected as reference voltage. During the simulation, the position and magnitude of DG is varied continuously and the values, within the acceptable limit, are stored. These stored values are tested for a series of checks and calculations to find the optimal position and location of DG. The application of DG reduces the source current thereby minimizing the voltage drop (IZ) and power loss (I2R). In this way, DG reduces the source current to a value at which all the node voltages are within standard limit. Running this program, the feeder performance can be enhanced to considerable extent by obtaining the optimal values of DG size and location. 5.5.1 Power Loss and Voltage Drop without DG The power loss and the voltage drop for different segments and nodes of the feeder are to be calculated by performing the analysis without and with DG. The incremental power loss for “n” segment is;
1 2
1 , 1
n
loss n n n
x n
dIP R dx
dt
(5.9)
The total power loss for “n” segments is;
1 22 2
1 0,1 2 1,2
0 11 2
1 , 1
loss
n
n n n
n
dI dIP R dx R dx
dt dtdI
R dxdt
(5.10)
2
1 , 11
j
loss n n ni
dIP R
dt
(5.11)
Where
1, 2,3,i is the number of feeder segment The incremental voltage drop for “n” segments is
1
1 , 1
n
x n n n
x n
dIdE Z dx
dt
(5.12)
The voltage drop at any point at distance “x” from the sending end of the feeder is;
114
( )drop s xE x E E (5.13)
Voltage drop in any feeder segment is;
, 1 1 , 1drop n n n n n
dIE Z
dt (5.14)
Total voltage drop
drop s rE E E (5.15)
5.5.2 Power Loss and Voltage Drop with DG Now consider DG connected to “nth” node of the feeder as shown in Fig 5. 2. This will change the feeder current in each segment due to improvement in the voltage profile along the line. This change in segment current will cause the feeder current to decrease. The feeder current between the source and the location of DG will also change as a result of the injected current source ( dgI ). This change in feeder current ( '
1, nnI ) due to DG
installation is determined for each feeder segment. The incremental power loss with DG is given by equation (5.16),
1 2
1 , 1
nDG
lossDG n n n
x n
dIP R dx
dt
(5.16)
The total power loss with DG is;
1 22 2
1 0,1 2 1,2
0 11 2
1 , 1
DG DGlossDG
nDG
n n n
n
dI dIP R dx R dx
dt dtdI
R dxdt
(5.17)
2
1 , 11
jDG
lossDG n n ni
dIP R
dt
(5.18)
Incremental voltage drop with DG is;

115
1
1 , 1
nDG
DG n n n
x n
dIdEx Z dx
dt
(5.19)
Voltage drops in any feeder segment with DG;
, 1 1 , 1DG
dropDG n n n n n
dIE Z
dt (5.20)
Total voltage drop with DG is;
dropDG s rE E E (5.21)
5.5.3 Optimal Placement of DG The confirmed solution of DG allocation can be achieved by complete enumeration of all possible combinations of sites and sizes of DGs in the electric power distribution system. Narayan S Rau and Yih-heui wan have presented an algorithm for distribution system, called as second order algorithm [117]. The second order algorithm is applicable to a feeder having limited number of nodes Furthermore, the incorrect assessment of weighting factors and can affect the results adversely. According to zero point analysis the best location for DG is usually at the end of feeders with most heavily loaded branch [118]. Raj Kumar Jaganathan and Tapan Kumar Saha described that the distributions losses can be minimized by placing DG by rule of thumb, 2/3 rule which is most frequently used for capacitor placement in distribution system [119]. Artificial intelligence techniques and genetic algorithm are efficient tools to solve the optimization problems. Karen Nan Miu, Hsiao-Dong Chiang have analyzed a distribution network with analytical approaches for uniform and non-uniform load variations at unity power factor [105]. Majority of these techniques are used on the assumption of uniformly distributed load and have the obstacle of excessive convergence time and pre mature convergence. In this research work, the analytical approaches are applied for radial distribution feeder with non-uniform load and power factor other than unity. A comprehensive algorithm (IDG) is established which can identify the optimal size and location of DG. 5.5.4 Implementation of IDG Algorithm It has been observed that during the design of electric power distribution system, the engineers are forced to adopt some unrealistic assumptions to make the models more acceptable. Uniform load distribution, uniform feeder size, constant loads, equal spacing, and unity power factor are the most common assumptions made in the simulation
116
process. However, in the real life scenario, the situation is quiet different from these assumptions. Under such circumstances, a cumbersome job is required by the engineers in the real world of electric power distribution system. The urban and the rural distribution feeders in developing and under developing countries are extremely over loaded due to the following reasons;
1) The use of undersized conductors
2) Substandard jointing practices
3) Remote location of transformers from loads
4) Rapid increase in the domestic power consumption
5) Incorrect assessment of consumer load
6) Fast expansion in the industrial sector
7) Growing demand of electric power in suburbs The stated reasons have created many problems both for the electric utilities as well as the consumer, like;
1) Unscheduled load shedding
2) Excessive voltage drop
3) Huge power losses
4) Frequent failures in protective systems
5) Financial losses (Consumer / utilities) In such scenarios, the utilization of locally available resources, the Distributed Generation, provides considerable relief to generation, transmission, and distribution networks in a very cost effective way. In order to overcome these problems and to provide reliable electric power, a comprehensive algorithm, IDG has been implemented in C language. Optimum feeder performance can be achieved by a complete enumeration of all feasible combinations of sites and sizes of DG(s). IDG algorithm has the capability to find the optimum solution for distribution feeders having uniform/ non-uniform loads. Using the analytical approach, the feeder is divided into a number of sections, called segments. During the execution of IDG algorithm, the calculation of segment data is of great importance for which initial grid voltage, number of nodes, segment length and load (amperes) connected to each node are provided by the user. This input data can be
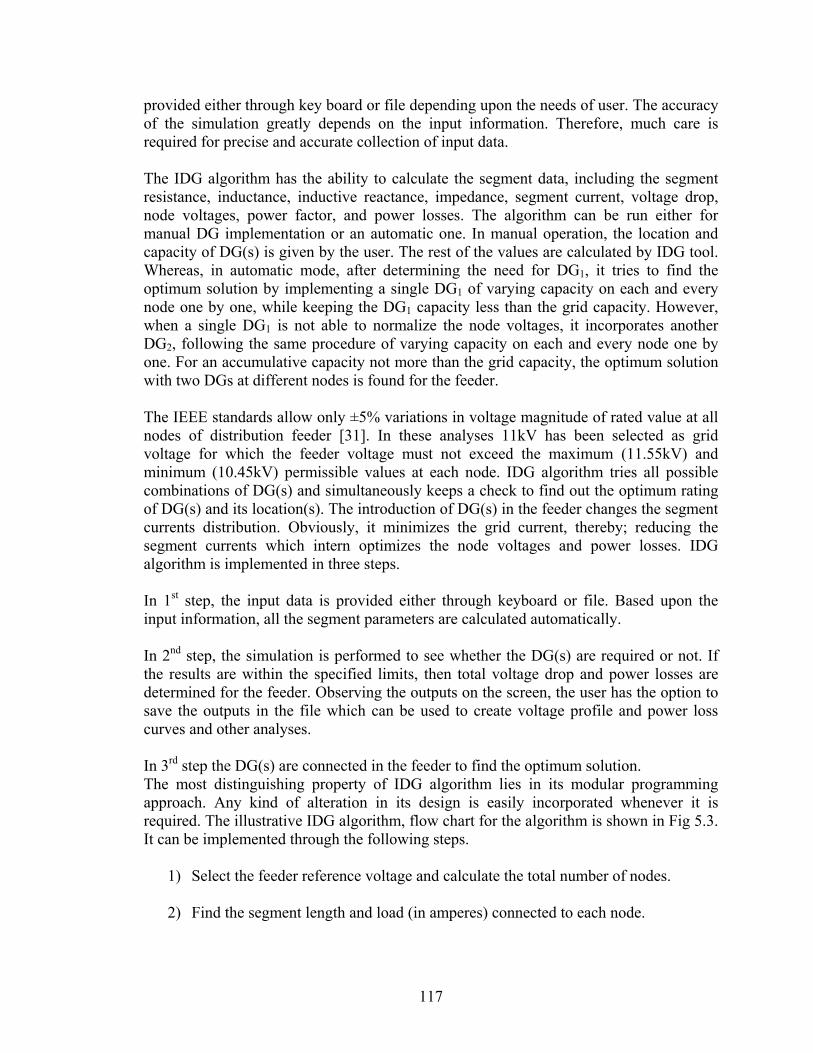
117
provided either through key board or file depending upon the needs of user. The accuracy of the simulation greatly depends on the input information. Therefore, much care is required for precise and accurate collection of input data. The IDG algorithm has the ability to calculate the segment data, including the segment resistance, inductance, inductive reactance, impedance, segment current, voltage drop, node voltages, power factor, and power losses. The algorithm can be run either for manual DG implementation or an automatic one. In manual operation, the location and capacity of DG(s) is given by the user. The rest of the values are calculated by IDG tool. Whereas, in automatic mode, after determining the need for DG1, it tries to find the optimum solution by implementing a single DG1 of varying capacity on each and every node one by one, while keeping the DG1 capacity less than the grid capacity. However, when a single DG1 is not able to normalize the node voltages, it incorporates another DG2, following the same procedure of varying capacity on each and every node one by one. For an accumulative capacity not more than the grid capacity, the optimum solution with two DGs at different nodes is found for the feeder. The IEEE standards allow only ±5% variations in voltage magnitude of rated value at all nodes of distribution feeder [31]. In these analyses 11kV has been selected as grid voltage for which the feeder voltage must not exceed the maximum (11.55kV) and minimum (10.45kV) permissible values at each node. IDG algorithm tries all possible combinations of DG(s) and simultaneously keeps a check to find out the optimum rating of DG(s) and its location(s). The introduction of DG(s) in the feeder changes the segment currents distribution. Obviously, it minimizes the grid current, thereby; reducing the segment currents which intern optimizes the node voltages and power losses. IDG algorithm is implemented in three steps. In 1st step, the input data is provided either through keyboard or file. Based upon the input information, all the segment parameters are calculated automatically. In 2nd step, the simulation is performed to see whether the DG(s) are required or not. If the results are within the specified limits, then total voltage drop and power losses are determined for the feeder. Observing the outputs on the screen, the user has the option to save the outputs in the file which can be used to create voltage profile and power loss curves and other analyses. In 3rd step the DG(s) are connected in the feeder to find the optimum solution. The most distinguishing property of IDG algorithm lies in its modular programming approach. Any kind of alteration in its design is easily incorporated whenever it is required. The illustrative IDG algorithm, flow chart for the algorithm is shown in Fig 5.3. It can be implemented through the following steps.
1) Select the feeder reference voltage and calculate the total number of nodes.
2) Find the segment length and load (in amperes) connected to each node.

118
3) Determine the feeder parameters including segment resistance, inductance, inductive reactance, impedance, length, segment current, node voltages, power loss and power factor for each feeder segment.
4) Confirm the voltage limits for each node ±5% of the rated value.
5) If node voltages are out of limit, then connect the DG1to “nth” node
6) Evaluate the change in each segment current due to DG1 and calculate the node
voltages.
7) If node voltages are out of limit, change the location of DG1until all the node voltages are within acceptable range.
8) If node voltages are still out of limit, also start changing the size of DG1 in a step
of 0.01 amperes along with locations.
9) If node voltages are still out of range, connect DG2 to “nth” node along with DG1 and repeat the process from step (vi) to step (viii) for DG1 and DG2, simultaneously until the optimal solution is obtained.
10) Calculate the total voltage drop and power loss.
11) The position(s) and size(s) of the DG(s) will be the required optimal location and
size.
12) Save the results in data file.

119
(a)

120

121
(b)

122
(c) Fig 5.3 Flow Chart for calculating the voltage drop and power loss, without and with DG

123
5.5.5 Salient Features of the IDG Tool
The IDG tool has the most distinguishing features which facilitate the user during its implementation. It has the ability to find optimum solution for distribution feeder having uniform/non-uniform loads. Two different input modes can be operated, that is either through keyboard or file, depending upon the requirement of user. Initial (Grid) voltage, No. of nodes, segment length and segment load current is given by the user during its implementation. Automatically, it can calculate segment current, resistance, inductance, inductive reactance, impedance, node voltage, and segment power loss. The user has the option for either a manual DG implementation or an Automatic one. Whereas, DG(s) position and capacity given by user in manual mode. The rest of the values are calculated by the tool. In automatic mode after determining the need for a DG, it tries to find an optimum solution first by implementing a single DG of varying capacity on each and every node of the distribution feeder one by one, while keeping the DG capacity less than the grid (source) capacity. When a single DG is not able to normalize the node voltages, it incorporates another DG, through the same procedure, of varying capacity on each and every node one by one, finding the optimum solution as two DG(s) at different nodes having an accumulated capacity not exceeding the grid (source). It tries all possible combinations of DG(s) and simultaneously keeps a check to find out the optimum rating of DG(s) and Location(s). After reaching an optimum solution, it calculates total power loss and voltage drop for the whole feeder. After viewing the output on screen the user has the option to save the output in a file, which can later be used to create graphs and other analysis. The tool has been designed by using a modular programming approach, enabling an efficient enhancement/alteration, as and when required.
5.6 Case Study 1
The 11 kV Panian radial distribution feeder of Haripur Sub-division Peshawar Electricity Supply Corporation (PESCO) Pakistan has been taken as case study. It is 98.9 km long and emanates from 132 kV Haripur grid station. The feeder comprises of 168 nodes, feeding different categories of loads including residential, agricultural, and commercial and Industrial. The total number of consumers fed by the selected feeder is 6948.

124
TABLE 5.1 11KV FEEDER DATA USED IN THE ANALYSIS
S.No Length (Km) R(Ω) L(mH) X(Ω) Z (Ω)
1 1.25 0.422 1.113 0.35 0.548
2 1.2 0.405 1.07 0.336 0.526
3 0.65 0.220 0. 579 0.182 0.285
4 0.35 0.118 0. 312 0.098 0.1534
5 0.65 0.220 0.579 0.182 0.285
6 1.70 0.574 0.1515 0.475 0.745
7 0.38 0.128 0.3386 0.1064 0.166
8 0.15 0.051 0.1336 0.042 0.066
9 0.75 0.253 0.6682 0.21 0.329
10 0.38 0.128 0.3386 0.1064 0.166
11 0.60 0.202 0.5346 0.168 0.263
12 0.95 0.321 0.8464 0.266 0.417
13 0.65 0.220 0.5791 0.182 0.285
14 0.25 0.084 0.2227 0.07 0.109
15 0.68 0.230 0.6059 0.1904 0.298
16 0.45 0.169 0.4009 0.126 0.21
17 0.25 0.084 0.2227 0.07 0.107
18 0.15 0.051 0.1336 0.042 0.066
19 0.25 0.084 0.2227 0.07 0.0.109
20 0.65 0.220 0.5791 0.182 0.285
21 1.25 0.422 0.1114 0.35 0.548
22 0.35 0.118 0.3118 0.098 0.1534
23 0.15 0.051 0.1336 0.042 0.066
24 0.57 0.192 0.5078 0.1596 0.25
25 0.25 0.084 0.2227 0.07 0.109
26 0.15 0.051 0.1336 0.042 0.066
27 0.25 0.084 0.2227 0.07 0.109
28 0.20 0.067 0.1782 0.056 0.087
29 0.40 0.135 0.3564 0.112 0.175
30 0.18 0.061 0.1604 0.0504 0.079
31 0.45 0.152 0.4009 0.126 0.197
32 0.25 0.084 0.2227 0.07 0.109
33 0.95 0.321 0.8464 0.226 0.417
34 1.25 0.422 0.1114 0 35 0.548
35 0.15 0.051 0.1336 0.042 0.066
36 0.75 0.253 0.6682 0.21 0.329
37 0.25 0.084 0.5791 0.07 0.109
38 0.65 0.220 0.5790 0.182 0.285
The category wise distribution of these consumers is illustrated in Table 5.6. The model diagrams of the feeder without DG and with DG are depicted in the Fig.5.1 and Fig.5.2. The values of line resistance, inductance, inductive reactance, impedance, segment voltage drop, node voltages, and line power losses are calculated for each segment as listed in Table 5.1. The values of these parameters depend upon the wire factor which changes with change in size of conductor.

125
The analysis is completed in the following three steps. 5.6.1 Step 1 In this step, the single line diagram shown in the Fig.5.4 has been developed in micro- soft office Visio 2003. To simplify the system, the parent diagram of feeder is modified to 38 nodes system as depicted in the Fig 5.5.
Fig5.5 Modified single line diagram of distribution system under study
The parameter values were calculated according to the information and data collected during the field survey as listed in Table 5.1. The current in each section is determined. The total feeder load is 8425 kVA. 5.6.2 Step 2 As described earlier, the feeder mainly comprises of non-uniformly distributed loads. For such type of feeders, different simulation techniques can be utilized. In this particular analysis, the simulation is based upon analytical approaches. The current distribution diagram is generated as mentioned above. A comprehensive algorithm (IDG) in C language has been developed. The modified feeder diagram is simulated in IDG algorithm for the existing load condition. The detailed analytical results presented in Table 5.2 and Table 5.3 provide the actual information regarding the existing system segment voltage drop, power loss and node voltages under fully loaded condition. Both the results indicate high voltage drop (21%) and power loss (8%). The voltage profile and power loss curves are presented in Fig.5.6 and Fig.5.7, respectively.

126
TABLE 5.2
EXISTING SYSTEM RESULTS WITHOUT DG S.No I (Amp.) Vd (volts) Node Voltage (volts) P loss (kW)
1 444.2 243.42 10756.58 83.266
2 433.7 228.126 10528.45 76.178
3 424.5 120.982 10407.47 39.644
4 419.2 64.137 10343.33 20.736
5 407.2 116.052 10227.281 36.478
6 401.9 299.415 9927.866 92.714
7 393.9 65.387 9862.479 19.860
8 392.6 25.91 9836.569 07.861
9 390.0 128.31 9708.259 38.481
10 382.0 63.412 9644.847 18.678
11 368.8 96.99 9547.857 27.475
12 351.8 146.70 9401.157 39.728
13 288.8 82.308 9318.848 18.49
14 262.5 28.612 9290.237 05.788
15 236.2 70.387 9219.85 12.832
16 234.9 49.329 9170.521 09.325
17 229.9 25.06 9145.461 04.428
18 201.6 13.305 9132.156 02.073
19 199.0 21.691 9110.465 03.326
20 197.7 56.344 9054.121 08.599
21 196.4 107.63 8946.491 16.278
22 163.2 25.035 8921.456 03.143
23 157.9 10.42 8911.036 01.272
24 155.3 38.82 8872.216 04.631
25 152.7 16.64 8855.576 01.959
26 147.4 9.728 8845.848 01.108
27 144.8 15.7832 8830.0648 01.761
28 143.5 12.485 8817.5798 01.379
29 135.5 23.71 8793.869 02.479
30 125.0 9.875 8783.99 00.953
31 67.0 13.199 8770.7958 00.682
32 61.7 6.73 8764.0658 00.320
33 59.1 24.64 8739.4258 01.121
34 57.8 31.674 8707.7518 01.410
35 47.3 3.122 8704.6298 00.114
36 44.7 14.70 8689.9298 00.505
37 42.1 4.588 8685.3418 00.149
38 40.8 11.628 8673.7138 00.366
Total voltage drop=2326.2862volts
Total power loss= 605.45Kw

127
TABLE 5.3
EXISTING SYSTEM RESULTS WITH DG S.No
. I (Amp.) Vd (volts) Node Voltage
(volts) P loss (kW)
1 128.96 70.67 10929.330 7.0180
2 118.46 62.31 10867.020 5.6833
3 109.26 31.139 10835.880 7.7595
4 103.96 15.947 10819.934 1.2753
5 91.96 26.210 10793.724 1.8600
6 86.66 64.562 10729.162 4.311
7 78.66 13.057 10716.105 0.792
8 77.36 5.105 10711.00 0.305
9 74.76 24.596 10668.404 1.414
10 66.76 11.082 10675.322 0.5705
11 53.56 14.086 10661.236 0.5795
12 36.56 5.374 10655.862 0.429
13 26.44 7.535 10648.327 0.1540
14 52.74 5.748 10642.579 0.2336
15 40.84 12.17 10630.409 0.384
16 39.54 7.789 10622.62 0.2376
17 34.24 3.732 10618.888 0.09854
18 6.24 0.412 10618.476 0.0020
19 3.64 0.396 10618.08 0.0011
20 2.34 0.666 10617.414 0.0012
21 1.04 0.569 10616.845 0.0005
22 32.16 4.933 10611.912 0.122
23 37.46 2.472 10609.44 0.072
24 40.06 10.015 10599.425 0.308
25 42.66 4.649 10594.775 0.153
26 47.96 3.165 10591.611 0.117
27 50.56 5.511 10586.1 0.215
28 51.86 4.512 10581.588 0.1802
29 59.86 10.475 10571.113 0.484
30 70.36 5.558 10565.555 0.302
31 67.0 13.199 10552.356 0.682
32 61.7 6.725 10545.631 0.320
33 59.1 24.644 10520.987 1.121
34 57.8 31.674 10489.313 1.41
35 47.3 3.122 10486.191 0.114
36 44.7 14.706 10471.485 0.506
37 42.1 4.589 10466.896 0.150
38 40.8 11.628 10455.268 0.366
Total voltage drop= 544.732volts
Total power loss = 39.732Kw

128
TABLE 5.4 SIMULATION RESULTS WITH DG
S.No I (Amp.) Vd (volts) Node Voltage
(volts) P loss (kW)
1 129.7 69.8 10930.200 7.09682
2 119.2 61.583 10868.618 5.7545
3 110.0 30.783 10837.835 2.65444
4 104.7 15.777 10822.058 1.295
5 92.7 25.942 10796.116 1.885
6 87.4 63.968 10732.148 4.3827
7 79.4 12.99 10719.158 0.80853
8 78.1 5.044 10714.115 0.3088
9 75.5 24.379 10689.736 1.44288
10 67.5 8.718 10681.018 0.41632
11 54.3 14.027 10666.991 0.597069
12 37.3 15.256 10651.735 0.446082
13 25.7 7.192 10644.543 0.144895
14 52.0 5.597 10638.946 0.22815
15 41.2 12.062 10626.885 0.389562
16 39.9 7.73 10619.155 0.241787
17 34.9 3.756 10615.398 0.10277
18 6.6 0.426 10614.972 0.002205
19 4.0 0.431 10614.541 0.00135
20 2.7 0.756 10613.786 0.001599
21 1.4 0.753 10613.032 0.000827
22 31.8 4.792 10608.241 0.119453
23 37.1 2.396 10605.845 0.069681
24 39.7 9.742 10596.102 0.3032
25 42.3 4.553 10591.549 0.150971
26 47.6 3.074 10588.475 0.114704
27 50.2 5.403 10583.072 0.212628
28 51.5 4.434 10578.638 0.179027
29 59.5 10.247 10568.391 0.477934
30 70.0 5.425 10562.967 0.297675
31 66.8 12.942 10550.025 0.677703
32 61.5 6.619 10543.406 0.319127
33 58.9 24.09 10519.315 1.112315
34 57.6 30.998 10488.317 1.39968
35 47.3 3.055 10485.263 0.113263
36 44.7 14.433 10470.829 0.505767
37 42.1 4.531 10466.298 0.149547
38 40.8 11.418 10454.88 0.36518
Total voltage drop= 545.12volts Total power loss = 34.814Kw

129
The curve shown in Fig 5.6 indicates the sharp and non-uniform variations in the node voltages of the feeder. Many reasons are responsible for this unequal node voltage deviations, the non-uniform distribution of load is one out of them. Examining the existing conditions of the feeder, it is observed that the voltages of node number 1 and 2 falls within the acceptable range whereas all the rest of node voltages are out of standard limit. Analyzing the voltage profile of existing system, the severe nature of the power quality problem can be concluded. Under such extremely loaded conditions, both the reliability as well as the efficiency of the distribution system is badly affected. The power curve of Fig 5.7 shows that there is significant power loss at nodes number 1, 2, and 6. Up to node number 21; sharp variations in power loss are recorded. After that, the power loss reduces almost to zero up to node number 38.
Fig 5.6.Voltage profile without and with DG
Fig.5.7.Power loss curve without and with DG In the beginning of the feeder, the large amount of current flow which causes the substantial power losses in initial nodes of the network. Significant reduction in the power losses has been observed at the tail end of the feeder. Both the curves of Fig5.6

130
and Fig 5.7 illustrate the excessive voltage drop and power loss in the initial nodes of the network. 5.6.3 Step 3 In order to bring the voltage drop and power loss within the acceptable limit, the system was simulated again in this algorithm (IDG) for above mentioned two steps. The salient features of this program (IDG) enable us to identify the optimal size, location, and number of DGs in the distribution system. The detailed simulation results as illustrated in Table 5.4, provide two number of DGs (DG1 and DG2) having sizes of 3.722MVA and 2.28MVA, respectively. The program has also determined the optimal placement for DG1 and DG2 at node number 30 and 14, respectively. The analytical and simulation results of IDG algorithm were tested and verified. The detailed study of the results show a remarkable reduction in the voltage drop and power loss as listed in Table 5.5. The voltage profile and the power loss curves for the system having DGs are shown in Fig5.6 and Fig 5.7, respectively. The detailed investigation of voltage profile depicted in Fig 5.6 and the simulation results of Table 5.4 indicate the maximum improvement in node voltages of the feeder. Without IDG algorithm, the voltages of only first two nodes were within permissible limit. Implementation of IDG algorithm changes all nodes voltages to an acceptable range (above 10450 volts). The voltage profile has been smoothened to a great extent as shown in Fig5.6. The voltage drop has been reduced from 21% to 4.9% which is well within the acceptable limit. The net reduction of 16.05% in voltage drop has been achieved. The application of IDG tool also minimizes the power loss from 8% to 0.51%. The total reduction of 7.49% has been observed. After implementing IDG tool the power loss of 83.266kW at node number 1 and 76.178kW at node number 2 has been reduced to 7.09682kW and 5.7545kW, respectively as observed in the power loss curve of Fig5.7. The relevant curve indicates power loss of few kilowatts 23.06846kW) in the first five nodes of the feeder. All the remaining nodes have power loss less than one kilowatt except node number 33 and 34 which have the power loss of 1.112kW and 1.4kW, respectively.
TABLE 5.5 Comparison of Voltage Drop and Power Loss without and with DG
Voltage drop
Voltage drop without DG (V) Voltage drop with DG (V)
Reduction in voltage drop (V)
2326.2862 544.732 1781.5542
Power loss
Power loss without DG (kW) Power loss with
DG (kW) Reduction in power loss
(kW) 605.45 39.732 565.718
It is also noticed that the heavy power loss at nodes number 6 has been reduced from 92.714kW to 4.3827kW which reflects the effectiveness and successfulness of IDG

131
algorithm.10 MVA source has been utilized for the existing feeder. During implementation of IDG tool, the performance of the feeder has been enhanced, while using only two DGs, having the accumulative capacity of 6.002MVA, almost 60.02% of the main source capacity. The analyses illustrate the fact that IDG tool can be implemented successfully to identify the optimal size and location of DG(s) and rectify the problems of voltage drop and power loss of any distribution feeder, having non-uniformly distributed load.
TABLE 5.6 TARIFF WISE NUMBER OF CONSUMERS
S No. Category No. of connection
1 Domestic S/Phase 6667
2 Domestic 3/Phase 100
3 Commercial S/Phase 120
4 Commercial 3/Phase 09
5 Agriculture 3/Phase 07
6 Water supply 15
7 Industrial 30
Total =6948
5.7 Case study 2
In this particular case, IEEE 34 bus test feeder has been taken to verify the results of IDG tool. The single line diagram of IEEE 34 bus radial distribution feeder is depicted in Fig 5.8. The input data is presented in Table 5.7. In order to remove the complexities and to make the analyses more conveniently, the 34 bus test feeder is modified to 19 node system as presented in Fig 5.9. The simplified feeder is almost 60.34 km long, feeding different categories of non-uniformly distributed load at various nodes. The loads connected at different nodes are expressed in amperes. The analyses are completed in following two steps. 5.7.1 Step 1 As mentioned earlier, test feeder comprises of non-uniformly distributed loads. Different simulation techniques are available for analyzing such a complex feeder. In this research work, the simulation is based upon analytical approaches. The current distribution diagram is developed as illustrated in Fig 5.9. The modified feeder diagram is simulated with IDG algorithm for existing load condition without implementing DGs. The elaborative analytical results shown in table 5.8 delineate the actual information regarding the different parameters of modified IEEE 34 bus test feeder. The information includes segment current, voltage drop and power loss under fully loaded situation. The results illustrate high voltage drop (77%) and power loss (40%).

132
Fig 5.8 Single line diagram of IEEE 34 bus system Fig 5.9 Modified single line diagram of IEEE 34 bus system without DG
800 802 806 808
890
812 86858
842
848
888
846
864
832
822
856
852
828
830
850
854
814 824 83826
840
820
818
816
810
844
836
838
862
2.23 A
43.63 A
0A
0 A
3.61 A
0 A
1.05 A
0A
0A
0 A
11.41 A
2.886 A
0.46 A
2.952 A
0.262 A
30.51 A
9.316 A
4.4 A
1.84 A
1 2 3 4 5 6 7 8 9 11 10
12 13 14 15 16 17 1918
Utility Source
0 A
2.23 A

133
The voltage profile and power loss curves without and with DG implementation are shown in Fig 5.10 and 5.12 respectively. Examining the results as depicted in table 5.8, it is observed that voltage at first two nodes is within the IEEE permissible limit (±5%). The voltage at remaining nodes is out of standard limit. The voltage profile without DG implementation also indicates a sharp decline in the nodes voltage toward tail end.
Fig 5.10 Voltage profile curves of modified IEEE 34 node system without and with DG Many reasons are considered to be responsible for such sharp decline in the nodes voltage. The non-uniform distribution of load is one out of many. The detailed investigation of voltage profile without DG implementation concludes the severe nature of power quality problem. Under such extremely loaded conditions, both the reliability and performance of the distribution network is badly affected. Examining the power curve of modified IEEE bus feeder without DG application, as depicted in Fig 5.12, it is observed that there is significant power loss at node number 3, 4, 5 and 12. Power loss reduces almost near to zero toward tail end. The substantial power loss on the initial nodes is because of excessive current flow through the initial nodes of the network. Reduction of current towards the tail end nodes minimizes the power loss at these nodes.

134
Table 5.7 Input Data for modified IEEE 34 bus system
Node Length(Km) R (Ω) X(Ω) Z(Ω)
1 0.7852 0.9431 0.6898 1.1680
2 0.5278 0.6324 0.4625 0.7835
3 9.8150 11.7871 8.6165 14.6000
4 11.4240 13.7082 10.0254 16.9830
5 9.0587 10.8678 7.9481 13.4640
6 0.0016 0.9100 0.1390 0.2354
7 0.0965 0.1133 0.0829 0.1400
8 3.1054 3.7322 2.7296 4.6240
9 0.2574 0.3071 0.2251 0.3810
10 6.2270 7.4719 5.4800 9.2660
11 1.5770 0.1900 0.1390 0.2354
12 11.2150 13.4632 9.8742 16.6960
13 0.0016 0.1900 0.1390 0.2354
14 1.4964 1.7912 1.3137 1.3410
15 1.7700 2.1312 1.5630 2.6430
16 0.6110 0.7384 0.54000 0.9150
17 0.8040 0.9797 0.7185 1.2150
18 0.0852 0.1024 0.0750 0.1230
19 1.4800 1.7689 1.3082 2.2000

135
Fig 5.11 Modified single line diagram of IEEE 34 bus system with DGs 5.7.2 Step 2 IDG algorithm is considered to be the most effective and powerful tool used to eliminate the power quality problems in terms of node voltage profile improvement and loss reduction. IDG tool not only identified the optimal locations for DGs placements but also optimizes the size of DGs, thereby minimizing the overall expenditure incurred on the performance improvement of the distribution system.
3.61 A
0 A
1.05 A
0A
0A
0A
11.41 A
2.886 A
0.46 A
2.952 A
0.262 A
30.51 A
0A
2.23 A
43.63 A
9.316 A
4.4 A
1.84 A
0 A
DG1
DG2
1 2 3 4 5 6 7 8 9 11 10
12 13 14 15 16 17 19 18
Utility source

136
Table 5.8 Existing System analysis for non-uniformly distributed load without DG
Node Segment I(Amp)
Segment Voltage drop(volts)
Node Voltage (volts)
Power loss (kW)
1 114.556 0133.800 10866.20 012.3764
2 110.946 0086.930 10779.27 007.784
3 110.946 1619.812 9159.46 145.090
4 109.896 1866.364 7293.10 165.556
5 109.896 1479.640 5813.46 131.258
6 109.896 0025.720 5787.74 002.295
7 109.896 0015.830 5771.91 001.365
8 098.468 0455.320 5316.59 036.187
9 095.600 0036.424 5280.17 002.810
10 095.140 0881.570 4398.60 067.633
11 092.188 0021.701 4376.90 001.615
12 091.926 1535.164 2841.74 113.770
13 091.926 0021.640 2820.10 001.610
14 061.416 0136.423 2683.68 006.760
15 059.186 0156.430 2527.25 007.470
16 015.556 0014.234 2513.02 000.179
17 006.240 0007.582 2505.44 000.038
18 001.840 0000.234 2505.21 000.0003
19 0 0 2505.21 0
Total Voltage drop=8494.818volts Total Power loss=703.7967kW

137
Table 5.9 Existing System analysis for non-uniformly distributed load with DG
Node Segment I(Amp)
Segment Voltage drop(volts)
Node Voltage (volts) Power loss (W)
1 4.656 05.4400 10994.56 20.4000
2 1.046 00.8300 10993.74 00.7000
3 1.046 15.2720 10978.47 13.0000
4 0.004 00.0700 10978.40 00.0220
5 0.004 00.0540 10978.35 00.0200
6 0.004 00.0009 10978.349 00.0001
7 0.004 00.0006 10978.348 00.0002
8 7.986 36.9300 10941.42 238.000
9 5.1 01.9400 10939.48 08.0000
10 4.64 42.9900 10896.49 161.000
11 1.688 00.4000 10896.09 00.5000
12 1.426 23.8100 10872.28 27.4000
13 1.426 00.3400 10871.94 00.4000
14 29.084 64.6000 10807.34 1515.10
15 31.314 82.7630 10724.57 2090.00
16 15.556 14.2340 10710.34 178.700
17 6.24 07.5820 10702.76 38.1000
18 1.84 00.2340 10702.52 00.3500
19 0 0 10702.52 00.0000
Total voltage drop=297.48volts Total power loss=4.3kW
The analytical and simulation results as presented in the table 3 and 4, identifies the implementation of two DGs (DG1 and DG2) having sizes of 1.379MW at node number 15 and 0.296MW at node number 7 respectively. The net improvement as presented in table 5 expresses remarkable improvement in the node voltage profile improvement and power loss reduction. The voltage profile and power loss curves with the application of DG are presented in Fig 5.10 and 5.12. Without IDG tool, the voltage of only first two nodes is within IEEE acceptable range.

138
Table 5.10
Simulation results for non-uniformly distributed load with DG
Node Segment I(Amp)
Segment Voltage drop(volts)
Node Voltage (volts) Power loss (W)
1 4.656 05.4400 10994.56 20.4000
2 1.046 00.8300 10993.74 00.7000
3 1.046 15.2720 10978.47 13.0000
4 0.004 00.0700 10978.40 00.0220
5 0.004 00.0540 10978.35 00.0200
6 0.004 00.0009 10978.349 00.0001
7 0.004 00.0006 10978.348 00.0002
8 7.986 36.9300 10941.42 238.000
9 5.1 01.9400 10939.48 08.0000
10 4.64 42.9900 10896.49 161.000
11 1.688 00.4000 10896.09 00.5000
12 1.426 23.8100 10872.28 27.4000
13 1.426 00.3400 10871.94 00.4000
14 29.084 64.6000 10807.34 1515.10
15 31.314 82.7630 10724.57 2090.00
16 15.556 14.2340 10710.34 178.700
17 6.24 07.5820 10702.76 38.1000
18 1.84 00.2340 10702.52 00.3500
19 0 0 10702.52 00.0000
Total voltage drop=297.48volts Total power loss=4.3kW
IDG tool successively improves all nodes voltage to permissible limit. The voltage profile has been smoothened significantly. The voltage drop has been reduced from 8494.82volts to 297.4805volts, indicating a remarkable achievement. The net improvement of 74.52% in node voltage profile expresses the effectiveness of IDG algorithm. Application of IDG tool reduces power loss from 703.7967 kW to 4.3 kW, showing almost 40% saving in power. The power curves of Fig 5.12 indicate the power loss of few kilowatts only at nodes number 14 and 15.

139
Table 5.11
Comparison of Voltage Drop and Power Loss without and with DG
Fig 5.12 Power loss curves of modified IEEE 34 node system without and with DG All the rest of nodes have negligible power loss. During the simulation, it is observed that heavy power losses at node number 3, 4, 5 and 12 have been reduced from 145.09, 165.556, 131.258 and 113.77kW to 0.013, 0.022, 0.00002 and 0.0274kW respectively. The size of DGs is also optimized effectively; the accumulative capacity of 1.675MV (83.75% of the main source) .Through investigation delineates that IDG tool can be applied to enhance the power quality of any distribution feeder with uniformly or non- uniformly distributed load, having low power factor with single as well as multi-DGs.
Voltage drop
Voltage drop without DG (V)
Voltage drop with DG (V)
Reduction in voltage drop (V)
8494.818 297.4805 8197.34
Power loss
Power loss without DG (kW)
Power loss with DG (kW)
Reduction in power loss (kW)
703.7967 4.3 699.4967

140
5.8 Case study 3
12.5 kV feeder of reference paper has been simulated in IDG algorithm. The single line diagram is depicted in Fig 5.13.The feeder comprises of 11 nodes. The input data is presented in Table 5.12. The node to node distance is 2.5km. The total length of 11 node network is 27.5km. The resistance (R) and reactance (X) of each segment is o.538Ω and 0.4626Ω respectively. The impedance (Z) for each feeder segment can be computed as 0.709Ω. The feeder consists of two types of loads (uniformly distributed and non- uniformly distributed loads). The feeder analysis is carried out in following steps.
Table 5.12 Input data for 11 nodes 12.5kv system
Node Length(km) R (Ω) X(Ω) Z(Ω)
1 2.5 0.538 0.4626 0.709
2 2.5 0.538 0.4626 0.709
3 2.5 0.538 0.4626 0.709
4 2.5 0.538 0.4626 0.709
5 2.5 0.538 0.4626 0.709
6 2.5 0.538 0.4626 0.709
7 2.5 0.538 0.4626 0.709
8 2.5 0.538 0.4626 0.709
9 2.5 0.538 0.4626 0.709
10 2.5 0.538 0.4626 0.709
11 2.5 0.538 0.4626 0.709
The single line diagram as illustrated in Fig 5.13 is simulated in “C” language for uniformly distributed load of 0.5MW at each node without implementation of DG. The analyses are completed for existing load which is uniformly distributed. Using analytical approach, various parameters including segment current and voltage drop, node voltage and power loss are calculated as shown in Table 5.13. According to IEEE
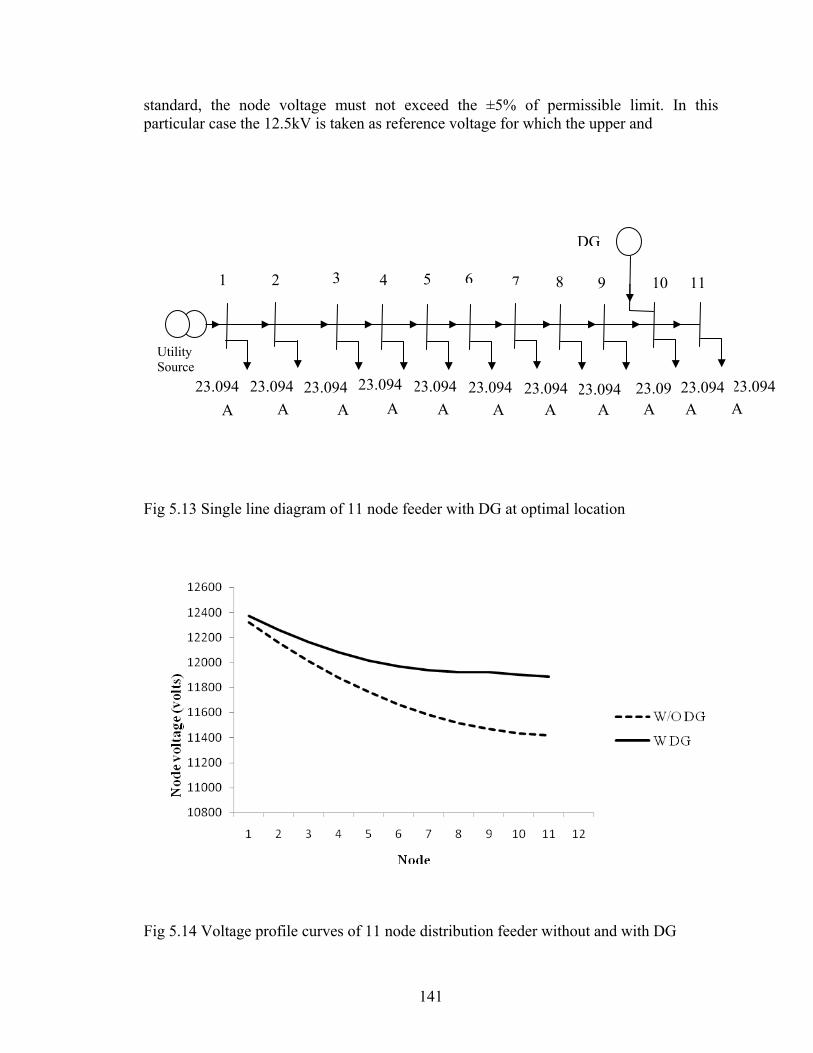
141
standard, the node voltage must not exceed the ±5% of permissible limit. In this particular case the 12.5kV is taken as reference voltage for which the upper and Fig 5.13 Single line diagram of 11 node feeder with DG at optimal location
Fig 5.14 Voltage profile curves of 11 node distribution feeder without and with DG
2 1 3 4 5 6 7 8 9 10 11
DG
23.094
A23.09A
23.094A
23.094 A
23.094A
23.094
A
23.094
A
23.094
A
23.094
A
23.094
A
23.094
A
Utility Source
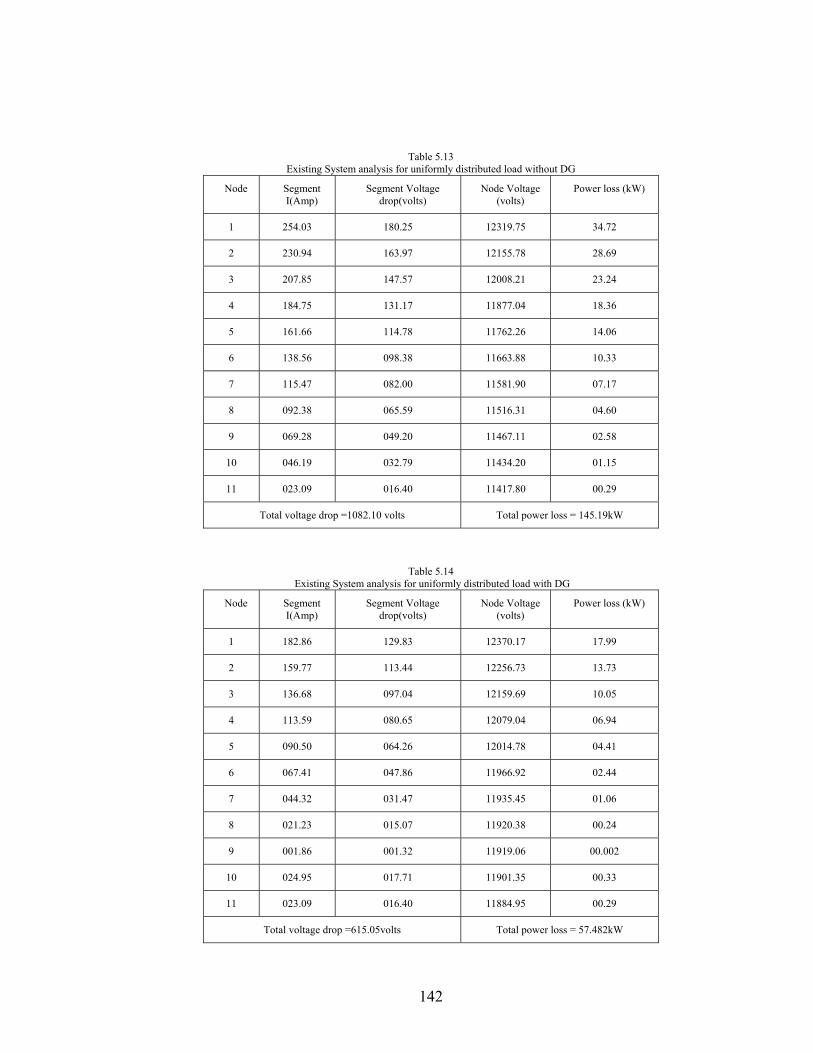
142
Table 5.13 Existing System analysis for uniformly distributed load without DG
Node Segment I(Amp)
Segment Voltage drop(volts)
Node Voltage (volts)
Power loss (kW)
1 254.03 180.25 12319.75 34.72
2 230.94 163.97 12155.78 28.69
3 207.85 147.57 12008.21 23.24
4 184.75 131.17 11877.04 18.36
5 161.66 114.78 11762.26 14.06
6 138.56 098.38 11663.88 10.33
7 115.47 082.00 11581.90 07.17
8 092.38 065.59 11516.31 04.60
9 069.28 049.20 11467.11 02.58
10 046.19 032.79 11434.20 01.15
11 023.09 016.40 11417.80 00.29
Total voltage drop =1082.10 volts Total power loss = 145.19kW
Table 5.14 Existing System analysis for uniformly distributed load with DG
Node Segment I(Amp)
Segment Voltage drop(volts)
Node Voltage (volts)
Power loss (kW)
1 182.86 129.83 12370.17 17.99
2 159.77 113.44 12256.73 13.73
3 136.68 097.04 12159.69 10.05
4 113.59 080.65 12079.04 06.94
5 090.50 064.26 12014.78 04.41
6 067.41 047.86 11966.92 02.44
7 044.32 031.47 11935.45 01.06
8 021.23 015.07 11920.38 00.24
9 001.86 001.32 11919.06 00.002
10 024.95 017.71 11901.35 00.33
11 023.09 016.40 11884.95 00.29
Total voltage drop =615.05volts Total power loss = 57.482kW

143
Table 5.15 Simulation Results for uniformly distributed load with DG
Node Segment I(A) Segment Voltage drop(volts)
Node Voltage (volts)
Power loss (Kw)
1 183.85 130.446 12369.55 18.184
2 160.75 114.059 12255.49 13.902
3 137.66 097.673 12157.82 10.194
4 114.56 081.287 12076.53 07.061
5 091.47 064.901 12011.63 04.501
6 068.38 048.515 11963.12 02.515
7 045.28 032.129 11930.99 01.103
8 022.19 015.743 11915.25 00.264
9 000.91 000.643 11914.60 00.0004
10 024.00 017.029 11897.57 00.309
11 23.09 016.386 11881.19 00.286
Total Voltage drop= 618.8128volts Total Power loss=58.324kW
Fig 5.15 Power loss curves of 11 node distribution feeder without and with DG

144
Table 5.16 Comparison of Voltage Drop and Power Loss without and with DG for 11 node system
According to IEEE standard, the node voltage must not exceed the ±5% of permissible limit. In this particular case the 12.5kV is taken as reference voltage for which the upper and lower voltage limits 13.125kV and 11.875kV respectively. The detailed analysis show total voltage drop of 1082.10 volts and power loss of145.19kW. The voltage profile curve of Fig 5.14 and the results of Table 5.13 delineates that voltage of only first four nodes (from node no 1 to 4) are within IEEE acceptable limits. The voltage at remaining nodes is out of specified limit and continuously reducing to tail end nodes due to uniformly distributed load. Implementing IDG algorithm, the feeder is simulated again with DG and the results are extracted as illustrated in table 4. These results are verified analytically as presented in Table 5.14. The IDG algorithm successfully computed the optimal placement of DG at node no10. In the reference paper, the size of DG utilized is 5.5MW located at node no 6. IDG algorithm optimizes the size of DG to 1.54MW, not more than the size of utility main grid. Detailed investigation of results expresses that the voltage at all nodes is within standard range and total voltage drop reduces from 1082.10 volts to 618.8128 volts which is well within IEEE permissible limit. The power loss reduces from 145.19kW to 58.324kW, expressing remarkable reduction. The graphical illustrations of power loss reduction without and with DG are shown in Fig 5.15. Table 5.16 gives the details comparison of results without and with DG. Investigations of simulation results show the
Voltage drop
Voltage drop without DG (V)
Voltage drop with DG (V)
Reduction in voltage drop (V)
1082.10 618.8128 463.2872
Power loss
Power loss without DG (kW)
Power loss with DG (kW)
Reduction in power loss (kW)
145.19 58.324 86.866
DG Size
Reference number[52] IDG Tool Saving
5.5MW 1.54MW 3.96MW
145
effectiveness of IDG algorithm. It not only optimizes the size of DG but also resolves the problem of power quality in term of nodes voltage drop and power loss.
5.9 New Islanding Detection Algorithm (NIDA)
Many techniques have been presented to monitor the islanding. The most direct method is to supervise the auxiliary contacts of all circuit breakers on the utility system between its main source of generation and the DG units. When switching operation or any short circuit fault causes the loss of utility network, a transfer trip or relay scheme can be employed to open the inter-tie links sub-system. The concept of this direct method is easy to grasp, but difficult to implement due to comprehensive monitoring system. Techniques utilizing measurements of dispersed generating units to detect the loss of utility supply have been also proposed. These techniques can be divided into three categories: active methods, passive methods and other methods. Most of these methods work well for large number of load cases but when tested by applying a particular worst case tested circuit in order to simulate the power island, some special load cases can always be identified under which the particular methods fail to detect the power island. By a designated control circuit, a central concept of active method is to breed small variations in the outputs of dispersed generators. When the utility’s main source remains connected with the load, this deviation is relatively insufficient to trip the protective relays. However, once the loss of grid occurs, this designated deviation will enlarge to activate the relays, which signal the occurrence of islanding. The passive methods are based upon the measurements of power system parameters, such as voltage, frequency, current and phase displacement. The idea of this technique lies in the facts that the loss of main will result in the variations of the system parameters. Therefore, by monitoring variations of these parameters, it can sense abnormal operations of dispersed generating units [13]. Other methods employ different techniques used for islanding detection other than active and passive methods. These techniques include reactance insertion, power line carrier communication (PLCC) and supervisory control and data acquisition (SCADA). The literature research of the past indicates the different control techniques used to detect the phenomena of islanding. Majority of these techniques are based upon the assumptions of unity power factor and uniformly distributed loads. The types of loads and their distribution (uniform/non uniform) in the distribution networks greatly determine the behavior of the distribution system. During the simulation it has been observed that mostly the variations in these parameters are too small to detect the phenomena of islanding. Due to one or other reason when there is sudden collapse on utility grid, system restoration takes considerable time. However, even if a part of distribution system remains in service along with DG, supplying a portion of distribution network is termed as micro grid. Formation of micro

146
grid as a result of islanding process can be due to disturbances, such as fault and its subsequent switching [121].
In view of the above, the corrective action under such situation has to be instantaneous and drastic to arrest the system from total failure. The detailed review of literature reflects that in majority of cases some unrealistic assumptions are usually adopted to make the models more manageable. However, much computational work is to be faced in the real world of electric power distribution system challenges. The detailed review of literature reflects that many algorithms have been developed for islanding detection of distribution feeders. Shyh-Jier Huang and Fu-Sheng Pai have designed an algorithm, based on the self-commutated static power converters [13]. The computational procedure involves the sampling of input data including the input voltage and current for each branch and the variations in the frequency and power. During the occurrence of the islanding, the changes in the frequency and power are compared with their predetermined threshold values. The incorrect selection of threshold values may prolong the computational time, causing adverse effect on the results. Thorough investigation of the algorithm further delineates the difficulties involved during its implementation for distribution system having more than one DG. In majority of cases, DG(s) are designed to operate at unity power factor. It has been observed practically that the islanding detection techniques which are frequency dependent may not be operated effectively when DG is designed with unity power factor [77]. Keeping in view all of above mentioned problems, a new islanding detection algorithm (NIDA) has been designed for radial distribution feeder of electric power distribution system based upon the node voltage profile improvement and power loss reduction. It can be implemented for islanding detection of radial distribution feeder under uniform and non uniform loads and with power factor other than the unity, operating in multi-DG scenario. The algorithm is incorporated with distribution feeder whose performance has been enhanced by the implementation of DG(s) having optimal sizes and locations. According to IEEE standards, the voltage magnitude of all nodes of distribution feeder is ±5% of the rated value [31]. In normal operation of the feeder all the node voltages are within the acceptable standard limit. The proposed algorithm has the capability to detect the islanding condition during any fault on the utility main grid. The peculiarity of the algorithm lies in its successful operation with distribution network functioning under multi-GD scenario. The distribution feeder is operating in multi-DG scenario having all node voltages within the feasible range. Whenever the fault occurs anywhere on the utility main grid, the algorithm isolates the particular portion of the feeder forming a micro-grid. It starts calculating the voltage drop and power loss from the last active node to 1st DG. If voltage drop and power loss are not within the acceptable range, it start branching automatically by reducing one node from last active node while keeping constant check on the values of node voltages and power loss till all values are in the range of acceptable limit. However, if all node voltages are not within the recommended range, 2nd DG starts picking the load from the last normalized node of DG1 and start checking the range of node voltages lying in its island. Anyhow, If all the

147
node voltages of islanded portion of the feeder are within the permissible limit and branching has been executed, then it calculates different parameter values including, the node voltage ,segment current, segment voltage drop, power loss, power factor and frequency at each node. If all the node voltages are within the standard limits without any branching, then in order to utilize maximum capacity of DGs, it start one step backward from its location, normalizing back nodes while keeping check on its optimal capacity until it reaches its optimal range or the break (fault) point. In this manner it completes the islanding formation successfully. We can either save the calculated values of different parameters in the data file or print the results according to the need and requirement. It is worth mentioning that no curtailment of load is executed when the capacity of DG is equal to the islanded load. The flowchart diagram for NIDA has been depicted in Fig 5.16.
5.10 Salient Features of the NIDA
The important features of NIDA can be enumerated as under. During the implementation of NIDA, the initial values including reference voltage, number of nodes, DG(s) capacities and locations and breakpoints are provided by the user. Data regarding feeder including the segment length, and load current is incorporated through data file. It can form the island(s) automatically, starting from the last active node. NIDA is capable to operate in multi-DG scenarios. It has the capability to detect and form islanding with varying power factor (other than unity). It can perform the functions successfully under uniform and non-uniform load condition. DG(s) can be utilized to their optimal ratings. Automatically it can calculate the various parameters like segment current, segment resistance, inductance, inductive reactance, impedance, segment voltage drop, node voltage, power factor, frequency, and power loss at each node. During its implementation, it keeps the node voltages and power loss within the permissible limits. Branching (load curtailment) can be implemented while keeping the optimal ratings of DG(s). No deterioration of power quality in terms of node voltage drop and power loss occurs during the islanding formation. After viewing the out put on the screen, the user has the option to save the output in a file, which can later on be used to create graphs and other analysis. Tool has been designed in C-language, using modular programming approach, enabling an efficient enhancement / alteration as and when required.
5.11 Case Study 4
The electric power distribution system is considered a vital part of the electric power supply system since it is the link between bulk transmission system and the customers. The current practice in the distribution system is either disconnecting all DGs when fault occurs or to implement an islanding detection algorithm that detects islanding situation and initiates DG disconnection from utility main source. However, in the present deregulated and competitive environment, it becomes very essential for electric utilities to provide uninterruptible power supply with high degree of improved power quality in terms of node voltage profile improvement and power loss reduction.

148

149
Branched ?
Step back 1 node from 2nd
DG
All in Range & No Break
Node VoltageSeg CurrentFrequency
Power FactorPower Loss
Save to File Data File
End
N
Y
Y
N
Y
N
Fig 5.16 Flow Chart diagram for new islanding detection algorithm (NIDA) with Multi-DG Scenarios

150
In this particular case, 11kV, Panian radial distribution feeder of Haripur subdivision Peshawar Electricity Supply Corporation (PESCO) Pakistan has been selected as a case study. It is 98.9km long and emanates from 132kV Haripur grid station. The feeder comprises of 168 numbers of nodes, feeding different categories of loads including residential, agricultural, commercial and industrial. The total numbers of customers connected are 6948. The analysis has been completed in following three steps. 5.11.1 Step 1 The feeder data is collected through actual field survey and by visiting the concerned office as listed in Table 5.1. Based upon the information gathered; a single line diagram is developed as illustrated in Fig. 5.4. It comprises of 132 numbers of transformers of different ratings including 200kVA, 100kVA, 50kVA, and 25kVA. For convenience, the radial distribution feeder is divided into various segments. Mostly, the non uniform loads are connected to each node. The length of feeder segments and load (in amperes) connected to node is extracted from the single line diagram. The resistance, reactance (inductive), impedance, and power factor for each segment are measured through the implementation of NIDA. Keeping in view the complex nature of feeder, 168 nodes radial distribution feeder is modified to 38 nodes by adding the loads of laterals and sub-laterals to subsequent nodes as illustrated in Fig. 5.5. However, practically it has been noticed that it does not affect the analysis of the feeder. So the length of the feeder is reduced to 20.79km. Consequently the capacitance and inductance of each feeder segment is neglected due to its shorter length. 5.11.2 Step 2 As mentioned earlier, the feeder mainly comprises of non-uniformly distributed loads. The feeder is tested against some pre-determined planning criteria as a minimum requirement. That ensures the distribution system design to meet specified standard guidelines for distribution system. The IEEE standards allow only ±5% variations in voltage magnitude of rated values at all nodes of distribution feeder [28]. In these analyses 11kV has been chosen as grid voltage for which the feeder voltage must not exceed the maximum (11.550kV) and minimum (10.450kV) permissible values at each node. In this case, the analysis is carried out through the simulation, based on analytical approaches. Using DG, the voltage drop and power loss values are calculated as illustrated in the Table 5.3. The results of Table 5.3 are verified through a new islanding detection algorithm (NIDA) developed in C language as shown in Table 5.4. The detailed simulation results provide two number of DGS (DG1 and DG2), having optimal sizes of 3.722MVA and 2.28MVA respectively. The NIDA is also capable of identifying the optimal location of DGs (DG1 at node number 30 and DG2 at node number 14).The voltage profile and power loss curves for existing system with DG are presented in Fig. 5.17 and 5.18 respectively. The detailed investigation of voltage profile of Fig.5.17 and

151
simulation results of Table 5.4 indicates the maximum improvement in the nodes voltage of the feeder. The maximum voltage drop of 69.8V, 61.583V, 30.783V, 25.942V, 63.968V, 24.379V, 24.09V, and 30.998V has been observed at node number 1, 2, 3, 5, 6, 9, 33, and 34 respectively. The irregular variations in the voltage drop are mostly because of non-uniform distribution of load on the feeder. Usually, due to increase in the length of the feeder, the voltage drop increases drastically at the tail end customers. However in these analyses, the minimum voltage at last node is 10.4548kV which is well within the minimum permissible limit of 10.450kV, indicating that the NIDA has the capability to grasp the conflicting nature of non-uniform load which mainly causes the power quality problems.
10400
10500
10600
10700
10800
10900
11000
11100
11200
11300
11400
11500
1 4 7 10 13 16 19 22 25 28 31 34 37
Node
Voltage (v)
Fig 5.17 Voltage profile for existing system with DGs
‐10
‐5
0
5
10
15
20
1 3 5 7 9 11 13 15 17 19 21 23 25 27 29 31 33 35 37Node
Power Loss (KW
)
Fig 5.18 Power loss curve for existing system with DGs

152
Simulation results of Table 5.4 and the power loss curve of Fig 5.18 show the maximum power loss of 7.09682kW, 5.3827kW, 2.65444kW, 1.295kW, 1.885kW, and 4.3827kW at first six nodes respectively. Whereas, power loss is less than one kilowatt at all the remaining nodes except at node number 9, 33 and 34 which is 1.44288kW, 1.112315kW and 1.39968kW respectively. The comparative increase in power loss at initial nodes is due to the flow of large current through initial nodes. As the value of current reduces toward the end nodes, the power loss also reduces. 5.11.3 Step 3 The system is functioning with multi-DG scenario (two DGs 1and 2 located at node number 30 and 14). It is assumed that the break point (fault) occurred anywhere between the utility main grid and DGs, say at node number 11. The utility main grid is totally cut off at node number 11. Under such circumstances, two possible islanding formations can occur, which are described as below. The break point occurs anywhere in between DG1 and DG2, say at node number 15. In such situation, NIDA detects the break point and starts calculating voltage drop and power loss from last active node to 1st DG. If voltage drop and power loss are not within the acceptable range, it starts branching automatically by reducing one node from last active node and successively checks the values of voltage drop and power loss till all the values are in standard limits. In this particular case, DG1 starts calculating voltage and power loss from last active node number 38 till it reaches to node number 22. Behind node number 22 DG1 is unable to pick the load connected to next node (21), as it exceeds the maximum capacity of DG1. Thus islanding is completed successfully from node number 38 to 22. It is worth mentioning that NIDA is capable of forming and detecting islanding in which all node voltages and power loss are within IEEE acceptable range. DG1 is capable of providing uninterruptible power supply according to its rated capacity to those loads which are situated in the island. Simulation results for single DG scenario are presented in Table 5.17. DG1 is installed at node number 30 and the values of maximum voltage drops are 31.106V, 24.172V, 14.433V, 12.980V, 11.418V, and 10.309V at node number 34, 33, 36, 31, 38, and 29.The irregular deviation in the voltage drop is mainly due to non-uniform distribution of load. The voltage profile curve of Fig 5.19 and the simulation results of Table 5.17 show that the maximum node voltage is 11kV at node number 30 and minimum node voltage is 10.89166kV at node number 38. These values are in the range of maximum (11.550kV) and minimum (10.450kV) IEEE standard limits. The maximum power loss 1.40942kW and 1.11988kW occurs at node number 34 and 33 as depicted in power loss curve of Fig 5.21. The power loss at all remaining nodes is less than one kilowatt. These results present the effectiveness of NIDA for radial distribution feeder operating with non-uniformly distributed load at power factor other than unity.

153
10400
10500
10600
10700
10800
10900
11000
11100
11200
11300
11400
11500
22 23 24 25 26 27 28 29 30 31 32 33 34 35 36 37 38
Node
Voltage (v)
Fig 5.19 Voltage profile for islanding detection with single DG scenario
TABLE 5.17 ISLANDING WITH SINGLE DG AT NODE NO.30
S.No .I (Amp.) Vd (volts) Node voltage
(volts) P loss (Watts)
22 32.16 4.846 10954.39 122.17 23 37.46 2.419 10956.81 71.04 24 40.06 9.831 10966.64 308.72 25 42.66 4.592 10971.23 153.55 26 47.96 3.097 10974.33 116.45 27 50.56 5.442 10979.77 215.69 28 51.86 4.465 10984.24 181.54 29 59.86 10.309 10994.55 483.73 30 70.36 5.453 11000.00 300.74 31 67.00 12.980 10987.02 681.77 32 61.70 6.641 10980.38 321.21 33 59.10 24.172 10956.21 1119.88 34 57.80 31.106 10925.10 1409.42 35 47.30 3.055 10922.05 113.26 36 44.70 14.433 10907.61 505.77 37 42.10 4.531 10903.08 149.55 38 40.80 11.418 10891.66 365.18
It is assumed that the breakpoint occurs anywhere prior to node number 14 and the utility main grid, says at node number 12. The NIDA starts calculating the voltage drop and the power loss from last active node to 1st DG (from node number 38 to 30). If all node voltages and power loss are within the IEEE permissible limits, it continues picking the loads of next nodes till it reaches to its maximum capacity. Anyhow, if the values of voltage drop and power loss are not within the acceptable limits, it starts branching automatically by reducing one node from the last active node and kept on checking the values of voltage drop and power loss till all the values are in standard limits. However, if all nodes voltages are not within the acceptable range, 2nd DG starts picking the load from the last normalized node of the 1st DG (node number 23) accommodating for its

154
accumulative capacity and starts checking the range of node voltages lying in its island. If all of the node voltages of the isolated (Islanding) region are in the range of IEEE standard and branching has been executed, then it calculates different parameter values including, node voltage, segment current, segment voltage drop, power loss, power factor and frequency at each node.
Fig5.20. Islanding formation with single and multi-DG scenarios However, if all node voltages are in the acceptable range without any branching, then in order to utilize the maximum capacity of DGs (1and 2), it starts one step backward from its location, normalizing back nodes while keeping checks on its optimal capacity until and unless it reaches the maximum capacity or the break (fault) point (node number13). The process of Islanding formation and detection for single and multi-DG scenario is illustrated in the Fig5.20.The simulation results are depicted in Table 5.18. The elaborative study of the results indicates the maximum voltage drop of 31.166V, 24.172V, 14.433V, 12.980V, 11.956V, and 11.418V, at node number 34, 33, 36, 31, 15 and 38. The detailed study of the results delineates that all the node voltages are within IEEE standard limits.
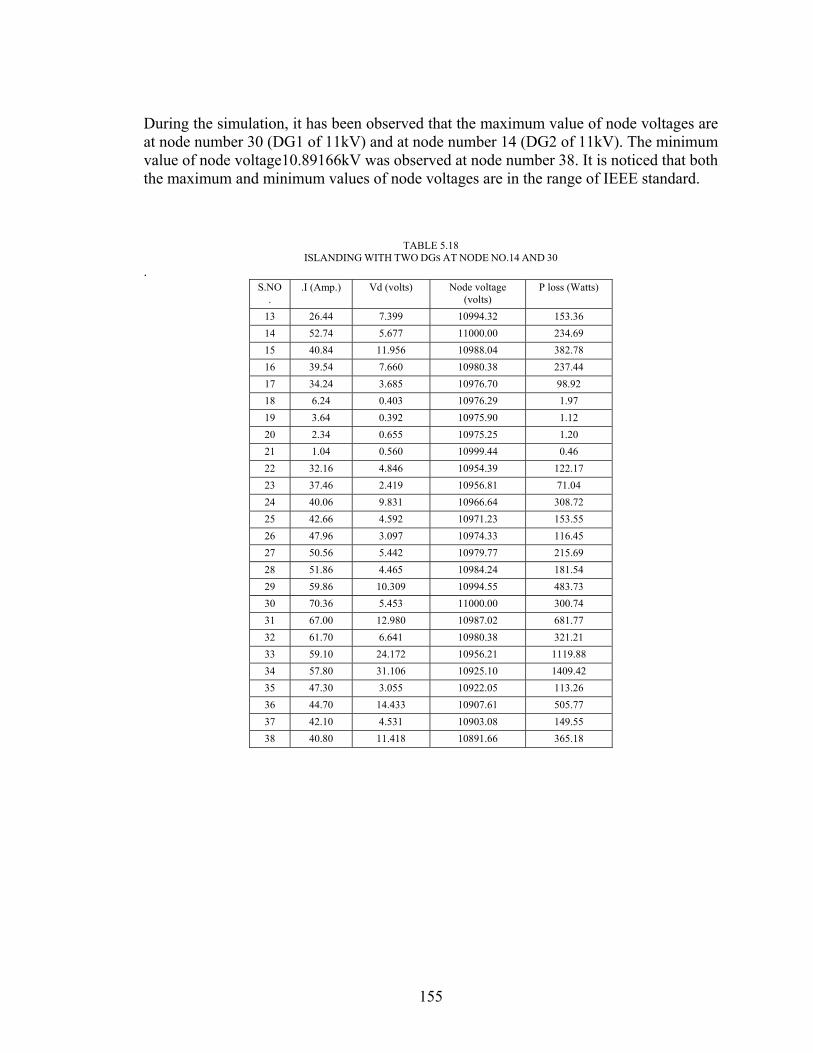
155
During the simulation, it has been observed that the maximum value of node voltages are at node number 30 (DG1 of 11kV) and at node number 14 (DG2 of 11kV). The minimum value of node voltage10.89166kV was observed at node number 38. It is noticed that both the maximum and minimum values of node voltages are in the range of IEEE standard.
TABLE 5.18 ISLANDING WITH TWO DGS AT NODE NO.14 AND 30
. S.NO
. .I (Amp.) Vd (volts) Node voltage
(volts) P loss (Watts)
13 26.44 7.399 10994.32 153.36
14 52.74 5.677 11000.00 234.69
15 40.84 11.956 10988.04 382.78
16 39.54 7.660 10980.38 237.44
17 34.24 3.685 10976.70 98.92
18 6.24 0.403 10976.29 1.97
19 3.64 0.392 10975.90 1.12
20 2.34 0.655 10975.25 1.20
21 1.04 0.560 10999.44 0.46
22 32.16 4.846 10954.39 122.17
23 37.46 2.419 10956.81 71.04
24 40.06 9.831 10966.64 308.72
25 42.66 4.592 10971.23 153.55
26 47.96 3.097 10974.33 116.45
27 50.56 5.442 10979.77 215.69
28 51.86 4.465 10984.24 181.54
29 59.86 10.309 10994.55 483.73
30 70.36 5.453 11000.00 300.74
31 67.00 12.980 10987.02 681.77
32 61.70 6.641 10980.38 321.21
33 59.10 24.172 10956.21 1119.88
34 57.80 31.106 10925.10 1409.42
35 47.30 3.055 10922.05 113.26
36 44.70 14.433 10907.61 505.77
37 42.10 4.531 10903.08 149.55
38 40.80 11.418 10891.66 365.18

156
‐50
50
150
250
350
450
550
650
750
850
950
1050
1150
1250
1350
1450
1550
22 23 24 25 26 27 28 29 30 31 32 33 34 35 36 37 38
Node
Power Loss (W)
Fig 5.21 Power loss curve for islanding detection with single DG scenario
10820
10840
10860
10880
10900
10920
10940
10960
10980
11000
11020
13 14 15 16 17 18 19 20 21 22 23 24 25 26 27 28 29 30 31 32 33 34 35 36 37 38
Node
Voltage (v)
Fig 5.22 Voltage profile for islanding detection with multi- DG scenario
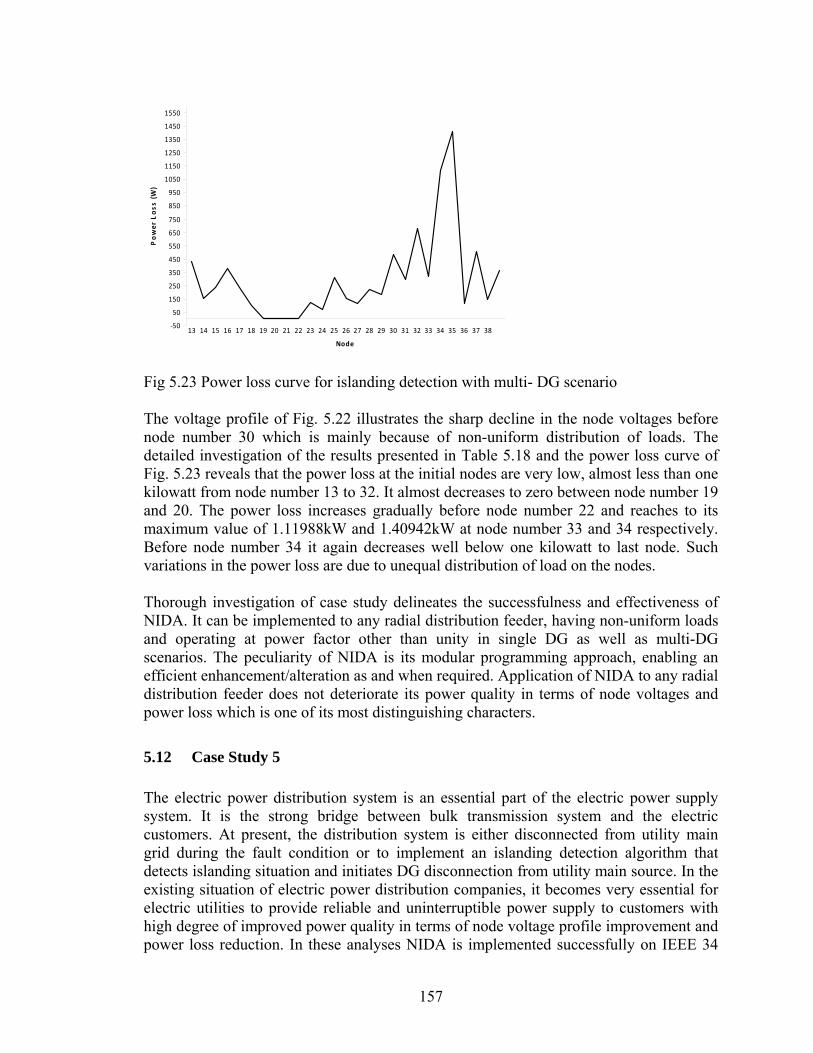
157
‐50
50
150
250
350
450
550
650
750
850
950
1050
1150
1250
1350
1450
1550
13 14 15 16 17 18 19 20 21 22 23 24 25 26 27 28 29 30 31 32 33 34 35 36 37 38
Node
Power Loss (W)
Fig 5.23 Power loss curve for islanding detection with multi- DG scenario The voltage profile of Fig. 5.22 illustrates the sharp decline in the node voltages before node number 30 which is mainly because of non-uniform distribution of loads. The detailed investigation of the results presented in Table 5.18 and the power loss curve of Fig. 5.23 reveals that the power loss at the initial nodes are very low, almost less than one kilowatt from node number 13 to 32. It almost decreases to zero between node number 19 and 20. The power loss increases gradually before node number 22 and reaches to its maximum value of 1.11988kW and 1.40942kW at node number 33 and 34 respectively. Before node number 34 it again decreases well below one kilowatt to last node. Such variations in the power loss are due to unequal distribution of load on the nodes. Thorough investigation of case study delineates the successfulness and effectiveness of NIDA. It can be implemented to any radial distribution feeder, having non-uniform loads and operating at power factor other than unity in single DG as well as multi-DG scenarios. The peculiarity of NIDA is its modular programming approach, enabling an efficient enhancement/alteration as and when required. Application of NIDA to any radial distribution feeder does not deteriorate its power quality in terms of node voltages and power loss which is one of its most distinguishing characters.
5.12 Case Study 5
The electric power distribution system is an essential part of the electric power supply system. It is the strong bridge between bulk transmission system and the electric customers. At present, the distribution system is either disconnected from utility main grid during the fault condition or to implement an islanding detection algorithm that detects islanding situation and initiates DG disconnection from utility main source. In the existing situation of electric power distribution companies, it becomes very essential for electric utilities to provide reliable and uninterruptible power supply to customers with high degree of improved power quality in terms of node voltage profile improvement and power loss reduction. In these analyses NIDA is implemented successfully on IEEE 34

158
bus radial distribution feeder having non- uniformly distributed load. The analysis has been completed through following steps. 5.12.1 Step 1 The input data is prepared according to the needs and requirements of NIDA design. The length of feeder segment and loads (in amperes) connected to each node are extracted from the single line diagram of IEEE test feeder. The different parameters of test feeder are enumerated through the implementation of NIDA. In order to avoid the complexities and make the analyses more convenient, IEEE test feeder is modified to 19 nodes system, as depicted in the Fig 5.9. The feeder mainly comprises of non-uniformly distributed loads. NIDA is capable of detecting islanding phenomena which may be intentional or unintentional. During the islanding process, NIDA keeps the power loss and nodes voltage within IEEE permissible limits (±5%). During the analyses of IEEE 34 node system, it is observed that NIDA can detect the islanding formation with the implementation of two DGs, having optimal sizes of 1.379MW and 0.296MW at optimal locations (DG1 at node number15 and DG2 at node number 7). When fault occurs anywhere between DGs and utility source, then two possible islanding formations can occur as identified by NIDA. In these analyses 11kV has been selected as grid voltage for which the feeder voltage must not exceed the maximum (11.550kV) and minimum (10.450kV) permissible values at each node. 5.12.2 Step 2 The implementation of NIDA on IEEE 34 bus radial distribution system identify the operation of two DGs of optimal sizes and placements as mentioned in step 1. The modified single line diagram of IEEE 34 bus system with DG 1 at node 15 and DG 2 at node 7 shown in Fig 5.11.It is assumed that the fault occurred any where between the utility main grid and DGs. Under such circumstances, two possible islanding formations can occur, which are explained as below.
1. Islanding with single DG (DG1 at node number 15)
The moment the fault occurs any where in between DG1 and DG2, NIDA detects the fault and starts calculating voltage drop and power loss from last active node to 1st DG. If voltage drop and power loss are not within the IEEE permissible limit, it starts branching automatically by reducing one node from last active node and successively checks the values of voltage drop and power loss till all the values are in standard limit. In this particular case, DG1 starts calculating voltage and power loss from last active node number 19 till it reaches to node number 14. Prior to node number 14 DG1 is unable to pick the load connected to next node (13), as it exceeds the maximum capacity of DG1. Thus islanding is completed successfully from node number 19 to 14. It is worth mentioning that NIDA is capable of forming and detecting islanding in which all node voltages and power loss are within standard acceptable range. DG1 is capable of

159
Table 5.19 Islanding with single DG at node number 15
Node Segment I(Amp)
Segment Voltage drop(volts)
Node Voltage (volts)
Power loss (W)
14 29.084 64.6000 10917.24 1515.10
15 31.314 82.7630 11000 2090.00
16 15.556 14.2340 10985.77 178.700
17 6.24 07.5820 10978.19 38.1000
18 1.84 00.2340 10977.96 00.3500
19 0 0 10976.96 00.0000
Fig 5.24 Voltage profile for islanding detection of IEEE 34 bus system with single DG scenario

160
Fig 5.25 Power loss curve for islanding detection of IEEE 34 bus system with single DG scenario providing uninterruptible power supply according to its rated capacity to those loads which are situated in the island. Simulation results for single DG scenario are presented in Table 5.19. DG1 is installed at node number 15 and the values of maximum voltage drops are 82.763V, 64.60V, 14.234V and 7.582V, at node number 15, 14, 16, and 17. The irregular deviation in the voltage drop is mainly due to non-uniform distribution of load. The voltage profile of Fig. 5.24 and the simulation results of Table 5.19 show that the maximum node voltage is 11kV at node number 15 and minimum node voltage is 10.91724kV at node number 14. These values are well within the range of maximum (11.550kV) and minimum (10.450kV) IEEE standard limits. The maximum power loss 2.09kW and 1.5151kW occurs at node number 15 and 14. The power loss at all remaining nodes is less than one kilowatt as depicted in Fig 5.25. These results present the effectiveness of NIDA for IEEE 34 bus radial distribution feeder operating with non-uniformly distributed load at none unity power factor.
1. Islanding with Multi-DG scenario (DG1 at node 15 and DG2 at node 7)
In this particular case, the distribution feeder is functioning under multi DG scenario. Whenever, fault occurs any where between utility main grid and DGs, say behind node number 7.

161
Table 5.20 Islanding with two DGs at node number 7 and 15
Node Segment I(Amp)
Segment Voltage drop(volts)
Node Voltage (volts)
Power loss (W)
7 0.004 00.0006 11000 00.0002
8 7.986 36.9300 10963.07 238.000
9 5.1 01.9400 10961.13 08.0000
10 4.64 42.9900 10918.14 161.000
11 1.688 00.4000 10917.74 00.5000
12 1.426 23.8100 10893.93 27.4000
13 1.426 00.3400 10893.59 00.4000
14 29.084 64.6000 10917.24 1515.10
15 31.314 82.7630 11000 2090.00
16 15.556 14.2340 10985.77 178.700
17 6.24 07.5820 10978.19 38.1000
18 1.84 00.2340 10977.96 00.3500
19 0 0 10976.96 00.0000
The NIDA starts calculating the voltage drop and the power loss from last active node to 1st DG (from node number 19 to 15). If all nodes voltage and power losses are within the IEEE permissible limits, it continues picking the loads of next nodes till it reaches to its maximum capacity. However, if the values of voltage drop and power loss are not within the acceptable limits, it starts branching automatically by reducing one node from the last active node and keeps on checking the values of voltage drop and power loss till all the values are in standard limits. Anyhow, if all nodes voltage are not within the acceptable range, 2nd DG starts picking the load from the last normalized node of the 1st DG (node number 15) accommodating for its accumulative capacity and starts checking the range of node voltages lying in its island. If whole of the node voltages of the isolated (Islanding) region are in the range of IEEE standard and branching has been executed, then it calculates different parameter values including, node voltage, segment current, segment voltage drop, power loss, power factor and frequency at each node.

162
Fig 5.26 Voltage profile for islanding detection of IEEE 34 bus system with multi- DG scenario
Fig 5.27 Power loss curve for islanding detection of IEEE 34 bus system with multi-DG scenario

163
However, if all node voltages are in the acceptable range without any branching, then in order to utilize the maximum capacity of DGs (1 and 2), it starts one step backward from its location, normalizing back nodes while keeping checks on its optimal capacity until and unless it reaches the maximum capacity or the fault point. The process of islanding formation and detection with single and multi-DGs scenario is illustrated in the Fig 5.28. The simulation results are depicted in Table 5.20. The elaborative study of the results indicates the maximum voltage drop of 82.763V, 64.6V, 42.99V, 36.93V, 23.81V and 14.234V, at node number 15, 14, 10, 8, 12 and 16. The detailed study of the results delineates that all the node voltages are within IEEE standard limits. During the simulation, it has been observed that the maximum value of node voltages are at node number 15 (DG1 of 11kV) and at node number 7 (DG2 of 11kV). The minimum value of node voltage10.89359kV was observed at node number 13. It is noticed that NIDA is capable of maintaining both the maximum and minimum values of node voltages in the range of IEEE standard. Fig 5.28 Islanding formation of IEEE 34 bus system with single and multi-DG scenario
6 7 8 9 11 1 1 1 15 1 17 11
DG1DG2
Islanding with multi-DG
Islanding with single
1 2 3 4
3.61 A
0 A
1.05 A
0 A
0 A
0 A
11.41 A
2.886 A
.46 A
2.952 A
0.262 A
30.5 A
0A
5
2.23 A
43.63 A
9.316 A
4.4 A
1.84 A
0 A

164
The voltage profile of Fig. 5.26 illustrates that all the node voltage are above the minimum permissible limit. Nodes voltage decreases gently beyond node number 7 up to node number14. Voltage increases sharply to a maximum value of 11kV at node number 15 and again declines gradually till end. Many reasons are responsible for this decrease in node voltage; the non-uniform distribution of load is one out of them. The detailed investigation of the results presented in Table 5.20 and the power loss curve of Fig. 5.27 reveals that the power loss at the initial nodes are very low, almost less than one kilowatt from node number 7 to 13. It almost decreases to zero between node number 11and 13. The power loss increases abruptly behind node number 13 and reaches to its maximum value of 2.09kW and 1.5151kW at node number 15 and 14. Beyond node number 16 it again decreases almost near to zero at tail end. Such variations in the power loss are due to unequal distribution of load on the nodes. Thorough investigation of case study delineates the successfulness and effectiveness of NIDA. It can be implemented to any radial distribution feeder, having non-uniform loads and operating at power factor other than unity in single DG as well as multi-DG scenarios. The peculiarity of NIDA is its modular programming approach, enabling an efficient enhancement/alteration as and when required. Application of NIDA to any radial distribution feeder does not deteriorate its power quality in terms of node voltage and power loss which is one of its most distinguishing characters. The application of NIDA not only increases the reliability of distribution network but also enhances the power quality by providing uninterruptible power supply to sensitive loads, keeping all node voltages of the distribution network within IEEE permissible limit.
5.13 Case Study 6
In the era of competitive and deregulated environment electric power distribution system is considered as robust link. The extensive utilization of DGs has compelled the electric utilities to change the passive distribution networks into active one. The introduction of DGs into distribution system has created many issues both from protective as well as operational point of view. Formation islanding and its detection bear significant impact on such a distribution system. In this case 11 node radial distribution feeder of reference 52 has been selected as case study. The analyses are based upon analytical approaches. The distribution network is operating on 12.5kV reference voltage. During the fault condition, the distribution system is either disconnected from utility main grid or an islanding detection algorithm is applied that detects islanding situation and initiates DG disconnection from utility main source. In the existing situation of electric power distribution companies, it becomes very essential for electric utilities to provide reliable and uninterruptible power supply to customers with high degree of improved power quality in terms of node voltage profile improvement and power loss reduction. In these analyses NIDA is implemented effectively on 11 nodes radial distribution feeder having non- uniformly distributed load. The simulation results are presented in Table 5.21.The analysis has been performed through following steps.

165
Fig 5.29 Single line diagram of 11 nodes radial distribution feeder with DG at node 10 Fig 5.30 Islanding formation of 11 node nodes radial distribution feeder with DG at node 10
2 1 3 4 5 6 7 8 9 10 11
DG
23.09
A
23.09
A 23.09
A
23.09
A
23.09
A
23.09
A
23.094
A
23.094
A
23.094
A 23.094
A
23.094
A
Islanded region
2 1 3 4 5 6 7 8 9 10 11
DG
23.09
A
23.09A
23.09
A
23.094 A
23.094 A
23.09
A
23.094
A
23.094
A
23.094
A 23.094 A
23.094
A

166
Table 5.21
Simulation Results of 11 nodes system for uniformly distributed load with DG
Node Segment I(A) Segment Voltage drop(volts)
Node Voltage (volts)
Power loss (Kw)
1 183.85 130.446 12369.55 18.184
2 160.75 114.059 12255.49 13.902
3 137.66 097.673 12157.82 10.194
4 114.56 081.287 12076.53 07.061
5 091.47 064.901 12011.63 04.501
6 068.38 048.515 11963.12 02.515
7 045.28 032.129 11930.99 01.103
8 022.19 015.743 11915.25 00.264
9 000.91 000.643 11914.60 00.0004
10 024.00 017.029 11897.57 00.309
11 23.09 016.386 11881.19 00.286
Total Voltage drop= 618.8128volts Total Power loss=58.324kW
5.13 1 Step 1 The input data is arranged according to the needs and requirements of NIDA design. The length of feeder segment and loads (in amperes) connected to each node are extracted from the single line diagram of 11 node test feeder as depicted in Fig 5.29. The different parameters of test feeder are enumerated through the implementation of NIDA. During the islanding process, NIDA keeps the power loss and nodes voltage within IEEE permissible limits (±5%). During the analyses of 11 node system, it is observed that NIDA can detect the islanding formation with the implementation of single DG, having optimal size of 1.54MW and at optimal location at node number 10. At the occurrence of fault, micro-grid is farmed from node 11 to node 9 as illustrated in Fig 5.30. In these analyses 12kV has been selected as grid voltage for which the feeder voltage must not exceed the maximum (13.125kV) and minimum (11.875kV) permissible values at each node.

167
Table 5.22 Simulation Results of 11 nodes system for uniformly distributed load with DG
Node Segment I(A) Segment Voltage drop(volts)
Node Voltage (volts)
Power loss (w)
8 21.23 15.05 12480.99 242.48
9 01.86 01.32 12482.31 001.861
10 24.95 17.69 12500.00 334.91
11 23.09 16.37 12483.63 286.83
Fig 5.31 Voltage profile for islanding detection of 11 nodes radial distribution feeder

168
5.13 2 Step 2 The application of NIDA on 11 node radial distribution network identifies the need of a single DG of an optimal size and placement as mentioned in step 1. It is assumed that the fault occurred anywhere between the utility main grid and DG
The moment the fault occurs anywhere in between utility main grid and DG, NIDA detects the fault and starts calculating voltage drop and power loss from last active node to DG. If voltage drop and power loss are not within the IEEE permissible limits, it starts branching automatically by reducing one node from last active node and successively checks the values of voltage drop and power loss till all the values are in standard limits.
Fig 5.32 Power loss curve for islanding detection of 11 nodes radial distribution feeder In this particular case, DG starts calculating voltage and power loss from last active node number 11 till it reaches to node number 9. Before node number 9 DG is unable to pick the load connected to next node (8), as it exceeds the maximum capacity of DG. Thus islanding is completed successfully from node number 11 to 9. It is worth mentioning that NIDA is capable of forming and detecting islanding in which all node voltages and power loss are within standard acceptable range. DG is capable of providing

169
uninterruptible power supply according to its rated capacity to those loads which are situated in the island. Simulation results for single DG scenario are presented in Table 5.22. DG is installed at node number 10 and the values of maximum voltage drops are 17.69V, 16.37Vand 15.05V at node number 10, 11 and 8. The haphazard deviation in the voltage drop is mainly due to non-uniform distribution of load. The voltage profile of Fig. 5.31 and the simulation results of Table 5.22 indicate the maximum node voltage of 12.5kV at node number 10 and minimum node voltage of 12480.99V at node number 8. These values are well within the range of maximum (13.125kV) and minimum (11.875kV) IEEE standard limits. The maximum power loss of 334.91W and 286.83W occurs at node number 10 and 11 as illustrated by the power curve of Fig 5.32. From these results, it is concluded that NIDA can be implemented successfully to any distribution feeder operating with non-uniformly distributed load at non unity power factor.
5.10 Summery
A comprehensive algorithm for the implementation of Distributed Generation (IDG) has been developed to identify the optimal size and location of DG in the distribution system. The proposed method can be utilized effectively to increase the feeder performance having non-uniformly distributed loads. Elaborative results are presented in the case study to assess the performance of distribution feeders as potential custom power solution. The structure of IDG tool is more flexible and capable of optimizing any complex feeder up to nth number of nodes. The algorithm can be run either for manual DG implementation or an automatic one. It has the ability to calculate automatically segment data, including the segment resistance, inductance, inductive reactance, impedance, segment current, voltage drop, node voltages, power factor, and power losses. IDG algorithm tries all possible combinations of DG(s) and simultaneously keeps a check to find out the optimum rating DG(s) and location(s). The accuracy of the simulation greatly depends on the input information. The simulation results also show that the techniques presented here can be used to make the system wide reserve management and pricing decisions in the competitive and deregulated market. The technical requirements for large scale, reliability enhancing integration of DG into the existing distribution system infrastructure depends on the market trends. The proper size and placement of DG in the distribution network reduces the voltage drop and power loss significantly. Equations of voltage drop and power loss for feeder having non-uniform loads are developed and effectively implemented in IDG algorithm. The general equation for voltage profile is valid only when all node voltages are within permissible limits (± 5%). Application of DG reduces the source (grid) current thereby minimizing the voltage drop (IZ) and power loss (I2R).Therefore, DG minimizes the source current to a value at which all the node voltages are within the standard limit. The analyses illustrate the fact that IDG tool can be implemented successfully to identify the optimal size and location of DG(s) and rectify the problems of voltage drop and power loss of any distribution feeder.

170
Non-uniform distribution of loads in the feeder is mainly responsible for power quality issues. The recent advancement in the technology and increasing demand for electricity has made the DG, a viable alternative for performance improvement of distribution feeder. More benefits can be accrued by integrating DG with electric utility network. Many techniques have been presented to monitor the phenomena of islanding. These techniques can be divided into three categories: active methods, passive methods and other methods. Most of these methods work well for large number of load cases but when tested by applying a particular worst case tested circuit in order to simulate the power island, some special load cases can always be identified under which the particular methods fail to detect the power island. The non-uniform distribution of electric loads, unity power factor, complexities during the design of interface control and the functioning of the system in multi–DG scenarios are the most common obstacles, seriously faced by the distribution engineers during the implementation of existing islanding detection techniques. The importance of islanding detection originates from security reasons. Having a feeder energized when utility operators carrying out repairing work may be hazardous. If the distribution network remains energized and a re-closing of the switching between utility network and low voltage distribution network occurs, power system equipment may get damaged partially or completely because of frequency phase and magnitude variations between utility and the island. Among the causes of system islanding, malfunctions of protective equipments and multiple tripping of distribution lines triggered by natural disasters are the most common. Passive islanding detection devices measure, while active islanding detection both perturbs the output as well as measure it. Any sort of perturbation in the output is closely related to power quality. Therefore, small variation in the output parameters causes the degradation in the power quality for which the implementation of additional function needed. The most prominent advantage of passive islanding detection is that it does not influence the power quality of electric power distribution system. The passive methods do not affect the waveform of the high voltage. Power quality issues like voltage dip, spikes, electrical noise and other associated problems do not exist during its implementation. In this research work, using an analytical approach, a New Islanding Detection Algorithm (NIDA) for multiple Distributed Generation scenarios has been developed. NIDA has the capabilities to function under uniform and non-uniform loads with power factor other than unity for single DG as well as multi-DG scenarios. The peculiarity of NIDA is its modular programming approach, enabling an efficient enhancement/alteration as and when required. Application of NIDA to any radial distribution feeder does not deteriorate its power quality which is one of its most distinguishing characters.

171
The simulation results show that the algorithm can be implemented affectively to detect the islanding phenomena and enhance the distribution system performance in terms of node voltage improvement and power loss reduction.

172
CHAPTER VI
CONCLUSION
In this research work two innovative algorithms namely, the implementation of distributed generation (IDG) and new islanding detection (NIDA) have been developed for enhancing the power quality and islanding detection algorithm of electric power distribution network. The algorithms have been developed in “C” language and implemented successfully to identify the optimal location and size of DG in the distribution system. The results of case studies show that proposed algorithms are very effective for eliminating the problems of voltage drop, power loss and islanding detection of radial distribution feeders. The simplicity and flexibility of the algorithms eases the users to implement them effectively to increase the performance of problematic feeder having different types of uniformly or non-uniformly distributed load. Elaborative results are presented in the case studies to assess the performance of distribution feeders as a potential custom power solution. The structure of IDG algorithm is based upon the analytical approach and it is much simple and flexible in its application. The load connected at different nodes (in amperes), node to node segments length, the reference voltage and the total number of nodes serves as input data for the algorithm. The user has the option to feed the data either manually or through input data files. The algorithm can be run either for manual DG implementation or an automatic one. It has the ability to calculate automatically the feeder segment data, including the segment resistance, inductance, inductive reactance, impedance, current, voltage drop, and nodes voltage, power factor, power loss at the different nodes and the total voltage drop and power loss of the feeder. During the execution, IDG algorithm tries all possible combinations of DG(s) and simultaneously keeps a check to find out the optimum rating DG(s) and location(s). The number of DG applied is based upon the input data and IDG algorithm itself decides the required number. The algorithm keeps constant check on the accumulative capacity of DG(s) which must not exceed the total capacity of utility main grid. IDG algorithm starts simulation with single DG implementation and if it fails to bring all node voltages within in IEEE prescribed standard limit (±5%), then in addition to 1st DG its incorporate 2nd DG and so on until and unless all the nodes voltages are within permissible limits. The user has the option to either save the results in output files which can be used later on or take the prints. Non-uniform distribution of loads in the feeder is mainly responsible for power quality issues. The recent advancement in the technology and the increasing demand for electricity has made the DG, a viable alternative for performance improvement of

173
distribution feeder. More benefits can be accrued by integrating DG with electric utility network. The proper size and placement of DG in the distribution network reduces the voltage drop and power loss significantly. Application of DG greatly controls the source (grid) current thereby minimizing the voltage drop (IZ) and power loss (I2R). The analyses conducted for different case studies illustrate the fact that IDG tool can be implemented successfully to determine the optimal size and location of DG(s) and rectify the problems of voltage drop and power loss of identified complex distribution feeder. Several techniques have been presented to monitor the phenomena of islanding. These techniques can be divided into three major categories of active methods, passive methods and other methods. The non-uniform distribution of electric loads, unity power factor, complexities during the design of interface control and the functioning of the system in multi–DG scenarios are the most common obstacles, seriously faced by electric utilities during the implementation of existing islanding detection techniques. The importance of islanding detection originates from security hazard. Having a feeder energized when utility operators carrying out repairing work may be dangerous. If the distribution network remains energized and a re-closing of the switching between utility network and low voltage distribution network occurs, power system equipments may get damaged partially or completely because of frequency phase and magnitude variations between utility and the island. Malfunctions of protective equipments, operator mistake and multiple tripping of distribution lines triggered by natural disasters are the most common causes of system islanding. Passive islanding detection devices measures, while active islanding detection both perturbs the output as well as measures it. Any sort of perturbation in the output is closely related to power quality. Therefore, small variation in the output parameters causes the degradation in the power quality for which the implementation of additional function needed. The most prominent advantage of passive islanding detection is that it does not influence the power quality of electric power distribution system. The passive methods do not affect the waveform of the high voltage. Power quality issues like voltage dip, spikes, electrical noise and other associated problems do not exist during its implementation. Thorough review of literature reflects that many algorithms have been developed for islanding detection of distribution feeders. Majority of them can not be implemented practically due to many problems. The extensive utilization of distributed generation has complicated the operation of distribution networks. The process of islanding formation and its detection, especially in the multi-distributed generation scenario under randomly distributed loads has further deteriorated the quality of service. Keeping in view all of above mentioned problems, NIDA is developed in “C” language for radial distribution feeder of electric power distribution system. NIDA can be implemented for islanding detection under uniform and non uniform loads and with low power factor, operating in multi-DG scenario. The algorithm should be incorporated with distribution feeder whose performance has been enhanced by the implementation of DG(s) having optimal sizes and locations. In stringent environmental and deregulated

174
conditions, the desired goal can be achieved by enumerating the passive islanding detection techniques in the presence of DG(s) which not only enhances the reliability but also improves the power quality. The test result expresses the usefulness of NIDA. It has the ability to operate under uniformly and non-uniformly distributed load with low power factor. The proposed algorithm has been implemented on a problematic feeder. The results were verified for both single DG as well as multi-DG scenario. The peculiarity of NIDA is its modular programming approach, enabling an efficient enhancement/alteration as and when required. Application of NIDA to any radial distribution feeder does not deteriorate its power quality which is one of its most distinguishing characters. NIDA can be applied for both intentional as well as non intentional islanding successfully. The detailed investigation shows that both the algorithms (IDG and NIDA) outperforms the conventional approaches and can be implemented to any problematic radial distribution feeder accurately. In addition, the proposed algorithms can be utilized effectively to enhance the power quality of distribution feeder performance having uniformly/randomly distributed loads.
Consideration of the possible distribution topologies including the common radial ones as proposed by Dr. Mohamed A.Zodhy, professor Electrical and Computer Engineering Department Oakland University. In this regard, it is concluded that the radial distribution feeders are mainly considered because they are lengthy, mostly overloaded and utilize undersized conductors. Although, their configuration is less complicated yet more flexible and has provision for future expansion. It is also observed that practically, more percentage of radial feeders is being utilized by electric utilities. In the light of above mentioned facts, only the radial feeders are considered for analyses.

175
FUTURE WORK
The proposed algorithms are developed on the bases that radial distribution feeders are utilizing one type of conductors with same sizing. Much work is required to further improve the applicability of the suggested algorithms by using different conductors of varying sizes. The accuracy of simulation result greatly depends on the input data. Wrong selection of data adversely affects the results. Feeding of incorrect data will generally cause system overloading which will result in excessive voltage drop and power loss in the distribution system. The application of such factious data will also cause difficulties during the selection of exact size of conductor. In case of utilizing under-sized conductor, will deteriorate the power quality of distribution feeder. However, the selection of oversized conductor will create economic problems for electric utility. Also, the incorrect assessment of data will result an unequal distribution of load among the three phases of distribution transformer which will cause the problem of system unbalancing. The flow of excessive current in the low voltage distribution network will increase the operating temperature of the network which will not only reduce the life of distribution network but will also damage the costly equipments and overall efficiency of the system will be affected. Wrong selection of segment length will either increase or decrease the segment impedance, thereby affecting the nodes voltage and power loss. Therefore, a proper tool is required for exact and precise collection of data. The coordination of classical under-voltage or over-voltage and frequency drift controllers, like static Var compensators with control of new distributed generation as suggested by Dr.Mohamed A.Zodhy, professor Electrical and Computer Engineering Department Oakland University. In our opinion the coordination of classical under-voltage or over-voltage and frequency drift controllers is out of the scope of our research work. It is recommended for future work.

176
REFERENCES
[1] M.M Morcos, W.R. Anis Ibrahim, “Electric Power Quality and Artificial
Intelligence: Overview and Applicability”, IEEE Power Engineering Review, pp.5-10, June.1999.
[2] M.M. Morcos and J.CGomez, “Electric Power Quality: The strong connection with Power Electronics”, IEEE Power and Energy Magazine, pp. 18-25, September/October. 2003.
[3] Timothy J. Browne and Gerald T. Heydt, “Power Quality as an Educational Opportunity”, IEEE Transactions on Power Systems, vol.23, no.2, pp. 814-815, May. 2008.
[4] G. T. Heydt and W.T.Jewell, “Pitfalls of Electrical Power Quality Indices”, IEEE Transactions on Power Delivery, vol.13, no.2, pp. 570-576, April. 1998. [5] Wilson E. Kazibwe, Robert J. Ringlee, George W. Woodzell and Henry M.
Sendaula, “Power Quality: A Review”, IEEE Computer Applications in Power, pp. 39-42, January. 1990.
[6] G. T. Heydt and Kraig J. Olejniczak,“The Hartely Series and Its Applications to Power Quality Assessment”, IEEE Transactions on Industry Applications, vol.29, no.3, pp. 522-526, May/June. 1993.
[7] G.T. Heydt, “Electric Power Quality: A Tutorial Introduction”, IEEE Computer Applications in Power, pp. 15-19, January. 1998. [8] John Douglas, “Power Quality Solutions”, IEEE Power Engineering Review, pp.
3-7, March.1994. [9] Walid E1-Khattman, Kankar Bhattacharya, Yasser Hegazy and M.M.A.Salama,
“Optimal Investment Planning for Distributed Generation in a Competitive Electricity Market”, IEEE Transactions on Power Systems, vol.19, no.3, pp. 1674-1684, August. 2004.
[10] Mostafa I. Marei, Ehab F. E1-saadany, and Magdy. M. A .Salama, “A Novel Control Algorithm for the DG Interface to Mitigate Power Quality Problems”, IEEE Transactions on Power Delivery, vol.19, no.3, pp.1384-1392, July. 2004. [11] Y.G Hegazy, M.M. A Salama, and A.Y Chikhani, “Adequacy Assessment of Distributed Generation Systems Using Monte Carlo Simulation”, IEEE Transaction on Power Systems, vol.18, no.1, pp.48-52, February. 2003. [12] Fu-Sheng Pai and Shyh-Jier Huang, “A Detection Algorithm for Islanding- Prevention of Dispersed Consumer-Owned Storage and Generating Units”, IEEE Transactions on Energy Conversion, vol. 16 no.4, pp. 346-351, December. 2001. [13] Shyh-Jier Huang, and Fu- Sheng Pai, “A New Approach to Islanding Detection of
Dispersed Generators with Self-Commutated Static Power Converters” IEEE Transactions On Power Delivery, vol. 15, no. 2, pp. 500-507, April. 2000.
[14] Sung-Ii Jang, and Kwang-Ho Kim, “An Islanding Detection Method for Distributed Generations using Voltage Unbalance and Total harmonic Distortion of Current”, IEEE Transactions on Power Delivery, vol. 19, no.2, pp. 745-752, April.2004.

177
[15] F. Katiraei, M. R. Irvani, “Power Management Strategies for Micro-grid with Multiple Distributed Generation Units”, IEEE Transactions on Power Systems,vol.21, no.4, pp. 1821-1831,November. 2006. [16] Roger C. Dugan/Mark F. Mc Granaghan Surya Santoso/H.Wayne Beaty, “Electrical Power System Quality”, 2002. [17] Olimpo Anaya-Lara and E.Acha, “Modeling and Analysis of Custom Power Systems by PSCAD/EMTDC”, IEEE Transactions on Power Delivery, vol.17, no.1, pp. 266-272, January. 2002. [18] Koen J.P.Macken, Math H.J.Bollen and Ronnie J.M.Belmans, “Mitigation of Voltage Dips Through Distributed Generation system”, IEEE Transaction on Industry Applications, vol.4,no.6, pp.1686-1693, November/December.2004. [19] Yasuhiro Hayashi and Junya Matsuki, “Loss minimum configuration of Distribution System considering N-1 Security of Dispersed Generators”, IEEE Transactions on Power System, vol.19, no.1, pp. 636-642, February. 2004. [20] G.T.Heydt, “Electric Power Quality”, Second Edition, Star in circle publication, 1994. [21] Joon-Ho Choi, Jae-Chul Kim, “Advance Voltage Regulation Methods of Power
Distribution Systems Interconnected with Dispersed Storage and Generation System (Revised)”, IEEE Transactions on Power Delivery, vol.16, no.2, pp 329-334, April. 2001.
[22] Yiming Mao,and Karen N.Meu, “Switch Placement to Improve System Reliability for Radial Distribution Systems Distributed Generation”, IEEE Transactions on Power Systems, vol.18, no.4, pp. 1346-1352, November 2003.
[23] Loredana Cristaldi, Alessandro, Ferrero and Simona Salicone, “A Distributed System for Electric Power Quality Measurement”, IEEE Transactions on Instrumentation and Measurement, vol. 51, no.4, pp 776-781, August. 2002.
[24] C.Sankaran, “Power Quality”, C R C Press, 2002. [25] Po-Tai Cheng, Chain-ChungHuang, Chun-Chiang Panand Subhashish
Bhattacharya, “Design and Implementation of a Series Voltage Sag Compensator under Practical Utility Conditions”, IEEE Transactions on Industry Applications, vol. 39, no. 3, pp.844-853, May/June. 2003.
[26] Nigel C. Scott, David J. Atkinson and James E. Morrel, “Use of Load Control to Regulate Voltage on Distribution Networks with Embedded Generation”, IEEE Transactions on Power Systems, vol.17, no.2, pp. 510-515, May. 2002. [27] Willium H Kersting, “Distribution System Modeling and Analysis”, C.R.C. Press, 2002. [28] Ettor Bompard, Enrico Carpaneto, Gianfranco Chicco Paolo Ribaldone and Claudio vercellino, “The Impact of Public Lighting on the Voltage Distortion in Low Voltage Distribution System", IEEE Transaction on Power Delivery, vol.16,no.4, pp. 752-757, October. 2001. [29] Arijit Bhowmik, Arindam Maitra, S Mark Halpin and Joe. E. Schatz,
“Determination of Allowable Penetration Level of Distributed Generation Resources based on Harmonic Limits Consideration”, IEEE Transactions on Power Delivery, vol.18, no.2, pp. 619-624, April. 2003.

178
[30] C W Brice, “Comparison of Approximate and Exact Voltage drop Calculation for Distribution Line”, IEEE Transaction on Power Apparatus and Systems, vol.PAS101, no.11, pp 4428-4431, November. 1982. [31] James M. Daly, chairman; Alex Banes, Graydon M. Bauer, Raymond F. Bilinski,
James R. Carey, David N. hunder, Ralph H. Lee, Milton. Tsung, Dale E. Wagner, IEEE Red book, “IEEE Recommended Practice for Electrical Power Distribution for Industrial Plant”, The Institute of Electrical and Electronics Engineers, Inc. Third Printing, January. 1991.
[32] Statistics Directorate, “Progress Report”, G. M. (O), Pakistan Water and Power Development Authority (WAPDA) House, Lahore, 2000. [33] Kyu-Ho Kim, Sang-Bong Rhee, Soo-Nam Kim and Seok-Ku You, “Application
of ESGA Hybrid Approach for Voltage Profile Improvement by Capacitor Placement”, IEEE Transactions on Power Delivery, vol.18, no.4, pp.1516-1522, October.2003.
[34] Turan Gonen, “Electric Power Distribution System Engineering”, Mc Graw Hill, 1986. [35] Narain G. Hingorani, “Introducing Custom Power”, IEEE Spectrum, pp.41- 48, June. 1995. . [36] In-Su Bae, Jin-O Kim, Jac-Chul Kim and C. Singh, “ Optimal operating Strategy
for Distributed Generation Considering Hourly Reliability Worth”, IEEE Transactions on Power Systems, vol.19, no.1, pp. 287-291, February. 2004.
[37] T.Griffin, K Tomsovic, D .Secrest, A. Law, “Placement of Distributed Generation Systems for Reduced Losses, Proceeding of the 33rd Hawaii International Conference on System Sciences, pp. 1-9, 2000. [38] Nguyan Hoang Viet, Dang Tuan Khanh, “Impacts of Distributed Generation on
the Protection of Distribution Networks and Studying Wind Generator”, International Symposium on Electrical and Electronics Engineering, HCM city Vietnam, pp.130-138, October. 2007.
[39] Joseph Eto, Vikram Budhraja, Carlos Martinez, Jim Dyer, Mohan Kondragunta, “Research, Development, and Demonstration Needs for large- scale, Reliability Enhancing, Integration of Distributed Energy Resources”, Proceeding of the Thirty- third Annual Hawaii International Conference on System Sciences, pp. 1-7,January. 2000.
[40] Afzal.S.Siddiqui, Chris Marnay, “Distributed Generation Investment by a Micro- grid under Uncertainty”, pp. 1729-1737, Energy,2008. [41] A Pregelj, M. Begovic, A. Rohatgi, D. Novosel, “On Optimization of Reliability of Distributed Generation, Enhanced Feeders”, 36th Hawii International Conference on System Sciences, pp.1-6. [42] S.R.Allen, GP Hammond, M.C.Mc Manus, “Prospects for and Barriers to
Domestic Micro-generation: A United Kingdom perspective”, Applied Energy85, pp.528-544, 2008.
[43] Manisa Pipattanasomporn, Michal Willingham and Saifur Rehman, “Implications of On-Site Distributed Generation for Commercial/ Industrial Facilities”, IEEE Transactions on Power Systems, vol.20, no.1, pp. 206-212, February. 2005.

179
[44] Arturo Losi and Mario Russo, “Dispersed Generation Modeling for Object- Oriented Distribution Load Flow”, IEEE Transaction on Power Delivery, pp.1-9, 2005. [45] X P Zhang, “A frame work for operation and Control of Smart Grids with DGs”
Power and Energy Society General meeting-Conversion and Delivery of Electrical Energy in 21st century, 2008 IEEE, pp.1-5, 20-24 July. 2008.
[46] Michiel Houwing, Austin N. Ajah, Petra W. Heijnen, Ivo Boxwmans, Paulien M. Herder, “Uncertainties in the Design and Operation of Distributed Energy Resources: The case of micro-CHP Systems”, Energy33, pp. 1518-1536, 2008. [47] Zhe Chen, Frede Blaabjerg and John K. Pedersen, “Hybrid Compensation Arrangement in Dispersed Generation Systems”, IEEE Transactions on Power Delivery, vol.20, no.2, pp.1719-1727, April. 2005. [48] A. D. Hawkes, M.A. Leach, “Modeling high level System Design and Units Commitment for a Micro-grid”, Applied Energy, pp. 1-13, 2008. [49] M. A. Kasem, Gerard Ledwich, “DG as Voltage Support for Single Wire Earth Return Systems”, IEEE Transactions on Power Delivery, vol.19, no.3, pp.1002- 1011, July. 2004. [50] A. Dysko, G.M.Burt, S.Galloway, C. Booth and J.R Mc Donald, “UK
Distribution System Protection Issues”, IET Generation, Transmission, Distribution, pp. 679-687, 2007.
[51] Hasham Khan, Muhammad Ahmad Choudhry and Tahir Mehmood, “An Algorithm to Improve Feeder Performance at Distribution Level for Extreme Load Growth Scenario”, Mehran university Research Journal of Engineering and Technology, Pakistan.vol. 27, no. 4, pp. 377-392, 2008.
[52] Caisheng Wang, M. Hashem Nehrir, “Analytical Approaches for Optimal Placement of DG Sources in Power Systems”, IEEE Transactions on Power Systems, vol.19, no.4, pp. 2068-2076, November. 2004. [53] Tuba Gozel, M. Hakan HOCAOGLU Ulas EMINOGLU, Abdulkadir BALIKCI, “Optimal Placement and Sizing of Distributed Generation on Radial Feeder with Different Static Load Models”, International Conference on Future Power Systems, pp.1-6, 16-18 November. 2005. Netherland. [54] Hasham Khan, Muhammad Ahmad Choudhry, Tahir Mehmood and Aamir Hanif, “Investigating the Electric Power Distribution System(EPDS) Bus Voltage in the Presence of Distributed Generation( DG)”, Proceeding of the 5th WSEAS International Conference on Instrumentation, Measurement, Circuits and Systems”, Hangzhou, China, pp. 207-212, April. 2006. [55] Hugo A. Gil and Gezo Joos, “Model of Quantifying the Economic Benefits of Distributed Generation”, IEEE Transaction on Power Systems, vol.23, no.2, pp. 327-335, May. 2008. [56] Victor H. Mendez uezada, Juan River Abbad and Tomas Gomez San Roman, “Assessment of Energy Distribution losses for Increasing Penetration of Distributed Generation”, IEEE Transactions on Power Systems, vol.21, no. 2,pp. 533-540, May. 2006. [57] J. Toyoda, H. Saitoh, K. Minazawa and M. Tamura, “Security Enhancement of Multiple DG by the Harmonized Grouping”, IEEE/PES Transmission and

180
Distribution Conference and Exhibition: Asia and Pacific Dalian, China, pp. 1-5 2005. [58] J. A Pecas Lopes, N. Hatziargyriou, J. Mutale, P. Djapic, N. Jenkins, “Integrating Distributed Generation in to Electric Power Systems: A review of drivers, Challenges and opportunities”, J. A. Plopes et al Electric Power System Research 77, pp. 1189-1203, 2007. [59] Sukumar. M. Brahma and Adly A. Girgis, “Development of Adaptive Protection
scheme for Distribution Systems with High Penetration of Distributed Generation”, IEEE Transactions on Power Delivery, vol.19, no.1, pp. 56-63, January. 2004.
[60] Alfred Rufer, David Hotellier, Philippe Barrade, “A super Capacitor-Based Energy storage Substation for voltage compensation in weak Transportation network”, IEEE Transactions on Power Delivery, vol.19, no.2, April 2004,pp.
[61] Farid Katiraei, Chad Abbey and Richard Bahry, “Analysis of Voltage Regulation Problem for a 25kV Distribution Network with Distributed Generation”, Proceeding of IEEE-PES General Meeting, Montreal, pp.1-8, 2006. [62] Antonino Augugliaro, Luigi Dusonchet, Salvatore favuzza and Elonora Riva
Sanseverino, “ Voltage Regulation and Power Losses Minimization in Automated Distribution Networks by an Evolutionary Multi-objective Approach”, IEEE Transaction on Power System, vol.19,no.3, pp. 1516-1527, August. 2004.
[63] A M Gole, P. Demchenko, D. Kell, G.D.Irwin,“Integrating Electromagnetic Transient Simulation with other Design Tools”, International Conference on Power systems Transients, CIPST,Rio De Janeiro Brazil, pp.1-5, June. 2001. [64] Shigenori Naka, Sakae Toune, Takamu Genji and Toshiki Yura “Optimal Setting for Distribution Voltage Control Considering Interconnection of Distributed Generators”, International Conference on Electrical Engineering (ICEE2k), Kitakyushu, Japan, pp. 1-4, 24-28 July.2000. [65] Balaji Siva Parsad, Sachin Jain, and Vivk Agarwal, “Universal Single Stage Grid Connected Inverter”, IEEE Transactions on Energy Conversion, vol.23, no. 1, pp. 128-137, March. 2008. [66] Standards Coordinating Committee 21 on Fuel Cells, Photovoltaic, Dispersed Generation, and Energy Storage, “IEEE Standard for interconnecting Distributed Resources with electric Power Systems”, IEEE Std 1547 TM -2003 The Institute of Electrical and Electronics Engineers, Inc. 3 Park Avenue, New York, NY10016- 5997,USA, pp. 1-15, July. 2003. [67] Jun Yin, Chris Peter Diduch, and Liucheng Chang, “Islanding Detection Using Proportional Power Spectral Density”, IEEE Transactions on Power Delivery, vol.23, no.2, pp. 776-784, April. 2008. [68] Steven .M. Rovnyak, Sarah Koskie, Yong Sheng, Vikram S. Rajput and Xiaohui Hu ,“Laboratory testing of a Distributed Generator Unintentional Islanding detection Scheme”, Power Engineering and Society General Meeting, Conversion and Delivery of Electrical Energy in the 21st century, IEEE, pp. 1-6, July.2008. [69] H AI Nasseri, MA Redfern and F Li, “A Voltage based Protection for Micro-
Grids containing Power Electronic Converters”, Power Engineering Society general meeting, pp. 1-7, IEEE 2006.
181
[70] Wen-Jung Chiang, Hurng-Liahng Jou, Jinn- Chang Wu and Ya-Tsung Feng, “Novel Active Islanding Detection Method for Distributed Power Generation System” , International Conference on Power System Technology, 2006 pp 1-7.
[71] O.Samuelsson and N. Strath, “Islanding Detection and Connection Requirements” ,IEEE Power Engineering Society General Meeting, PES, art.no.4275763, pp. 1- 6,2007. [73] Houshang Karimi, Amirnaser Yazdani, and Reza Iravani,“Negative-Sequence
Current Injection for Islanding Detection of a Distributed Resource Unit”, IEEE Multi-Inverter Systems With Active Frequency Drifting Methods”, IEEE Transactions on Power Electronics, vol.23, no.1, pp. 298-307,
January. 2008. [74] Byunggyu Yu, Mikihiko Matsui, Youngseok Jung and Gwonjong Yu, “Modeling
and Design of Phase Shift anti-islanding Method using Non-Detection Zone”, Solar Energy 81(11), pp .1333-1339, 2007.
[75] Luiz A.C. Lopes and Huili Sun, “Performance Assessment of Active Frequency Drifting Islanding Detection Methods”, IEEE Transactions on Energy Conversion vol.21 no.1, pp. 171-180, March. 2006.
[76] F.Bertling, and S.Soter, “A Novel Converter Integrable Impedance measuring method for Islanding Detection in Grids with Widespread use of Decentral generation”, SPEEDAM International Symposium on Power Electronics, Electrical Drives, Automation and Motion”, pp. 12-16.
[77] H H Zeineldin, E.F.EI-Saadany and M.M.A Salama,“Islanding Detection of Inverter-Based Distributed Generation”, IEE proceeding on Generation Transmission and Distribution, vol.153, no.6, pp. 644-652, November. 2006.
[78] H.H Zeineldin, Ehab F.Saadany and M.M.A.Salama, “Impacts of DG Interface Control on Islanding Detection and Non detection Zones”, IEEE Transactions on Power Delivery, vol. 21 no. 3, pp.1515-1523, July. 2006.
[79] Vivek Menon and M.Hashem Nehrir, “A Hybrid Islanding Detection Technique Using Voltage Unbalance and Frequency Set Point”, IEEE Transactions on Power Systems, vol. 22,no.1, pp. 442-448,February. 2007.
[80] M A Redfern, J I Barrett, “A New Microprosser Based Islanding Protection Algorithm for Dispersed Storage and Generation Units”, IEEE Transactions on Power delivery, vol. 10, no. 3, pp. 1249-1254, July. 1995.
[81] Sung II Jang and KWang –Ho Kim, “An Islanding Detection Method for Distributed Generation using Voltage Unbalance and Total Harmonic Distortion of Current” , IEEE Transactions on Power Delivery, vol.19 no. 2, pp. 745-752, April. 2004.
[82] F. Katiraei, M. R. Irvani and P. W. Lehn, “Micro Grid Autonomous Operation During and Subsequent to Islanding Process”, IEEE Transactions on Power Delivery, vol. 20, no. 1, pp.248-257, January. 2005.
[83] Tajul. A. Sulaiman, “Using the Real-time Island Detection and Network Coloring Application in Electrical Systems”, People in Control: An International Conference on Human interfaces in Control Rooms, Cockpits and Command Centers, pp. 234-239, 19-21 June. 2001IEE.

182
[84] Liu Fu-rong,Kang Yong, Duan Shan-Xu, Wang Hui, “Parameter optimization of Active Frequency Drift Islanding Detection Method”, Proceedings of the Chinese Society of Electrical Engineering, vol.28 no.1, pp. 95-99, January. 2008.
[85] M. Ropp, J. Ginn, J. Stevens, W. Bower, S. Gonzalez, “Simulation and Experimental Study of the Impedance Detection Anti-islanding method in the Single-Inverter case”, Conference Record of the 2006 IEEE 4th World Conference on Photovoltaic Energy Conversion, WCPEC-42, art.no.4060156, pp. 2379-2382,
2007. [86] H. H Zeineldin, T. Abdel-Galil, E.F.EI-Saddany, M.M.A Salama, “Islanding
Detection of Grid Connected Distributed Generators using TLS-ESPRIT”, Electric Power System Research77, pp.155-162, (2007).
[87] H. H Zeineldin, K Bhattacharya, E. F. EI- Saadany and M. M. A Salama, “Impacts of Intentional Islanding of Distributed Generation on electricity market prices”, IEE Proceeding on Generation, Transmission and Distribution, vol. 153, no.2, pp 147-154, March. 2006.
[88] H Zeineldin, E F EI-Saadany, and M M A Salama, “Intentional Islanding of Distributed Generation”, IEEE Power Engineering Society General Meeting, vol. 2, pp.1496-1502, June. 2005.
[89] Chuttchaval Jeraputra and Prasad N Enjeti, “Development of a Robust Anti- Islanding Algorithm for Utility Interconnection of Distributed Fuel Cell Powered Generation”, IEEE Transactions on Power Electronics, vol.19 no. 5, pp. 1163-1170, September. 2004.
[90] Jun Yin, Liuchen Chang and Chris Diduch, “Recent Developments in Islanding Detection for Distributed Power Generation”, Power Engineering Society, Large Engineering Systems Conference, pp.124-128, 28-30 July. 2004.
[91] Guiliang Yin, “A Distributed Generation Islanding Detection Method Based on Artificial Immune System”, IEEE/PES Transmission and Distribution Conference and Exhibition: Asia and Pacific Dalian, China, pp. 1-4, 2005.
[92] S. K Salman, “Detection of Embedded Generator Islanding condition using Elliptical Trajectory Technique”, Developments in Power System Protections, pp. 103-106, 25-27th March. 1997. IEE.
[93] Michael E. Ropp, Miroslav Begovic, Ajeet Rohatgi, Gregory A. Kern, R. H. Bonn, Sr. and S. Gonzalez, “Determination of Relative Effectiveness of Islanding Detection Method, using Phase Criteria and Non Detection Zone”, IEEE Transactions on Energy Conversion, vol.15, no.3, pp. 290-296, September. 2000.
[94] S I Jang, K H Kim, “A New Islanding Detection Algorithm for Distributed Generations Interconnected with Utility Networks”, 8th IEE International Conference on Developments in Power System Protections, vol. 2, pp. 571-574.
April. 2004. [95] Khalil EI-Arroudi, Geza Joos, Innocent Kamwa and Donald T Mc Gillis,
“Intelligent-Based Approach to Islanding Detection in Distributed Generation”, IEEE Transactions on Power Delivery, vol.22, no. 2, pp. 828-835, April.2007.
[96] Khalil EI-Arroudi, Geza Joos, “Data Mining Approach to Threshold Settings of Islanding Relays in Distributed Generation”, IEEE Transactions on Power Systems, vol.22, no. 3, pp.1112-1119, August.2007.

183
[97] Morris Brenna, George C. Lazaroius, Gabrio Superti-Furga, and Enrico Tironi, “Bidirectional Front End Converter for DG with Disturbance Insensitivity and Islanding- Detection Capability”, IEEE Transactions on Power Delivery, vol. 23, no. 2, pp. 907-913, April. 2008.
[98] Luiz A. C. Lopes, and Yongzheng Zhang, “Islanding Detection Assessment of Multi- Inverter Systems With Active Frequency Drifting Methods”, IEEE Transactions on Power Delivery, vol.23, no.1, pp.480-485, January. 2008. [100] Hou Meiyi, Gao Houlei, Liu Bingxu, Zou Guibin, “Vector Shift Method for Islanding Detection Based on Simulation Test”, Transactions of Tianjin University 14 (2), pp. 123-127, 2008. [101] Linash P. Kunjumuhammed and Mahesh K. Mishra, “A control Algorithm for
Single-Phase Active Power Filter Under Non-stiff Voltage Source”, IEEE Transactions on Power Electronics, vol.21, no.3, pp. 822-825, May. 2006.
[102] Yu-Chi Wu, Atif S.Debs, Roy E. Marsten, “A Direct Nonlinear Predictor-Corrector Primal-Dual Interior Point Algorithm for Optimal Power Flows”, IEEE Transactions on Power Systems, vol.9, no.2, pp. 876-883, May. 1994.
[103] J.O.Kim, Park, K.W.Park, C.Sing. “Dispersed Generation Planning Using Improved Hereford Ranch Algorithm”, IEEE International Conference on Evolutionary Computation, World Congress on Computational Intelligence, 1998.
[104] M. Gandomkar, M.Vakilian, M. Ehsan, “Optimal Distributed Generation Allocation in Distribution Network Using Hereford Ranch Algorithm”, Proceeding of the eight International Conferences on Machine and Systems, vol. 2, article no. 1574911, pp 916-918, ICEMS 2005.
[105] Karen Nan Miu, Hsiao-Dong Chiang, “A Study of Electric Distribution Network Load Capability”, IEEE International Symposium on Circuits and Systems, Hong Kong, pp. 997-100, 9-12 June, 1997.
[106] Yu- Chi wu, Atif s Debs, Roy E. Marsten, “A Direct Nonlinear Predicator –Corrector Primal- Dual Interior point Algorithm”, IEEE Transactions on Power Systems, vol.9, no.2, pp. 876-883, May. 1994.
[107] Katia C. Almeida and Roberto Salgado, “Optimal Power Flow Solutions under variable Load Conditions”, IEEE Transactions on Power Systems, vol.15,no.4, pp. 1204-1211, November. 2000.
[108] Hasham Khan and Muhammad Ahmad Choudhry, “Performance Improvement in Distribution Feeder by Installing Distributed Generation at Strategic Location”, IEEE-ICET 2006 2nd International Conference on Emerging Technologies Peshawar, Pakistan, pp.403-408, 13-14 November. 2006.
[109] Philip P. Barker, Robert W.de Mello, “Determining the Impacts of Distribution Generation on Power Systems part I Radial Distribution Systems”, IEEE Power Engineering Society summer meeting, vol. 3, pp. 1645-1656, 16-20 July. 2000.
[110] Naresh Acharya, Pukar Mahat, N Mithulananthan, “An Analytical Approach for DG Allocation in Primary Distribution Network”, Electrical Power and Energy, pp. 669-678, 2006. [111] H Lee Willis, “Walter G. Scott, “Distributed Power Generation, Planning and Evaluation”, Marcel Dekker, Inc. 2000.

184
[112] Pathomthat Chirdeja and R. Ramakumar, “An Approach to Quantify the Technical Benefits of Distributed Generation”, IEEE Transactions on Energy Conversion, vol.19, no.4, pp. 764-773, December. 2004.
[113] Gianfranco Chicco, Pierluigi Mancarrella, “Distributed multi-generation: A comprehensive view”, Renewable and Sustainable Energy Reviews13, pp.535-551, 2009.
[114] Palo Piagi, Robert H. Lasseter, “Autonomous Control of Micro-grids”, IEEE Meeting, pp. 1-8, June. 2006.
[115] Shih-Min Hus, Henry J. Holley, W Merle Smith, Darrill G. Piatt, “Voltage Profile Improvement at Alabama Power Company: A Case Study”, IEEE Power Engineering Society, summer meeting, vol. 4, pp. 2039-2044, 16-20 July. 2000.
[116] M. Sedighizadeh and A. Rezazadeh, “Using Generic Algorithm for Distribution Generation Allocation to Reduce Losses and Improve Voltage profile”, Proceedings of World Academy of Sciences, Engineering and Technology, vol. 27 pp. 251-255, February. 2008. [117] Narayan S Rau and Yih-heui wan, “Optimal Location of Resources in Distributed Planning”, IEEE Transactions on Power Systems, vol. 9, no. 4, pp.2014-2020, November. 1994. [118] H. Lee Willis, “Analytical Methods and Rule of Thumb for Modeling DG
Distribution Interaction”, IEEE Power Engineering Society, summer meeting, vol. 3, pp. 1643-1644, 16-20 July. 2000.
[119] Raj Kumar Jaganathan and Tapan Kumar Saha, “Voltage Stability Analysis of Grid Connected Embedded Generator”, AUPEC Brisbane Australia, pp. 1-9, September. 2004. [120] Houshang Karimi, Amirnaser Yazdani, and RezaIravani, “Negative-Sequence
Current Injection for Islanding Detection of a Distributed Resource Unit, IEEE Multi-Inverter Systems With Active Frequency Drifting Methods”, IEEE Transactions on Power Electronics, vol.23, no.1, pp. 298-307, January. 2008.
[121] Houshang Karimi, Hassan Nikkhajoei, and Reza Iravani, “Control of an Electronically- Coupled Distributed Resource Unit Subsequent to an Islanding Event”, IEEE Transactions on Power Delivery, vol.23, no.1, pp. 493-501, January. 2008. [122] Walmir Freitas, Andre Morelato, wilseen xu, and fujio Sato, “Impacts of AC Generators and DSTATCOM devices on the Dynamic Performance of Distribution Systems”, IEEE Transactions on Power Delivery, vol.20, no.2, pp. 1493-1501, April. 2005.

185
APENDICES
APPENDIX A In order to overcome the problems of excessive voltage drop and power loss in distribution network, two innovative algorithms namely the implementation of distributed generation (IDG) and new islanding detection (NIDA) have been developed in “C” language and implemented successfully to identify the optimal location and size of DG in the distribution system. The working of the algorithms is described in the following paragraphs
IDG algorithm
The structure of proposed algorithm is based upon analytical approaches and it is much simple and flexible in its application. The illustrative IDG algorithm, flow chart for the algorithm is shown in Fig 5.3. The implementation of algorithm is carried out through following steps
1. Select the problematic feeder
2. Select the feeder reference voltage and calculate the total number of nodes.
3. Find the segment length and load (in amperes) connected to each node. 4. Determine the feeder parameters including segment resistance, inductance,
inductive reactance, impedance, length, segment current, node voltages, power loss and power factor for each feeder segment.
5. Confirm the voltage limits for each node ±5% of the rated value. 6. If node voltages are out of limit, then connect the DG1to “nth” node 7. Evaluate the change in each segment current due to DG1 and calculate the
node voltages. 8. If node voltages are out of limit, change the location of DG1until all the
node voltages are within acceptable range. 9. If node voltages are still out of limit, also start changing the size of DG1 in
a step of 0.01 amperes along with locations.

186
10. If node voltages are still out of range, connect DG2 to “nth” node along with DG1 and repeat the process from step (vi) to step (viii) for DG1 and DG2, simultaneously until the optimal solution is obtained.
11. Calculate the total voltage drop and power loss. 12. The position(s) and size(s) of the DG(s) will be the optimal.
13. Save the results in data file.
The tool has been designed by using a modular programming approach, enabling an efficient enhancement/alteration, as and when required The algorithm can be run either for manual DG implementation or an automatic one. IDG is capable to calculate automatically the different feeder parameters including, segments resistance, reactance, inductive reactance, impedance, current, voltage drop, and node voltage ,total voltage drop and power loss. In case of heavy voltage drop and power loss, IDG starts working Ist with single DG and try to normalize all nodes voltage and power loss from last active node to initial node one by one by varying the location and size of DG until and unless all the nodes voltage and power loss is within permissible limit. In case the nodes voltage and power loss is within allowable limit, then the location and size of DG is optimal. If the nodes voltage and power loss are still out of permissible limit, it incorporates 2nd DG and repeats the same procedure till the normalization of nodes voltage and power loss. The locations and sizes of DGs are optimal places. IDG algorithm keeps constant check on the accumulative sizes of DGs which must not exceeds the total size of Source (grid). The modular programming approach is the unique peculiarity of the algorithm .The user has the option to make any alteration as and when desired. The power loss and the voltage drop for different segments and nodes of the feeder are to be calculated by performing the analysis without DG as under. The incremental power loss for “n” segment is;
1 2
1 , 1
n
loss n n n
x n
dIP R dx
dt
(1)
The total power loss for “n” segments is;

187
1 22 2
1 0,1 2 1,2
0 11 2
1 , 1
loss
n
n n n
n
dI dIP R dx R dx
dt dtdI
R dxdt
(2)
2
1 , 11
j
loss n n ni
dIP R
dt
(3)
Where
1, 2,3,i is the number of feeder segment The incremental voltage drop for “n” segments is
1
1 , 1
n
x n n n
x n
dIdE Z dx
dt
(4)
The voltage drop at any point at distance “x” from the sending end of the feeder is;
( )drop s xE x E E (5)
Voltage drop in any feeder segment is;
, 1 1 , 1drop n n n n n
dIE Z
dt (6)
Total voltage drop
drop s rE E E (7)
Now consider DG connected to “nth” node of the feeder as shown in Fig 5. 2. This will change the feeder current in each segment due to improvement in the voltage profile along the line. This change in segment current will cause the feeder current to decrease. The feeder current between the source and the location of DG will also change as a result of the injected current source ( dgI ). This change in feeder current ( '
1, nnI ) due to DG
installation is determined for each feeder segment. The incremental power loss with DG is given by the following equations,

188
1 2
1 , 1
nDG
lossDG n n n
x n
dIP R dx
dt
(8)
The total power loss with DG is;
1 22 2
1 0,1 2 1,2
0 11 2
1 , 1
DG DGlossDG
nDG
n n n
n
dI dIP R dx R dx
dt dtdI
R dxdt
(9)
2
1 , 11
jDG
lossDG n n ni
dIP R
dt
(10)
Incremental voltage drop with DG is;
1
1 , 1
nDG
DG n n n
x n
dIdEx Z dx
dt
(11)
Voltage drops in any feeder segment with DG;
, 1 1 , 1DG
dropDG n n n n n
dIE Z
dt (12)
Total voltage drop with DG is;
dropDG s rE E E (13)
Salient Features of the IDG Tool
IDG tool is design in “C” language and is very flexible in its application. Because of its modular programming, user can make the alteration according to his own needs and requirements as and when required. Salient features are listed as below. 1 Ability to find optimum solution for distribution feeder having uniform/non-uniform
loads.
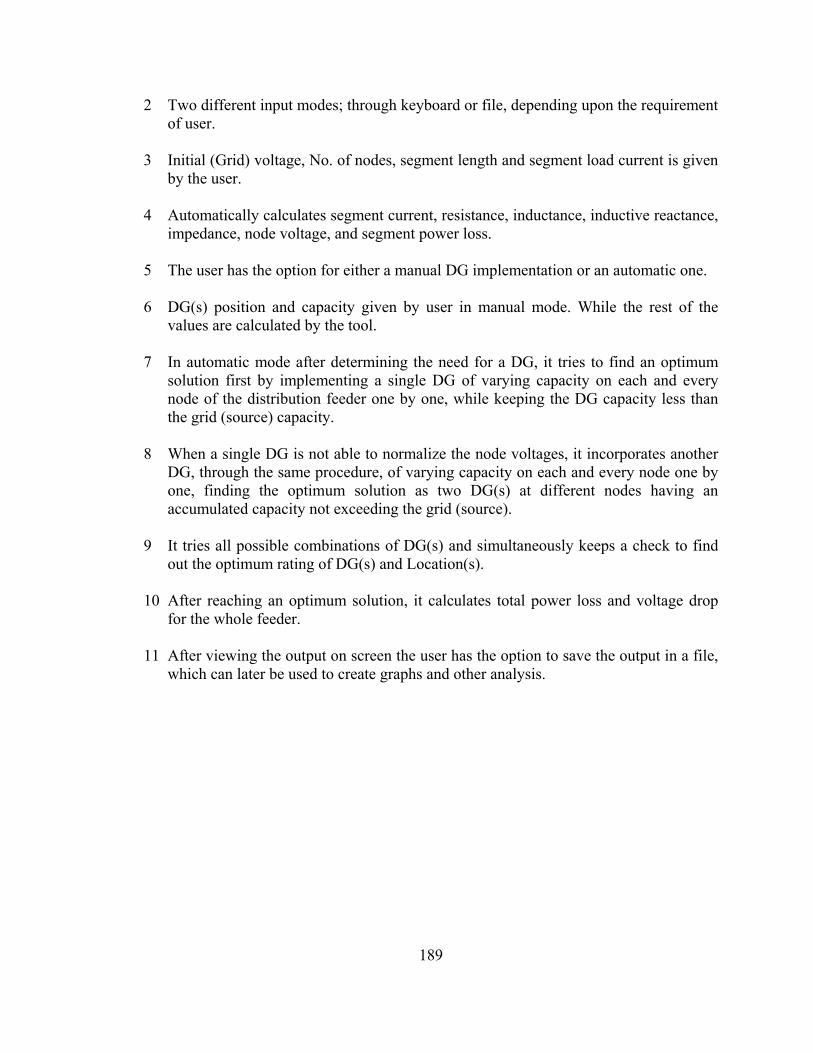
189
2 Two different input modes; through keyboard or file, depending upon the requirement of user.
3 Initial (Grid) voltage, No. of nodes, segment length and segment load current is given
by the user. 4 Automatically calculates segment current, resistance, inductance, inductive reactance,
impedance, node voltage, and segment power loss. 5 The user has the option for either a manual DG implementation or an automatic one. 6 DG(s) position and capacity given by user in manual mode. While the rest of the
values are calculated by the tool. 7 In automatic mode after determining the need for a DG, it tries to find an optimum
solution first by implementing a single DG of varying capacity on each and every node of the distribution feeder one by one, while keeping the DG capacity less than the grid (source) capacity.
8 When a single DG is not able to normalize the node voltages, it incorporates another
DG, through the same procedure, of varying capacity on each and every node one by one, finding the optimum solution as two DG(s) at different nodes having an accumulated capacity not exceeding the grid (source).
9 It tries all possible combinations of DG(s) and simultaneously keeps a check to find
out the optimum rating of DG(s) and Location(s). 10 After reaching an optimum solution, it calculates total power loss and voltage drop
for the whole feeder. 11 After viewing the output on screen the user has the option to save the output in a file,
which can later be used to create graphs and other analysis.

190
APPENDIX B
NIDA
A new islanding detection algorithm (NIDA) has been developed in “C” language for radial distribution feeder of electric power distribution system based upon the node voltage profile improvement and power loss reduction. It can be implemented for islanding detection of radial distribution feeder under uniform and non uniform loads and with power factor other than the unity, operating in multi-DG scenario. The algorithm is incorporated with distribution feeder whose performance has been enhanced by the implementation of DG(s) having optimal sizes and locations. The optimal sizes and locations have been identified by implementing distributed generation (IDG) algorithm. According to IEEE standards, the voltage magnitude of all nodes of distribution feeder is ±5% of the rated value [31]. In normal operation of the feeder all the node voltages are within the acceptable standard limit. The proposed algorithm has the capability to detect the islanding condition during any fault on the utility main grid of such feeder. NIDA performs its function under single DG as well as multi-DG scenario In case of single DG scenario, when fault occurs between utility grid and DG; the supply is cutoff totally from source. Under such circumstances, DG starts calculating the node voltage and power loss from last active node to its optimal location. If the load between last active node and DG location is greater than DG rating, then branching is initiated from last active node in a step of one node back until DG is capable of normalizing the nodes voltage according to its rating. Different nodes whose loads are being supplied by DG, during the islanding are depicted in Fig 5.20, 5.28 and 5.30 respectively. In this way islanding formation and detection is completed under single DG as well as multi-DG scenario. In case of multi-DG scenario, say two DGs at different node, the fault may occur either between DGs or between DGs and utility source. In case the fault occurs between two DGs, then two separate islanding regions will be identified by NIDA. DG situated towards the tail end will constitute independent region as discussed in case of above mentioned single DG scenario. On the other hand if fault occur between utility and DGs, then islanding will be detected under multi-DG scenario, as presented in Fig 5.20, and 5.28 respectively. In this particular case DG situated toward tail end, will start calculating nodes voltage and power loss from last active node to its optimal location. If the node load is greater than the rating of DG, it starts branching back from last active node in a step of one node until and unless it normalizes the nodes according to its rating. Meanwhile, 2nd DG starts picking load from the last active node of Ist DG and normalized the node voltage according to its capacity. When 2nd DG reaches to its maximum rating, the islanding detection is completed under multi-DG scenario.

191
NIDA is implemented through following steps
1. Provides input data manually or through data file containing segments length, load current for each node, reference voltage, total number of nodes, size and location of DG(s) and break(fault) point in case of intentional islanding.
2. Calculates different parameters, including nodes voltage and power loss. 3. If all the parameters are not in set range, start branching back in a step of one
node from last active node till to the normalization of parameters. 4. Continue normalization of nodes till to the break or last normalize node of 1st DG. 5. 2nd DG stars working from the last normalize node of 1st DG till to its optimal
location. 6. Continue working till to its optimal rating or to Break (fault) point. 7. Print the results that will identify the islanded region detected under multi-DG
scenario.
The peculiarity of the algorithm lies in its successful operation with distribution network functioning under multi-DG scenario. The distribution feeder is operating in multi-DG scenario having all node voltages within the feasible range. Whenever the fault occurs anywhere on the utility main grid, the algorithm isolates the particular portion of the feeder forming a micro-grid. It starts calculating the voltage drop and power loss from the last active node to 1st DG. If voltage drop and power loss are not within the acceptable range, it start branching automatically by reducing one node from last active node while keeping constant check on the values of node voltages and power loss till all values are in the range of acceptable limit. However, if all node voltages are not within the recommended range, 2nd DG start picking the load from the last normalize node of DG1 and start checking the range of node voltages lying in its island. Anyhow, if all the node voltages of islanded portion of the feeder are within the permissible limit and branching has been executed, then it calculates different parameter values including, the node voltage, segment current, segment voltage drop, power loss, and power factor at each node. If all the node voltages are within the standard limits without any branching, then in order to utilized maximum capacity of DGs, it starts one step backward from its location, normalizing back nodes while keeping check on its optimal capacity until it reaches its optimal range or the break (fault) point. In this manner it completes the islanding formation successfully. We can either save the calculated values of different parameters in the data file or print the results according to the need and requirement. It is worth mentioning that no curtailment of load is executed when the capacity of DG is equal to the islanded load. The flowchart diagram for NIDA has been depicted in Fig 5.16.

192
Salient Features of the NIDA
The important features of NIDA can be enumerated as under.
1. During the implementation of NIDA, the initial values including reference voltage, number of nodes, DG(s) capacities and locations and breakpoints are provided by the user.
2. Data regarding feeder including the segment length, and load current is
incorporated through data file. 3. It can form the island(s) automatically, starting from the last active node. NIDA is
capable to operate in multi-DG scenarios. 4. It has the ability to detect and form islanding with varying power factor (other
than unity). 5. It can perform the functions successfully under uniform and non-uniform load
condition. 6. DG(s) can be utilized to their optimal ratings. 7. Automatically it can calculate the various parameters like segment current,
segment resistance, inductance, inductive reactance, impedance, segment voltage drop, node voltage, power factor, frequency, and power loss at each node.
8. During its implementation, it keeps the node voltages and power loss within the
permissible limits. 9. Branching (load curtailment) can be implemented while keeping the optimal
ratings of DG(s). 10. No deterioration of power quality in terms of node voltage drop and power loss
occurs during the islanding formation. 11. After viewing the out put on the screen, the user has the option to save the output
in a file, which can later on be used to create graphs and other analysis. 12. Tool has been designed in C-language, using modular programming approach, enabling an efficient enhancement / alteration as and when required.

193
APPENDIX C
LIST OF PUBLICATIONS
1. Hasham Khan, Muhammad Ahmad Choudhry, “Implementation of Distributed
Generation (IDG) Algorithm for performance Enhancement of Distribution Feeder under Extreme Load Growth”, Review completed for the international journal of electrical power and Energy Systems in June, 2009.
2. Hasham Khan, Muhammad Ahmad Choudhry and Tahir Mehmood, “An Algorithm to Improve Feeder Performance at Distribution Level for Extreme Load Growth Scenario”, Mehran University Research Journal of Engineering and Technology Vol. 27, No. 4, 2008, pp. 377-392.
3. Hasham Khan and Muhammad Ahmad Choudhry, “Performance Improvement in Distribution Feeder by Installing Distributed Generation at Strategic Location”, IEEE-ICET, 2006, 2nd International Conference on Emerging Technologies Peshawar, Pakistan, 13-14 November 2006, pp.403-408.
4. Hasham Khan, Muhammad Ahmad Choudhry, Tahir Mehmood and Aamir hanif, “Investigating the Electric Power Distribution System Bus Voltage in the Presence of DG”, Proceeding of the5th WSEAS int. Conf On Instrumentation, Measurement, Circuits and Systems”, April, 2006, p. 207-212.
5. Hasham Khan, Muhammad Ahmad Choudhry, “A New Islanding Detection Algorithm (NIDA) for Distribution System using Multiple Distributed Generators Scenarios” submitted for publication in Electrical Engineering, 2008.
6. Hasham Khan, Muhammad Ahmad Choudhry, “Energy Loss Reduction in Radial Distribution System with Multiple Distributed Energy Resources”, Submitted for publication in Energy-the international Journal, 2009.

194
VITA
Hasham Khan was born in Haripur district of North West Frontier Province (NWFP) Pakistan in 1961.He received B.Sc Electrical Engineering degree from the NWFP University of Engineering and Technology Peshawar in 1988. He worked as a Probationer Engineer in Adamjee Paper and Board Mills Ltd., Nowshera for one year. He joined NWFP Technical Education, Industry Department in 1989 as a Senior Instructor. He received M.Sc Electrical Engineering degree from University of Engineering and Technology Taxila in the year 2000. At present he is the Principal of the Government Polytechnic Institute Haripur, NWFP Industry department and perusing Ph.D degree from the University of Engineering and Technology Taxila. His main areas of research interest are Electric Power Distribution Engineering, Electric Power Quality and Distributed Generation. He is also a life member of Pakistan Engineering Council (PEC).
Hasham Khan