disparities in food access: an empirical analysis of
TRANSCRIPT

DISPARITIES IN FOOD ACCESS:
AN EMPIRICAL ANALYSIS OF NEIGHBORHOODS IN THE ATLANTA METROPOLITAN STATISTICAL AREA
by
Seth Vinson Morganstern
A Thesis Presented to the FACULTY OF THE USC GRADUATE SCHOOL
UNIVERSITY OF SOUTHERN CALIFORNIA In Partial Fulfillment of the
Requirements for the Degree MASTER OF SCIENCE
(GEOGRAPHIC INFORMATION SCIENCE AND TECHNOLOGY)
May 2015
Copyright 2015 Seth Vinson Morganstern

ii
DEDICATION
I dedicate this document to my wife, Caren Morganstern, for her support, encouragement, and
most importantly, understanding through the process of completing my Master's Thesis. I also
dedicate this document to my parents, Alan and Carol Grodin, for their support and teaching me
the value of a well-earned education.

iii
ACKNOWLEDGMENTS
I thank my committee chair, Dr. Warshawsky for his unwavering guidance through this process,
and my committee members, Dr. Ruddell and Dr. Lee for their support in creating a sound thesis
document. I’d also like to thank all of the faculty and staff at the University of Southern
California’s Spatial Sciences Institute for their role in shaping a positive and meaningful
experience earning my M.S. in GIST.

iv
TABLE OF CONTENTS
DEDICATION ii
ACKNOWLEDGMENTS iii
LIST OF TABLES vii
LIST OF FIGURES viii
LIST OF ABBREVIATIONS x
ABSTRACT xi
CHAPTER 1: INTRODUCTION 1
1.1 Why Food Access Matters 1
1.2 Existing Research Gaps 2
1.3 Objective 4
CHAPTER 2: BACKGROUND AND LITERATURE REVIEW 6
2.1 Early Research on Food Environments 6
2.2 Ways of Thinking about the Food Environment 6
2.2.1 Key Factors Shaping the Food Environment 7
2.2.2 Schools of Thought: Defining Food Accessibility 8
2.3 Geographic Information Systems and Food Access 12
CHAPTER 3: METHODOLOGY 15
3.1 Geographic Data Sources 16
3.2 Description of Spatial Datasets 17

v
3.3 Geographic Calculations 26
3.3.1 Neighborhood Delineation 26
3.3.2 Distance Measurements 29
3.4 Statistical Analysis 30
3.5 Expected Outcome 33
CHAPTER 4: RESULTS 34
4.1 Summaries of Neighborhood Groupings for Minority and Income 34
4.1.1 Neighborhood Minority Groupings 35
4.1.2 Neighborhood Income Groupings 36
4.2 Food Store Access Controlling for Minority and Income 37
4.2.1 Food Store Access: Supermarkets 38
4.2.2 Food Store Access: Small Grocery Stores 40
4.2.3 Food Store Access: Convenience Stores 41
4.2.4 Food Store Access: Fast-Food Restaurants 43
4.3 Regression Models 44
4.4 Descriptive Statistics for Neighborhood Characteristics 48
4.4.1 Food Store Access: Percent White Population 48
4.4.2 Food Store Access: Percent Black Population 49
4.4.3 Food Store Access: Percent Asian Population 51
4.4.4 Food Store Access: Percent Hispanic Population 54

vi
4.4.5 Food Store Access: Education Levels 56
4.4.6 Food Store Access: Income Levels 58
4.4.7 Food Store Access: Household Poverty Levels 59
4.4.8 Food Store Access: Population Density Levels 61
CHAPTER 5: DISCUSSION AND CONCLUSION 63
5.1 Summary of Results 63
5.2 Significance of Findings 65
5.3 Future Research 66
REFERENCES 68
APPENDIX A: NEIGHBORHOOD DATA HISTOGRAMS 73
APPENDIX B: EXPLORATORY REGRESSION REPORT AND TABLE RESULTS 77

vii
LIST OF TABLES
Table 1 Summary of Business Dataset 17
Table 2 Supermarkets with Most Locations 18
Table 3 Small Grocery with Most Locations 19
Table 4 Convenience Stores with Most Locations 19
Table 5 Fast Food Restaurants with Most Locations 20
Table 6 Summary of Spatial Datasets 26
Table 7 Summary of Neighborhood Characteristic Variables 32
Table 8 Summary of Food Access Controlling for Income and Minority 38
Table 9 Regression Result Report for Supermarkets 78
Table 10 Regression Result Report for Small Grocery 82
Table 11 Regression Result Report for Convenience Store 88
Table 12 Regression Result Report for Fast Food Restaurant 93

viii
LIST OF FIGURES
Figure 1 2010 Atlanta MSA Boundaries 3
Figure 2 Summary of Workflow 15
Figure 3 Data Collection Area 16
Figure 4 Supermarket Dataset 21
Figure 5 Small Grocery Dataset 22
Figure 6 Convenience Store Dataset 23
Figure 7 Fast Food Restaurant Dataset 24
Figure 8 Neighborhoods (Population Weighted Census Blog Group Centroids) 28
Figure 9 Network Distance Analysis Sample Result (Jasper County, GA) 30
Figure 10 Neighborhood Minority Groupings 36
Figure 11 Neighborhood Income Groupings 37
Figure 12 Neighborhood Food Access to Supermarkets 39
Figure 13 Neighborhood Food Access to Small Grocery 41
Figure 14 Neighborhood Food Access to Convenience Store 42
Figure 15 Neighborhood Food Access to Fast Food 44
Figure 16 Regression Results Report for Food Access to Supermarkets 45
Figure 17 Regression Results Report for Food Access to Supermarkets – Continued 47
Figure 18 Percent White Neighborhood Food Access 49
Figure 19 Percent Black Neighborhood Groupings 50
Figure 20 Percent Black Neighborhood Food Access 51
Figure 21 Percent Asian Neighborhood Groupings 52
Figure 22 Percent Asian Neighborhood Food Access 53

ix
Figure 23 Percent Hispanic Neighborhood Groupings 54
Figure 24 Percent Hispanic Neighborhood Food Access 55
Figure 25 Education Level Neighborhood Groupings 56
Figure 26 Education Level Neighborhood Food Access 57
Figure 27 Income Level Neighborhood Food Access 58
Figure 28 Poverty Level Neighborhood Groupings 59
Figure 29 Household Poverty Level Neighborhood Food Access 60
Figure 30 Population Density Neighborhood Groupings 61
Figure 31 Population Density Neighborhood Food Access 62
Figure 33 Percent White Histogram 73
Figure 34 Percent Black Histogram 73
Figure 35 Percent Asian Histogram 74
Figure 36 Percent Hispanic Histogram 74
Figure 37 Education Attainment Histogram 75
Figure 38 Median Household Income Histogram 75
Figure 39 Household Poverty Histogram 76
Figure 40 Population Density Histogram 76
Figure 41 Regression Result Report for Supermarkets 77
Figure 42 Regression Result Report for Small Grocery 81
Figure 43 Regression Result Report for Convenience Store 87
Figure 44 Regression Result Report for Fast Food Restaurant 92

x
LIST OF ABBREVIATIONS
ACS American Community Survey
CBG Census Block Group
GIS Geographic Information Systems
KDE Kernel Density Estimation
MSA Metropolitan Statistical Area
USDA United States Department of Agriculture

xi
ABSTRACT
Disparities in food access to different types of food stores are a key factor in assessing the health
of food environments. The spatial accessibility of food (hereinafter “food access”) refers to the
physical distance between food stores and the neighborhoods they service (Sharkey and Horel
2008; Larson et al. 2009). Nationwide studies of metropolitan and urban areas have shown that
low socioeconomic areas have fewer supermarkets and more convenience stores than high
socioeconomic areas (Morris et al. 1990; Cotterill and Franklin 1995). However, some more
recent studies of localized areas have found no evidence of a relationship between food access
and socioeconomic conditions (Alviola et al. 2013). Still others have found that deprived
minority neighborhoods exhibit better food access than wealthier areas (Sharkey and Horel
2008). Gaps exist in the literature for food access analyses at the local scale. The Atlanta-Sandy
Springs-Roswell, GA MSA is one such region lacking an empirical analysis of food access at the
neighborhood scale. To investigate the relationship between food access and neighborhood
characteristics, this study measures road network distance of neighborhoods, defined as the
population weighted centroid of Census Block Groups, to different types of food stores (chain
supermarkets, small grocery stores, convenient stores, and fast food restaurants) throughout the
2010 Atlanta MSA. The primary conclusion of this study is that food access to all food store
types in the Atlanta MSA is highest among high minority and low income neighborhoods. This
may speak more broadly to the differences in food access between urban and rural areas as the
majority of all types of food businesses are located in the densely populated areas surrounding
the city center of Atlanta. Future research should investigate how urban, rural, and suburban
neighborhood types shape food access in the Atlanta MSA.

1
CHAPTER 1: INTRODUCTION
Food access is a broadly used term to describe a key component of the food environment. Food
access refers to the distance one must travel to patron food stores offering affordable and healthy
food options (Sharkey and Horel 2008; Larson et al. 2009). Empirical evidence suggests a
relationship between people’s health and their food environment (Moreland et al 2002a; Sparks
et al 2009). A growing body of evidence indicates that residential segregation by income, race,
and ethnicity contributes to health disparities in the U.S. (Larson et al. 2009). This has inspired
researchers to investigate how disparities in food access contribute to this trend throughout the
U.S. Many empirical gaps exist with food access research. The Atlanta MSA is an example of a
heavily populated region without such a study.
1.1 Why Food Access Matters
There are many factors affecting a population’s diet and therefore health, including food access
(Yamashita and Kunkel 2010). Some studies have concluded that people with higher access to
supermarkets and limited access to convenient stores have healthier diets and lower levels of
obesity (Moreland et al. 2006; Larson et al. 2009). Longitudinal studies further demonstrate this
relationship by showing an increase in general health conditions when a supermarket is
introduced to a neighborhood where one had not previously existed (Moreland et al. 2002a).
Food access can have a large impact on the shopping habits of individuals, particularly in
economically deprived neighborhoods. Households in these neighborhoods often have lower
access to private transportation and must rely on public transportation or walking to purchase
food (Moreland et al. 2002a, 2002b; Shaw 2006). This is even more concerning for rural areas
where daily public transportation is not available. When people use public transportation or

2
walk to access food stores they are limited to purchase what they can carry. This limits them to
only the most essential products, including non-food items.
Disparities in food access throughout the U.S. are of great concern because of its
potential effect on a population’s overall health and risk of chronic disease (Larson et al. 2009).
Given the well documented racial disparities in the rates of chronic diseases in the U.S., with
African Americans exhibiting the highest rates (Zenk et al. 2005), it is easy to understand how
food access is considered an important social justice issue (Pearce et al. 2005; Apparicio et al.
2007). While studies in the U.S. have not reached a consensus on the characteristics of areas
with poor food access, these areas often lack access to other services as well, such as banks,
health care, transportation infrastructure, and public parks (Dutko et al. 2012).
1.2 Existing Research Gaps
Empirical gaps exist in research focusing on food environments at the local neighborhood scale
that control for socioeconomic conditions and different types of food stores (Sharkey and Horel
2008). Investigating neighborhood disparities in food access to both healthy and unhealthy food
stores throughout an entire geographic landscape is essential for developing public health
policies and strategies aimed at reducing health inequalities (Larson et al. 2009). The Atlanta
MSA is an example of a region lacking this type of research.
The Atlanta MSA is one of the largest and fastest growing regions in the U.S., exhibiting
a 72% population increase from 1990 to 2010 and ranked 9th in total population in the 2010
census (U.S. Census 2012). A comprehensive literature review of food environment research
found only one study covering the Atlanta MSA. The study completed by Helling and Sawicki
in 2003, analyzed access to a range of services, not just food stores, while controlling for race
(whites and blacks) and income. One conclusion they reached was that black neighborhoods do

3
not have worse access to fast food restaurants and grocery stores than white neighborhoods
(Helling and Sawicki 2003). There are several factors that explain why their research does not
satisfy the need for empirical research on food access in the Atlanta MSA. The first is the
geographic extent of the study which only covered a 10 county area of the Atlanta MSA. Their
justification was that 85% of the region’s jobs and 87% of its population were found in their 10
county study area. Figure 1 shows the boundaries of my study which are consistent with the
2010 Atlanta MSA boundaries, comprised of 28 counties. The very nature of empirical research
is that it does not focus on select neighborhoods within a community, but rather the totality of the
area.
Figure 1 2010 Atlanta MSA Boundaries

4
The second factor explaining why the 2003 study does not satisfy the need for empirical
research on disparities in food access throughout the Atlanta MSA is the geographic scale in
which it was carried out. The Helling and Sawicki (2003) study used census tracts to represent
neighborhoods and carry out subsequent spatial analyses. It is important to examine disparities
in food access at as fine a geographic scale as feasible (Raja et al. 2008). Conducting similar
analyses at a finer scale, such as the census block group, should provide more meaningful results
than a more aggregated unit such as census tracts. The analysis completed in my thesis is unique
in that it covers the entire 2010 Atlanta MSA, over double the size of a previous study, and
defines neighborhoods at the most precise geographic scale available, the census block group.
1.3 Objective
My study is in support of the greater body of research on inequalities in food access throughout
the United States. It does so through empirical analysis of disparities in food access at the
neighborhood scale and exploring any correlations of food access with socioeconomic and
demographic characteristics in the Atlanta MSA, one of the largest and fastest growing
metropolitan areas in the U.S. The research questions addressed in this thesis for the 2010
Atlanta MSA are (1) how does food access differ in predominately white neighborhoods as
compared to neighborhoods of minority composition, specifically blacks, Asians, and Hispanics
and (2) How does food access differ in high income neighborhoods as compared to low income
neighborhoods?
The remainder of this thesis is divided into four chapters. In Chapter Two, I discuss the
early research on food environments, the social and physical attributes shaping food
environments, defining food environments in the context of modern food movements, and
different quantitative methods of assessing food environments using a GIS. In Chapter Three, I

5
describe the framework of my research, data sources, the metrics that are calculated and mapped,
and the expected outcomes. In Chapter Four, I document and interpret the study outcomes. In
Chapter Five, I discuss key observations and their contribution to existing research on food
environments in the U.S. I conclude this thesis by identifying future research directions in
analyzing food environments.

6
CHAPTER 2: BACKGROUND AND LITERATURE REVIEW
It is important to understand the significance of disparities in food access among the greater body
of literature on food environments. This chapter examines the origins of food environment
research and different approaches to studying it, including food access.
2.1 Early Research on Food Environments
Much of the initial research on food environments began in the UK with studies focusing on the
relationship between poverty and food. Cole-Hamilton and Lang (1986) were the first to note
the potential risk that consumers, particularly those who live in poor areas, may face higher food
prices as a result of the realities of food business industry (Cummins and Macintyre 2002). They
confirmed that small food stores, typically found in impoverished neighborhoods throughout
London, charged over 20% more than large, corporate owned supermarkets (Cole-Hamilton and
Lang 1986). What followed were a series of studies focusing on a range of conclusions related
to the cost and availability of healthy foods throughout Britain. It was found that healthy foods
were more expensive and less available than unhealthy foods, particularly in deprived
neighborhoods (Mooney 1990). Several researchers had similar conclusions for cities
throughout Britain. This led to scattered investigations of food environments throughout North
America.
2.2 Ways of Thinking about the Food Environment
There are multiple ways of thinking about the food environment, each emphasizing different
factors shaping healthy food consumption. It is important to understand these approaches as they
are strongly influenced by area of interest, geographic scale, and location.

7
2.2.1 Key Factors Shaping the Food Environment
There are three key factors to consider when assessing the food environment: availability, cost,
and attitude (Shaw 2006). These factors have the greatest influence over people’s consumption
of healthy foods. The cost of food is a significant factor because the same basket of food can
cost significantly more or less depending the type of food store it is purchased (Cummins and
Macintyre 2002). Food availability refers to the distance one must travel to obtain affordable,
healthy food. Travel distance can also be impacted by other geographic and social factors such
as physical barriers from major highways and high crime rates, respectively. Attitude refers to
any state of mind preventing that individual from consuming a healthy diet where availability
and cost are non-factors. The most important characteristics to consider when assessing the food
environment are cost and availability (Moreland et al. 2006).
Food access is of particular concern in economically deprived areas. Households in these
neighborhoods often have lower access to private transportation and must rely on public
transportation or walking to purchase food (Moreland et al. 2002a, 2002b; Shaw 2006). This is
even more concerning for rural areas where daily public transportation is not available. When
people use public transportation or walk to access food stores they are limited to purchasing what
they can carry. This limits them to only the most essential products, including non-food items.
As such, travel distance has a large impact on the shopping habits of individuals.
The cost of food plays an important role in food shopping and dietary habits as well.
People often cite cost as the limiting factor for their lack of healthy food consumption (Nord and
Andrews 2002). This association is further solidified by studies showing a positive relationship
between adhering to dietary recommendations and household income (Jetter and Cassady 2006).
Given that low income households spend a greater percentage of their overall budget on food it is

8
not surprising that healthy dietary habits suffer due to budget constraints (Moreland et al. 2002a).
Similarly, decreases in food insecurity nationwide were consistent with rising incomes between
1995 and 2001 (Nord and Andrews 2002). These studies solidify the relationship between food
costs and food consumption habits.
2.2.2 Schools of Thought: Defining Food Accessibility
There are several key terms used in scientific literature, public policy, and movements to
describe the food environment: food sovereignty, foodscape, food justice, food insecurity, food
swamps, and food deserts. The suitability of each term in addressing challenges of the food
environment is dependent on scope, geographic scale, and location.
Food sovereignty is related to the right to have rights over food production and
consumption in one’s own lands, territory, or country. It approaches the food environment from
a global scale and focuses on the rights of corporations versus the rights of people, international
banking systems, and neoliberal trade agreements. The aim is to restore control over food access
and production from large corporations and international financial institutions back to native
populations who ultimately produce the food and those who eat it (Schiavoni 2009). The term
originates from Via Campesina: International Peasant Movement, an organization composed of
local farming groups from around the globe.
Many of the issues of food sovereignty are the result of neoliberal policies driving global
markets. Trade agreements on agricultural commodities favor corporations and industrialized
nations (Alkon and Mares 2012). One way this occurs is less developed nations, or peasant
nations, are forced to remove trade tariffs which help subsidize food production. At the same
time, the industrialized nation can afford to subsidize food operations and is not barred from
doing so. It is not an oversimplification to say that the corporate food industry disenfranchises

9
food producers and consumers in peasant nations (Alkon and Mares 2012). There are challenges
to achieving food sovereignty within industrialized nations; however, they seem more aligned
with the foodscapes and the food justice movement.
The challenges to achieving food sovereignty in the U.S. are grossly different than those
faced by peasant nations. In many ways, the foodscapes and food justice movements are the
embodiment of food sovereignty in developed nations. Foodscapes is most similar to food
sovereignty. It views the food environment from a holistic approach by considering all the social
and environmental factors affecting food production, retailing, and consumption at a range of
scales (Miewald and McCann 2014). The movement is more focused on the existing power
structures affecting social and business conditions shaping poor food environments. The food
justice movement has a narrower scope.
The food justice movement is one of the more discussed food environment approaches in
the U.S. Food justice places the need for food security and food access in the contexts of
institutional racism, racial formation, and racialized geographies (Alkon and Norgaard 2009).
The movement is set up as a means for active participation in lobbying for changes in local food
environments. The approach is still somewhat broad and includes many aspects of the food
environment, including local food production and consumption. Beyond race, food justice
encompasses class and gender, and considers how they impact who can produce and consume
what kinds of food (Alkon 2014). This carries some overlap with the food insecurity concept.
The term food insecurity specifically refers to households that do not have consistent
access to quantities of food required to support an active and healthy lifestyle (Nord and
Andrews 2002). Households experiencing the following conditions are considered food
insecure: worried whether food will run out before they have the money to purchase more, food

10
purchased did not last and they did not have money to buy more, and they could not afford to eat
healthy, balanced meals. In 1996, the U.S. government formally addressed food insecurity by
adopting the Rome Declaration at the World Food Summit. The declaration sets the goal of
reducing food insecurity in half by 2010 (Nord and Andrews 2002). Food insecurity has the
narrowest focus of the approaches discussed to this point by focusing primarily on a population’s
ability to purchase affordable and healthy food. There are more variables to consider including
social demographics and food store types.
The term food swamp refers to areas where high caloric, energy dense food stores
inundate healthy food options (Rose et al. 2009). Food swamps can carry greater risks to public
health than food deserts (Economic Research Service 2009). Several researchers have found
positively correlated associations between the density of convenient stores and fast food
restaurants in an area with the population’s body mass index (Moreland et al. 2006 and Rose et
al. 2009). Furthermore, research shows that introducing a supermarket to areas over saturated
with unhealthy food options only incrementally improves the overall health of the respective
population (Economic Research Service 2009). This suggests that an inadequate food
environment (defined as poor access to affordable and healthy food) is less detrimental than an
overabundance of unhealthy food options in a food swamp.
In the early 1990’s, the term food desert was first used by an urban resident in Scotland to
describe his experience living in an economically deprived area where food was relatively
unavailable (Cummins and Macintyre 2002). Food desert is a vague term used to describe areas
with poor access to healthy food. The U.S. government defines food deserts, per the 2008 Farm
Bill, as low income areas with limited access to affordable and nutritious food. Food deserts are
census tracts which fall outside the distance threshold to supermarkets and are considered low

11
income. The distance threshold is 1 mile for urban designated areas and 10 miles for rural
designated areas. The economic thresholds are based on household incomes relative to the
surrounding area. Low income areas are defined as census tracts with a median family income
that is 80 percent or less of the metropolitan area’s median family income or the statewide
median family income (Dutko et al. 2012).
A food desert is likely the most commonly known word in the vocabulary of food
environments. It has captured the attention of the public, government, and academia (Cummins
and Macintyre 2002). Despite the precise definition of food deserts in U.S. legislation, the term
is used more like a metaphor. Some studies view food deserts as areas devoid of supermarkets
and large grocery stores (Hoesen et al. 2013) while other studies only consider areas devoid of
supermarkets (Sparks et al. 2009). Both methods are reasonable for studying food environments
however they are not comparable.
Raja et al. (2008) argues that the “shifting” definition of food deserts is due to the lack of
empirical research on nature, extent, and location of food stores and disparities in access to them.
The problem with focusing too much on food desert analyses (as defined in the 2008 Farm Bill)
is they are akin to a site suitability analysis. They ignore data in areas which fall outside the set
of strict economic conditions leaving data only explored in the most impoverished
neighborhoods of a study area. The USDA created a website called the searchable online
interactive map called the “Food Desert Locator”. The website contained an interactive map that
identified census tracts classified as food deserts. However the website was taken down in 2014
and replaced with the “Food Environment Atlas” website (USDA 2014). The Atlas has two
objectives: (1) stimulate research on the determinants of food choices and diet quality and (2) to
provide a spatial overview of community’s ability to access healthy food. This shift in the

12
USDA’s outward facing data gateway for food environment research is in line with a broader
and arguably greater understanding of the food environment.
It is fair to say that although the investigation completed in this thesis report specifically
focuses on food access it still falls in the food desert approach. Food desert studies are largely
based on quantitative techniques and GIS (McKinnon et al. 2009). They involve a static
investigation of food access controlling for neighborhood conditions (usually economic status).
Unlike the other approaches discussed in this section, food deserts studies do not consider the
broader factors dictating food environments (political influences, laws governing corporations,
and large scale food production).
2.3 Geographic Information Systems and Food Access
Geographic information systems (GIS) play an important role in analyzing local food
environments. There are two primary methods of assessing the local food environment using a
GIS. One measures the density of food stores in an area and the other measures their proximity
to other locations, such as neighborhoods (Charreire et al. 2010). Both of these approaches,
density and proximity, align with the broader analytical methods of identifying food deserts.
Charreire et al. (2010) completed a comprehensive review of food environment studies
with methodologies utilizing a GIS from 1999 to 2008. They found that the density approach
utilizes the buffer, kernel density estimation, or spatial clustering tools with the primary tool
being the buffer method. Of these studies the most common location source for buffers (in order
from greatest to least) are homes, schools, food stores, and neighborhood centroids. The
researchers looked to identify the density of various types of food stores around these locations.
In 2008, Zenk and Powell conducted a nationwide study looking at the concentration of fast food
and convenient stores around schools, while controlling for socioeconomic demographic data at
13
the census tract level. They utilized a half-mile buffer and found that schools in low income
census tracts had more fast food and convenient stores concentrated around them than schools in
wealthier census tracts (Zenk and Powell 2008).
A potentially significant problem with the buffer approach is that it ignores data which
falls outside the buffer zone. While this is an inherent consequence of the buffer tool it can
mislead researchers when target locations fall within a statistically insignificant distance beyond
the buffer. For example, several studies utilize a one mile buffer as an acceptable walking
distance to a supermarket (Charreire et al. 2010; Dutko et al. 2012). If a supermarket is 1.01
miles from the source location the density value will not consider the store even though the extra
1% in distance would not likely preclude a customer who would otherwise walk one mile to the
store. Results for the kernel density estimation (KDE) and spatial clustering tools are not based
on hard geographic boundaries. Based on the methodological review completed by Charreire et
al. (2010), few studies utilize KDE and spatial clustering tools to assess the food environment.
The proximity method is advantageous because it is a data inclusive approach,
unrestricted by administrative boundaries, such as ones created by the buffer tool or areal units.
Proximity studies assess the distance to food stores by utilizing different types of distance
measurements. There are three mthods of measuring distance using a GIS: Euclidean,
Manhattan, and network; they are explained in Chapter 3. A nationwide study of New Zealand
utilizes a similar analysis to the one proposed in my study. They utilize the network distance
approach from different food stores to neighborhood centroids derived from New Zealand’s
census areal units. They found that access to fast food stores is greater in poorer neighborhoods
than wealthier neighborhoods (Pearce et al. 2007).

14
Building on the approach by Sharkey and Horel (2008), I employ a proximity approach to
investigate food access at the neighborhood scale in the Atlanta MSA while controlling for
different types of food stores, race, and income. These methods are discussed in greater detail in
Chapter 3.

15
CHAPTER 3: METHODOLOGY
A case study is undertaken to analyze disparities in food access to different types of food stores
at the neighborhood scale and explore any correlations of food access with socioeconomic and
demographic characteristics. The methodology for my study is adapted from one developed by
Sharkey and Horel (2008), who conducted a food environment study investigating any
relationship of neighborhood socioeconomic condition and minority composition with the spatial
availability of food store types.
My investigation utilizes a GIS to calculate the network distance of different food store
types to the population weighted centroid of each census block group in the Atlanta MSA. The
results of the respective network proximity analyses are then explored against their respective
neighborhood minority composition and socioeconomic condition. Neighborhoods are grouped
by racial and economic status and compared against their average distance to each food store
type. Figure 2 provides a summary workflow of my study.
Figure 2 Summary of Workflow
My study is in support of the greater body of research on inequalities in the food
environment throughout the United States. While it does not address all aspects and methods of
defining and analyzing the food environment, it does assess any spatial relationship between
socioeconomic and demographic patterns with the availability, defined as road network distance,
of food store types in the Atlanta MSA.

16
3.1 Geographic Data Sources
The primary datasets for this study contain information on the population, food businesses, and
road network of the Atlanta MSA. Data for this study is primarily collected through two sources,
(1) Esri’s Business Analyst data suite and (2) the U.S. Census Bureau which house demographic
data and census areal unit shapefiles. In an effort to reduce any potential error along the
boundary extent of the study area, food business and road network data were collected for the
adjacent counties surrounding the Atlanta MSA. These areas are delineated in Figure 3.
Figure 3 Data Collection Area

17
3.2 Description of Spatial Datasets
This study extracts food business data from Esri’s Business Location database, which utilizes
Dun & Bradstreet’s (hereinafter “D&B”) proprietary business database supplemented by the
following publicly available sources: business registries, internet/web mining, news and media
reports, telephone directories, court and legal filings, company financials, banking information,
directory assistance, industry trade data, and telephone interviews (Esri 2013). Several studies
involving the geographic analysis of the food environment utilize the D&B dataset (Alviola et al.
2013). It classifies the businesses by the six-digit North American Industry Classification
System (NAICS). NAICS was developed by the U.S. Census Bureau, Bureau of Labor
Statistics, Bureau of Economic Analysis, and Office of Management and Budget to standardize a
classification system for collecting, analyzing, and publishing statistical data related to the U.S.
business economy (U.S. Census Bureau 2014a). Table 1 contains a list of the NAICS codes of
food businesses used for this study. The business datasets extracted from Esri’s Business
Location Data required.
Table 1: Summary of Business Dataset
Dataset NAICS Code NAICS Description Initial / Final Counts
Supermarket 44511001 Supermarkets & Other Grocery Stores
525 / 496
Small Grocery 44511001 Supermarkets & Other Grocery Stores
673 / 640
Convenient Store 44512001 & 44719005
Convenience Stores & Other Gasoline Stations
3,130 / 3,005
Fast Food Restaurant
72211019 Full-Service Restaurant 8,175 / 2,158

18
The supermarket dataset is composed of supermarkets and large grocery stores, above
2,500 square feet. The dataset extracted from Esri’s database includes grocery stores of all sizes.
In an effort to remove smaller groceries, which typically sell low nutritional value foods at
higher prices (McEntee and Agyeman 2009), locations less than 2,500 square feet were placed in
the small grocery dataset. This reduced the supermarket dataset from 1,198 to 525 businesses.
Publix As shown in Table 2, supermarkets and Kroger have the highest number of locations in
the Atlanta MSA.
Table 2: Supermarkets with most locations
Company Name Count
Publix Super Market 144
Kroger 126
Ingles Market 53
Piggly Wiggly 25
Food Lion 21
The dataset was then reviewed to ensure each feature class is accurately categorized as a
supermarket. Any data point without a recognized company name was reviewed using Google
Street Maps. The final supermarket count is 493. Due to the size of the study area and the
number of supermarkets it was not possible to confirm whether each business is in operation.
The small grocery store dataset is composed of a subset of the Supermarket & Other
Grocery Stores dataset. It consists of locations which fall below 2,500 square feet. Small
grocery stores typically sell low nutritional value foods at higher prices (McEntee and Agyeman
2009). Table 3 highlights the small grocery stores with the greatest number of locations in the

19
Atlanta MSA. The dataset was reviewed for duplicate addresses. The final small grocery store
count is 640.
Table 3: Small Grocery with most locations
Company Name Count
ALDI 23
Food Depot 4
Wayfield Foods 3
The convenience store dataset is composed of Convenience Stores & Other Gasoline
Stations extracted from Esri’s database. It consists of 3,130 locations throughout the study area.
The study area is too large to verity each feature; however, some data quality analysis was
possible. Duplicate addresses were removed from the dataset. The final convenience store count
is 2,986. Table 4 contains a list of the convenience stores with the most locations in the study
area.
Table 4: Convenience stores with most locations
Company Name Count
Shell Food Mark 117
Quik Trip 109
Chevron Food Mart 103
BP 67
CITGO Food Mart 56
The fast food restaurant dataset is composed of a subset of the Full-Service Restaurant
category of NAICS (see Table 1). This dataset contains all of the restaurants in the study area (n

20
= 8,975). Since this dataset should only consist of fast food restaurants, any business not
considered a chain fast food restaurant was removed from the dataset. The final count of the fast
food restaurant dataset is 2,153. Of the locations removed from the dataset, several businesses
could be argued as a type of fast food restaurant. Given the size of the study area it is impossible
to review each business’ menu and restaurant format. Therefore the focus of the fast food
restaurant dataset is on national fast food chain restaurants. Table 5 contains a list of the
businesses with the highest number of locations within the study area.
Table 5: Fast food restaurants with most locations
Company Name Count Subway 426 Mc Donald’s 264 Wendy’s 168 Chick-fil-A 131 Burger King 125 Zaxby’s 104 Taco Bell 98 KFC 88 Arby’s 82 Dairy Queen 81
All four business datasets are below in Figures 4-7. The black boundary represents the
data collection extent while the red boundary represents the Atlanta MSA (study area).

21
Figure 4 Supermarket dataset (n = 493)
The supermarket dataset shows a cluster of locations in the center of the MSA, the
location of the City of Atlanta. From there, the majority of locations are dispersed throughout
the suburban region which circles the city. Most locations are in the northern suburbs. The rural
areas have few locations. Some clusters exist in rural city centers primarily to the southern and
western areas of the MSA.

22
Figure 5 Small grocery store dataset (n = 640)
The small grocery store dataset exhibits a more clustered distribution than the
supermarket dataset. Locations are highly concentrated in the downtown areas and are less
dispersed throughout the suburban region. There is little representation of this type of food store
in rural areas, particularly to the southeast. However there are a greater number of small grocery
stores than supermarkets along the northern boundary of the MSA.

23
Figure 6 Convenience store dataset (n = 3,986)
The convenience store dataset contains the most locations of all the food store types
included in this study. The majority of locations are in the urban and rural regions, with several
clusters located in rural city centers. Convenience stores are less dispersed than supermarkets
and small grocery stores but still have representation scattered throughout rural areas

24
Figure 7 Fast food restaurant dataset (n = 2,153)
The fast food restaurant dataset contains the second most food store locations for this
study. The locations are primarily located in the urban and suburban regions with clusters in
rural city centers. Similar to the small grocery store dataset, fast food restaurants are not heavily
located throughout the rural regions of the Atlanta MSA.
Demographic data is primarily available from Esri’s Business Analyst data suite and the
U.S. Census Bureau’s online data gateway website, American FactFinder
(http://www.factfinder2.census.gov/) and American Community Survey (hereinafter “ACS”;

25
http://www.census.gov/acs). Data is collected at two scales (areal units): block level and block
group level. The block areal unit data is only available through Esri’s Business Analyst data
repository. It is used to identify the neighborhood locations by means of a population weighted
centroid analysis for each block group in the study area. The demographic data collected at the
block group areal unit is used to investigate the spatial relationship between the food
environment and socioeconomic conditions at the neighborhood scale.
Block group attribute data is only available through the ACS and not the primary census
data gateway website, American Fact Finder. The U.S. Census Bureau collects and distributes a
vast amount of individual’s personal information. To protect the privacy of individuals
throughout the population, the data is aggregated to different scales. Since block group sizes are
small, ranging from 600-3,000 people or 240-1,200 housing units, information collected from the
decennial census is withheld from the general public. As such, detailed information on the
population and the block group areal unit are only available through estimates delineated from
community surveys, or the ACS. The attributes used in this study are discussed in Section 3.4
and highlighted in Table 7.
The ACS data was retrieved using the Summary File Data Retrieval Tool, a zipped excel
file that enables the user to load block group level census data at the state level. The 5-year data
table estimates (2006-2010) were used due to the availability of block level data which is not
accessible at the 1- and 3-year estimates.
Road network shapefiles are available from the U.S. Census Bureau at the county level.
In 2010, the Atlanta MSA covered twenty-eight counties. Since the data is only available at the
county level and there are over thirty counties (including counties adjacent to the study area), this
study utilizes a detailed road network shapefile available through Esri. The road network

26
shapefile is current through 2005. The shapefile was converted to a road network using Esri’s
New Network Dataset tool in ArcCatalog so it may be used as a network file in Esri’s Network
Analyst extension. The default settings were used with length units measured in meters
(consistent with NAD83 UTM Zone units).
Table 6: Summary of spatial datasets
Dataset File Type Data Type Details Quality Source
Food Business Data Shapefile Vector
(point)
Supermarkets, convenient stores, fast-food restaurants
High (proprietary dataset)
Esri, Inc.
Road Network Shapefile Vector (polyline)
All streets and highways
High (proprietary dataset)
Esri, Inc.
Census Areal Unit (block & block group)
Shapefile Vector (polygon)
Units within Atlanta MSA
High (acquired from original source)
U.S. Census Bureau & Esri, Inc.
Atlanta MSA Shapefile Vector (polygon) Study area
High (acquired from original source)
U.S. Census Bureau
3.3 Geographic Calculations
This project conducts two geographic calculations using Esri’s ArcGIS Spatial Analyst and
Network Analyst extensions. The Spatial Analyst extension is used for the neighborhood
calculation while the Network Analyst extension is used for the respective distance calculations.
3.3.1 Neighborhood Delineation
There are multiple approaches to delineating neighborhoods in a GIS. Most food environment
studies utilize predefined U.S. Census Bureau areal units because of how they collect and
aggregate demographic data. U.S. Census data is aggregated to the following units (starting with
the smallest) block, block group, census tract, county, and state. Most food environment studies
conducted in the United States define neighborhood scale at the census tract level (Economic

27
Research Service 2009; Charreire et al. 2010). Utilizing smaller areal units, such as the block
group, should increase the precision and accuracy of the analysis, and decrease the potential for
the modifiable areal unit problem (MAUP) by avoiding unnecessary data smoothing. The
MAUP is a type of statistical bias which occurs when analyzing spatially aggregated data such as
U.S. Census Bureau data. It refers to the unavoidable phenomena where identical analyses of the
same data produce varying results based on the scheme and level of data aggregation (Dark and
Bram 2007). The smaller areal units will also increase the precision of the network distance
measurements by increasing the volume of data points for a given area.
This study utilizes the population weighted centroid as opposed to the geographic
centroid of each CBG. Since the study area contains rural neighborhoods, which are typically
larger than urban CBG, the geographic center may not accurately represent the population center
of each neighborhood (Sharkey and Horel 2008).
The population weighted centroid of each census block group is calculated using the
Mean Center tool in the Spatial Statistic Toolbox of ArcGIS 10.2.2. The input feature class
consists of a block areal unit shapefile covering the Atlanta MSA. The attributes required to
complete the analysis are the 2010 population and the corresponding census block group ID.
The 2010 population field is assigned to the Weight_Field option and the census block group ID
field is assigned to the Case_Field option. The output is a point shapefile of population weighted
centroids for each CBG. The output feature class represents the neighborhoods used for the
network distance analysis. Figure 5 delineates the neighborhood centroids.

28
Figure 8 Neighborhoods (Population Weighted Block Group Centroids)
The neighborhood centroids, shown in Figure 8, show that the center of the MSA, which
coincides with downtown Atlanta exhibits the highest population densities, and therefore highest
concentration or cluster of neighborhoods. The suburban areas are primarily located north of
downtown. The majority of the MSA contains rural neighborhoods which appear dispersed
throughout the exterior half of the study area. There are some clusters throughout these areas
which indicate rural town and city centers.

29
3.3.2 Distance Measurements
Three types of distances may be measured in a GIS: Euclidean, Manhattan, and network.
Euclidean distance refers to the shortest distance between two points. This measure is most
appropriate when interested in the geographic distance (“as the crow flies”) between points.
Manhattan distance refers to the shortest distance between two points when restricted to a grid
pattern. The name Manhattan is appropriate as the best way to think about how this distance
works. If walking the streets of New York City you would be restricted to travelling along a grid
of 90 degree angles (or city blocks). As such, the measurement is most appropriate for city
centers and dense urban environments. Finally, the network distance refers to the shortest
distance between two points along a defined network, usually roads or trails. This measurement
is most appropriate when looking at transportation and travel times outside of a major, densely
populated city center. Residents in the Atlanta MSA have a high automobile dependency as
evidenced by the automobile share of home-based work trips being over 90% (Jeon et al. 2010).
The network distance measurement is therefore most appropriate for this study.
The network distance of neighborhood (CBG population weighted) centroids to the
nearest respective food store type is measured using the New Closest Facility tool in the Network
Analyst toolbox. The tool calculates the distances of each neighborhood centroid to the nearest
food store type, respectively. The tool was used three times, one for each food store type. In
each trial, the respective food store type shapefiles are designated as the Facilities input. The
neighborhood shapefile is designated as the Incidents input. The tool calculates the shortest
route along the road network from each incident (neighborhood) to each facility (food store
type). The output contains a vector shapefile of all the calculated routes with an FID field
corresponding to each neighborhood and a distance field in meters. The three network distances

30
attributes for each neighborhood are added to the neighborhood centroid shapefile. These
network distance measurements are used in the OLS linear regression analysis and for
comparison against different types of neighborhoods. A subset of the network distance analysis
results for neighborhoods in Jasper County, GA are highlighted in Figure 9.
Figure 9 Network Distance Analysis Sample Result (Jasper County, GA)
3.4 Statistical Analysis
There are two types of statistical analyses used in this study. The first investigates access
to each respective food store while simultaneously controlling for both neighborhood income and
minority composition. The second analysis looks at each neighborhood characteristic and
investigates how food access varies as the degree or severity of each variable changes.

31
This study set also set out to create a regression model to explore causality of
neighborhood food access. The Exploratory Regression tool is part of the Spatial Statistics
toolbox in ArcGIS. It performs a linear regression analysis to predict the relationship between a
dependent variable and a set of independent variables. The model is run four times, once for
each network distance measurement to each respective food store type. The count (N) for each
model is equal to the number of neighborhoods in the MSA which is 2,583. The dependent
variable is the network distance measurements. The independent variables, shown in Table 7,
consist of neighborhood socioeconomic and demographic attributes. These were collected and
from the U.S. Census Bureau (ACS 5-year estimates) and Esri’s Business Analyst data suite.
The hypothesis of the regression analyses is that the dependent variable will increase as evidence
of neighborhood deprivation increase. Similarly, the dependent variable will decrease as
evidence of neighborhood deprivation decrease.
During the investigation it became apparent that this approach could be problematic due
to the number of independent variables non-normally distributed throughout the Atlanta MSA.
Appendix A contains histograms for each explanatory variable. Of them, only the educational
attainment and median household income variables are normally distributed.

32
Table 7: Summary of Neighborhood Characteristic Variables
Variable Name Source Description
White, non-Hispanic (%) Esri, Inc. Percentage of white, non-
Hispanic residents
Black (%) Esri, Inc. Percentage of blacks
Asian (%) Esri, Inc. Percentage of Asians
Hispanic (%) Esri, Inc. Percentage of Hispanics
Educational Attainment
ACS (B99151)
Educational attainment for population above 15yr +
Median Household
Income Esri, Inc. Median household income
Household Poverty Status
ACS (B17017)
Percentage of households with income below poverty level in
the past 12 months Population
Density Esri, Inc. Population density of CBG per square mile
The first four variables (listed in Table 7) provide information on the racial composition
of each neighborhood; the remaining variables contain information of socioeconomic conditions
and population density. Each variable is investigated individually as neighborhoods are grouped
by standard deviation. The breakdown of groupings for all neighborhood characteristics are as
follows: High = greater than +0.5 STD, Medium = -0.5 to +0.5 STD, and Low = less than -0.5
STD. The average food access measurement to each food store type will be calculated for the
neighborhood groupings for comparison within each respective neighborhood characteristic.

33
3.5 Expected Outcome
There is some ambiguity in the literature regarding whether any correlation exists between
disparities in food access and socioeconomic status and minority composition of neighborhoods
(Sharkey and Horel 2008; Alviola et al. 2013). Neighborhoods with lower socioeconomic
conditions and higher minority composition were expected to have less access to supermarkets
and higher access to convenient stores and fast food restaurants. It also expected to find that the
inverse relationship is true: neighborhoods with higher socioeconomic conditions and of majority
composition have greater access to supermarkets than convenient stores and fast food
restaurants.

34
CHAPTER 4: RESULTS
This chapter documents disparities in food access to different types of food stores (supermarket,
small grocery, convenience, and fast-food) throughout neighborhoods in the Atlanta MSA.
Correlations with neighborhood minority composition and income are explored. The food access
measurement results for each neighborhood characteristic are also reported.
The chapter begins with Section 4.1 which details the neighborhood groupings
throughout the Atlanta MSA. These groupings were used for investigating correlations of spatial
access to food stores with neighborhood characteristics. Each grouping (minority and income)
are presented with one map per group in Sections 4.1.1 and 4.1.2, respectively. The maps bring
spatial context to Section 4.2 which details the food access measurement to each food store type
while controlling for neighborhood income and minority composition. There are four graphs
which support this section: supermarkets (Section 4.2.1), small grocery stores (Section 4.2.2),
convenience stores (Section 4.2.3), and fast-food restaurants (Section 4.2.4). The average,
minimums, and maximum food access measurements for each neighborhood grouping and food
store type is outlined in Table 8. Section 4.3 details the descriptive statistics results which group
each neighborhood characteristic into three groups: high, medium, and low. Each neighborhood
characteristic is reported in its own subsection and contains a map, providing spatial context to
the respective groups throughout the Atlanta MSA, and a graph reporting the average food
access measurement to each group for each of the four food store types.
4.1 Summaries of Neighborhood Groupings for Minority and Income
Each neighborhood in the study area was grouped by income and minority composition. These
groupings were used as controls for comparing food access measurements to the respective food
store types. The groupings are mapped in Figures 10 and 11 and the food access measurements,

35
controlling for neighborhood income and minority composition are presented in Figures 12
through 15.
4.1.1 Neighborhood Minority Groupings
The neighborhood minority groupings for the Atlanta MSA are shown below in Figure 10. The
majority of the MSA is covered by neighborhoods of low minority composition, especially in the
suburban and rural areas. Neighborhoods of high minority composition are mostly concentrated
in the urban areas, within and south of the downtown Atlanta. The region appears to be
segregated along racial lines with few areas of intermixed neighborhood types. Medium
minority neighborhoods mostly buffer the area between the high minority city center and the low
minority suburban and rural areas. There is a fair concentration of medium minority
neighborhoods in the rural areas along the southern boundary of the Atlanta MSA.

36
Figure 10 Neighborhood Minority Groupings
4.1.2 Neighborhood Income Groupings
The neighborhood income groupings for the Atlanta MSA are shown below in Figure 11. The
low income neighborhoods mostly fall along the boundaries of the Atlanta MSA, however there
are several neighborhoods dispersed throughout the region. There is a high concentration of low
income neighborhoods overlapping the area of high minority composition, within and south of
downtown Atlanta. High income neighborhoods mostly fall in the suburban areas north and

37
south of the Atlanta city center. Medium income neighborhoods are dispersed throughout the
region however they are mostly located in suburban areas circling the Atlanta city center and
rural areas to the north, east, and south.
Figure 11 Neighborhood Income Groupings
4.2 Food Store Access Controlling for Minority and Income
A summary of the averages, minimums, and maximum food access measurements, when
controlling for neighborhood income and minority composition for each food store type, is
presented in Table 8. Figures 12-15 highlight these results for each food store type.

38
Table 8: Summary of food access controlling for income and minority
4.2.1 Food Store Access: Supermarkets
Neighborhood food access measurements to supermarkets, shown in Figure 12 had varying
results when controlling for neighborhood income and minority composition. Food access to
supermarkets in low minority neighborhoods increased as neighborhood income increased (Low
Income = 4.2 miles; Medium Income = 3.1 miles; High Income = 2.0 miles). Neighborhoods of
medium and high minority composition had an inverse relationship where food access decreased
as income increased. Food access to supermarkets in neighborhoods of medium minority
composition was as follows: Low Income = 1.7 miles; Medium Income = 1.8 miles; High
Income = 1.9 miles. Food access to supermarkets in neighborhoods of high minority
composition was as follows: Low Income = 1.5 miles; Medium Income = 1.9 miles; High
Income = 2.3 miles. Neighborhoods of medium and high minority composition had similar food

39
access values when controlling for income. Food access to supermarkets in high income
neighborhoods, regardless of minority composition, was tightly grouped with values ranging
from 1.9 to 2.0 miles.
Figure 12 Neighborhood food access to supermarkets
-
0.5
1.0
1.5
2.0
2.5
3.0
3.5
4.0
4.5
5.0
Low Income [< -0.5 Std dev]
Medium Income [-0.5 - +0.5 Std dev]
High Income [> +0.5 Std dev]
Mile
s
Income
Supermarkets
Low Minority [< -0.5 Std dev] Medium Minority [-0.5 - +0.5 Std dev]
High Minority [> +0.5 Std dev]

40
4.2.2 Food Store Access: Small Grocery Stores
Neighborhood food access measurements to small grocery stores, as shown in Figure 13 had
varying results when controlling for neighborhood income and minority composition. Food
access to small grocery stores in low minority neighborhoods increased as neighborhood income
increased (Low Income = 4.3 miles; Medium Income = 3.6 miles; High Income = 2.9 miles).
Medium and high minority composition neighborhoods had a negative relationship where food
access decreased as income levels increased. Food access to small grocery stores in
neighborhoods of medium minority composition are as follows: Low Income = 2.2 miles;
Medium Income = 2.2 miles; High Income = 2.6 miles. Food access to small grocery stores in
neighborhoods of high minority composition are as follows: Low Income = 1.2 miles; Medium
Income = 1.9 miles; High Income = 2.5 miles. These trends are similar to those of food access to
grocery stores. In both cases, low minority neighborhoods showed significant increases in food
access as income increased. Medium and high minority neighborhoods had decreases in food
access as income levels increased, and high income neighborhoods for all minority composition
levels had a small range of food access (2.5 to 2.9 miles).

41
Figure 13 Neighborhood food access to small grocery stores
4.2.3 Food Store Access: Convenience Stores
Neighborhood food access measurements to convenience stores, shown in Figure 14 had varying
results when controlling for neighborhood income and minority composition. Food access to
convenience stores in low minority neighborhoods increased slightly between low income and
high income neighborhoods (Low Income = 1.9 miles; Medium Income = 1.6 miles; High
-
0.5
1.0
1.5
2.0
2.5
3.0
3.5
4.0
4.5
5.0
Low Income [< -0.5 Std dev]
Medium Income [-0.5 - +0.5 Std dev]
High Income [> +0.5 Std dev]
Mile
s
Income
Small Grocery
Low Minority [< -0.5 Std dev] Medium Minority [-0.5 - +0.5 Std dev]
High Minority [> +0.5 Std dev]

42
Income = 1.6 miles). Medium minority and high minority neighborhoods showed very similar
food access levels: Low Income = 0.8 miles; Medium Income = 1.1 miles; High Income = 1.6
miles and Low Income = 0.6 miles; Medium Income = 1.0 miles; High Income = 1.4 miles,
respectively. High income neighborhoods for all minority composition levels had a small range
of food access (1.4 to 1.6 miles).
Figure 14 Neighborhood food access to convenience stores
-
0.5
1.0
1.5
2.0
2.5
3.0
3.5
4.0
4.5
5.0
Low Income [< -0.5 Std dev]
Medium Income [-0.5 - +0.5 Std dev]
High Income [> +0.5 Std dev]
Mile
s
Income
Convenience Store
Low Minority [< -0.5 Std dev] Medium Minority [-0.5 - +0.5 Std dev]
High Minority [> +0.5 Std dev]

43
4.2.4 Food Store Access: Fast-Food Restaurants
Neighborhood food access measurements to fast food restaurants, shown in Figure 15 had
varying results when controlling for neighborhood income and minority composition. Food
access to fast food restaurants in low minority neighborhoods increased neighborhood income
increased (Low Income = 3.7 miles; Medium Income = 2.5 miles; High Income = 1.8 miles).
Medium minority and high minority neighborhoods showed very similar food access levels: Low
Income = 1.4 miles; Medium Income = 1.5 miles; High Income = 1.7 miles and Low Income =
1.1 miles; Medium Income = 1.4 miles; High Income = 2.1 miles, respectively. High income
neighborhoods for all minority composition levels had a small range of food access (1.7 to 2.1
miles).

44
Figure 15 Neighborhood food access to fast food restaurants
4.3 Regression Models
The results of the four regression models using the Exploratory Regression tool in ArcMap
provided unreliable results. The tool was used for each food store type to investigate causality of
food access measurements to neighborhood characteristics. The results report for the regression
model investigating food access to supermarkets is shown in Figures 16 and 17. This section
-
0.5
1.0
1.5
2.0
2.5
3.0
3.5
4.0
4.5
5.0
Low Income [< -0.5 Std dev]
Medium Income [-0.5 - +0.5 Std dev]
High Income [> +0.5 Std dev]
Mile
s
Income
Fast Food
Low Minority [< -0.5 Std dev] Medium Minority [-0.5 - +0.5 Std dev]
High Minority [> +0.5 Std dev]

45
discusses these results in detail and explains why their results are unreliable. The remaining
three regression analysis results, not discussed in this section, suffer from the same issues. Their
explanation is consistent with that described in this section for supermarkets. Appendix B
contains the results (both reports and tables) for all four analyses.
Figure 16 Regression Results Report for Food Access to Supermarkets
Figure 16 shows the output report from the Exploratory Regression tool in ArcGIS. It shows 5
of 7 summary outputs. The “AdjR2” column (far left) represents the degree of correlation
between the dependent and independent variables. The value ranges from 0 to 1. The “Model”
46
column (far right) shows which independent variables were used to determine the adjusted R2
value. The highest adjusted R2 value is 0.22. Two iterations came up with this value, shown in
the “Choose 5 of 7 Summary” section of Figure 16. Both iterations use five independent
variables. The first uses median household income, percent white, percent black, population
density, and educational attainment. The second iteration switches out percent black for percent
Asian. Ultimately, these R2 values are relatively small which means that variables not included
in the model are significantly affecting the dependent variable (food access measurements to
supermarkets).
The next section of the model output report, shown in Figure 17, shows that none of the
models were shown to be “passing models”. This means they did not meet the criteria of a
statistically significant or unbiased model. None of the models passed the Minimum Jarque-Bera
p-value (JB) or the Minimum Spatial Autocorrelation p-value (SA). These tests indicate the
level of biasness affecting model results. The JB values were all below 0.00000 meaning that
model residuals are non-normally distributed. This indicates that the results are bias and
therefore, not trustworthy. The same can be said for the SA measurement. None of the results
measured above 0.000000 meaning that there is significant spatial autocorrelation impacting
model results. Figure 17 shows the second half of the regression results report for food access to
supermarkets.

47
Figure 17 Regression Results Report for Food Access to Supermarkets - Continued
The report continues to demonstrate problems with result criteria. JB and SA values continue to
be shown well below acceptable levels. The summary of multicollinearity section shows that the
percent white and percent black variables provide very similar information for the model. This
means that these values follow a similar pattern in that as one value increases the other exhibits a
similar degree of decrease, and vice versa. This indicates that the majority of the population in
neighborhoods throughout the Atlanta MSA are either white or black. If the models were closer
to meeting the passing criteria, removing the percent black variable might increase model
performance.

48
4.4 Descriptive Statistics for Neighborhood Characteristics
Descriptive statistics were used as an alternative to a regression model as their results proved to
be unreliable. These analyses reveal how food access varies to each type of food store based on
the severity of each variable.
4.4.1 Food Store Access: Percent White Population
The neighborhood groupings for the percentage of white residents are the same as Figure 18 and
are therefore not shown in this subsection. Food access measurements to each type of food store,
shown in Figures 16, varied when controlling for the percent white population of neighborhoods.
There is a negative relationship between the food access measurements and the percentage of
white residents. In all four food store types, food access increases with decreasing percentage of
white residents in neighborhoods. All four food stores are more accessible in neighborhoods of
low white composition. This relationship is likely due to the location of high and low white
neighborhoods. The majority of low white neighborhoods, shown in Figure 10, are at the
outskirts of the MSA which are predominantly rural, low population density neighborhoods
where transportation is primarily attributable to privately owned vehicles. Neighborhoods have
the greatest access to convenience stores, followed by fast food restaurants, supermarkets, and
small grocery stores. In low white neighborhoods however small grocery stores are slightly
more accessible than supermarkets. Neighborhoods in the high white group must travel farther
to access food stores than neighborhoods in the low white group.

49
Figure 18 Percent white neighborhood food access
4.4.2 Food Store Access: Percent Black Population
The majority of neighborhoods in the Atlanta MSA, shown in Figure 19, fall in the low black
grouping. These neighborhoods fall outside of the downtown Atlanta area in the suburban and
rural regions of the MSA. Neighborhoods containing a high percentage of black residents fall
within the downtown Atlanta area and expand to the west, south, and easterly directions. There
are also some high black groupings to the south of the MSA and in rural town centers. Medium
0.0
1.0
2.0
3.0
4.0
5.0
Low White [< -0.5 Std dev]
Medium White [-0.5 - +0.5 Std dev]
High White [> +0.5 Std dev]
Mile
s
Groupings
Percent White Neighborhood Variable
Supermarket Small Grocery Convenience Fast Food

50
black neighborhoods are scattered throughout the southern half of the MSA and generally form a
ring around the downtown area forming a buffer between high and low black groups.
Figure 19 Percent black neighborhood groupings
Food access measurements to each type of food store, shown in Figure 20, varied when
controlling for the percent black population of neighborhoods. There is a positive relationship
between neighborhood food access measurements and percentage of black residents. Food
access for all four food store types increase as the proportion of black residents per neighborhood

51
increases. Neighborhoods in the low black group must travel farther to access food stores than
neighborhoods in the high black group.
Figure 20 Percent black neighborhood food access
4.4.3 Food Store Access: Percent Asian Population
The majority of neighborhoods in the Atlanta MSA, shown in Figure 21, fall in the low Asian
group. These neighborhoods are located in the rural areas surrounding the city to the north, west,
south, and southwest. The majority of high Asian neighborhoods are clustered in the
0.0
1.0
2.0
3.0
4.0
5.0
Low Black [< -0.5 Std dev]
Medium Black [-0.5 - +0.5 Std dev]
High Black [> +0.5 Std dev]
Mile
s
Groupings
Percent Black Neighborhood Variable
Supermarket Small Grocery Convenience Fast Food

52
northeastern region of the MSA. The largely suburban neighborhoods north and south of the
City of Atlanta fall into the middle Asian group.
Figure 21 Percent Asian neighborhood groupings
Food access measurements to each type of food store, shown in Figure 20, varied when
controlling for the percent Asian population of neighborhoods. The variation between the low
and high Asian neighborhood groups was not as severe as the white and black neighborhood
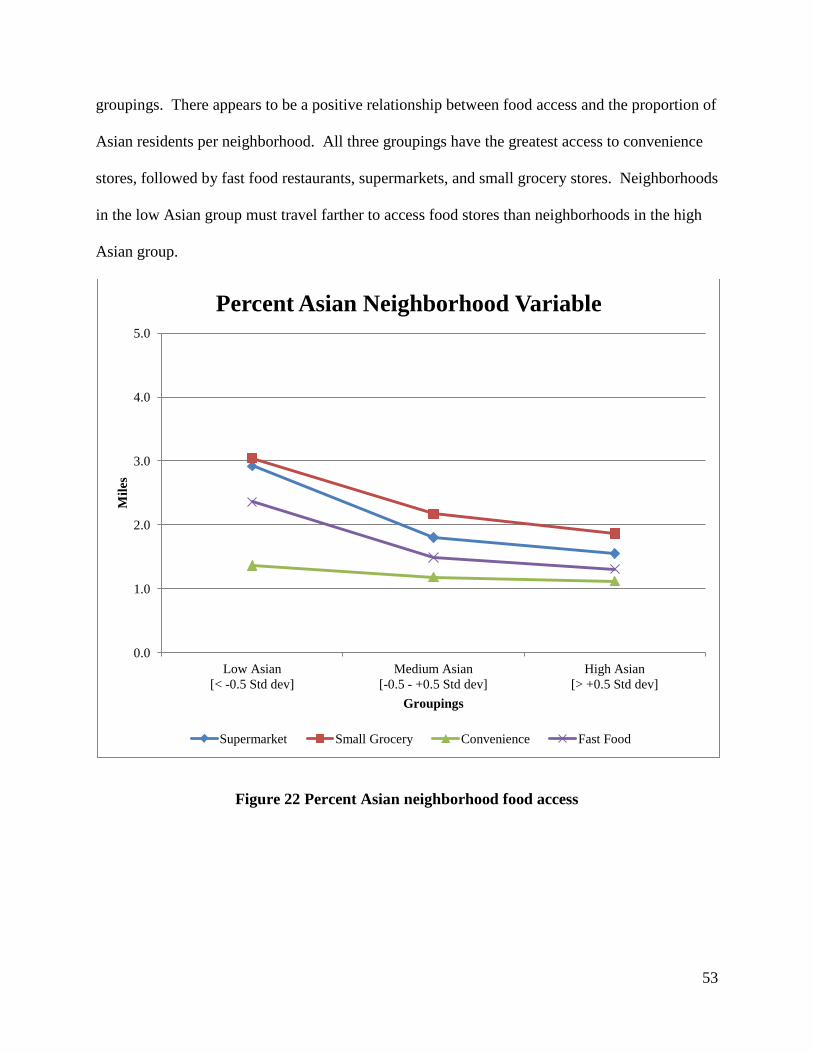
53
groupings. There appears to be a positive relationship between food access and the proportion of
Asian residents per neighborhood. All three groupings have the greatest access to convenience
stores, followed by fast food restaurants, supermarkets, and small grocery stores. Neighborhoods
in the low Asian group must travel farther to access food stores than neighborhoods in the high
Asian group.
Figure 22 Percent Asian neighborhood food access
0.0
1.0
2.0
3.0
4.0
5.0
Low Asian [< -0.5 Std dev]
Medium Asian [-0.5 - +0.5 Std dev]
High Asian [> +0.5 Std dev]
Mile
s
Groupings
Percent Asian Neighborhood Variable
Supermarket Small Grocery Convenience Fast Food
54
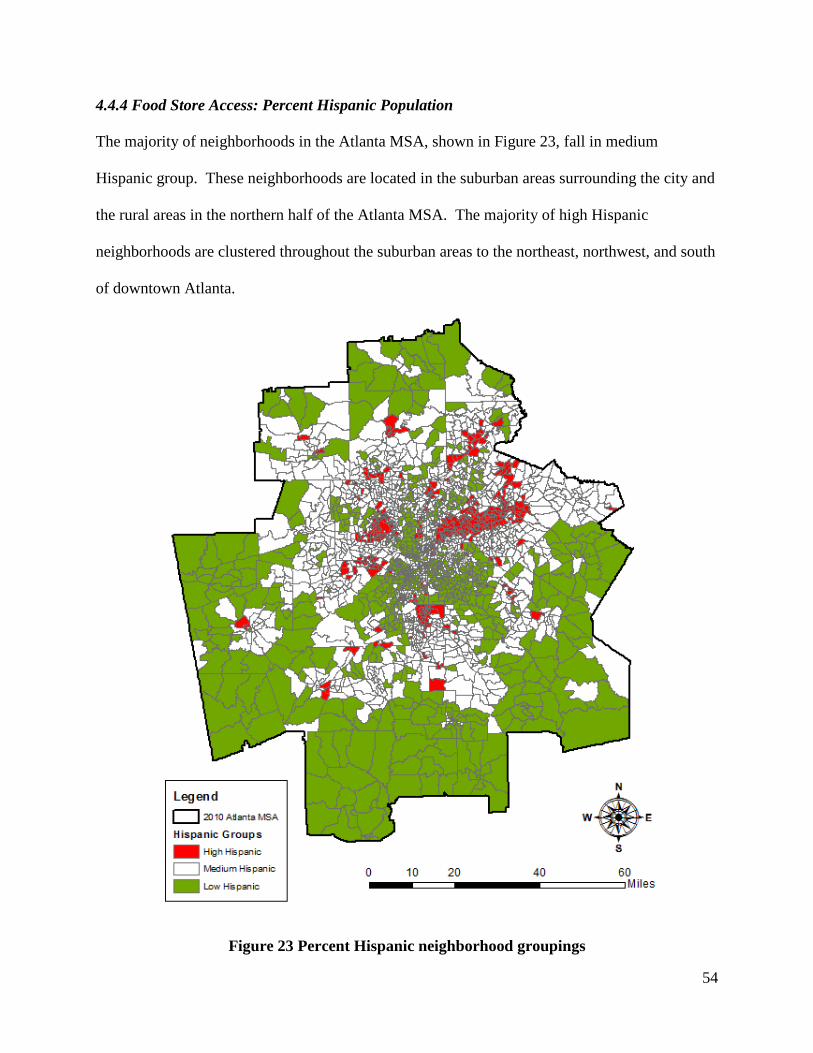
4.4.4 Food Store Access: Percent Hispanic Population
The majority of neighborhoods in the Atlanta MSA, shown in Figure 23, fall in medium
Hispanic group. These neighborhoods are located in the suburban areas surrounding the city and
the rural areas in the northern half of the Atlanta MSA. The majority of high Hispanic
neighborhoods are clustered throughout the suburban areas to the northeast, northwest, and south
of downtown Atlanta.
Figure 23 Percent Hispanic neighborhood groupings

55
Food access measurements to each type of food store, shown in Figure 24, varied when
controlling for the percent Hispanic population of neighborhoods. There is a positive
relationship between food access and the proportion of Hispanic residents per neighborhood. For
all four types of food stores, food access increases with increasing proportion of Hispanic
residents. All three groupings have the greatest access to convenience stores, followed by fast
food restaurants, supermarkets, and small grocery stores. High Hispanic neighborhoods are the
only exception where food access is greater for small grocery stores than supermarkets.
Neighborhoods in the low Hispanic group must travel farther to access food stores than
neighborhoods in the high Hispanic group.
Figure 24 Percent Hispanic neighborhood food access
0.0
1.0
2.0
3.0
4.0
5.0
Low Hispanic [< -0.5 Std dev]
Medium Hispanic [-0.5 - +0.5 Std dev]
High Hispanic [> +0.5 Std dev]
Mile
s
Groupings
Percent Hispanic Neighborhood Variable
Supermarket Small Grocery Convenience Fast Food
56
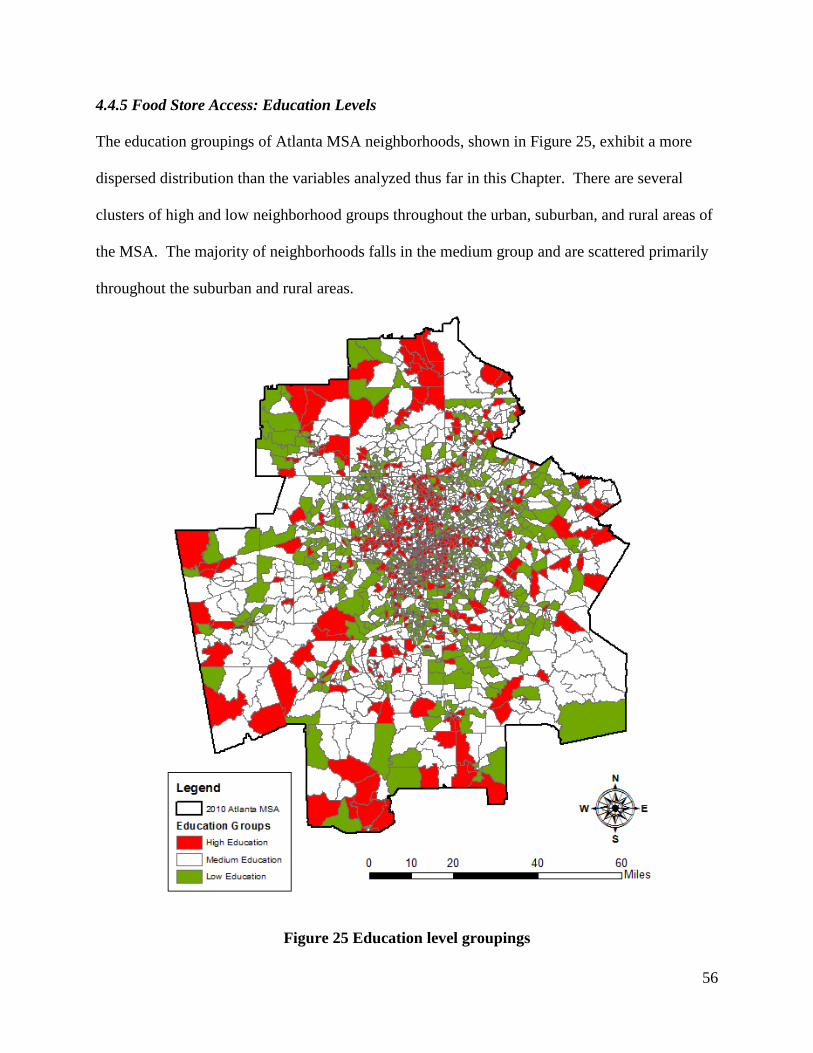
4.4.5 Food Store Access: Education Levels
The education groupings of Atlanta MSA neighborhoods, shown in Figure 25, exhibit a more
dispersed distribution than the variables analyzed thus far in this Chapter. There are several
clusters of high and low neighborhood groups throughout the urban, suburban, and rural areas of
the MSA. The majority of neighborhoods falls in the medium group and are scattered primarily
throughout the suburban and rural areas.
Figure 25 Education level groupings

57
Food access measurements to each type of food store, shown in Figure 26, varied when
controlling for neighborhood percentage of educational attainment through the twelfth grade.
Neighborhoods in the low and high education groups had better food access than the medium
group. For all four food store types, low and high measurements of food access were very
similar to one another, respectively. The most accessible food store type for all three groups is
convenience stores, followed by fast food restaurants, supermarkets, and small grocery stores.
Thus far this is the first variable that did not have a positive or negative relationship with food
access measurements. The medium education group has to travel farther to shop at all the food
store types.
Figure 26 Education level food access
0.0
1.0
2.0
3.0
4.0
5.0
Low Education [< -0.5 Std dev]
Medium Education [-0.5 - +0.5 Std dev]
High Education [> +0.5 Std dev]
Mile
s
Groupings
Percent Education Neighborhood Variable
Supermarket Small Grocery Convenience Fast Food

58
4.4.6 Food Store Access: Income Levels
The neighborhood groupings for the percentage of white residents are the same as Figure 11 and
are therefore not shown in this subsection. Food access measurements to each type of food store,
shown in Figure 27, varied when controlling for neighborhood household income levels. Small
grocery stores, fast food restaurants, and convenience stores exhibit a negative correlation with
food access. As neighborhood income levels increase, food access decreases causing resident to
have to travel farther to patron food stores. Supermarkets are the only food store that does not
exhibit this trend when controlling for income. Residents in the high income group have the
greatest food access to supermarkets followed by low, then medium groups. With the exception
of supermarkets, neighborhoods in the high income group must travel farther to access food
stores than neighborhoods in the low income group.
Figure 27 Income level food access
0.0
1.0
2.0
3.0
4.0
5.0
Low Income [< -0.5 Std dev]
Medium Income [-0.5 - +0.5 Std dev]
High Income [> +0.5 Std dev]
Mile
s
Groupings
Income Neighborhood Variable
Supermarket Small Grocery Convenience Fast Food

59
4.4.7 Food Store Access: Household Poverty Levels
The majority of neighborhoods in the Atlanta MSA, shown in Figure 28, fall in low poverty
group, followed by medium and high neighborhood groups. The majority of neighborhoods in
the low poverty group fall in the suburban region of the Atlanta MSA with some scattered
throughout the rural areas along the boundary of the MSA. Neighborhoods in the high poverty
group are clustered throughout the downtown Atlanta area and some rural areas. Neighborhoods
in the medium group cover a large portion of the rural areas north, west, and south of Atlanta and
are also scattered throughout the suburban regions of the city.
Figure 28 Poverty level groupings

60
Food access measurements to each type of food store, shown in Figure 29, varied when
controlling for the percentage of households in poverty per neighborhood. There is a positive
relationship between food access and the percentage of household poverty where as the
proportion of respective neighborhood poverty increases, resident have better food access to all
four food store types. Regardless of which group neighborhoods fall in, residents generally
have the greatest food access to convenience stores, followed by fast food restaurants,
supermarkets, and small grocery stores. Neighborhoods in the high poverty group have slightly
better access to small grocery stores than supermarkets. Supermarkets also show a slight
decrease in food access between low and medium poverty groups whereby both the low and high
groups have greater access to supermarkets. Neighborhoods in the low group must travel farther
to access food stores than neighborhoods in the high poverty group.
Figure 29 Household poverty level food access
0.0
1.0
2.0
3.0
4.0
5.0
Low Poverty [< -0.5 Std dev]
Medium Poverty [-0.5 - +0.5 Std dev]
High Poverty [> +0.5 Std dev]
Mile
s
Groupings
Percent Poverty Neighborhood Variable
Supermarket Small Grocery Convenience Fast Food

61
4.4.8 Food Store Access: Population Density Levels
The majority of neighborhoods in the Atlanta MSA, shown in Figure 30, fall in the low
population density group. These neighborhoods cover almost all of the rural areas of the MSA.
The vast majority of the suburban regions are in the medium group with high density
neighborhoods scattered throughout them. There is also a cluster of high population density
neighborhoods clustered in the downtown Atlanta area.
Figure 30 Population density groupings

62
Food access measurements to each type of food store, shown in Figure 31, varied when
controlling for neighborhood population density. There is a positive relationship between
neighborhood population density and food access. As population density increases, food access
also increases. With one exception, all three groups have the greatest food access to convenience
stores, fast food restaurants, supermarkets, and small grocery stores. The high population
density group has slightly better access to small grocery stores than supermarkets. Residents
living in low population density neighborhood groups have to travel farther to access food stores
than residents in high population density neighborhood groups.
Figure 31 Population density level food access
0.0
1.0
2.0
3.0
4.0
5.0
Low Population Density [< -0.5 Std dev]
Medium Population Density [-0.5 - +0.5 Std dev]
High Population Density [> +0.5 Std dev]
Mile
s
Groupings
Percent Population Density Neighborhood Variable
Supermarket Small Grocery Convenience Fast Food

63
CHAPTER 5: DISCUSSION AND CONCLUSION
This chapter discusses the key observations this study and their contribution to existing research
on food access in the United States. The chapter concludes with a discussion of recommended
future research on food access in the Atlanta MSA.
5.1 Summary of Results
The primary analysis of this study, modeled after Sharkey and Horel (2008), measured
food access to different types of food stores while controlling for neighborhood socioeconomic
and demographic conditions. The secondary analysis measured food access but only controlled
for a single neighborhood characteristic per iteration.
There are several conclusions to draw from the primary analysis. Neighborhoods with
the overall best food access are low income, high minority neighborhoods. These neighborhoods
have to travel the least distance to reach food stores. Neighborhoods with high income levels
and low minority composition have worse access to each respective food store than low income,
high minority neighborhoods. The most accessible food stores for all neighborhoods, regardless
of minority composition and income levels, are convenience stores, followed by fast food, small
grocery, and then supermarkets.
High minority neighborhoods with low income exhibited the best food access to all types
of food stores. These neighborhoods are located in and around the downtown Atlanta area.
Figures 4-7 show that the highest concentrations of food stores are located in these areas. As
such, they exhibit better food access than the low minority neighborhoods located primarily
throughout the suburban and rural areas of the MSA. As income levels increase, the target
neighborhoods move out of the urban areas and into more suburban and rural regions; therefore,
as income increases, food access decreases.
64
Neighborhoods of predominately white residents and low income levels exhibit the worst
food access to all types of food stores. Food access improves in white neighborhoods as income
rises. This trend is likely caused by the shift from rural to suburban neighborhoods.
Neighborhoods of low income and low minority composition are heavily located in the rural area
along the MSA boundary. Low minority neighborhoods primarily make up the majority of
wealthy suburbs north of downtown Atlanta. As income levels improve for low minority
neighborhoods, the subject neighborhoods shift from rural to suburban areas where there is a
significantly higher concentration of all four food store types.
The results of neighborhood food access, when controlling for respective race (white,
black, Hispanic, and Asian) showed consistent results. As the percentage of blacks, Hispanics,
and Asians increased in neighborhoods, food access to all types of food stores was improved.
Higher minority neighborhoods had to travel significantly less distance than neighborhoods of
lower percent minority. Similarly, neighborhoods with a low percentage of white residents had
better food access than high percent white neighborhoods. With the exception of percent white,
the variance in food access between each respective race for low, medium, and high percentages
was relatively low. Minority neighborhoods, regardless of minority type, all exhibited similar
food access to each food store type. This demonstrates that when analyzing food access in the
Atlanta MSA, there is a significant difference between white neighborhoods and minority
neighborhoods.
The results of neighborhood food access analyses for the other variables (population
density, household poverty, income, and education) were less correlated with each other. The
greatest relative change for these variables was exhibited in the population density analysis.
Residents in neighborhoods of higher population density have to travel less distance to access all

65
food store types than lower population density neighborhoods. Given the distribution of all the
food store types, shown in Figures 4-7, this is not an entirely unexpected conclusion. The
majority of each type of food store is located in either the urban or suburban neighborhoods, both
of which exhibit higher population densities than rural neighborhoods.
Neighborhood income and education levels did not show a large variance in food access
from low to high groupings. The percentage of households living in poverty showed greater
variance. Neighborhoods with a higher percentage of households in poverty have better food
access than low poverty neighborhoods. Similar to the population density analysis, high poverty
neighborhoods are located primarily in the urban region of the MSA where the concentration of
food businesses is greatest.
5.2 Significance of Findings
A primary conclusion of this study is that food access in the Atlanta MSA is highest
among high minority and low income neighborhoods. The results are in line with a primary
conclusion of Sharkey and Horel 2008, that the neighborhoods with high socioeconomic
deprivation have the best food access to all types of food stores. This may speak more broadly to
the differences in food access between urban and rural areas. Figures 28 and 29, focusing on
food access and population density, describe significant variations in food access based on the
urban and rural divide. Urban neighborhoods exhibit greater food access to all types of food
stores than rural neighborhoods in the Atlanta MSA. This is consistent with several nationwide
food access studies conducted in the US (Morris et al. 1990; Powell et al. 2007).
A regression model was designed to investigate if measurements of neighborhood food
access are correlated with neighborhood characteristics. However, the models did not meet the
criteria to be considered a valid result. This is not surprising given that the majority of the
66
explanatory variables, particularly those dealing with race, were non-normally distributed
throughout the study area. The non-normally distributed neighborhood racial data points to a
high level of segregation in the Atlanta MSA. Neighborhoods either have a high or low
concentration of a particular race. Few neighborhoods contain a reasonable mix of multiple
races (see Appendix A). It is possible that increasing the size of neighborhoods from CBG to
census tracts could smooth the data to an appropriate level. Another approach would be to adjust
the geographic extent covered in each regression model. Decreasing the extent might increase
the uniformity of each area and thus increase the normality of the demographic variables.
While the secondary analysis does provide a greater understanding of the food access
patterns facing Atlanta MSA residents, the lack of a regression analysis inhibits the ability of this
study to draw more intricate conclusions about the variables impacting the food access
measurements. For example, the secondary analysis of neighborhood income levels, shown in
Figure 22, shows little variance from low to high groupings. However, when income and
minority are controlled in the same analysis, shown in Figure 12 for supermarkets, the results are
significantly more insightful. This points to the limitation of using food access to define the food
environment.
5.3 Future Research
The results of this study highlight some limitations of investigating the food environment
through food access only. The primary result of the study (food access is best in highly
deprived, minority neighborhoods) does not necessarily portray the realities of the food
environment in the 28-county Atlanta MSA. Neighborhood type (urban, rural, or suburban) has
a significant impact on the food access measurements. Grouping both urban and rural
neighborhoods contributed to descriptive statistics that mask disparities in food access. For

67
example, the results show that low income neighborhoods have excellent food access
measurements. However, disparities in food access between rural, urban, and suburban
neighborhoods are significant and not reflected in the results. Future studies should control for
urban, rural, and suburban neighborhood types to investigate how they shape food accessibility
in the Atlanta MSA.
The results of this study also highlight the limitations of using food access measurements
to describe the local food environment. Deprived neighborhoods in the Atlanta MSA, primarily
in the urban Atlanta city center, showed favorable food access measurements despite the
troubling signs of neighborhood deprivation. Other approaches that consider more social,
business, and environmental conditions that shape food consumption habits, such as foodscapes,
may be more appropriate for investigating and defining an urban food environment.

68
REFERENCES
Adrian, M., B. Ferguson, and M. Her. 1996. Does allowing the sale of wine in Quebec grocery
stores increase consumption? J Stud Alchohol, 57: 434-448.
Alkon, A. 2014. Food justice and the challenge to neoliberalism. Gastronomica: The Journal of
Critical Food Studies, 14(2): 27-40.
Alkon, A., and T. Mares. 2012. Food sovereignty in the US food movements: Radical visions
and neoliberal constraints. Agriculture and Human Values, 29(3): 347-359.
Alkon, A., and K. Norgaard. 2009. Breaking the food chains: An investigation of food justice
activism. Sociological Inquiry, 79(3): 289-305.
Apparicio P., M. Cloutier., and R. Shearmur. 2007. The case of Montreal’s missing food
deserts: Evaluation of accessibility to food supermarkets. International Journal of Health
Geographics, 6:4.
Alviola, P., R. Nayga, M. Thomsen, and Z. Wang. 2013. Determinants of food deserts.
Agricultural and Applied Economics, 95(5): 1259-1265.
Block, J., R. Scribner, and K. DeSalvo. 2004. Fast food, race/ethnicity, and income: A
geographic analysis. American Journal of Preventive Medicine, 27(3): 211-217.
Charreire, H., R. Casey, P. Salze, C. Simon, B. Chaix, A. Banos, D. Badariotti, C. Weber, and J.
Oppert. 2010. Measuring the food environment using geographical information systems:
a methodological review. Public Health Nutrition, 13(11): 1773-1785.
Cole-Hamilton, I., and T. Lang. 1986. Tightening belts: A report of the impact of poverty on
Food. London: London Food Commission.
Cotterill, R. and A. Franklin. 1995. The urban grocery store gap. Food Marketing Policy Center,
University of Connecticut. Policy Issue Paper No. 8.

69
Cummins, S., and S. Macintyre. 2002. A systematic study of an urban foodscape: The price and
availability of food in greater Glasgow. Urban Studies, 39(11): 2115-2130.
Dark, S. and D. Bram. 2007. The modifiable areal unit problem (MAUP in physical geography.
Progress in Physical Geography, 31(5): 471-479.
Dutko, P., M. Ploeg, and T. Farrigan. 2012. Characteristics and influential factors of food
deserts. United States Department of Agriculture, Economic Research Service, ERR-140.
Economic Research Service. 2009. Access to affordable and nutritious food: Measuring and
understanding food deserts and their consequences. United States Department of
Agriculture, Economic Research Service.
Esri. 2013. Methodology statement: 2013 Esri US business locations and business summary data.
An Esri White Paper. Retrieved from http://www.arcgis.com
Helling, A., and D. Sawicki. 2003. Race and residential accessibility to shopping and services.
Housing Policy Debate. 14(2): 69-101.
Hoesen, J., B. Bunkley, and C. Currier. 2012. A GIS-based methodology toward refining the
concept of rural food deserts: A case study from Rutland County, Vermont. Journal of
Agriculture, Food Systems, and Community Development, 3(2): 61-76.
Jeon, C.M., A. Amekudzi, and R. Guensler. 2010 Evaluation plan alternatives for transportation
system sustainability: Atlanta metropolitan region. International Journal of Sustainable
Transportation, 4(4):227-247.
Jetter, K., and D. Cassady. 2006. The availability and cost of healthier food alternatives.
American Journal of Preventive Medicine, 30(1): 38-44.
Larson, N., M. Story, and M. Nelson. 2009. Neighborhood environments: Disparities in access to
healthy foods in the U.S. American Journal of Preventive Medicine, 36(1): 74-91.

70
McEntee, J., and J. Agyeman. 2010. Towards the development of a GIS method for identifying
rural food deserts: Geographic access in Vermont, USA. Applied Geography, 30(1): 165-
176.
McKinnon, R.A., J. Reed, M. Morrissette, L. Lytle, and A. Yaroch. 2009. Measures of the food
environment: A compilation of the literature, 1990-2007. American Journal of Preventive
Medicine,36(4): 124-133.
Mead M., and R. Earickson. 2000. Medical geography. New York: Guilford Press, 2nd Edition.
Miewald, C., and E. McCann. 2014. Foodscapes and the geographies of poverty: Sustenance,
strategy, and politics in an urban neighborhood. Antipode, 46(2): 537-556.
Mooney, C. 1990. Cost and availability of healthy food choices in a London health district.
Journal of Human Nutrition and Dietetics, 3: 111-120.
Moreland, K., S. Wing, and A. Diez-Roux. 2002a. The contextual effect of the local food
environment on residents’ diets: The atherosclerosis risk in communities study. American
Journal of Public Health, 92(11):1761-1767.
Moreland, K., S. Wing, A. Diez-Roux, and C. Poole. 2002b. Neighborhood characteristics
associated with the location of food stores and food service places. American Journal of
Preventive Medicine, 22(1): 23-29.
Moreland, K., A. Diez-Roux, and S. Wing. 2006. Supermarkets, other food stores and obesity:
The atherosclerosis risk in communities study. American journal of Preventive Medicine,
30(4): 333-339.
Morris, P., M. Bellinger, and E. Haas. 1990. Higher prices, fewer choices: Shopping for food in
rural America. Public Voice for Food and Health Policy, Washington D.C.

71
Nord, M., and M. Andrews. 2002. Reducing food insecurity in the United States: Assessing
progress toward a national objective. United States Department of Agriculture,
Economic Research Service, Report Number 26-2.
Pearce, J., T. Blakely, K. Witten, and P. Bartie. 2007. Neighborhood deprivation and access to
fast food retailing: A national study. American Journal of Preventive Medicine, 32(5):
375-382.
Powell, L., S. Slater, D. Mircheva, Y. Bao, and F. Chaloupka. 2007. Food store availability and
neighborhood characteristics in the United States. Preventive Medicine. 44: 189-195.
Raja, S., C. Ma, and P. Yadav. 2008. Beyond food deserts: Measuring and mapping racial
disparities in neighborhood food environments. Journal of Planning Education and
Research. 27: 469-482.
Rose, D., J. Bodor, C. Swalm, J. Rice, T. Farley, and P. Hutchinson. 2009. Deserts in New
Orleans? Illustrations of urban food access and implications for policy. School of Public
Health and Tropical Medicine, Tulane University.
Schiavoni, C. 2009. The global struggle for food sovereignty: From Nyeleni to New York.
Journal of Peasant Studies, 36(3): 682-689.
Sharkey, J., and S. Horel. 2008. Neighborhood socioeconomic deprivation and minority
composition are associated with better potential spatial access to the ground-truthed food
environment in a large rural area. The Journal of Nutrition, 138(3): 620-627.
Shaw, H. 2006. Food deserts: Towards the development of a classification. Geografiska
Annaler, 88 B(2): 231-247.

72
Sparks, A., N. Bania, and L. Leete. 2009. Finding food deserts: Methodology and measurement
of food access in Portland, Oregon. National Poverty Center/USDA Economic Research
Service.
U.S. Census Bureau. 2012. Table 20. Large metropolitan statistical areas-population: 1990 to
2010. http://www.census.gov/compendia/statab/2012/tables/12s0020.pdf (accessed 10
August 2014).
U.S. Census Bureau. 2014. North American Industry Classification System.
http://www.census.gov/eos/www/naics/ (accessed 29 March 2014).
U.S. Department of Agriculture. 2014. Food Atlas Map.
http://www.ers.usda.gov/data-products/food-environment-atlas.aspx#.U8wILvldWaE
(last accessed 20 July 2014).
Yamashita, T., and S. Kunkel. 2010. Geographic access to healthy and unhealthy foods for the
older population in the U.S. Metropolitan Area. Journal of Applied Gerontology, 31(3):
287-313.
Zenk, S., A. Schulz, B. Israel, S. James, S. Boa, and M. Wilson. 2005. Neighborhood racial
composition, neighborhood poverty, and the spatial accessibility of supermarkets in
metropolitan Detroit. American Journal of Public Health, 95(4): 660-667.
Zenk, S., and L. Powell. 2008. US secondary schools and food outlets. Health Place, 14: 336-
346.

73
APPENDIX A: NEIGHBORHOOD DATA HISTOGRAMS
Figure 33: Percent white histogram
Figure 34: Percent black histogram

74
Figure 35: Percent Asian histogram
Figure 36: Percent Hispanic histogram

75
Figure 37: Education attainment histogram
Figure 38: Median household income histogram

76
Figure 39: % household below poverty histogram
Figure 40: Population density histogram

77
APPENDIX B: EXPLORATORY REGRESSION REPORT AND TABLE RESULTS
Figure 41: OLS Report Result for Supermarkets

78
Table 9: OLS Table Result for Supermarkets
AdjR2 AICc JB K_BP MVIF SA X1 X2 X3 X4 X5 0.220 9787 0.0000 0.0000 5.2 0.0000 MEDHINC_CY WHITEPCT BLACKPCT POPDEN SCH 0.219 9791 0.0000 0.0000 1.5 0.0000 MEDHINC_CY WHITEPCT ASIANPCT POPDEN SCH 0.214 9808 0.0000 0.0000 1.5 0.0000 MEDHINC_CY WHITEPCT HISPPCT POPDEN SCH 0.210 9819 0.0000 0.0000 1.5 0.0000 MEDHINC_CY WHITEPCT POPDEN SCH 0.209 9822 0.0000 0.0000 7.0 MEDHINC_CY WHITEPCT BLACKPCT ASIANPCT POPDEN 0.209 9824 0.0000 0.0000 1.5 MEDHINC_CY WHITEPCT ASIANPCT HISPPCT POPDEN 0.208 9826 0.0000 0.0000 1.4 0.0000 MEDHINC_CY WHITEPCT ASIANPCT POPDEN 0.207 9829 0.0000 0.0000 1.4 MEDHINC_CY BLACKPCT ASIANPCT HISPPCT POPDEN 0.207 9830 0.0000 0.0000 5.0 0.0000 MEDHINC_CY WHITEPCT BLACKPCT POPDEN 0.201 9849 0.0000 0.0000 1.4 MEDHINC_CY WHITEPCT HISPPCT POPDEN 0.199 9855 0.0000 0.0000 1.4 0.0000 MEDHINC_CY WHITEPCT POPDEN 0.197 9861 0.0000 0.0000 6.7 WHITEPCT BLACKPCT ASIANPCT POPDEN SCH 0.197 9863 0.0000 0.0000 1.2 WHITEPCT ASIANPCT HISPPCT POPDEN SCH 0.196 9865 0.0000 0.0000 1.2 WHITEPCT ASIANPCT POPDEN SCH 0.196 9866 0.0000 0.0000 1.2 BLACKPCT ASIANPCT HISPPCT POPDEN SCH 0.196 9867 0.0000 0.0000 1.5 MEDHINC_CY BLACKPCT HISPPCT POPDEN SCH 0.191 9881 0.0000 0.0000 1.4 MEDHINC_CY BLACKPCT ASIANPCT POPDEN SCH 0.187 9894 0.0000 0.0000 6.4 WHITEPCT BLACKPCT ASIANPCT POPDEN 0.187 9894 0.0000 0.0000 5.1 WHITEPCT BLACKPCT POPDEN SCH 0.186 9895 0.0000 0.0000 1.1 0.0000 WHITEPCT ASIANPCT POPDEN 0.186 9897 0.0000 0.0000 1.3 MEDHINC_CY BLACKPCT ASIANPCT POPDEN 0.186 9898 0.0000 0.0000 1.2 BLACKPCT ASIANPCT HISPPCT POPDEN 0.184 9901 0.0000 0.0000 1.4 MEDHINC_CY BLACKPCT HISPPCT POPDEN 0.179 9918 0.0000 0.0000 1.2 BLACKPCT ASIANPCT POPDEN SCH 0.175 9931 0.0000 0.0000 1.2 WHITEPCT HISPPCT POPDEN SCH 0.175 9931 0.0000 0.0000 4.9 0.0000 WHITEPCT BLACKPCT POPDEN 0.174 9934 0.0000 0.0000 1.1 BLACKPCT ASIANPCT POPDEN 0.173 9937 0.0000 0.0000 1.2 WHITEPCT POPDEN SCH 0.171 9943 0.0000 0.0000 6.7 MEDHINC_CY WHITEPCT BLACKPCT ASIANPCT SCH 0.170 9949 0.0000 0.0000 1.5 MEDHINC_CY WHITEPCT ASIANPCT HISPPCT SCH 0.169 9949 0.0000 0.0000 4.5 MEDHINC_CY WHITEPCT BLACKPCT SCH 0.167 9957 0.0000 0.0000 1.4 MEDHINC_CY BLACKPCT ASIANPCT HISPPCT SCH 0.164 9963 0.0000 0.0000 1.2 WHITEPCT HISPPCT POPDEN 0.163 9966 0.0000 0.0000 1.1 0.0000 WHITEPCT POPDEN 0.163 9969 0.0000 0.0000 1.3 MEDHINC_CY BLACKPCT POPDEN SCH 0.160 9976 0.0000 0.0000 1.4 MEDHINC_CY WHITEPCT ASIANPCT SCH 0.158 9981 0.0000 0.0000 1.3 MEDHINC_CY BLACKPCT POPDEN 0.158 9982 0.0000 0.0000 1.2 BLACKPCT HISPPCT POPDEN SCH 0.156 9989 0.0000 0.0000 1.4 MEDHINC_CY WHITEPCT HISPPCT SCH

79
0.156 9989 0.0000 0.0000 6.4 MEDHINC_CY WHITEPCT BLACKPCT ASIANPCT 0.155 9993 0.0000 0.0000 1.4 MEDHINC_CY WHITEPCT ASIANPCT HISPPCT 0.153 9998 0.0000 0.0000 4.3 MEDHINC_CY WHITEPCT BLACKPCT 0.153 10001 0.0000 0.0000 1.4 MEDHINC_CY BLACKPCT ASIANPCT HISPPCT 0.152 10004 0.0000 0.0000 1.2 MEDHINC_CY ASIANPCT HISPPCT POPDEN SCH 0.150 10007 0.0000 0.0000 1.1 BLACKPCT HISPPCT POPDEN 0.150 10008 0.0000 0.0000 1.1 ASIANPCT HISPPCT POPDEN SCH 0.149 10011 0.0000 0.0000 1.2 MEDHINC_CY ASIANPCT HISPPCT POPDEN 0.149 10012 0.0000 0.0000 6.2 WHITEPCT BLACKPCT ASIANPCT SCH 0.148 10013 0.0000 0.0000 1.4 MEDHINC_CY WHITEPCT ASIANPCT 0.147 10016 0.0000 0.0000 1.2 WHITEPCT ASIANPCT HISPPCT SCH 0.147 10015 0.0000 0.0000 1.1 ASIANPCT HISPPCT POPDEN 0.146 10021 0.0000 0.0000 1.1 BLACKPCT ASIANPCT HISPPCT SCH 0.144 10026 0.0000 0.0000 1.1 MEDHINC_CY ASIANPCT POPDEN SCH 0.143 10027 0.0000 0.0000 1.0 ASIANPCT POPDEN SCH 0.143 10028 0.0000 0.0000 1.4 MEDHINC_CY WHITEPCT SCH 0.143 10029 0.0000 0.0000 1.1 MEDHINC_CY ASIANPCT POPDEN 0.142 10030 0.0000 0.0000 1.0 0.0000 ASIANPCT POPDEN 0.141 10034 0.0000 0.0000 1.1 BLACKPCT POPDEN SCH 0.141 10035 0.0000 0.0000 1.1 WHITEPCT ASIANPCT SCH 0.141 10036 0.0000 0.0000 1.4 MEDHINC_CY WHITEPCT HISPPCT 0.138 10043 0.0000 0.0000 4.4 WHITEPCT BLACKPCT SCH 0.138 10045 0.0000 0.0000 1.1 MEDHINC_CY HISPPCT POPDEN SCH 0.137 10046 0.0000 0.0000 1.0 0.0000 BLACKPCT POPDEN 0.136 10050 0.0000 0.0000 6.1 WHITEPCT BLACKPCT ASIANPCT 0.135 10051 0.0000 0.0000 1.1 MEDHINC_CY HISPPCT POPDEN 0.135 10053 0.0000 0.0000 1.1 WHITEPCT ASIANPCT HISPPCT 0.133 10057 0.0000 0.0000 1.1 BLACKPCT ASIANPCT HISPPCT 0.131 10066 0.0000 0.0000 1.1 HISPPCT POPDEN SCH 0.130 10066 0.0000 0.0000 1.3 MEDHINC_CY WHITEPCT 0.130 10066 0.0000 0.0000 1.0 WHITEPCT ASIANPCT 0.128 10075 0.0000 0.0000 1.4 MEDHINC_CY BLACKPCT HISPPCT SCH 0.128 10073 0.0000 0.0000 1.1 HISPPCT POPDEN 0.127 10077 0.0000 0.0000 1.0 MEDHINC_CY POPDEN SCH 0.126 10079 0.0000 0.0000 1.0 MEDHINC_CY POPDEN 0.124 10085 0.0000 0.0000 4.2 WHITEPCT BLACKPCT 0.122 10090 0.0000 0.0378 1.0 POPDEN SCH 0.120 10094 0.0000 0.0255 1.0 0.0000 POPDEN 0.117 10107 0.0000 0.0000 1.2 WHITEPCT HISPPCT SCH 0.114 10114 0.0000 0.0000 1.4 MEDHINC_CY BLACKPCT HISPPCT 0.107 10136 0.0000 0.0000 1.3 MEDHINC_CY BLACKPCT ASIANPCT SCH 0.106 10137 0.0000 0.0000 1.1 WHITEPCT SCH

80
0.103 10144 0.0000 0.0000 1.1 WHITEPCT HISPPCT 0.102 10149 0.0000 0.0000 1.3 MEDHINC_CY BLACKPCT ASIANPCT 0.102 10150 0.0000 0.0000 1.1 BLACKPCT ASIANPCT SCH 0.097 10163 0.0000 0.0000 1.1 BLACKPCT ASIANPCT 0.095 10168 0.0000 0.0000 1.0 0.0000 WHITEPCT 0.090 10183 0.0000 0.0000 1.1 BLACKPCT HISPPCT SCH 0.079 10212 0.0000 0.0000 1.0 BLACKPCT HISPPCT 0.066 10251 0.0000 0.0000 1.0 ASIANPCT HISPPCT SCH 0.064 10256 0.0000 0.0000 1.0 ASIANPCT HISPPCT 0.051 10291 0.0000 0.0000 1.3 MEDHINC_CY BLACKPCT SCH 0.048 10298 0.0000 0.0000 1.3 MEDHINC_CY BLACKPCT 0.039 10324 0.0000 0.0000 1.1 MEDHINC_CY ASIANPCT 0.038 10326 0.0000 0.0000 1.1 MEDHINC_CY HISPPCT SCH 0.038 10324 0.0000 0.0000 1.0 0.0000 ASIANPCT 0.037 10328 0.0000 0.0000 1.0 BLACKPCT SCH 0.036 10331 0.0000 0.0000 1.0 MEDHINC_CY HISPPCT 0.036 10331 0.0000 0.0000 1.0 HISPPCT SCH 0.034 10335 0.0000 0.0000 1.0 0.0000 BLACKPCT 0.033 10337 0.0000 0.0000 1.0 HISPPCT

81
Figure 42: OLS Report Result for Small Grocery

82
Table 10: OLS Table Result for Small Grocery
AdjR2 AICc JB K_BP MVIF SA X1 X2 X3 X4 X5 0.2709 10396 0.0000 0.0000 5.2 0.0000 POVINCPCT WHITEPCT BLACKPCT POPDEN SCH 0.2691 10402 0.0000 0.0000 5.2 0.0000 MEDHINC_CY WHITEPCT BLACKPCT POPDEN SCH 0.2664 10411 0.0000 0.0000 6.7 WHITEPCT BLACKPCT ASIANPCT POPDEN SCH 0.2657 10413 0.0000 0.0000 5.1 0.0000 WHITEPCT BLACKPCT POPDEN SCH 0.2656 10414 0.0000 0.0000 1.2 WHITEPCT ASIANPCT HISPPCT POPDEN SCH 0.2655 10415 0.0000 0.0000 1.7 POVINCPCT MEDHINC_CY WHITEPCT POPDEN SCH 0.2650 10416 0.0000 0.0000 1.4 POVINCPCT WHITEPCT ASIANPCT POPDEN SCH 0.2643 10419 0.0000 0.0000 1.2 BLACKPCT ASIANPCT HISPPCT POPDEN SCH 0.2637 10421 0.0000 0.0000 1.5 MEDHINC_CY WHITEPCT HISPPCT POPDEN SCH 0.2629 10424 0.0000 0.0000 5.1 POVINCPCT MEDHINC_CY WHITEPCT BLACKPCT POPDEN 0.2614 10429 0.0000 0.0000 1.5 POVINCPCT WHITEPCT HISPPCT POPDEN SCH 0.2600 10434 0.0000 0.0000 1.5 MEDHINC_CY WHITEPCT ASIANPCT POPDEN SCH 0.2584 10438 0.0000 0.0000 1.2 0.0000 WHITEPCT ASIANPCT POPDEN SCH 0.2582 10440 0.0000 0.0000 6.8 POVINCPCT WHITEPCT BLACKPCT ASIANPCT POPDEN 0.2578 10441 0.0000 0.0000 1.2 0.0000 WHITEPCT HISPPCT POPDEN SCH 0.2576 10442 0.0000 0.0000 1.4 POVINCPCT WHITEPCT ASIANPCT HISPPCT POPDEN 0.2575 10442 0.0000 0.0000 5.0 MEDHINC_CY WHITEPCT BLACKPCT POPDEN 0.2571 10444 0.0000 0.0000 1.6 POVINCPCT MEDHINC_CY WHITEPCT HISPPCT POPDEN 0.2569 10445 0.0000 0.0000 1.5 MEDHINC_CY WHITEPCT ASIANPCT HISPPCT POPDEN 0.2567 10445 0.0000 0.0000 1.7 POVINCPCT MEDHINC_CY WHITEPCT ASIANPCT POPDEN 0.2565 10446 0.0000 0.0000 1.4 POVINCPCT BLACKPCT ASIANPCT HISPPCT POPDEN 0.2562 10446 0.0000 0.0000 5.0 POVINCPCT WHITEPCT BLACKPCT POPDEN 0.2558 10448 0.0000 0.0000 6.4 WHITEPCT BLACKPCT ASIANPCT POPDEN 0.2555 10450 0.0000 0.0000 1.4 MEDHINC_CY BLACKPCT ASIANPCT HISPPCT POPDEN 0.2551 10450 0.0000 0.0000 1.2 WHITEPCT ASIANPCT HISPPCT POPDEN 0.2546 10451 0.0000 0.0000 4.9 0.0000 WHITEPCT BLACKPCT POPDEN 0.2541 10454 0.0000 0.0000 1.5 MEDHINC_CY WHITEPCT POPDEN SCH 0.2539 10454 0.0000 0.0000 1.2 BLACKPCT ASIANPCT HISPPCT POPDEN 0.2527 10459 0.0000 0.0000 1.4 POVINCPCT WHITEPCT POPDEN SCH 0.2526 10459 0.0000 0.0000 1.4 POVINCPCT WHITEPCT ASIANPCT POPDEN 0.2521 10460 0.0000 0.0000 1.4 MEDHINC_CY WHITEPCT HISPPCT POPDEN 0.2509 10464 0.0000 0.0000 1.4 MEDHINC_CY WHITEPCT ASIANPCT POPDEN 0.2499 10468 0.0000 0.0000 1.6 POVINCPCT MEDHINC_CY WHITEPCT POPDEN 0.2497 10468 0.0000 0.0000 1.1 0.0000 WHITEPCT ASIANPCT POPDEN 0.2490 10470 0.0000 0.0000 1.2 0.0000 WHITEPCT POPDEN SCH 0.2480 10475 0.0000 0.0000 1.4 POVINCPCT WHITEPCT HISPPCT POPDEN 0.2471 10477 0.0000 0.0000 1.2 WHITEPCT HISPPCT POPDEN 0.2469 10479 0.0000 0.0000 1.5 MEDHINC_CY BLACKPCT HISPPCT POPDEN SCH 0.2447 10487 0.0000 0.0000 1.4 POVINCPCT BLACKPCT HISPPCT POPDEN SCH

83
0.2447 10485 0.0000 0.0000 1.4 MEDHINC_CY WHITEPCT POPDEN 0.2427 10494 0.0000 0.0000 1.6 POVINCPCT MEDHINC_CY BLACKPCT HISPPCT POPDEN 0.2414 10496 0.0000 0.0000 1.4 POVINCPCT WHITEPCT POPDEN 0.2405 10500 0.0000 0.0000 1.2 BLACKPCT HISPPCT POPDEN SCH 0.2403 10499 0.0000 0.0000 1.1 0.0000 WHITEPCT POPDEN 0.2368 10513 0.0000 0.0000 1.4 MEDHINC_CY BLACKPCT HISPPCT POPDEN 0.2363 10515 0.0000 0.0000 4.6 POVINCPCT MEDHINC_CY WHITEPCT BLACKPCT SCH 0.2341 10523 0.0000 0.0000 1.4 POVINCPCT BLACKPCT ASIANPCT POPDEN SCH 0.2329 10526 0.0000 0.0000 1.3 POVINCPCT BLACKPCT HISPPCT POPDEN 0.2314 10530 0.0000 0.0000 1.1 BLACKPCT HISPPCT POPDEN 0.2267 10548 0.0000 0.0000 6.4 POVINCPCT WHITEPCT BLACKPCT ASIANPCT SCH 0.2265 10548 0.0000 0.0000 1.6 POVINCPCT MEDHINC_CY BLACKPCT ASIANPCT POPDEN 0.2258 10550 0.0000 0.0000 1.3 POVINCPCT BLACKPCT ASIANPCT POPDEN 0.2252 10553 0.0000 0.0000 1.4 POVINCPCT WHITEPCT ASIANPCT HISPPCT SCH 0.2247 10554 0.0000 0.0000 1.7 POVINCPCT MEDHINC_CY WHITEPCT HISPPCT SCH 0.2246 10554 0.0000 0.0000 4.5 POVINCPCT WHITEPCT BLACKPCT SCH 0.2235 10558 0.0000 0.0000 1.4 POVINCPCT BLACKPCT ASIANPCT HISPPCT SCH 0.2195 10571 0.0000 0.0000 1.2 BLACKPCT ASIANPCT POPDEN SCH 0.2183 10575 0.0000 0.0000 4.5 MEDHINC_CY WHITEPCT BLACKPCT SCH 0.2165 10582 0.0000 0.0000 1.5 MEDHINC_CY WHITEPCT ASIANPCT HISPPCT SCH 0.2163 10581 0.0000 0.0000 6.2 WHITEPCT BLACKPCT ASIANPCT SCH 0.2162 10581 0.0000 0.0000 1.1 BLACKPCT ASIANPCT POPDEN 0.2157 10584 0.0000 0.0000 1.8 POVINCPCT MEDHINC_CY WHITEPCT ASIANPCT SCH 0.2156 10583 0.0000 0.0000 4.4 WHITEPCT BLACKPCT SCH 0.2148 10586 0.0000 0.0000 1.2 WHITEPCT ASIANPCT HISPPCT SCH 0.2142 10589 0.0000 0.0000 1.4 MEDHINC_CY BLACKPCT ASIANPCT HISPPCT SCH 0.2133 10592 0.0000 0.0000 1.2 POVINCPCT ASIANPCT HISPPCT POPDEN SCH 0.2132 10592 0.0000 0.0000 6.6 POVINCPCT MEDHINC_CY WHITEPCT BLACKPCT ASIANPCT 0.2127 10593 0.0000 0.0000 1.1 BLACKPCT ASIANPCT HISPPCT SCH 0.2126 10593 0.0000 0.0000 4.5 POVINCPCT MEDHINC_CY WHITEPCT BLACKPCT 0.2116 10598 0.0000 0.0000 1.7 POVINCPCT MEDHINC_CY WHITEPCT ASIANPCT HISPPCT 0.2114 10598 0.0000 0.0000 1.7 POVINCPCT MEDHINC_CY BLACKPCT POPDEN SCH 0.2097 10604 0.0000 0.0000 1.7 POVINCPCT MEDHINC_CY BLACKPCT ASIANPCT HISPPCT 0.2086 10607 0.0000 0.0000 1.4 POVINCPCT WHITEPCT ASIANPCT SCH 0.2081 10608 0.0000 0.0000 6.3 POVINCPCT WHITEPCT BLACKPCT ASIANPCT 0.2075 10610 0.0000 0.0000 1.4 MEDHINC_CY WHITEPCT HISPPCT SCH 0.2075 10610 0.0000 0.0000 1.4 POVINCPCT WHITEPCT HISPPCT SCH 0.2067 10612 0.0000 0.0000 1.4 POVINCPCT WHITEPCT ASIANPCT HISPPCT 0.2057 10616 0.0000 0.0003 1.4 POVINCPCT BLACKPCT POPDEN SCH 0.2057 10615 0.0000 0.0000 4.4 POVINCPCT WHITEPCT BLACKPCT 0.2051 10618 0.0000 0.0000 1.4 POVINCPCT BLACKPCT ASIANPCT HISPPCT 0.2046 10619 0.0000 0.0000 1.1 POVINCPCT ASIANPCT HISPPCT POPDEN

84
0.2041 10620 0.0000 0.0000 4.3 MEDHINC_CY WHITEPCT BLACKPCT 0.2033 10624 0.0000 0.0000 1.6 POVINCPCT MEDHINC_CY BLACKPCT POPDEN 0.2032 10623 0.0000 0.0000 6.1 WHITEPCT BLACKPCT ASIANPCT 0.2029 10625 0.0000 0.0000 1.4 MEDHINC_CY WHITEPCT ASIANPCT HISPPCT 0.2025 10627 0.0000 0.0000 1.7 POVINCPCT MEDHINC_CY HISPPCT POPDEN SCH 0.2019 10626 0.0000 0.0000 4.2 0.0000 WHITEPCT BLACKPCT 0.2018 10628 0.0000 0.0000 1.1 WHITEPCT ASIANPCT HISPPCT 0.2012 10629 0.0000 0.0000 1.2 WHITEPCT HISPPCT SCH 0.2010 10631 0.0000 0.0000 1.7 POVINCPCT MEDHINC_CY WHITEPCT SCH 0.2010 10631 0.0000 0.0000 1.6 POVINCPCT MEDHINC_CY WHITEPCT HISPPCT 0.2010 10631 0.0000 0.0003 1.2 POVINCPCT HISPPCT POPDEN SCH 0.1999 10634 0.0000 0.0000 1.1 BLACKPCT ASIANPCT HISPPCT 0.1997 10636 0.0000 0.0000 1.7 POVINCPCT MEDHINC_CY BLACKPCT HISPPCT SCH 0.1994 10635 0.0000 0.0003 1.3 POVINCPCT BLACKPCT POPDEN 0.1968 10645 0.0000 0.0000 1.2 POVINCPCT ASIANPCT POPDEN SCH 0.1968 10644 0.0000 0.0000 1.1 WHITEPCT ASIANPCT SCH 0.1968 10645 0.0000 0.0000 1.7 POVINCPCT MEDHINC_CY WHITEPCT ASIANPCT 0.1943 10652 0.0000 0.0072 1.1 BLACKPCT POPDEN SCH 0.1931 10656 0.0000 0.0002 1.1 POVINCPCT HISPPCT POPDEN 0.1931 10656 0.0000 0.0000 1.4 MEDHINC_CY WHITEPCT HISPPCT 0.1931 10656 0.0000 0.0000 1.3 POVINCPCT WHITEPCT ASIANPCT 0.1919 10659 0.0000 0.0023 1.0 0.0000 BLACKPCT POPDEN 0.1909 10663 0.0000 0.0000 1.1 POVINCPCT ASIANPCT POPDEN 0.1900 10665 0.0000 0.0000 1.4 POVINCPCT WHITEPCT HISPPCT 0.1878 10672 0.0000 0.0000 1.1 WHITEPCT HISPPCT 0.1868 10675 0.0000 0.0000 1.0 WHITEPCT ASIANPCT 0.1857 10679 0.0000 0.0000 1.4 POVINCPCT WHITEPCT SCH 0.1854 10682 0.0000 0.0000 1.2 MEDHINC_CY ASIANPCT HISPPCT POPDEN SCH 0.1840 10686 0.0000 0.0000 1.2 MEDHINC_CY ASIANPCT HISPPCT POPDEN 0.1839 10685 0.0000 0.0000 1.4 MEDHINC_CY WHITEPCT SCH 0.1818 10691 0.0000 0.0000 1.6 POVINCPCT MEDHINC_CY WHITEPCT 0.1816 10693 0.0000 0.0000 1.4 POVINCPCT BLACKPCT HISPPCT SCH 0.1810 10694 0.0000 0.0878 1.2 POVINCPCT POPDEN SCH 0.1804 10697 0.0000 0.0000 1.4 MEDHINC_CY BLACKPCT HISPPCT SCH 0.1788 10700 0.0000 0.0000 1.1 WHITEPCT SCH 0.1786 10702 0.0000 0.0000 1.1 ASIANPCT HISPPCT POPDEN SCH 0.1778 10705 0.0000 0.0000 1.6 POVINCPCT MEDHINC_CY BLACKPCT HISPPCT 0.1775 10705 0.0000 0.0000 1.1 ASIANPCT HISPPCT POPDEN 0.1761 10708 0.0000 0.1891 1.0 POVINCPCT POPDEN 0.1755 10712 0.0000 0.0000 1.1 MEDHINC_CY HISPPCT POPDEN SCH 0.1741 10716 0.0000 0.0000 1.1 MEDHINC_CY HISPPCT POPDEN 0.1737 10717 0.0000 0.0000 1.1 BLACKPCT HISPPCT SCH

85
0.1731 10718 0.0000 0.0000 1.3 MEDHINC_CY WHITEPCT 0.1728 10720 0.0000 0.0006 1.1 HISPPCT POPDEN SCH 0.1717 10722 0.0000 0.0000 1.3 POVINCPCT WHITEPCT 0.1716 10723 0.0000 0.0002 1.1 HISPPCT POPDEN 0.1687 10730 0.0000 0.0000 1.0 0.0000 WHITEPCT 0.1680 10735 0.0000 0.0000 1.1 MEDHINC_CY ASIANPCT POPDEN 0.1679 10735 0.0000 0.0000 1.4 MEDHINC_CY BLACKPCT HISPPCT 0.1660 10741 0.0000 0.0000 1.3 POVINCPCT BLACKPCT HISPPCT 0.1624 10751 0.0000 0.0000 1.0 BLACKPCT HISPPCT 0.1569 10768 0.0000 0.0000 1.0 ASIANPCT POPDEN 0.1540 10777 0.0000 0.0000 1.0 MEDHINC_CY POPDEN 0.1532 10781 0.0000 0.0000 1.3 POVINCPCT BLACKPCT ASIANPCT SCH 0.1488 10792 0.0000 0.8770 1.0 0.0000 POPDEN 0.1432 10811 0.0000 0.0000 1.3 POVINCPCT BLACKPCT ASIANPCT 0.1398 10822 0.0000 0.0000 1.2 POVINCPCT ASIANPCT HISPPCT SCH 0.1282 10855 0.0000 0.0000 1.1 POVINCPCT ASIANPCT HISPPCT 0.1260 10863 0.0000 0.0000 1.3 MEDHINC_CY BLACKPCT ASIANPCT SCH 0.1235 10869 0.0000 0.0000 1.1 BLACKPCT ASIANPCT SCH 0.1234 10870 0.0000 0.0000 1.3 MEDHINC_CY BLACKPCT ASIANPCT 0.1209 10876 0.0000 0.0000 1.1 BLACKPCT ASIANPCT 0.1177 10887 0.0000 0.0000 1.6 POVINCPCT MEDHINC_CY HISPPCT SCH 0.1164 10890 0.0000 0.0000 1.1 POVINCPCT HISPPCT SCH 0.1060 10919 0.0000 0.0000 1.0 POVINCPCT HISPPCT 0.1048 10925 0.0000 0.0000 1.7 POVINCPCT MEDHINC_CY BLACKPCT SCH 0.0998 10938 0.0000 0.0000 1.3 POVINCPCT BLACKPCT SCH 0.0993 10940 0.0000 0.0000 1.1 POVINCPCT ASIANPCT SCH 0.0960 10950 0.0000 0.0000 1.1 MEDHINC_CY ASIANPCT HISPPCT SCH 0.0957 10950 0.0000 0.0000 1.6 POVINCPCT MEDHINC_CY BLACKPCT 0.0947 10953 0.0000 0.0000 1.1 MEDHINC_CY ASIANPCT HISPPCT 0.0935 10956 0.0000 0.0000 1.5 POVINCPCT MEDHINC_CY ASIANPCT 0.0927 10958 0.0000 0.0000 1.2 POVINCPCT BLACKPCT 0.0922 10959 0.0000 0.0000 1.0 POVINCPCT ASIANPCT 0.0787 10997 0.0000 0.0000 1.0 ASIANPCT HISPPCT 0.0744 11010 0.0000 0.0000 1.1 MEDHINC_CY HISPPCT SCH 0.0741 11010 0.0000 0.0001 1.0 BLACKPCT SCH 0.0730 11013 0.0000 0.0000 1.0 MEDHINC_CY HISPPCT 0.0726 11013 0.0000 0.0000 1.0 0.0000 BLACKPCT 0.0668 11030 0.0000 0.0000 1.0 HISPPCT SCH 0.0658 11032 0.0000 0.0000 1.0 HISPPCT 0.0653 11034 0.0000 0.3367 1.1 POVINCPCT SCH 0.0597 11049 0.0000 0.7326 1.0 0.0000 POVINCPCT 0.0526 11069 0.0000 0.0000 1.1 MEDHINC_CY ASIANPCT

86
0.0209 11153 0.0000 0.0000 1.0 ASIANPCT 0.0172 11163 0.0000 0.0000 1.0 0.0000 MEDHINC_CY
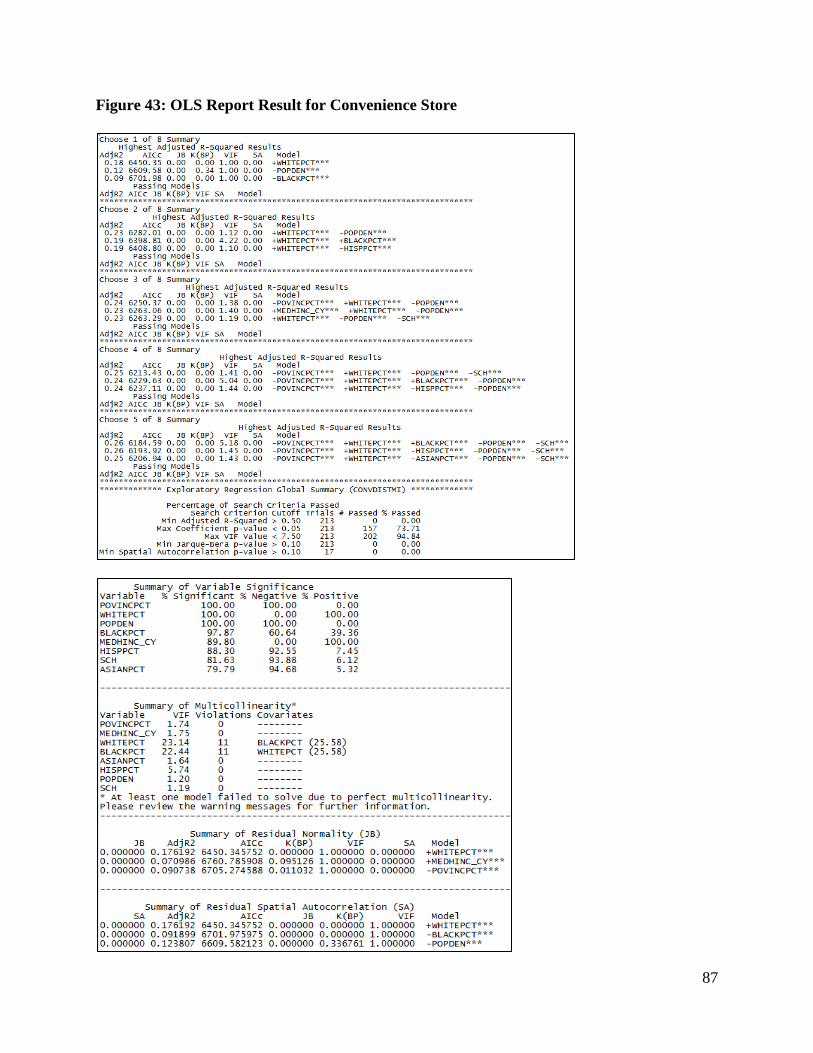
87
Figure 43: OLS Report Result for Convenience Store

88
Table 11: OLS Table Result for Convenience Stores
AdjR2 AICc JB K_BP MVIF SA X1 X2 X3 X4 X5 0.2579 6185 0.0000 0.0000 5.2 0.0000 POVINCPCT WHITEPCT BLACKPCT POPDEN SCH 0.2552 6194 0.0000 0.0000 1.5 0.0000 POVINCPCT WHITEPCT HISPPCT POPDEN SCH 0.2514 6207 0.0000 0.0000 1.4 0.0000 POVINCPCT WHITEPCT ASIANPCT POPDEN SCH 0.2493 6213 0.0000 0.0000 1.4 0.0000 POVINCPCT WHITEPCT POPDEN SCH 0.2478 6219 0.0000 0.0000 5.2 MEDHINC_CY WHITEPCT BLACKPCT POPDEN SCH 0.2465 6224 0.0000 0.0000 5.1 POVINCPCT MEDHINC_CY WHITEPCT BLACKPCT POPDEN 0.2454 6228 0.0000 0.0000 1.4 POVINCPCT BLACKPCT HISPPCT POPDEN SCH 0.2452 6229 0.0000 0.0000 1.5 MEDHINC_CY WHITEPCT HISPPCT POPDEN SCH 0.2445 6230 0.0000 0.0000 5.0 0.0000 POVINCPCT WHITEPCT BLACKPCT POPDEN 0.2435 6234 0.0000 0.0000 1.4 POVINCPCT WHITEPCT ASIANPCT HISPPCT POPDEN 0.2425 6237 0.0000 0.0000 1.7 POVINCPCT MEDHINC_CY WHITEPCT ASIANPCT POPDEN 0.2424 6237 0.0000 0.0000 1.4 0.0000 POVINCPCT WHITEPCT HISPPCT POPDEN 0.2422 6239 0.0000 0.0000 1.5 MEDHINC_CY WHITEPCT ASIANPCT POPDEN SCH 0.2422 6239 0.0000 0.0000 1.4 POVINCPCT BLACKPCT ASIANPCT HISPPCT POPDEN 0.2413 6241 0.0000 0.0000 5.0 MEDHINC_CY WHITEPCT BLACKPCT POPDEN 0.2411 6242 0.0000 0.0000 5.1 WHITEPCT BLACKPCT POPDEN SCH 0.2404 6245 0.0000 0.0000 1.5 MEDHINC_CY WHITEPCT ASIANPCT HISPPCT POPDEN 0.2404 6244 0.0000 0.0000 1.2 WHITEPCT HISPPCT POPDEN SCH 0.2398 6246 0.0000 0.0000 1.4 POVINCPCT WHITEPCT ASIANPCT POPDEN 0.2397 6246 0.0000 0.0000 1.5 MEDHINC_CY WHITEPCT POPDEN SCH 0.2395 6247 0.0000 0.0000 1.6 POVINCPCT MEDHINC_CY WHITEPCT POPDEN 0.2393 6249 0.0000 0.0000 1.4 MEDHINC_CY BLACKPCT ASIANPCT HISPPCT POPDEN 0.2387 6251 0.0000 0.0000 1.2 BLACKPCT ASIANPCT HISPPCT POPDEN SCH 0.2385 6250 0.0000 0.0000 1.4 MEDHINC_CY WHITEPCT HISPPCT POPDEN 0.2382 6250 0.0000 0.0000 1.4 0.0000 POVINCPCT WHITEPCT POPDEN 0.2370 6255 0.0000 0.0000 1.4 MEDHINC_CY WHITEPCT ASIANPCT POPDEN 0.2346 6265 0.0000 0.0000 1.5 MEDHINC_CY BLACKPCT HISPPCT POPDEN SCH 0.2344 6263 0.0000 0.0000 1.4 0.0000 MEDHINC_CY WHITEPCT POPDEN 0.2343 6263 0.0000 0.0000 1.2 0.0000 WHITEPCT POPDEN SCH 0.2339 6265 0.0000 0.0000 4.9 WHITEPCT BLACKPCT POPDEN 0.2337 6267 0.0000 0.0000 1.3 POVINCPCT BLACKPCT HISPPCT POPDEN 0.2331 6267 0.0000 0.0000 1.2 WHITEPCT HISPPCT POPDEN 0.2316 6274 0.0000 0.0000 1.2 BLACKPCT ASIANPCT HISPPCT POPDEN 0.2309 6276 0.0000 0.0000 1.2 BLACKPCT HISPPCT POPDEN SCH 0.2288 6283 0.0000 0.0000 1.4 MEDHINC_CY BLACKPCT HISPPCT POPDEN 0.2285 6282 0.0000 0.0000 1.1 0.0000 WHITEPCT POPDEN 0.2245 6296 0.0000 0.0000 1.1 BLACKPCT HISPPCT POPDEN 0.2240 6299 0.0000 0.0000 4.5 POVINCPCT WHITEPCT BLACKPCT SCH 0.2229 6304 0.0000 0.0000 1.4 POVINCPCT BLACKPCT ASIANPCT POPDEN SCH

89
0.2222 6306 0.0000 0.0000 1.4 POVINCPCT WHITEPCT ASIANPCT HISPPCT SCH 0.2220 6307 0.0000 0.0000 1.6 POVINCPCT MEDHINC_CY BLACKPCT ASIANPCT POPDEN 0.2202 6313 0.0000 0.0000 1.4 POVINCPCT BLACKPCT ASIANPCT HISPPCT SCH 0.2178 6319 0.0000 0.0000 1.4 POVINCPCT WHITEPCT HISPPCT SCH 0.2152 6328 0.0000 0.0000 1.3 POVINCPCT BLACKPCT ASIANPCT POPDEN 0.2144 6332 0.0000 0.0000 1.4 MEDHINC_CY BLACKPCT ASIANPCT POPDEN SCH 0.2139 6333 0.0000 0.0000 1.7 POVINCPCT MEDHINC_CY BLACKPCT POPDEN SCH 0.2128 6336 0.0000 0.0000 1.3 MEDHINC_CY BLACKPCT ASIANPCT POPDEN 0.2116 6340 0.0000 0.0000 1.4 POVINCPCT BLACKPCT POPDEN SCH 0.2106 6344 0.0000 0.0000 1.8 POVINCPCT MEDHINC_CY WHITEPCT ASIANPCT SCH 0.2095 6347 0.0000 0.0000 1.4 POVINCPCT WHITEPCT ASIANPCT SCH 0.2094 6347 0.0000 0.0000 4.5 MEDHINC_CY WHITEPCT BLACKPCT SCH 0.2090 6348 0.0000 0.0000 4.5 POVINCPCT MEDHINC_CY WHITEPCT BLACKPCT 0.2088 6349 0.0000 0.0000 1.6 POVINCPCT MEDHINC_CY BLACKPCT POPDEN 0.2077 6354 0.0000 0.0000 1.5 MEDHINC_CY WHITEPCT ASIANPCT HISPPCT SCH 0.2077 6354 0.0000 0.0000 1.7 POVINCPCT MEDHINC_CY WHITEPCT ASIANPCT HISPPCT 0.2072 6353 0.0000 0.0000 4.4 POVINCPCT WHITEPCT BLACKPCT 0.2061 6359 0.0000 0.0000 1.7 POVINCPCT MEDHINC_CY BLACKPCT ASIANPCT HISPPCT 0.2059 6360 0.0000 0.0000 1.4 MEDHINC_CY BLACKPCT ASIANPCT HISPPCT SCH 0.2055 6360 0.0000 0.0000 1.4 POVINCPCT WHITEPCT ASIANPCT HISPPCT 0.2051 6360 0.0000 0.0000 1.3 POVINCPCT BLACKPCT POPDEN 0.2046 6364 0.0000 0.0000 1.6 POVINCPCT MEDHINC_CY ASIANPCT HISPPCT POPDEN 0.2046 6364 0.0000 0.0000 1.7 POVINCPCT MEDHINC_CY HISPPCT POPDEN SCH 0.2037 6366 0.0000 0.0000 1.4 POVINCPCT BLACKPCT ASIANPCT HISPPCT 0.2033 6367 0.0000 0.0000 1.4 MEDHINC_CY WHITEPCT HISPPCT SCH 0.2028 6367 0.0000 0.0000 1.4 POVINCPCT WHITEPCT SCH 0.2017 6371 0.0000 0.0000 4.4 WHITEPCT BLACKPCT SCH 0.2017 6371 0.0000 0.0000 1.4 POVINCPCT WHITEPCT HISPPCT 0.2015 6373 0.0000 0.0000 1.4 POVINCPCT BLACKPCT HISPPCT SCH 0.2011 6373 0.0000 0.0000 4.3 MEDHINC_CY WHITEPCT BLACKPCT 0.2003 6377 0.0000 0.0000 1.2 WHITEPCT ASIANPCT HISPPCT SCH 0.2001 6377 0.0000 0.0000 1.3 MEDHINC_CY BLACKPCT POPDEN SCH 0.1997 6379 0.0000 0.0000 1.2 POVINCPCT ASIANPCT HISPPCT POPDEN SCH 0.1997 6378 0.0000 0.0000 1.4 MEDHINC_CY WHITEPCT ASIANPCT HISPPCT 0.1997 6380 0.0000 0.0000 1.7 POVINCPCT MEDHINC_CY ASIANPCT POPDEN SCH 0.1992 6380 0.0000 0.0000 1.5 POVINCPCT MEDHINC_CY HISPPCT POPDEN 0.1990 6380 0.0000 0.0000 1.3 MEDHINC_CY BLACKPCT POPDEN 0.1988 6380 0.0000 0.0000 1.2 WHITEPCT HISPPCT SCH 0.1983 6383 0.0000 0.0000 1.7 POVINCPCT MEDHINC_CY WHITEPCT ASIANPCT 0.1980 6384 0.0000 0.0000 1.4 MEDHINC_CY BLACKPCT ASIANPCT HISPPCT 0.1979 6384 0.0000 0.0000 1.1 BLACKPCT ASIANPCT HISPPCT SCH 0.1975 6386 0.0000 0.0000 1.2 POVINCPCT HISPPCT POPDEN SCH

90
0.1962 6390 0.0000 0.0000 1.5 POVINCPCT MEDHINC_CY ASIANPCT POPDEN 0.1956 6392 0.0000 0.0000 1.4 MEDHINC_CY WHITEPCT ASIANPCT SCH 0.1953 6392 0.0000 0.0000 1.3 POVINCPCT WHITEPCT ASIANPCT 0.1948 6393 0.0000 0.0000 1.4 MEDHINC_CY WHITEPCT HISPPCT 0.1947 6395 0.0000 0.0000 1.2 BLACKPCT ASIANPCT POPDEN SCH 0.1932 6398 0.0000 0.0000 1.1 BLACKPCT ASIANPCT POPDEN 0.1928 6399 0.0000 0.0000 4.2 0.0000 WHITEPCT BLACKPCT 0.1918 6404 0.0000 0.0000 1.1 POVINCPCT ASIANPCT HISPPCT POPDEN 0.1918 6404 0.0000 0.0000 1.7 POVINCPCT MEDHINC_CY POPDEN SCH 0.1913 6405 0.0000 0.0000 1.1 WHITEPCT ASIANPCT HISPPCT 0.1899 6409 0.0000 0.0000 1.1 POVINCPCT HISPPCT POPDEN 0.1897 6409 0.0000 0.0000 1.1 0.0000 WHITEPCT HISPPCT 0.1896 6410 0.0000 0.0000 1.4 MEDHINC_CY WHITEPCT ASIANPCT 0.1895 6409 0.0000 0.0000 1.3 POVINCPCT WHITEPCT 0.1890 6412 0.0000 0.0000 1.1 BLACKPCT ASIANPCT HISPPCT 0.1885 6413 0.0000 0.0000 1.5 POVINCPCT MEDHINC_CY POPDEN 0.1884 6414 0.0000 0.0000 1.4 MEDHINC_CY WHITEPCT SCH 0.1876 6417 0.0000 0.0000 1.2 MEDHINC_CY ASIANPCT HISPPCT POPDEN 0.1868 6419 0.0000 0.0000 1.3 POVINCPCT BLACKPCT HISPPCT 0.1862 6421 0.0000 0.0000 1.1 BLACKPCT POPDEN SCH 0.1860 6421 0.0000 0.0000 1.1 WHITEPCT ASIANPCT SCH 0.1859 6423 0.0000 0.0000 1.2 POVINCPCT ASIANPCT POPDEN SCH 0.1854 6424 0.0000 0.0000 1.4 MEDHINC_CY BLACKPCT HISPPCT SCH 0.1851 6423 0.0000 0.0000 1.0 BLACKPCT POPDEN 0.1831 6430 0.0000 0.0000 1.1 WHITEPCT SCH 0.1826 6432 0.0000 0.0000 1.1 MEDHINC_CY HISPPCT POPDEN 0.1822 6433 0.0000 0.0001 1.2 POVINCPCT POPDEN SCH 0.1822 6433 0.0000 0.0000 1.3 MEDHINC_CY WHITEPCT 0.1820 6434 0.0000 0.0000 1.1 BLACKPCT HISPPCT SCH 0.1804 6439 0.0000 0.0000 1.1 POVINCPCT ASIANPCT POPDEN 0.1792 6442 0.0000 0.0000 1.0 WHITEPCT ASIANPCT 0.1781 6446 0.0000 0.0000 1.4 MEDHINC_CY BLACKPCT HISPPCT 0.1774 6448 0.0000 0.0002 1.1 MEDHINC_CY ASIANPCT POPDEN 0.1772 6448 0.0000 0.0040 1.0 POVINCPCT POPDEN 0.1762 6450 0.0000 0.0000 1.0 0.0000 WHITEPCT 0.1739 6458 0.0000 0.0000 1.0 BLACKPCT HISPPCT 0.1701 6470 0.0000 0.0129 1.0 MEDHINC_CY POPDEN 0.1677 6481 0.0000 0.0000 1.7 POVINCPCT MEDHINC_CY BLACKPCT ASIANPCT SCH 0.1609 6501 0.0000 0.0000 1.6 POVINCPCT MEDHINC_CY BLACKPCT ASIANPCT 0.1606 6502 0.0000 0.0000 1.3 POVINCPCT BLACKPCT ASIANPCT SCH 0.1551 6520 0.0000 0.0000 1.6 POVINCPCT MEDHINC_CY ASIANPCT HISPPCT SCH 0.1514 6529 0.0000 0.0000 1.3 POVINCPCT BLACKPCT ASIANPCT

91
0.1480 6540 0.0000 0.0000 1.6 POVINCPCT MEDHINC_CY ASIANPCT HISPPCT 0.1455 6548 0.0000 0.0000 1.3 MEDHINC_CY BLACKPCT ASIANPCT SCH 0.1444 6550 0.0000 0.0000 1.3 MEDHINC_CY BLACKPCT ASIANPCT 0.1441 6550 0.0000 0.0000 1.1 HISPPCT POPDEN 0.1426 6557 0.0000 0.0000 1.6 POVINCPCT MEDHINC_CY HISPPCT SCH 0.1422 6558 0.0000 0.0000 1.2 POVINCPCT ASIANPCT HISPPCT SCH 0.1375 6572 0.0000 0.0000 1.7 POVINCPCT MEDHINC_CY BLACKPCT SCH 0.1354 6577 0.0000 0.0000 1.5 POVINCPCT MEDHINC_CY HISPPCT 0.1350 6578 0.0000 0.0000 1.1 POVINCPCT HISPPCT SCH 0.1348 6579 0.0000 0.0000 1.3 POVINCPCT BLACKPCT SCH 0.1319 6588 0.0000 0.0000 1.1 POVINCPCT ASIANPCT HISPPCT 0.1318 6588 0.0000 0.0000 1.6 POVINCPCT MEDHINC_CY BLACKPCT 0.1289 6597 0.0000 0.0000 1.6 POVINCPCT MEDHINC_CY ASIANPCT SCH 0.1275 6600 0.0000 0.0000 1.2 POVINCPCT BLACKPCT 0.1253 6606 0.0000 0.0000 1.0 POVINCPCT HISPPCT 0.1251 6608 0.0000 0.0000 1.5 POVINCPCT MEDHINC_CY ASIANPCT 0.1238 6610 0.0000 0.3368 1.0 0.0000 POPDEN 0.1207 6621 0.0000 0.0000 1.1 MEDHINC_CY ASIANPCT HISPPCT 0.1148 6638 0.0000 0.0000 1.1 BLACKPCT ASIANPCT SCH 0.1138 6640 0.0000 0.0000 1.1 BLACKPCT ASIANPCT 0.1127 6643 0.0000 0.0000 1.3 MEDHINC_CY BLACKPCT 0.1091 6655 0.0000 0.0000 1.1 POVINCPCT ASIANPCT SCH 0.1083 6657 0.0000 0.0000 1.6 POVINCPCT MEDHINC_CY SCH 0.1082 6656 0.0000 0.0000 1.0 MEDHINC_CY HISPPCT 0.1048 6666 0.0000 0.0000 1.4 POVINCPCT MEDHINC_CY 0.1026 6672 0.0000 0.0000 1.0 POVINCPCT ASIANPCT 0.0963 6691 0.0000 0.0008 1.1 POVINCPCT SCH 0.0921 6702 0.0000 0.0001 1.1 MEDHINC_CY ASIANPCT 0.0919 6702 0.0000 0.0000 1.0 0.0000 BLACKPCT 0.0907 6705 0.0000 0.0110 1.0 0.0000 POVINCPCT 0.0710 6761 0.0000 0.0951 1.0 0.0000 MEDHINC_CY 0.0580 6798 0.0000 0.0000 1.0 ASIANPCT HISPPCT 0.0569 6800 0.0000 0.0000 1.0 HISPPCT 0.0043 6940 0.0000 0.0000 1.0 ASIANPCT

92
Figure 44: OLS Report Result for Fast Food
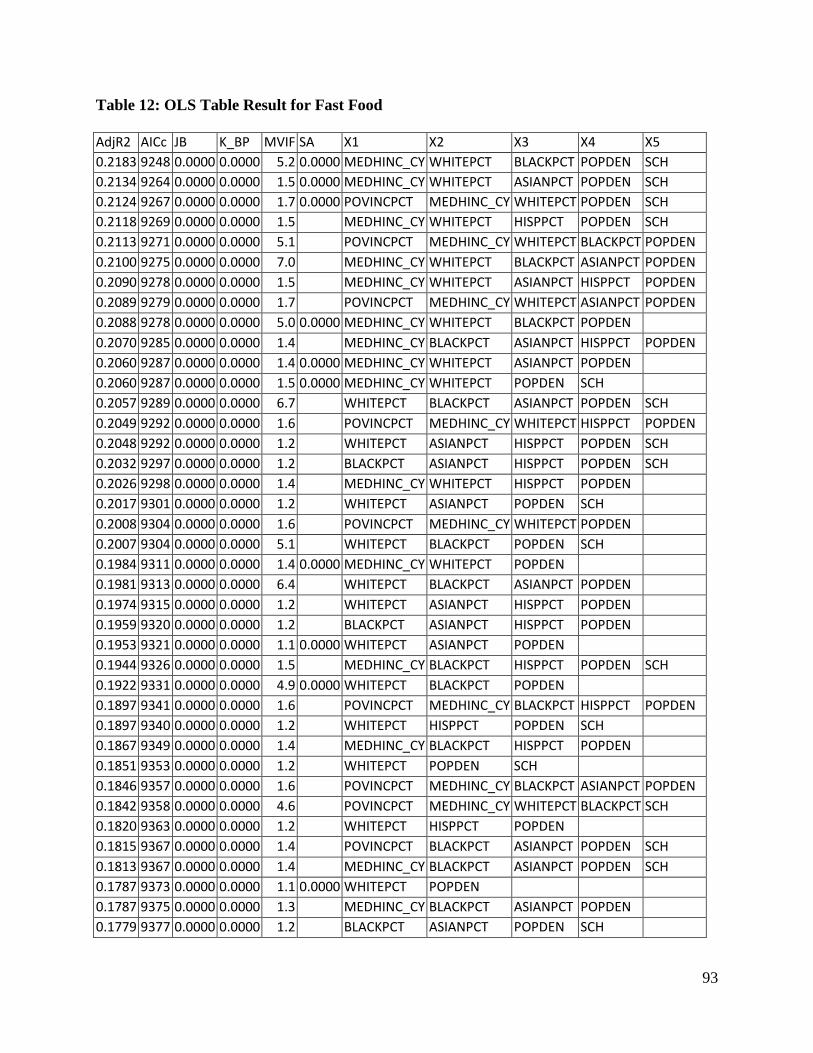
93
Table 12: OLS Table Result for Fast Food
AdjR2 AICc JB K_BP MVIF SA X1 X2 X3 X4 X5 0.2183 9248 0.0000 0.0000 5.2 0.0000 MEDHINC_CY WHITEPCT BLACKPCT POPDEN SCH 0.2134 9264 0.0000 0.0000 1.5 0.0000 MEDHINC_CY WHITEPCT ASIANPCT POPDEN SCH 0.2124 9267 0.0000 0.0000 1.7 0.0000 POVINCPCT MEDHINC_CY WHITEPCT POPDEN SCH 0.2118 9269 0.0000 0.0000 1.5 MEDHINC_CY WHITEPCT HISPPCT POPDEN SCH 0.2113 9271 0.0000 0.0000 5.1 POVINCPCT MEDHINC_CY WHITEPCT BLACKPCT POPDEN 0.2100 9275 0.0000 0.0000 7.0 MEDHINC_CY WHITEPCT BLACKPCT ASIANPCT POPDEN 0.2090 9278 0.0000 0.0000 1.5 MEDHINC_CY WHITEPCT ASIANPCT HISPPCT POPDEN 0.2089 9279 0.0000 0.0000 1.7 POVINCPCT MEDHINC_CY WHITEPCT ASIANPCT POPDEN 0.2088 9278 0.0000 0.0000 5.0 0.0000 MEDHINC_CY WHITEPCT BLACKPCT POPDEN 0.2070 9285 0.0000 0.0000 1.4 MEDHINC_CY BLACKPCT ASIANPCT HISPPCT POPDEN 0.2060 9287 0.0000 0.0000 1.4 0.0000 MEDHINC_CY WHITEPCT ASIANPCT POPDEN 0.2060 9287 0.0000 0.0000 1.5 0.0000 MEDHINC_CY WHITEPCT POPDEN SCH 0.2057 9289 0.0000 0.0000 6.7 WHITEPCT BLACKPCT ASIANPCT POPDEN SCH 0.2049 9292 0.0000 0.0000 1.6 POVINCPCT MEDHINC_CY WHITEPCT HISPPCT POPDEN 0.2048 9292 0.0000 0.0000 1.2 WHITEPCT ASIANPCT HISPPCT POPDEN SCH 0.2032 9297 0.0000 0.0000 1.2 BLACKPCT ASIANPCT HISPPCT POPDEN SCH 0.2026 9298 0.0000 0.0000 1.4 MEDHINC_CY WHITEPCT HISPPCT POPDEN 0.2017 9301 0.0000 0.0000 1.2 WHITEPCT ASIANPCT POPDEN SCH 0.2008 9304 0.0000 0.0000 1.6 POVINCPCT MEDHINC_CY WHITEPCT POPDEN 0.2007 9304 0.0000 0.0000 5.1 WHITEPCT BLACKPCT POPDEN SCH 0.1984 9311 0.0000 0.0000 1.4 0.0000 MEDHINC_CY WHITEPCT POPDEN 0.1981 9313 0.0000 0.0000 6.4 WHITEPCT BLACKPCT ASIANPCT POPDEN 0.1974 9315 0.0000 0.0000 1.2 WHITEPCT ASIANPCT HISPPCT POPDEN 0.1959 9320 0.0000 0.0000 1.2 BLACKPCT ASIANPCT HISPPCT POPDEN 0.1953 9321 0.0000 0.0000 1.1 0.0000 WHITEPCT ASIANPCT POPDEN 0.1944 9326 0.0000 0.0000 1.5 MEDHINC_CY BLACKPCT HISPPCT POPDEN SCH 0.1922 9331 0.0000 0.0000 4.9 0.0000 WHITEPCT BLACKPCT POPDEN 0.1897 9341 0.0000 0.0000 1.6 POVINCPCT MEDHINC_CY BLACKPCT HISPPCT POPDEN 0.1897 9340 0.0000 0.0000 1.2 WHITEPCT HISPPCT POPDEN SCH 0.1867 9349 0.0000 0.0000 1.4 MEDHINC_CY BLACKPCT HISPPCT POPDEN 0.1851 9353 0.0000 0.0000 1.2 WHITEPCT POPDEN SCH 0.1846 9357 0.0000 0.0000 1.6 POVINCPCT MEDHINC_CY BLACKPCT ASIANPCT POPDEN 0.1842 9358 0.0000 0.0000 4.6 POVINCPCT MEDHINC_CY WHITEPCT BLACKPCT SCH 0.1820 9363 0.0000 0.0000 1.2 WHITEPCT HISPPCT POPDEN 0.1815 9367 0.0000 0.0000 1.4 POVINCPCT BLACKPCT ASIANPCT POPDEN SCH 0.1813 9367 0.0000 0.0000 1.4 MEDHINC_CY BLACKPCT ASIANPCT POPDEN SCH 0.1787 9373 0.0000 0.0000 1.1 0.0000 WHITEPCT POPDEN 0.1787 9375 0.0000 0.0000 1.3 MEDHINC_CY BLACKPCT ASIANPCT POPDEN 0.1779 9377 0.0000 0.0000 1.2 BLACKPCT ASIANPCT POPDEN SCH

94
0.1769 9380 0.0000 0.0000 1.3 POVINCPCT BLACKPCT ASIANPCT POPDEN 0.1752 9384 0.0000 0.0000 1.1 BLACKPCT ASIANPCT POPDEN 0.1737 9391 0.0000 0.0000 6.7 MEDHINC_CY WHITEPCT BLACKPCT ASIANPCT SCH 0.1729 9393 0.0000 0.0000 4.5 MEDHINC_CY WHITEPCT BLACKPCT SCH 0.1729 9393 0.0000 0.0000 1.2 BLACKPCT HISPPCT POPDEN SCH 0.1715 9398 0.0000 0.0000 1.5 MEDHINC_CY WHITEPCT ASIANPCT HISPPCT SCH 0.1712 9399 0.0000 0.0000 1.7 POVINCPCT MEDHINC_CY WHITEPCT HISPPCT SCH 0.1705 9401 0.0000 0.0000 1.8 POVINCPCT MEDHINC_CY WHITEPCT ASIANPCT SCH 0.1684 9408 0.0000 0.0000 1.4 MEDHINC_CY BLACKPCT ASIANPCT HISPPCT SCH 0.1677 9410 0.0000 0.0000 6.6 POVINCPCT MEDHINC_CY WHITEPCT BLACKPCT ASIANPCT 0.1669 9411 0.0000 0.0000 1.1 BLACKPCT HISPPCT POPDEN 0.1660 9414 0.0000 0.0000 4.5 POVINCPCT MEDHINC_CY WHITEPCT BLACKPCT 0.1658 9416 0.0000 0.0000 1.7 POVINCPCT MEDHINC_CY BLACKPCT POPDEN SCH 0.1657 9416 0.0000 0.0000 1.7 POVINCPCT MEDHINC_CY WHITEPCT ASIANPCT HISPPCT 0.1642 9421 0.0000 0.0000 6.4 POVINCPCT WHITEPCT BLACKPCT ASIANPCT SCH 0.1631 9424 0.0000 0.0000 1.7 POVINCPCT MEDHINC_CY BLACKPCT ASIANPCT HISPPCT 0.1627 9424 0.0000 0.0000 6.4 MEDHINC_CY WHITEPCT BLACKPCT ASIANPCT 0.1625 9426 0.0000 0.0000 1.4 POVINCPCT WHITEPCT ASIANPCT HISPPCT SCH 0.1618 9427 0.0000 0.0000 6.2 WHITEPCT BLACKPCT ASIANPCT SCH 0.1614 9429 0.0000 0.0000 1.2 POVINCPCT ASIANPCT HISPPCT POPDEN SCH 0.1613 9428 0.0000 0.0000 4.3 MEDHINC_CY WHITEPCT BLACKPCT 0.1608 9430 0.0000 0.0000 1.4 MEDHINC_CY WHITEPCT ASIANPCT HISPPCT 0.1606 9431 0.0000 0.0000 1.4 MEDHINC_CY WHITEPCT HISPPCT SCH 0.1603 9433 0.0000 0.0000 1.4 POVINCPCT BLACKPCT ASIANPCT HISPPCT SCH 0.1602 9432 0.0000 0.0000 1.6 POVINCPCT MEDHINC_CY BLACKPCT POPDEN 0.1601 9433 0.0000 0.0000 1.2 WHITEPCT ASIANPCT HISPPCT SCH 0.1599 9434 0.0000 0.0000 1.6 POVINCPCT MEDHINC_CY ASIANPCT HISPPCT POPDEN 0.1590 9436 0.0000 0.0000 1.4 MEDHINC_CY WHITEPCT ASIANPCT SCH 0.1580 9439 0.0000 0.0000 1.4 MEDHINC_CY BLACKPCT ASIANPCT HISPPCT 0.1579 9439 0.0000 0.0000 4.5 POVINCPCT WHITEPCT BLACKPCT SCH 0.1577 9440 0.0000 0.0000 1.1 BLACKPCT ASIANPCT HISPPCT SCH 0.1568 9442 0.0000 0.0000 1.1 POVINCPCT ASIANPCT HISPPCT POPDEN 0.1568 9442 0.0000 0.0000 4.4 WHITEPCT BLACKPCT SCH 0.1561 9445 0.0000 0.0000 1.7 POVINCPCT MEDHINC_CY WHITEPCT ASIANPCT 0.1554 9447 0.0000 0.0000 1.3 MEDHINC_CY BLACKPCT POPDEN SCH 0.1552 9449 0.0000 0.0000 1.7 POVINCPCT MEDHINC_CY ASIANPCT POPDEN SCH 0.1545 9449 0.0000 0.0000 1.7 POVINCPCT MEDHINC_CY WHITEPCT SCH 0.1536 9451 0.0000 0.0000 1.3 MEDHINC_CY BLACKPCT POPDEN 0.1534 9454 0.0000 0.0000 1.7 POVINCPCT MEDHINC_CY HISPPCT POPDEN SCH 0.1533 9453 0.0000 0.0000 1.6 POVINCPCT MEDHINC_CY WHITEPCT HISPPCT 0.1526 9455 0.0000 0.0000 1.4 POVINCPCT WHITEPCT ASIANPCT SCH 0.1525 9456 0.0000 0.0000 1.2 POVINCPCT ASIANPCT POPDEN SCH

95
0.1522 9455 0.0000 0.0000 6.1 WHITEPCT BLACKPCT ASIANPCT 0.1513 9459 0.0000 0.0000 1.5 POVINCPCT MEDHINC_CY ASIANPCT POPDEN 0.1507 9460 0.0000 0.0000 1.1 WHITEPCT ASIANPCT HISPPCT 0.1506 9460 0.0000 0.0000 1.4 MEDHINC_CY WHITEPCT ASIANPCT 0.1497 9463 0.0000 0.0000 1.1 WHITEPCT ASIANPCT SCH 0.1494 9464 0.0000 0.0000 1.1 POVINCPCT ASIANPCT POPDEN 0.1490 9466 0.0000 0.0000 1.4 POVINCPCT BLACKPCT ASIANPCT HISPPCT 0.1490 9465 0.0000 0.0000 1.4 MEDHINC_CY WHITEPCT HISPPCT 0.1485 9467 0.0000 0.0000 1.1 BLACKPCT ASIANPCT HISPPCT 0.1484 9468 0.0000 0.0000 1.4 POVINCPCT BLACKPCT POPDEN SCH 0.1475 9471 0.0000 0.0000 1.5 POVINCPCT MEDHINC_CY HISPPCT POPDEN 0.1467 9472 0.0000 0.0000 1.1 ASIANPCT HISPPCT POPDEN 0.1464 9473 0.0000 0.0000 1.1 BLACKPCT POPDEN SCH 0.1462 9473 0.0000 0.0000 4.2 0.0000 WHITEPCT BLACKPCT 0.1459 9477 0.0000 0.0000 1.7 POVINCPCT MEDHINC_CY BLACKPCT HISPPCT SCH 0.1446 9477 0.0000 0.0000 1.0 0.0000 BLACKPCT POPDEN 0.1439 9481 0.0000 0.0000 1.4 MEDHINC_CY WHITEPCT SCH 0.1434 9483 0.0000 0.0000 1.2 POVINCPCT HISPPCT POPDEN SCH 0.1430 9483 0.0000 0.0000 1.3 POVINCPCT WHITEPCT ASIANPCT 0.1423 9485 0.0000 0.0000 1.0 WHITEPCT ASIANPCT 0.1399 9493 0.0000 0.0000 1.6 POVINCPCT MEDHINC_CY WHITEPCT 0.1395 9494 0.0000 0.0000 1.1 POVINCPCT HISPPCT POPDEN 0.1390 9497 0.0000 0.0000 1.7 POVINCPCT MEDHINC_CY POPDEN SCH 0.1377 9499 0.0000 0.0000 1.2 WHITEPCT HISPPCT SCH 0.1361 9503 0.0000 0.0000 1.0 ASIANPCT POPDEN 0.1355 9506 0.0000 0.0000 1.5 POVINCPCT MEDHINC_CY POPDEN 0.1351 9506 0.0000 0.0000 1.3 MEDHINC_CY WHITEPCT 0.1346 9509 0.0000 0.0000 1.1 HISPPCT POPDEN SCH 0.1346 9509 0.0000 0.0000 1.1 MEDHINC_CY HISPPCT POPDEN 0.1336 9510 0.0000 0.0000 1.1 HISPPCT POPDEN 0.1334 9513 0.0000 0.0000 1.4 MEDHINC_CY BLACKPCT HISPPCT SCH 0.1314 9518 0.0000 0.0001 1.2 POVINCPCT POPDEN SCH 0.1297 9524 0.0000 0.0000 1.6 POVINCPCT MEDHINC_CY BLACKPCT HISPPCT 0.1292 9524 0.0000 0.0035 1.0 POVINCPCT POPDEN 0.1278 9528 0.0000 0.0000 1.1 WHITEPCT HISPPCT 0.1238 9541 0.0000 0.0000 1.4 MEDHINC_CY BLACKPCT HISPPCT 0.1231 9542 0.0000 0.0000 1.1 WHITEPCT SCH 0.1208 9547 0.0000 0.0088 1.0 0.0000 POPDEN 0.1194 9556 0.0000 0.0000 1.7 POVINCPCT MEDHINC_CY BLACKPCT ASIANPCT SCH 0.1155 9563 0.0000 0.0000 1.0 0.0000 WHITEPCT 0.1126 9575 0.0000 0.0000 1.4 POVINCPCT BLACKPCT HISPPCT SCH 0.1123 9575 0.0000 0.0000 1.3 POVINCPCT BLACKPCT ASIANPCT SCH

96
0.1116 9577 0.0000 0.0000 1.6 POVINCPCT MEDHINC_CY BLACKPCT ASIANPCT 0.1114 9577 0.0000 0.0000 1.1 BLACKPCT HISPPCT SCH 0.1065 9591 0.0000 0.0000 1.3 POVINCPCT BLACKPCT ASIANPCT 0.1037 9598 0.0000 0.0000 1.0 BLACKPCT HISPPCT 0.1007 9608 0.0000 0.0000 1.1 BLACKPCT ASIANPCT SCH 0.0989 9615 0.0000 0.0000 1.6 POVINCPCT MEDHINC_CY ASIANPCT HISPPCT SCH 0.0986 9613 0.0000 0.0000 1.1 BLACKPCT ASIANPCT 0.0961 9622 0.0000 0.0000 1.2 POVINCPCT ASIANPCT HISPPCT SCH 0.0910 9637 0.0000 0.0000 1.6 POVINCPCT MEDHINC_CY ASIANPCT HISPPCT 0.0894 9640 0.0000 0.0000 1.1 POVINCPCT ASIANPCT HISPPCT 0.0753 9681 0.0000 0.0000 1.6 POVINCPCT MEDHINC_CY HISPPCT SCH 0.0707 9694 0.0000 0.0000 1.7 POVINCPCT MEDHINC_CY BLACKPCT SCH 0.0697 9695 0.0000 0.0000 1.1 POVINCPCT ASIANPCT SCH 0.0673 9702 0.0000 0.0000 1.5 POVINCPCT MEDHINC_CY HISPPCT 0.0671 9703 0.0000 0.0000 1.1 MEDHINC_CY ASIANPCT HISPPCT 0.0659 9706 0.0000 0.0000 1.1 POVINCPCT HISPPCT SCH 0.0658 9705 0.0000 0.0000 1.0 POVINCPCT ASIANPCT 0.0656 9706 0.0000 0.0000 1.0 ASIANPCT HISPPCT 0.0643 9710 0.0000 0.0000 1.6 POVINCPCT MEDHINC_CY BLACKPCT 0.0602 9721 0.0000 0.0000 1.0 POVINCPCT HISPPCT 0.0545 9737 0.0000 0.0000 1.3 POVINCPCT BLACKPCT SCH 0.0509 9746 0.0000 0.0000 1.2 POVINCPCT BLACKPCT 0.0487 9752 0.0000 0.0000 1.3 MEDHINC_CY BLACKPCT 0.0444 9763 0.0000 0.0000 1.0 0.0000 BLACKPCT 0.0439 9764 0.0000 0.0000 1.0 HISPPCT 0.0365 9785 0.0000 0.0000 1.1 MEDHINC_CY ASIANPCT 0.0351 9790 0.0000 0.0000 1.6 POVINCPCT MEDHINC_CY SCH 0.0313 9799 0.0000 0.0000 1.4 POVINCPCT MEDHINC_CY 0.0297 9803 0.0000 0.0046 1.1 POVINCPCT SCH 0.0296 9802 0.0000 0.0000 1.0 ASIANPCT 0.0271 9809 0.0000 0.1160 1.0 0.0000 POVINCPCT 0.0008 9878 0.0000 0.0000 1.0 0.0000 MEDHINC_CY