disentangling the compact city drivers and pressures ... · on compact city driving forces is...
TRANSCRIPT

Disentangling the compact city drivers and pressures: Barcelonaas a case study
Downloaded from: https://research.chalmers.se, 2019-07-09 18:58 UTC
Citation for the original published paper (version of record):Adelfio, M., Kain, J., Thuvander, L. et al (2018)Disentangling the compact city drivers and pressures: Barcelona as a case studyNorsk Geografisk Tidsskrift, 72(5): 287-304http://dx.doi.org/10.1080/00291951.2018.1547788
N.B. When citing this work, cite the original published paper.
research.chalmers.se offers the possibility of retrieving research publications produced at Chalmers University of Technology.It covers all kind of research output: articles, dissertations, conference papers, reports etc. since 2004.research.chalmers.se is administrated and maintained by Chalmers Library
(article starts on next page)

Full Terms & Conditions of access and use can be found athttp://www.tandfonline.com/action/journalInformation?journalCode=sgeo20
Norsk Geografisk Tidsskrift - Norwegian Journal ofGeography
ISSN: 0029-1951 (Print) 1502-5292 (Online) Journal homepage: http://www.tandfonline.com/loi/sgeo20
Disentangling the compact city drivers andpressures: Barcelona as a case study
Marco Adelfio, Jaan-Henrik Kain, Liane Thuvander & Jenny Stenberg
To cite this article: Marco Adelfio, Jaan-Henrik Kain, Liane Thuvander & Jenny Stenberg (2018):Disentangling the compact city drivers and pressures: Barcelona as a case study, Norsk GeografiskTidsskrift - Norwegian Journal of Geography, DOI: 10.1080/00291951.2018.1547788
To link to this article: https://doi.org/10.1080/00291951.2018.1547788
© 2018 The Author(s). Published by InformaUK Limited, trading as Taylor & FrancisGroup
Published online: 05 Dec 2018.
Submit your article to this journal
View Crossmark data

Disentangling the compact city drivers and pressures: Barcelona as a case studyMarco Adelfio , Jaan-Henrik Kain , Liane Thuvander & Jenny Stenberg
Department of Architecture and Civil Engineering, Chalmers University of Technology, SE-412 96, Gothenburg, Sweden
ABSTRACTThe compact city is globally acknowledged as the most adequate urban model to encouragesustainable urban development. Its validity is often assumed, despite the lack of clarity on whatsuch compactness entails. The knowledge gap is even wider regarding how different drivers andpressures influence the development of more compact cities. Therefore, the authors analyseindirect and underlying processes (drivers) and more direct events, actions, and processes(pressures) affecting compact city development. Since compact city driving forces are extensivelyinfluenced by local situations, their research focused on district-level case studies within thecompact city of Barcelona Municipality. Mixed methods were used, and the authors used bothqualitative and quantitative data. The results revealed that drivers and pressures can bothsupport and counteract compact city qualities and therefore any intervention has to be tailoredto local conditions. In particular, the results of the in-depth analysis of local pressures and theirprogression over time foster an understanding of context-related nuances, thereby shiftingattention from taken-for-granted compact city qualities to the driving forces that producebeneficial compactness. The authors conclude that the diversity of drivers and pressures requiresthe involvement of a multiplicity of stakeholders and actors in urban planning, implementation,and management.
ARTICLE HISTORYReceived 7 July 2017Accepted 9 November 2018
EDITORSPer Gunnar Røe, KerstinPotthoff, Catriona Turner
KEYWORDSBarcelona, compact city,driving forces, local scale
Adelfio, M., Kain, J.-H., Thuvander, L. & Stenberg, J. 2018. Disentangling the compact city drivers and pressures:Barcelona as a case study. Norsk Geografisk Tidsskrift–Norwegian Journal of Geography Vol. 00, 00–00. ISSN0029-1951.
Introduction
The concept of the compact city is globally acknowledgedin both research and policy as the preferred urban patternto be applied to present and future cities (EU 2007; Euro-pean Commission 2011; Hofstad 2012; UN-Habitat 2012).Nevertheless, the concept is too often taken for grantedand its definition remains unclear and non-uniform(Churchman 1999; Burton 2002; Neuman 2005). Thisnot only affects the understanding of compact city qual-ities (Boyko & Cooper 2011), but also becomes evenmore significant when the different driving forces behindcompact city development are examined (Holman et al.2015). In response to this vagueness, in this paper weexplore urban driving forces, divided into indirect/under-lying processes (drivers) and more direct events, actions,and processes (pressures), and their diverse consequencesfor compact city development. Despite previous researchon development drivers (Christiansen & Loftsgarden2011; Zondag & Borsboom n.d.), it remains uncertain
how such drivers impinge on compact cities, and whatdegree of influence and types of pressure they exert.Therefore, the objectives of this paper are:
1. To identify drivers that indirectly encourage compactcity patterns
2. To understand how such drivers are linked to pressureswith a direct influence on such urban development.
In relation to the extensive debate on the pros and consof compact cities (Neuman 2005; Boyko & Cooper 2011;Holman et al. 2015), and since the focus is on urban driv-ing forces not urban qualities, we assume that compactcity development ismainly beneficial but we acknowledgethat there are also many problematic aspects.
Literature review
From its origins, the compact city as a concept has beenreferred to as an ideal model of city (Dantzig & Saaty1973). It has become an established concept through an
© 2018 The Author(s). Published by Informa UK Limited, trading as Taylor & Francis GroupThis is an Open Access article distributed under the terms of the Creative Commons Attribution-NonCommercial-NoDerivatives License (http://creativecommons.org/licenses/by-nc-nd/4.0/), which permits non-commercial re-use, distribution, and reproduction in any medium, provided the original work is properly cited, and is not altered, transformed, or built upon inany way.
CONTACT Marco Adelfio [email protected]
Norsk Geografisk Tidsskrift–Norwegian Journal of Geographyhttps://doi.org/10.1080/00291951.2018.1547788

extensive body of scientific literature (Jenks et al. 1996;Churchman 1999; Dieleman & Wegener 2004; Boyko& Cooper 2011; Westerink et al. 2013) and there is aclear predominance of positive views on the compactcity (Moliní & Salgado 2012). According to Hofstad(2012, 2), the compact city has ‘emerged as the preferredresponse to the goal of sustainable development’ inrecent decades. Still, the features of a compact city arenot univocally defined in the literature (Neuman2005). In this paper, we adopt a wide understanding ofurban compactness, in which intensity and diversity inland use and functions are seen potentially to lead toimproved mobility, resource use, social equity, socialdiversity, economy, and green spaces (Boyko & Cooper2011).
By contrast, the academic literature on compact citydriving forces is relatively limited. Although there arearticles on driving forces leading to urban sprawl (e.g. Sal-vati & Sabbi 2014; Marraccini et al. 2015), the literatureon driving forces linked to urban compactness is scarce.Furthermore, driving forces are typically discussed inquite general and unspecific terms referring to macro-scale processes, such as urbanization pressures, climateand climate change, energy scarcity, economic growth,and growing or declining populations (OECD 2012; Liet al. 2017; Pili et al. 2017). The compact city is thus typi-cally idealized and dogmatized (Holman et al. 2015), butwithout exploring the driving forces supporting itsimplementation. Such idealization is also favoured bythe fact that the concept is heavily endorsed by inter-national institutions such as the UN, the EU, and theOECD, all of which promote compact city policies(European Commission 2011; OECD 2012; UN-Habitat2012).
However, some authors adopt a more explicit city-scale perspective to analyse compact city driving forces.Metzger et al. (2015) highlight that such forces areexerted by the public administrative sector and by theprivate entrepreneurial field. At the institutional level,local politicians are considered the most relevant driv-ing force, for two reasons. First, local politicians aspireto obtain tax revenues from a creative class that issearching for ‘a vibrant city life of small shops andcafés’ (Tunström & Bradley 2015, 82). Second, theyassociate the efficiency of concentrated infrastructurewith economies of scale. This institutional perspectiveon compact city driving forces is shared by Dijkink &Knippenberg (2001), who highlight the role of Dutchinstitutions in promoting compact city policies tolimit welfare-state expenditures by creating a mix ofwelfare state cities and entrepreneurial cities. Metzgeret al. (2015) consider that the main driving force inthe private sector is developers, who are willing to
maximize their profits by constructing high-rise anddense buildings in attractive areas. This understandingis shared by Brueckner (2011).
The above-mentioned perspective mainly relates tothe supply side, represented by institutions and develo-pers. However, an important feature of urban drivingforces is that they act from both the supply and demandsides, sometimes simultaneously (Gray 2007). From thedemand perspective, Vilà (2014) examines the role ofneighbourhood associations in promoting social equityin Barcelona, and Barrios & Rodriguez (2008) explorehome buyers’ preferences for multifamily dwellings inSpanish large cities. Walks (2015) connects compactcity development with gentrification and considersaffluent populations as a key driving force. By outcom-peting other social tiers, the demand of the high-incomepopulation for central locations contributes not only todensification, but also to the privatization of such areas.Morikawa (2011) and Rosenthal & Strange (2004)clearly adopt an economic point of view, in their ana-lyses of the relationship between service industry pro-ductivity and urban population density. In this sense,the service industry acts as a compact city drivingforce by demanding population agglomeration. Froman urban green structure position, Artmann (2013)shows how different sociodemographic conditions(population size, household size, living space, popu-lation age, and number of private cars) can be linkedto soil sealing.
Although above-mentioned examples are relevantand valuable, the current literature on compact city driv-ing forces is not sufficiently consolidated, which led us toformulate the two research questions presented in theIntroduction. Since it is not possible to extract areliable list of the driving forces from the literature,knowledge development needs to be supported byempirical research based on inductive and pragmaticapproaches.
Analytical framework and research questions
An analytical framework has been developed with inspi-ration from the driving forces, pressures, states, impacts,responses (DPSIR) model, that was originally introducedby the European Environment Agency (EuropeanEnvironment Agency 1999) and is a causal chainmodel inspired by earlier similar models used by, forexample, the OECD (Hammond et al. 1995) and theUnited Nations (UN 1996). Although DPSIR has notbeen exempt from criticism (Niemeijer & De Groot2008), it has been found useful for exploring casualrelationships between driving forces and land use change(Tscherning et al. 2012). Since land use change is a core
2 M. Adelfio et al.

issue in compact city development, the DPSIR modelprovides a sound basis for structuring the wide array ofdriving forces as dynamic drivers and pressures thatimpact on static compact city qualities. This is vital inorder to avoid ending up with a set of non-specific driv-ing forces, as has often been the case in previous studies.
The analytical efforts presented in this paper focus onthe drivers and pressures in the DPSIR model. Since thefocus of the study is not on compact city qualities – thestates and impacts in the DPSIR model – the drivers andpressures are merely linked indirectly to compact cityqualities in the form of a rationale (Table 1). Theresponses of the DPSIR model are not applied to theanalysis.
Taking into account the diversity of definitions ofthe term ‘driving forces’ in literature citing theDPSIR model (European Environment Agency 1999;Dávila Cabanillas 2007; Kristensen n.d.), the most suit-able definition for our research is the one adopted bythe United Nations, which considers drivers are ‘indir-ect’ or ‘underlying’ driving forces related ‘to fundamen-tal processes in society’ (United Nations EnvironmentProgramme 2007, 22), whereas pressures are referredto as more direct and therefore have more tangibleimpacts (UN 2014). Applied in this way, the analyticalframework is consistent with the objectives of thispaper, as it allows us to respond to the followingresearch questions:
1. Which drivers affect compact city development?2. Which associated pressures affect compact city
development?
By adding yet another analytical element, namely Cron-shaw & McCullock’s (2008) interpretation of KurtLewin’s force-field analysis, it becomes possible to ident-ify the most important features of driving forces – theirperformance over time. In turn, the latter can be usedto support the analysis of a second set of researchquestions:
1. What has been the recent evolution of the drivers andpressures?
2. What are the desired future trends in drivers andpressures?
Cronshaw & McCullock (2008, 90) emphasize howLewin refers to driving forces as a ‘dynamic concept’causing ‘change over time’ (without citing a reference),and they state that such forces ‘could not be measureddirectly but must be inferred indirectly from the observa-ble facts’ (Cronshaw & McCullock 2008, 101). Hence,dynamism, indirectness, and induction may be
considered as important elements linked to the under-standing of driving forces.
Methods
Drawing on the United Nations EnvironmentProgramme (UNEP) (United Nations EnvironmentProgramme 2007) and Cronshaw & McCullock (2008),the indirect character of driving forces requires a loca-lized and inductive case study approach to allow for col-lection of data and analysis. The local scale plays anessential role, for two reasons. First, the insufficientdepth of literature on compact city driving forces hindersthe extraction of drivers and pressures from literature bymeans of a deductive or theoretical process. Second, ourliterature review shows that local contexts have aremarkable influence on drivers and pressures. In conse-quence, if the few comprehensive papers that deal withthe compact city drivers and/or pressures are used to cat-egorize drivers or pressures, the results would be weaklysubstantiated and potentially biased. This would also bethe case if a list of drivers and pressures were constructedon the basis of papers in which a partial perspective onspecific issues is adopted. Therefore, inductive analysisand extraction of concepts from local case studies is fun-damental. Understanding compact city drivers andpressures from empirical case study provides a higherdegree of solidity and consistency, thereby acknowled-ging that using the same research process with referenceto a different context could provide a different result.
Methodological steps
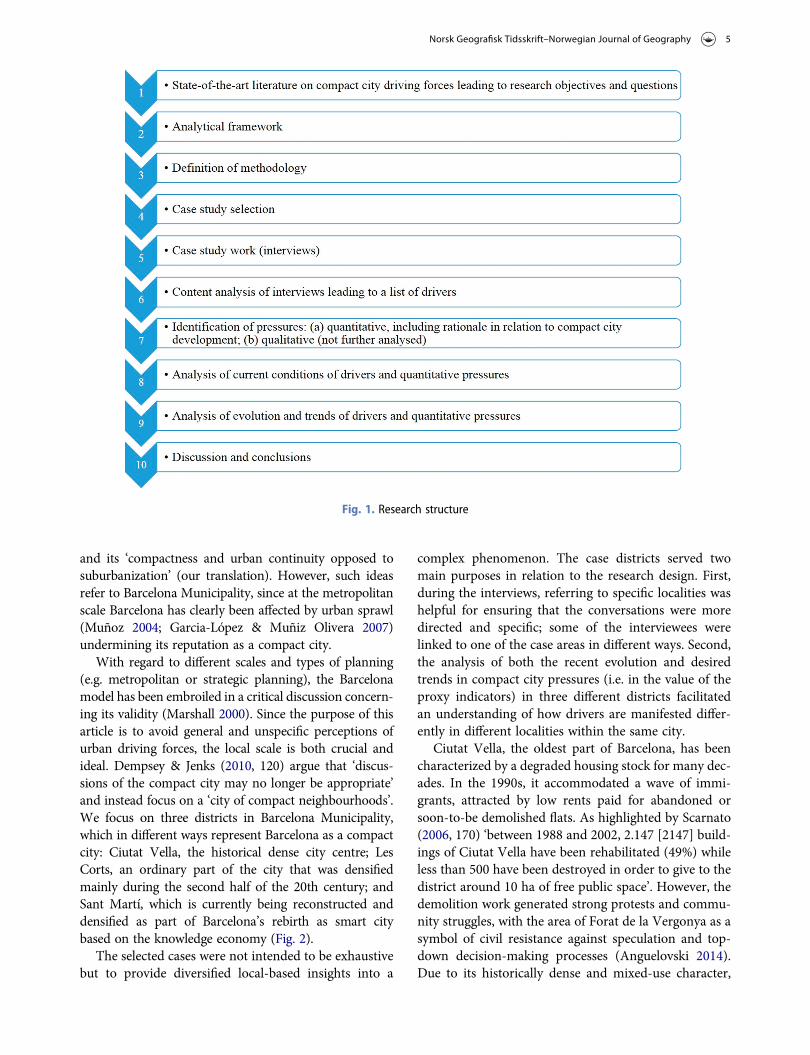
Since local contexts can be expected to present specifictypes of drivers and pressures, the overall approachwas inductive and based on interviews. Based on the pre-mise described above, consistency was prioritized overuniversalization, and the research structure and meth-odological steps were defined with this in mind(Fig. 1). The initial steps comprised the review of the lit-erature (the state-of-the-art literature on compact citydriving forces leading to limits and scope of research),development of the analytical framework, and definitionof method. As a next step, Barcelona, a prototype of theEuropean Mediterranean compact city, was identified asa case study, following the rationale explained in the nextsubsection (‘Barcelona as a case study’). The analysis ofthe case material was divided into four parts, respectivelylinked to the four research questions: (1) content analysisof interviews, which led to a list of drivers; (2) identifi-cation of pressures; (3) analysis of the recent evolutionof drivers and pressures based on statistical data;
Norsk Geografisk Tidsskrift–Norwegian Journal of Geography 3

and (4) analysis of the desired future trends of driversand pressures.
Barcelona as a case study
Barcelona is considered a typical example of a EuropeanMediterranean city historically associated with a compact
urban development (Busquets 2005). The exemplary char-acter of Barcelona planning within the compact citydebate is evident. For example, Bohigas (2005) (cited byCapel 2006, 1, translation from Spanish) has identifiedthe principal strengths of the Barcelona planning modelas the ‘reconstruction of the city instead of its expansion’
Table 1. Links between drivers and pressures relating to Barcelona as a compact city, formulated as dynamic quantitative proxyindicators capturing evolution over time, with the rationale for a respective pressure provided in terms of effects on compact citydevelopment
DriversPressures (captured as the evolution of quantitative proxy
indicators displayed below) Rationale in relation to compact city qualities
Social culture Diversification of ethnic groups (entropy index) Ethnic/social diversity is an expected compact city (CC)* quality(Jenks et al. 1996; Saaty 2013).
Gentrification (income index with Barcelona base value = 100) Gentrification influences social equity, which is an expected CCquality (Burton 2000).
Municipal assistance in activities organized by local-level civiccentres (no. of occurrences)
Affects social participation and involvement; CC is expected to leadto social activity and interaction (Rani 2015).
Citizen complaints per district of residence to the Oficina deInformación al Consumidor (municipal office for consumerdemands) (% of total complaints in Barcelona)
Citizen complaints constitute one driving force for increased socialjustice, which is an expected CC quality (Oelofse 2003).
Price diversification (standard deviation for second-hand housingprice within districts)
Price diversity favours social equity, which is a claimed CC quality(Burton 2000).
Urban planning andpolicy
Increase/decrease in pedestrian priority areas (ha) Has an effect on pedestrian-friendly urban spaces, which is anexpected CC quality (OECD 2012)
Increase/decrease of green area/inhabitant (m2/capita) The size of green spaces is a critical CC quality linked toenvironmental sustainability (Tillie et al. 2012).
Market economy Increase/decrease in economic activity (m2 of floor area) Changes in non-residential use influence economic vitality, which isa CC characteristic (Metzger et al. 2015).
Historical settlementprocesses
Preservation of the historical character of an area, measured aschanges in number of dwellings constructed before 1960 (% ofall dwellings)
Historical neighbourhoods are often more compact. Europeanhistoric centres are associated with a compact city form (Busquets2005). Historical areas tend to be denser and more diverse (Lim &Kain, 2016).
Immigration Increase/decrease of the share of non-Spanish population (% ofall inhabitants)
Affects cosmopolitanism and social diversity, which are expected CCqualities (Saaty 2013)
Immigration rate (immigration-related additions to the censusper 1000 inhabitants)
The balance of newly arrived immigrants in relation to existinginhabitants influences cultural and social diversity (Saaty 2013).
Diversification in ethnic groups (entropy index) Affects social diversity, which is an expected CC quality (Jenks et al.1996)
Increase/decrease in the rental price for retail space (EUR/m2 permonth)
Has an influence on retail rents, whereby relatively low rents favourbusinesses run by immigrants (according to the interviewees) andthus contributes to social diversity, which is a CC quality (Saaty2013).
Culture and heritage Increase/decrease in the number of restored facades Affects maintenance of cultural heritage, which is considered a CCvalue (UNESCO 2016)
Ageing population Changes in age distribution, measured as an ageing index(population aged > 65 years/population aged 0–15 years)×100
An ageing population requires walking distances to facilities, whichis a CC quality (OECD 2012).
Education Education as an integrative process, measured as the increase/decrease in the share of non-Spanish children in pre-school (%of all pre-school children)
Affects social integration, which is a desired CC quality (Oelofse2003)
Environmentalconsiderations/risks
Changes in domestic water consumption (litres per capita) Reduction in resources consumption is expected in a CC (Jenks et al.1996)
Economic crisis Increase/decrease in the rental price for retail space (EUR/m2 permonth)
Decrease in rental price may lead to the following CC qualities:social equity (Burton 2000) and diversification of activities (Jenkset al. 1996).
Increase/decrease in second-hand housing price (EUR/m2) Decrease in housing prices may lead to social diversity and socialequity – both of which are CC qualities (Burton 2000; Saaty 2013)– through increased affordability.
Increase/decrease in family income (income index – Barcelonabase value = 100)
Increased family incomes may lead to social diversity and socialequity – both of which are CC qualities (Burton 2000; Saaty 2013)– through increased affordability.
Changes in families’ disposable income, measured as economiceffort for housing (newly built dwelling price/family income)
Less economic effort may lead to social diversity and social equity –both of which are CC qualities (Burton 2000; Saaty 2013) –through increased affordability.
Tourism Changes in the volume of tourists (no. of hotel beds) The presence of tourists is linked to the generation of incomes andimproved street cleaning/public spaces, according to theinterviewees. The OECD (2015) argues that tourism may beassociated with an attractive mixed-use compact development.
Note: *CC – compact city
4 M. Adelfio et al.
and its ‘compactness and urban continuity opposed tosuburbanization’ (our translation). However, such ideasrefer to Barcelona Municipality, since at the metropolitanscale Barcelona has clearly been affected by urban sprawl(Muñoz 2004; Garcia-López & Muñiz Olivera 2007)undermining its reputation as a compact city.
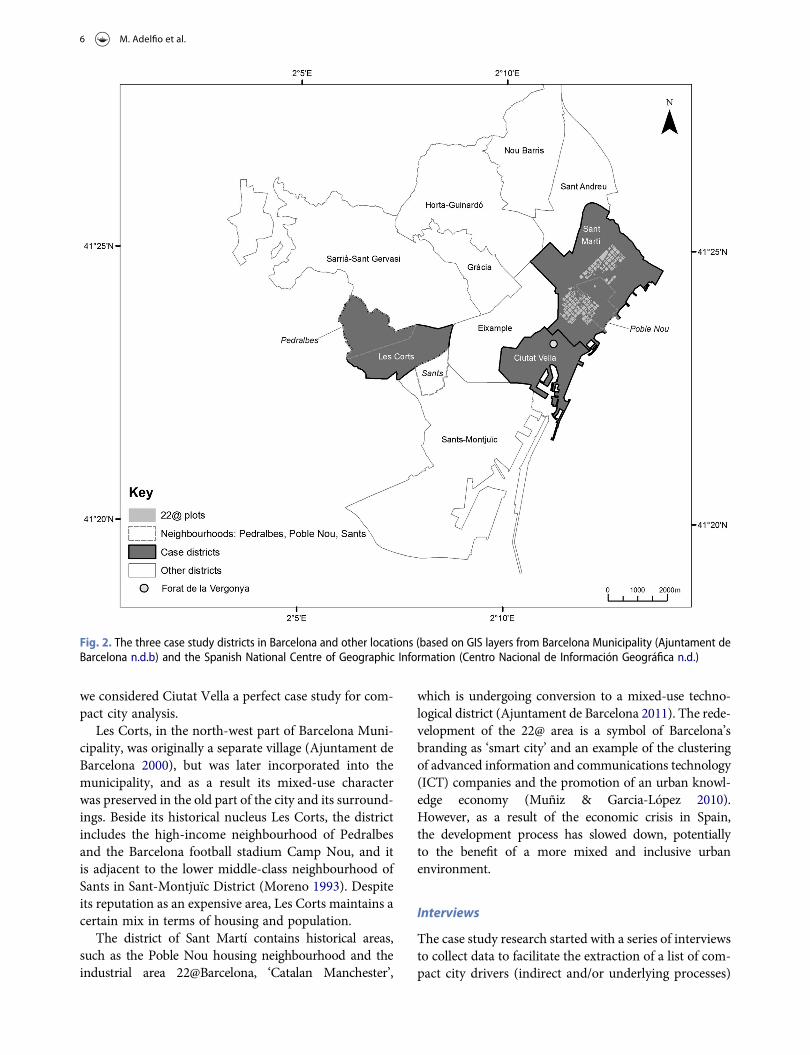
With regard to different scales and types of planning(e.g. metropolitan or strategic planning), the Barcelonamodel has been embroiled in a critical discussion concern-ing its validity (Marshall 2000). Since the purpose of thisarticle is to avoid general and unspecific perceptions ofurban driving forces, the local scale is both crucial andideal. Dempsey & Jenks (2010, 120) argue that ‘discus-sions of the compact city may no longer be appropriate’and instead focus on a ‘city of compact neighbourhoods’.We focus on three districts in Barcelona Municipality,which in different ways represent Barcelona as a compactcity: Ciutat Vella, the historical dense city centre; LesCorts, an ordinary part of the city that was densifiedmainly during the second half of the 20th century; andSant Martí, which is currently being reconstructed anddensified as part of Barcelona’s rebirth as smart citybased on the knowledge economy (Fig. 2).
The selected cases were not intended to be exhaustivebut to provide diversified local-based insights into a
complex phenomenon. The case districts served twomain purposes in relation to the research design. First,during the interviews, referring to specific localities washelpful for ensuring that the conversations were moredirected and specific; some of the interviewees werelinked to one of the case areas in different ways. Second,the analysis of both the recent evolution and desiredtrends in compact city pressures (i.e. in the value of theproxy indicators) in three different districts facilitatedan understanding of how drivers are manifested differ-ently in different localities within the same city.
Ciutat Vella, the oldest part of Barcelona, has beencharacterized by a degraded housing stock for many dec-ades. In the 1990s, it accommodated a wave of immi-grants, attracted by low rents paid for abandoned orsoon-to-be demolished flats. As highlighted by Scarnato(2006, 170) ‘between 1988 and 2002, 2.147 [2147] build-ings of Ciutat Vella have been rehabilitated (49%) whileless than 500 have been destroyed in order to give to thedistrict around 10 ha of free public space’. However, thedemolition work generated strong protests and commu-nity struggles, with the area of Forat de la Vergonya as asymbol of civil resistance against speculation and top-down decision-making processes (Anguelovski 2014).Due to its historically dense and mixed-use character,
Fig. 1. Research structure
Norsk Geografisk Tidsskrift–Norwegian Journal of Geography 5
we considered Ciutat Vella a perfect case study for com-pact city analysis.
Les Corts, in the north-west part of Barcelona Muni-cipality, was originally a separate village (Ajuntament deBarcelona 2000), but was later incorporated into themunicipality, and as a result its mixed-use characterwas preserved in the old part of the city and its surround-ings. Beside its historical nucleus Les Corts, the districtincludes the high-income neighbourhood of Pedralbesand the Barcelona football stadium Camp Nou, and itis adjacent to the lower middle-class neighbourhood ofSants in Sant-Montjuïc District (Moreno 1993). Despiteits reputation as an expensive area, Les Corts maintains acertain mix in terms of housing and population.
The district of Sant Martí contains historical areas,such as the Poble Nou housing neighbourhood and theindustrial area 22@Barcelona, ‘Catalan Manchester’,
which is undergoing conversion to a mixed-use techno-logical district (Ajuntament de Barcelona 2011). The rede-velopment of the 22@ area is a symbol of Barcelona’sbranding as ‘smart city’ and an example of the clusteringof advanced information and communications technology(ICT) companies and the promotion of an urban knowl-edge economy (Muñiz & Garcia-López 2010).However, as a result of the economic crisis in Spain,the development process has slowed down, potentiallyto the benefit of a more mixed and inclusive urbanenvironment.
Interviews
The case study research started with a series of interviewsto collect data to facilitate the extraction of a list of com-pact city drivers (indirect and/or underlying processes)
Fig. 2. The three case study districts in Barcelona and other locations (based on GIS layers from Barcelona Municipality (Ajuntament deBarcelona n.d.b) and the Spanish National Centre of Geographic Information (Centro Nacional de Información Geográfica n.d.)
6 M. Adelfio et al.
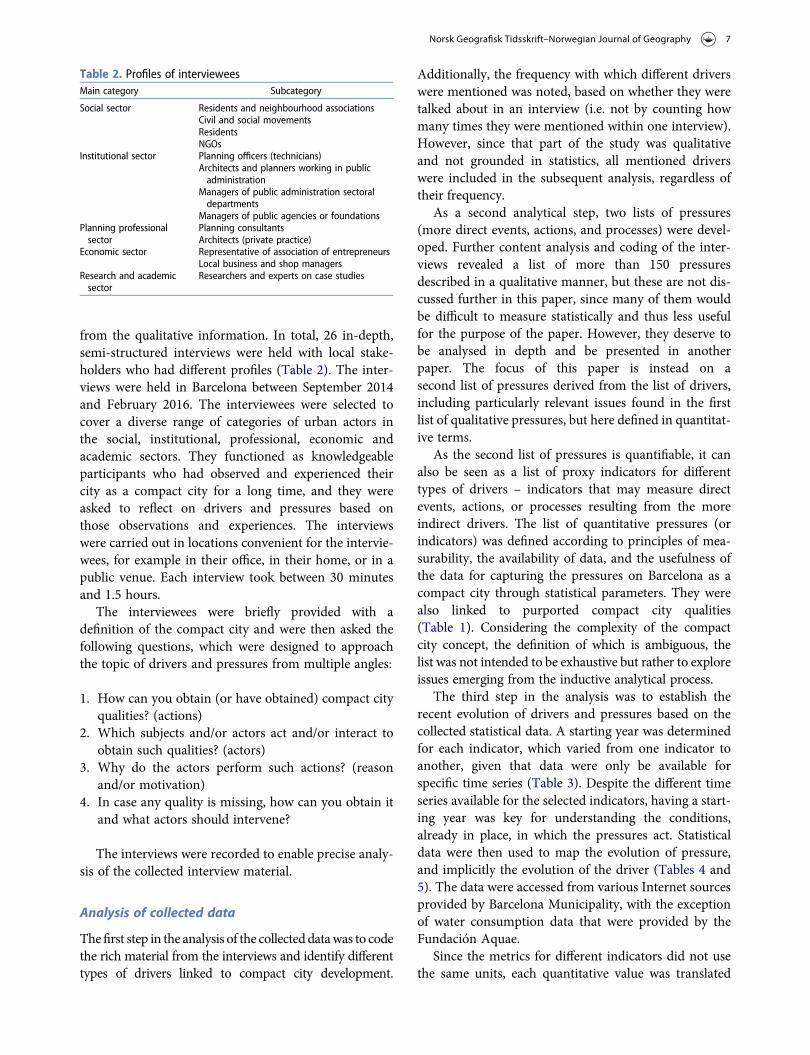
from the qualitative information. In total, 26 in-depth,semi-structured interviews were held with local stake-holders who had different profiles (Table 2). The inter-views were held in Barcelona between September 2014and February 2016. The interviewees were selected tocover a diverse range of categories of urban actors inthe social, institutional, professional, economic andacademic sectors. They functioned as knowledgeableparticipants who had observed and experienced theircity as a compact city for a long time, and they wereasked to reflect on drivers and pressures based onthose observations and experiences. The interviewswere carried out in locations convenient for the intervie-wees, for example in their office, in their home, or in apublic venue. Each interview took between 30 minutesand 1.5 hours.
The interviewees were briefly provided with adefinition of the compact city and were then asked thefollowing questions, which were designed to approachthe topic of drivers and pressures from multiple angles:
1. How can you obtain (or have obtained) compact cityqualities? (actions)
2. Which subjects and/or actors act and/or interact toobtain such qualities? (actors)
3. Why do the actors perform such actions? (reasonand/or motivation)
4. In case any quality is missing, how can you obtain itand what actors should intervene?
The interviews were recorded to enable precise analy-sis of the collected interview material.
Analysis of collected data
Thefirst step in the analysis of the collected datawas to codethe rich material from the interviews and identify differenttypes of drivers linked to compact city development.
Additionally, the frequency with which different driverswere mentioned was noted, based on whether they weretalked about in an interview (i.e. not by counting howmany times they were mentioned within one interview).However, since that part of the study was qualitativeand not grounded in statistics, all mentioned driverswere included in the subsequent analysis, regardless oftheir frequency.
As a second analytical step, two lists of pressures(more direct events, actions, and processes) were devel-oped. Further content analysis and coding of the inter-views revealed a list of more than 150 pressuresdescribed in a qualitative manner, but these are not dis-cussed further in this paper, since many of them wouldbe difficult to measure statistically and thus less usefulfor the purpose of the paper. However, they deserve tobe analysed in depth and be presented in anotherpaper. The focus of this paper is instead on asecond list of pressures derived from the list of drivers,including particularly relevant issues found in the firstlist of qualitative pressures, but here defined in quantitat-ive terms.
As the second list of pressures is quantifiable, it canalso be seen as a list of proxy indicators for differenttypes of drivers – indicators that may measure directevents, actions, or processes resulting from the moreindirect drivers. The list of quantitative pressures (orindicators) was defined according to principles of mea-surability, the availability of data, and the usefulness ofthe data for capturing the pressures on Barcelona as acompact city through statistical parameters. They werealso linked to purported compact city qualities(Table 1). Considering the complexity of the compactcity concept, the definition of which is ambiguous, thelist was not intended to be exhaustive but rather to exploreissues emerging from the inductive analytical process.
The third step in the analysis was to establish therecent evolution of drivers and pressures based on thecollected statistical data. A starting year was determinedfor each indicator, which varied from one indicator toanother, given that data were only be available forspecific time series (Table 3). Despite the different timeseries available for the selected indicators, having a start-ing year was key for understanding the conditions,already in place, in which the pressures act. Statisticaldata were then used to map the evolution of pressure,and implicitly the evolution of the driver (Tables 4 and5). The data were accessed from various Internet sourcesprovided by Barcelona Municipality, with the exceptionof water consumption data that were provided by theFundación Aquae.
Since the metrics for different indicators did not usethe same units, each quantitative value was translated
Table 2. Profiles of intervieweesMain category Subcategory
Social sector Residents and neighbourhood associationsCivil and social movementsResidentsNGOs
Institutional sector Planning officers (technicians)Architects and planners working in publicadministration
Managers of public administration sectoraldepartments
Managers of public agencies or foundationsPlanning professionalsector
Planning consultantsArchitects (private practice)
Economic sector Representative of association of entrepreneursLocal business and shop managers
Research and academicsector
Researchers and experts on case studies
Norsk Geografisk Tidsskrift–Norwegian Journal of Geography 7

into quartiles to place all indicators on a comparablescale regarding their starting values and evolution. Thequartiles indicated the relative high or low positioningof a given indicator for a district in relation to all districtsin Barcelona. The following codification was used for the
classification of indicators values as quartiles: Q1 (lowlevel), Q2 (medium-low level), Q3 (medium-highlevel), and Q4 (high level). Both a low level and ahigh level can be either positive or negative, dependingon the positive (e.g. green areas per inhabitant) or
Table 3. Proxy indicators as quartiles at the starting year for the three districts, including evaluation of the situation at the starting year (Q1= low, Q2 = medium low, Q3 = medium high, Q4 = high. Evaluation: positive ++, rather positive +, rather negative -, and negative --)
Drivers Pressures (quantitative proxy indicators)Initialyear
Quartiles (Q)
CiutatVella
LesCorts
SantMartí
Social culture Entropy index 2004 Q4 ++ Q1 -- Q2 -Income index (as a gentrification measure) – Barcelona = 100 2010 Q1 -- Q4 -- Q3 ++Assistance in activities organized by local-level civic centres 2014 Q4 ++ Q3 + Q4 ++% of citizen complaints per district of residence 2011 Q2 + Q2 + Q4 --Standard deviation in second-hand housing price within districts (pricediversity)
2011 Q2 - Q4 ++ Q3 +
Urban planning and policy Pedestrian priority areas (ha) 2010 Q4 ++ Q1 -- Q3 +Green areas/inhabitant (m2) 2010 Q2 - Q4 ++ Q4 ++
Market economy Economic activity (m2) 2010 Q3 + Q2 - Q4 ++Historical settlement processes Dwellings built before 1960/total number of dwellings (%) 2010 Q4 ++ Q1 -- Q2 -Immigration Non-Spanish population (%) 2010 Q4 -- Q1 -- Q3 ++
Immigration rate (immigrants per 1000 inhabitants) 2010 Q4 -- Q3 ++ Q2 +Entropy index (min = 0; max = 1) 2004 Q4 ++ Q1 -- Q2 -Retail rental price (EUR/m2 per month) 2007 Q4 -- Q3 ++ Q2 +
Culture and heritage Number of restored facades (Barcelona posa’t guapa) 2010 Q1 -- Q1 -- Q3 +Ageing population Ageing index (population aged = > 65 years/population aged 0–15 years)
× 1002010 Q1 -- Q4 -- Q1 --
Education Non-Spanish children in pre-school (%) 2010 Q4 -- Q1 -- Q3 ++Environmental considerations/risks
Water domestic consumption (litres per capita) 2007 Q1 ++ Q4 -- Q2 +
Economic crisis Retail rental price (EUR/m2 per month) 2007 Q4 -- Q3 ++ Q2 +Second-hand housing price (EUR/m2) 2010 Q2 - Q4 -- Q3 ++Income index – Barcelona = 100 2010 Q1 -- Q4 -- Q3 ++Economic effort (dwelling price/family income) 2010 Q4 -- Q4 -- Q3 -
Tourism Number of hotel beds 2010 Q4 -- Q3 - Q4 --
Table 4. Evolution of proxy indicators expressed through quantitative proxy indicators for the three case districts in Barcelona
Drivers Pressures (quantitative indicators)
Time period(unit, calculation
method)
Evolution
CiutatVella Les Corts Sant Martí
Social culture Entropy index 2004-2014 (Diff.) 0.04 0.04 0.07Income index 2010-2013 (% Var.) 2.66 −0.28 −1.1Assistance in activities organised by local-level civic centres 2014-2015 (% Var.) −22.3 2.8 50.5Citizen complaints per district of residence (%) 2011-2015 (Diff.) −0.5 −0.8 −0.2Standard deviation in second-hand housing price withindistricts
2011-2015 (% Var.) 58.42 13.62 83.87
Urban planning and policy Pedestrian priority areas (ha) 2010-2014 (% Var.) 18.45 13.64 27.36Green areas/inhabitant (m2) 2010-2014 (% Var.) 3.33 6.59 2.74
Market economy Economic activity (m2) 2010-2014 (% Var.) 5.28 1.67 5.54Historical settlement processes Dwellings built before 1960/total number of dwellings (%) 2011-2015 (Diff.) −1.5 −1.1 −1.8Immigration Foreigners (%) 2010-2014 (Diff.) 1.9 −0.3 −0.2
Immigration rate 2010-2014 (Diff.) −14.9 −4.9 −6.5Entropy index 2004-2014 (Diff.) 0.04 0.04 0.07Retail rental price 2007-2011 (% Var.) −16 −12 −22.6
Culture and heritage Number of restored facades Sum 2010-2014 210 42 144Ageing population Ageing index 2010-2014 (Diff.) −10.56 12.48 0.81Education Foreigners in pre-school (%) 2010-2014 (Diff.) 9.1 1.2 4.3Environmental considerations/risks
Water domestic consumption 2007-2012 (% Var.) 1.8 −8.2 −6.5
Economic crisis Retail rental price (EUR/m2 per month) 2007-2011 (% Var.) −16 −12 −22.6Second-hand housing price (EUR/m2) 2010-2014 (% Var.) −2.19 −15.04 −11.45Income index 2010-2013 (% Var.) 2.66 −0.28 −1.1Economic effort 2010-2013 (% Var.) −7.25 −66.04 −9.6
Tourism Number of hotel beds 2010-2014 (% Var.) 9.85 1.94 18.87
8 M. Adelfio et al.

negative (e.g. water consumption) significance of eachindicator.
The fourth and final analytical step was aimed at explor-ing the desired trend of each quantitative indicator, takinginto account the dynamic character of drivers and press-ures. By comparing the initial value of indicators withtheir evolution, it became possible to provide recommen-dations for the future desirable trend of indicators (increas-ing, decreasing, or stabilizing) (Table 5). The desired trenddepended on the initial status and evolution of each indi-cator in relation to the aspired compact city development.
Since this perspective was an integral part of the analysisof gathered material, the approach is described in moredetail in the subsection ‘Initial situation of compact citypressures and drivers’.
Empirical results and analysis
Qualitative study: indirect drivers affectingcompact city development
The content analysis of the interviews provided the fol-lowing categories of drivers, which the intervieweesregarded as having positive consequences on the creationof Barcelona as a compact city: social culture; urbanplanning and policy; market economy; historical settle-ment processes; immigration; technology and economyof innovation; culture and heritage; ageing population;education; and environmental considerations and risks.The first two categories (social culture and urban plan-ning and policy) were the most frequently mentioned cat-egories in the interviews (22 and 18 times respectively),while the last category (environmental considerationsand risks) was only mentioned once. Furthermore, econ-omic crisis and tourismwere considered as drivers havingboth positive and negative effects on the compact city.However, we decided to include them in our drivingforce analysis, despite acknowledging their ambivalentvalue. One of the mentioned drivers – technology andeconomy of innovation – was later omitted from thequantitative analysis because no up-to-date and reliablequantitative indicators were found.
Quantitative study: direct and locally specificpressures affecting compact city development
The second part of the analysis resulted in a list ofdynamic pressures that that can be expressed as the evol-ution of quantitative proxy indicators and for which use-ful data were available (Table 1). The analysis focusedspecifically on the drivers list derived from the interviews(see the preceding subsection) in the sense that eachpressure or indicator is linked to a specific driver. Therationale for each indicator in relation to its effect oncompact city development is described in Table 1.
Initial situation of compact city pressures anddrivers
The first step of the third analytical effort was the estab-lishment of an initial situation in a given year, describedusing quartiles (explained in the subsection ‘Analysis ofcollected data’), as well as an evaluation of whether thatsituation was positive or negative in relation to the
Table 5. Comprehensive iconographic matrix of urban indicators
Norsk Geografisk Tidsskrift–Norwegian Journal of Geography 9

rationale described in Table 1. A summary of the dataand evaluation of each indicator is presented inTable 3, which shows how the pressures, and implicitlythe drivers, affect the three case districts. In the followingsubsections ‘Social culture’ to ‘Tourism’, which containdetailed descriptions of how the pressures and indicatorslink to the drivers, the value of the indicators is primarilydescribed using quartiles (as explained in the subsection‘Analysis of collected data’), and only showing numericvalues where needed for clarity.
Social cultureSocial culture is a multifaceted driver, represented byproxy indicators connected to concepts of diversity,wealth, gentrification, and social participation or demand.Ethnic diversity was measured through an entropy indexused ‘for identifying spatial units that are completelyhomogenous (inhabited by only one population group,H2 = 0) or maximally diversified (all population groupsare equal in size, H2 = 1)’ (Apparicio et al. 2014, 3),where H2 denotes the entropy index in the article byApparicio et al. Within the three case districts, the initialvalue of this index, measured in 2004, was relatively low,especially in Les Corts (0.11; Q 1) (see Table 3 for quar-tiles for all indicators) and Sant Martí (0.12; Q2). CiutatVella had a higher degree of diversification (0.38; Q4),which probably stemmed from its historical character,central localization, and tradition of hosting immigrants.
Wealth was measured through an income index,which measured the average disposable income percapita within households. Such an index is not merelya wealth indicator as it also tracks signs of gentrificationwhen analysed over time. In our study, it was comparedwith the value for the entire municipality of Barcelona(Barcelona base value = 100). In 2010, two of the threedistricts, Ciutat Vella (75.2; Q1) and Sant Martí (85.4;Q3) were below the municipal value, while Les Corts, tra-ditionally inhabited by the upper middle class, had amuch higher value (140.7; Q4).
Social participation and demand was explored bymeans of municipal assistance in activities organizedby local civic centres, for which data were availablefrom 2014, as well as the district’s percentage of citizencomplaints to the municipal government, with the start-ing year 2011. The former appears to have been relativelyhigh in all three districts, especially in Ciutat Vella andSant Martí (Q4), and to a lesser extent in Les Corts(Q3). By contrast, the district’s percentage of citizencomplaints to the municipal government had a Q4value in Sant Martí (14.1% of total complaints in Barce-lona) and lower levels (Q2) in Ciutat Vella and Les Corts.Although social complaints may be perceived as a sign ofproblematic situations, they may also generate a positive
outcome, in accordance with Vilà (2014), who under-lines the role of community action in shaping Barcelo-na’s neighbourhoods and improving its quality of life.
Social diversity was represented through the entropyindex and the standard deviation (a measure of dispersalwithin a distribution) of purchasing prices for second-hand housing within the districts, thus excluding newconstructions). Such standard deviations in second-hand housing prices within districts constitute anothersocial diversity indicator (data available from 2011),and in this regard Les Corts remained in the top quartile(Q4), since the district had a mix of middle-class apart-ments with luxury single-family homes (in the Pedralbesneighbourhood) and compratively lower middle-classhousing close to Sants, the working-class neighbourhoodaround Barcelona’s main train station. Sant Martí, too,was relatively highly ranked in the quartile distribution(Q3), while Ciutat Vella was positioned within thesecond quartile Q2.
Urban planning and policyAmong urban planning and policy indicators, the mostrepresentative indicators at district level were the pres-ence of pedestrian priority areas and the availability ofgreen areas (m2) per inhabitant. Walkability is a desiredcharacteristic of the compact city (Talen & Koschinsky2013). There were more pedestrian-friendly areas in Ciu-tat Vella (Q4, year 2010), as is common in historicalcentres, than in Les Corts (Q3) and Sant Martí (Q1).As expected, the historical centre had a medium-low(Q2, year 2010) level of green areas per inhabitant,while both Les Corts and Sant Martí had a relativelyhigh level (Q4).
Market economyMarket economy was analysed through the floor area ofeconomic activities in 2010. For historical reasons, hav-ing an industrial past and a technologically oriented pre-sent, Sant Martí was positioned in the top quartile (Q4),while Ciutat Vella and Les Corts had Q3 and Q2 values,respectively.
Historical settlement processesFrom the interviews, it became apparent that theimplementation of the compact city ideal might be easierin older urban areas than in newer ones, since cities werecompact and dense historically. Also, historical areastend to be more dense and diverse as a result of theiremergent character (Lim & Kain 2016). For our case dis-tricts, statistics at the district level showed the percentageof dwellings built before 1960 and still existing in 2010.Ciutat Vella included a very high percentage of suchdwellings (84.4%; Q4), while for Sant Martí the
10 M. Adelfio et al.

corresponding figure was 27.9% (Q2), affected by itsmore industrial and less residential tradition as well astransition to brownfield sites. Les Corts was within thebottom quartile (18.7%, Q1), due to its more recent his-tory, with the exception of its small historical nucleus.
ImmigrationImmigration was examined through the percentage ofthe non-Spanish population in each district, the immi-gration rate, the entropy index (already mentioned fordriving force above and therefore omitted here), andthe rental price for retail space. The latter was selectedbecause the interviewees highlighted how immigrantstook over a part of the local retail trade during the econ-omic crisis, taking advantage of the opportunity to rentretail spaces at relatively low prices. As expected, the per-centage of non-Spanish population in the starting year2010 was much higher in Ciutat Vella (40.5%; Q4)than in Les Corts (11.1%; Q1) and Sant Martí (15.2%;Q3). The immigration rate, seen as the increase in popu-lation resulting from immigration, clearly related to thepercentage of foreigners and confirmed our expectationsfor Ciutat Vella (Q4 in 2010) but not for Les Corts (Q3)and Sant Martí (Q2). The rental price for retail space(EUR per m2) was selected from 2007 as the initialyear to obtain a five-year evolution of this indicatorbecause prices for very recent years were not available.With regard to this indicator, the historical centre of Ciu-tat Vella, with a high tourism appeal, remained in quar-tile Q4, the upper middle class district of Les Corts in Q3,and the multifaceted Sant Martí, with the old Poble Nouneighbourhood and the recently renewed 22@ area,in Q2.
Culture and heritageCulture and heritage are extremely complex urbanissues. Since regeneration and renewal were underlinedas prominent aspects in the interviews, the selectedproxy indicator was related to the municipal pro-grammed ‘Barcelona posa’t guapa’ (‘Barcelona becomebeautiful’) leading to the restoration of several buildingfacades. Interestingly, among the three districts, SantMartí had the highest number of restored facades in2010 (24; Q3) compared with Ciutat Vella (16; Q1)and Les Corts (13; Q1). However, it should be borne inmind that the renewal process in the historical centrestarted much earlier than in Sant Martí (Scarnato2006) and that this indicator only pertained to a specificpublic-led programme.
Ageing populationAgeing populations are a global phenomenon and theyrequire ‘access to local services without the need of a
car’ (OECD 2012, 43). From this perspective, ‘compactcities ideas… provide the promise of an approach formaking cities more liveable for an ageing population’(Sorensen 2010, 129). The ageing index, measured foryear 2010 as the number of persons over the age of 65years per 100 persons under the age of 15 years, showeda clear contrast between Les Corts (Q4) and the othertwo case districts, both of which were in the lowest quar-tile (Q1).
EducationFrom the interviews, education emerged as a key factor forsocial integration. At the early educational stages (i.e. pre-school) integration is usually easier: ‘facilitating social par-ticipation in preschool is a little easier than it is in elemen-tary schools because teachers are less bound by mandatorycurricula’ (Ramsey 2015, 158). The percentage offoreigners in pre-school in 2010 was quite significant inCiutat Vella (30.9%; Q4), and much less significant inLes Corts (3.1%; Q1) and Sant Martí (6.4%; Q3).
Environmental considerations and risksShortage of environmental resources, such as water andoil, was identified in the interviews as a driver for changethat reorients the attitudes of citizens towards a moreresponsible use of them. Previous research by Domeneet al. (2005) showed the critical importance of the sus-tainable use of water in the metropolitan area of Barce-lona (Àrea Metropolitana de Barcelona). For our study,the only available data at the district scale was domesticwater consumption in terms of litres per capita,measured from 2007 onwards. Ciutat Vella had a rela-tively low level of consumption (interval Q1 of the quar-tile distribution), while the other two districts both hadhigher levels of consumption: Les Corts (Q4) consumedeven more than Sant Martí (Q2).
Economic crisisDespite its ambiguous and often negative connotations,an economic crisis may have positive effects on cities.For instance, it was identified by the interviewees asan element of change that restructured public policiestowards a more socially and economically sustainableapproach in Barcelona. The interviews also revealedhow an economic crisis may lead to housing that ismore affordable, to social diversity, and to diversifica-tion of activities and retail managers’ profiles (e.g.local retail being sustained by immigrants). Besidesthe price for retail space and the income index, alreadydiscussed above with reference to other drivers, twomore indicators were used: second-hand housing prices(EUR per m2) and economic effort (dwelling pricerelated to family income), both examined in 2010.
Norsk Geografisk Tidsskrift–Norwegian Journal of Geography 11

With regard to the former, Les Corts stood out as oneof the most expensive districts (4.91 EUR/m2; Q4) inBarcelona, followed by Sant Martí (3.64 EUR/m2; Q3)and the less expensive Ciutat Vella (3.43 EUR/m2;Q2). The economic effort of households was highestin Les Corts (21.2; Q4), lower but still within the topquartile in Ciutat Vella (13.8; Q4), and medium-highin Sant Martí (12.5; Q3).
TourismIn Barcelona, tourism has emerged as a problematic issuebut also as a phenomenon with positive consequences,such as generating incomes and encouraging streetcleaning. In 2010, Ciutat Vella had the highest numberof hotel beds (18,575; Q4) of all Barcelona districts.Sant Martí had half the value of Ciutat Vella, but stillmaintained a high level (9679; Q4), while Les Cortshad the lowest value of the three case districts (6022; Q3).
Evaluation of pressuresFrom the data presented in Table 3, it became possible toevaluate the situation at the starting year for the threecase districts. The evaluation took into account that alow or high quartile could be positive or negative,depending on the positive or negative significate of theindicator in relation to the rationales described inTable 1. Comparison of the three districts indicatedthat Sant Martí had a far better initial situation than Ciu-tat Vella and Les Corts (Fig. 3).
Evolution of compact city pressures and drivers
Once the situation at the starting year was established forall indicators, the next step was to calculate their evolutionand how the evolution leads to desired future trends. Allindicators were examined over an ideal period of fiveyears. The evolution of the proxy indicators was calculatedin three different ways (Table 4). When the indicator was
measured by a percentage (e.g. percentage of foreigners)or per thousand (e.g. immigration rate), the evolutionwas calculated with a difference of values (Diff.). If theindicator was represented by an absolute value (i.e. m2
of economic activity) or a simple ratio (e.g. economiceffort), its evolution was calculated through its percentagevariation in the specified period. A specific case was rep-resented by the number of restored facades, the evolutionof which was simply a cumulative sum of restorationsbecause the indicator showed high yearly variations and,for this reason, a five-year difference or percentage vari-ation would not be representative. In some cases, a longerperiod had to be used in order for the differences to be,identified and other cases a shorter period had to beused when data were lacking. Some indicators showed amore substantial variation through the years than didothers (Table 4).
The desired future trends in compact citypressures and drivers
Establishing the evolution of the different pressuresfacilitated our understanding of how the evolutionoccurred in relation to desired trends. In this regard,desired trends should be seen exclusively as tentative rec-ommendations for the future, not as definitive outlooks.The trends were defined by taking the following situ-ations into account:
1. In some cases, indicators displayed a positive quality(i.e. in the entropy index, municipal assistance in localactivities, pedestrian-priority areas, green areas perinhabitant, square metres of economic activity, per-centage of dwellings built before 1960). Therefore,their increase or maintenance at a high level wasalways desirable.
2. In other cases, the indicators revealed a negativephenomenon (i.e. percentage of citizen complaints
Fig. 3. Initial situation of the three districts; percentages of positive, rather positive, negative, and rather negative starting points inrelation to compact city development
12 M. Adelfio et al.

per district, water consumption, economic effort) thatneeded to be reduced.
3. Since a compact city should be based on a balancedurban model (Jenks et al. 1996), the desired trendaimed to balance the value of the district with theother city districts. For example, income indexesthat are too high or too low can be signs of excessivesocial homogeneity (Taylor & Fry 2012).
4. It may be the case that an excessive or continuouschange observed in the evolution of an indicator isnot positive. For example, if retail or housing pricescontinue to decrease, it will not be positive for theeconomy (Bank for International Settlements 2005),and therefore such trends need to be stopped orinverted.
5. Regarding tourism, the interviewees considered thedesired trend as positive for the economy but con-sidered that when it was excessive it impinged onthe daily lives of local residents, caused crowding,and resulted in an increase in illegally rented touristapartments. Therefore, a further increase in thetrend would not be accepted by inhabitants.
With the aim of improving the clarity of the findings,the numeric indicator values for the evaluation of theinitial situation (Table 3) were converted into shades(Table 5). This analytical approach was built on the com-prehensive iconographic matrix of urban indicatorsdeveloped by Franchini & Dal Cin (2000), and led tothe creation of a summarizing table in which the colourgradient ranges from white to dark grey denoted aninitial positive, rather positive, rather negative, or nega-tive situation (Table 5). For the evolution of pressures(Table 4), the indicators were represented as arrow sym-bols, indicating whether the evolution represented anincrease, decrease, or unchanging situation (Table 5).The subsequent analysis of desired trends was illustratedin the same way with arrow symbols (Table 5), but inthat case recommending whether an increase, decrease,or unchanging trend was preferred. For example, thismeant that if the evolution represented an increase, astable arrow symbol for the desired trend meant that itwould be beneficial if the increase levelled off.
In the following subsections, the considerationslinked to the elaboration of desired future trends areexplained in more detail in relation to each pressureand indicator.
Social cultureThe entropy index is seen as positive because it is anexpression of social diversity in terms of country of ori-gin, not of class. Therefore, it should be kept at highlevels, as social diversity is a desired compact city quality
(Jenks et al. 1996). In order to avoid social homogeniz-ation or segregation, the income index should not havetoo high or too low district values (Taylor & Fry 2012).However, we do not have sufficient data to confirm socialclass diversification, therefore this issue needs furtherresearch. The level of municipal assistance in local activi-ties should always be aimed at increasing, as a sign ofsocial participation. By contrast, the percentage of citizencomplaints, although being an expression of socialdemand leading to potential improvement in the initialsituation, may reflect problematic conditions. Hence, ahigh percentage of citizen complaints within a districtis not positive. Lastly, the standard deviation forsecond-hand housing prices should be maintained atreasonably high level, to provide a district with differenthousing options.
Urban planning and policyBoth indicators should be kept at a high level for citiessuch as Barcelona, which are already relatively dense.Barcelona Municipality detected a lack of vacant landin the city but ideally was inclined towards an increasein green areas, if not quantitatively, then at least qualitat-ively (Barcelona City Council 2013). Such a qualitativedimension would take into account ‘connectivity(green corridors), the uniqueness of Barcelona’s greenspaces (e.g. façades, rooftops), along with other charac-teristics typical of urban green spaces’ (Barcelona CityCouncil 2013, 13).
Market economyFollowing the content analysis of the interviews and sup-ported by literature relating to the concepts of develop-ment and vitality (e.g. Zhou 2012), market economy isconsidered an expression of development and vitality.In relation to the former, the interviewees consideredthat speculation was a pressure stemming from the mar-ket economy driver and leading to building densification.Nevertheless, since the housing market and affordabilityhave been affected by a serious housing market crisis inrecent years, such aspects are examined in the subsection‘Economic crisis’. With regard to vitality, Zhou (2012)argues that economic vitality is an essential componentof urban vitality. Nevertheless, compact cities have toavoid single-use developments (i.e. developments exclu-sively for business use or residential use). Therefore, areflection on the residential or non-residential orien-tation of the case districts in Barcelona is worthy ofspecial attention. Data from Barcelona City Councilshowed that c.50% of cadastral units were used for hous-ing in each of the three districts in 2010 (51.7% in CiutatVella; 47.4% in Les Corts; 56.3% in Sant Martí). In orderto have a balanced model, economic activity needs to be
Norsk Geografisk Tidsskrift–Norwegian Journal of Geography 13

maintained at a relatively high level. As the evolution hasbeen positive, the desired trend aims at a situation ofstabilization in Ciutat Vella and Sant Martí, both ofwhich were already highly positioned in 2010 (Q3 andQ4), and an increase in Les Corts, which was initiallyin a medium-low quartile (Q2).
Historical settlement processesAccording to the interviewees, it was easier to findelements of compact and mixed-use developments inthe historical centre than in the non-historical areas ofcities such as Barcelona and in areas with a distinctivehistorical past. The only available indicator in the caseis the presence of buildings constructed before 1960.The indicator’s evolution may produce minimumchanges, associated with the development of new build-ings on vacant land or brownfield sites, but the percen-tage of old buildings is not likely to decreasesignificantly. The desired trend is the maintenance ofold buildings as a general rule, especially those of histori-cal significance. This process can be directly linked to theindicator used for culture and heritage (i.e. the numberof restored facades).
ImmigrationThe achievement of a balanced number (i.e. neither toohigh nor too low) of immigrants is recommendable. In2014, the end year of the evolution period related tothe percentage of foreign nationals, Ciutat Vella stillhad a high proportion of immigrants (42.4%), whichwas triple the average proportion for Barcelona(16.3%). By contrast, the proportions were lower thanaverage for the city in Sant Martí (15.0%) and LesCorts (10.8%). However, evolution of the immigrationrate over 5 year was quite different compared with 10years (Fig. 4), as the most recent years were affected bythe Spanish economic crisis. The difference is especially
notable in the case of Ciutat Vella. The purpose of thispaper is not to establish what might be an optimalshare of immigrants, as this would need significantfurther research. Nevertheless, if social and ethnic diver-sity are considered qualities of compact cities, socialhomogenization and segregation should be avoided.Moreover, according to the OECD (2014), the humancapital of immigrants exerts a positive influence on econ-omic growth.
The entropy index should ideally be high as a measureof diversification and should be maintained at high levelsin the future. According to Fieldhouse & Cutts (2010),although diversity can generate difficulties in sharingsocial norms, it will eventually have a positive impacton community cohesion. In relation to the rental priceof retail space, and considering that relatively low priceshave already favoured an increase in shops managed byimmigrants in the cast districts of Barcelona, it shouldprobably be maintained as it is because excessively lowprices will not be profitable if they have a negative impacton the property industry, banks, and loan concessions(Bank for International Settlements 2005). An exceptionis Ciutat Vella, where it might be acceptable for exceed-ingly high rental prices to fall in the future.
Culture and heritageThe desired trend for restoring the facades of buildings islinked with ‘historical settlement process’, and thereforethe indicator for ‘culture and heritage’ has to be main-tained as always positive.
Ageing populationAccording to the OECD (2012), an ageing population isa key trend associated with the need for compact cities, aselderly populations require accessibility to local facilitieswithin walking distance. Nevertheless, the trend alsogenerates problematic effects on municipal revenue,
Fig. 4. Immigration rate per 1000 inhabitants; difference in a period of 5 years and in a period of 10 years (based on data accessed fromAjuntament de Barcelona n.d.c)
14 M. Adelfio et al.

economic growth, and public spending (OECD 2015),and an excessively or too rapidly ageing populationwould be difficult to manage. Therefore, a balanced pat-tern of ages is the desired trend for the future.
EducationThe goal for non-Spanish children at pre-school is forbalanced numbers (i.e. neither too high nor too low),in order to avoid social segregation. While acknowled-ging that social diversity in pre-schools has a short-term positive impact on cognitive development and along-term influence on the promotion of social equity(Reid & Kagan 2015), previous research has shownthat racial and ethnic diversity should be considered aquality in pre-schools (Reid 2016).
Environmental considerations and risksThis is an example of a negative indicator with respectto water consumption and a decrease in the indicator ispreferable, unless it is already as low as in Ciutat Vella,where stabilization is desirable to avoid affecting thequality of life of the inhabitants. Although otherenvironmental indicators related to emissions, wastegeneration, and energy consumption were not availableat the district level, we assume that a continuousdecrease in emissions, waste generation, and energyconsumption is desirable.
Economic crisisSecond-hand housing prices decreased during the period2010–2014, especially in Les Corts (-15%). However,prices may still be too high in that district since, accord-ing to more recent statistics (Idealista 2016), prices haverecovered (Table 6).
Since the recovery of housing prices can simultaneouslybe beneficial for the economy and less positive for families,such a trend should be compared with the economic effortto purchase new housing (average selling price of newdwellings related to average household income per year).Based on the most recent data (i.e. from 2013), BarcelonaCity Council’s district report sheds a light on the issue(Ajuntament de Barcelona n.d.a). In Les Corts, the effort
required in 2013 (7.2 years of the average householdincome in the district needed to buy a dwelling) waslower compared with the average value for Barcelona asa whole (9.9 years). In Ciutat Vella, the combination of amedium-low income level and an increase in new housingprices produced a higher economic effort (12.8 years) thanthe average value for Barcelona. In Sant Martí, the valuewas equivalent to 11.3 years of family income. Such valuescould mean that in Les Corts, families could still afford anincrease in prices, while in the other two districts the effortis still too high.
TourismIn all three case districts, there was a high or fairly highnumber of hotel beds in 2010 and the numbers continuedto increase between 2010 and 2014. Considering theambiguously positive and negative value of tourism forcompact city qualities, the recommendation for the futureis a stabilization or decrease, although this may not be easyto achieve considering Barcelona’s strong orientationtowards tourism. However, in 2017, Barcelona City Coun-cil approved a plan to establish a cap on the amount oftourist accommodation in the city (LaGrave 2017).
Conclusions
The principal purpose of this paper has been to shed lighton the indirect drivers and direct pressures that influencethe development of a compact city at the local scale, focus-ing on Barcelona as case study and three districts in par-ticular. First, our analysis has revealed a high level ofcomplexity regarding both drivers and pressures, sincethey belong to a wide range of categories and resultfrom the occurrence of diverse processes at multiple levels.Moreover, we have shown how drivers and pressures canboth support and counteract urban compactness (in itswide meaning), and therefore any intervention has to becarefully tailored according to local conditions and evol-ution and/or trends.
Second, the importance assigned to the local scale,represented by the district level in this paper, facilitatedour focused and in-depth analysis of local pressures.Such local character allowed for an understanding ofnuances and avoided banalization and superficiality.For instance, the interviewees from the three districtshighlighted certain aspects of compact cities, such associal diversity and equity, yet such qualities are nor-mally downplayed in the literature in favour of physicalor built-environment related qualities of compact cities,such as mobility.
Third, the choice of three different districts as casestudies enabled us to underline their main strengths(e.g. social diversity in Ciutat Vella, a functioning
Table 6. Second-hand housing purchase prices in the thirdtrimester of 2016, with variation referred to maximum price(Source: Idealista 2016, 29)
DistrictYear of achievedmaximum price
% variation inrelation to
maximum price
Annual variationfor third trimester
2015–2016
Ciutat Vella 2007 −12.8% 9%Les Corts 2006 −17.3% 7.4%Sant Martí 2006 −21% −0.5%Barcelona asa whole
2007 −22.5% 7.8%
Norsk Geografisk Tidsskrift–Norwegian Journal of Geography 15

housing market in Les Corts, and balanced ethnic diver-sity in Sant Martí) and their main weaknesses (e.g. lowincomes in Ciutat Vella, scarce pedestrian priorityareas in Les Corts, and low citizen satisfaction in SantMartí), which were derived from the indicators in extre-mely high (Q4) or low (Q1) positions (Table 5). Theselected three case districts have also shown the impor-tance of understanding the localized progression ofsuch pressures over time (i.e. from recent history to thenear future). An improved understanding of and strate-gizing in relation to locally relevant pressures (and coun-ter-pressures) that impact on aspired compact citydevelopment patterns thus become key activities, thatwould enable the attention on taken-for-granted com-pact city qualities to be shifted to the driving forcesthat lead to such compactness. Such a concrete analysisof pressures at the local scale may thus providedecision-makers with a better orientation of local pol-icies. In this sense, the approach taken in this article isstrategically important for local stakeholders involvedin urban planning, governance, and management.
Fourth, we have observed how the diversity of driversand pressures, as well as the heterogeneous definition ofa compact city, requires a multiplicity of stakeholdersand actors to be involved in the planning, implemen-tation, and management of a compact city. Such a visionpromotes a broad interpretation of planning, whichshould not exclusively be in the hands of conventionalplanning practitioners (e.g. architects, engineers) butshould also include a variety of urban stakeholders.
Fifth, and finally, from a scholarly point of view, it ismandatory to acknowledge the limits of our study, as itsprogression relied on the availability of district-scaleproxy indicators. Since local-scale indicators are notexhaustive, they should be taken as a result of the selectivechoice of drivers performed by the interviewees. In orderto achieve a more complete analysis of drivers and press-ures, further research is recommended, including a quali-tative study of pressures to fill in the gaps left byquantitative analysis. Nevertheless, although it is not poss-ible to generalize from the results, it is still helpful to com-pare them with similar situations or studies in other cities,as certain aspects are likely to transcend the local dimen-sion. For example, certain features, such as the presence oftourism, are more present in Ciutat Vella as the historicalcore of the city. However, the tourism question hasassumed citywide proportions and has become centralin recent planning and policy decisions in Barcelona. Amore proactive stance vis-à-vis this pressure would havebeen instrumental to avoid the current negative conse-quences of this type of ‘compactness’. Such lessons seemto be valuable also for cities in earlier stages of their itin-eraries towards a tourist-based economy.
ORCID
Marco Adelfio http://orcid.org/0000-0003-1865-9471Jaan-Henrik Kain http://orcid.org/0000-0001-8838-099X
References
Ajuntament de Barcelona. 2000. El nucli antic: Les Corts Velles.Barcelona: Ajuntament de Barcelona.
Ajuntament de Barcelona. 2011. 22@ Barcelona: 10 anys derenovaciò urbana/10 Years of Urban Renewal. Barcelona:Ajuntament de Barcelona.
Ajuntament de Barcelona. n.d.a. Observatori de districtes.Barcelona: Ajuntament de Barcelona. http://www.bcn.cat/estadistica/catala/documents/districtes/index.htm (accessed30 March 2016).
Ajuntament de Barcelona. n.d.b. Cartobcn. http://w20.bcn.cat/cartobcn/ (accessed 30 March 2016).
Ajuntament de Barcelona. n.d.c. Estadísyica. http://estadistica.bcn.cat/ (accessed 30 March 2016).
Anguelovski, I. 2014. Neighbourhood as Refuge: CommunityReconstruction, Place Remaking, and EnvironmentalJustice in the City. Cambridge, MA: MIT Press.
Apparicio, P., Martori, J.C., Pearson, A.L., Fournier, É. &Apparicio, D. 2014. An open-source software for calculatingindices of urban residential segregation. Social ScienceComputer Review 32(1), 117–128.
Artmann, M. 2013. Driving forces of urban soil sealing andconstraints of its management – the Cases of Leipzig andMunich (Germany). Journal of Settlements and SpatialPlanning 4(2), 143–152.
Bank for International Settlements. 2005. Real EstateIndicators and Financial Stability. BIS Papers No. 21.https://www.bis.org/publ/bppdf/bispap21.pdf (accessedNovember 2018).
Barcelona City Council. 2013. Indicators 21: LocalSustainability Indicators in Barcelona (Data from 2012).Barcelona: Barcelona City Council.
Barrios, J.A. & Rodriguez, J.E. 2008. Housing demand in Spainaccording to dwelling type: Microeconometric evidence.Regional Science and Urban Economics 38(4), 363–377.
Bohigas, O. 2005 El model Barcelona segons Horacio Capel.Avui, 8 May 2005, 21.
Boyko, C.T. & Cooper, R. 2011. Clarifying and re-conceptualisingdensity. Progress in Planning 76(1), 1–61.
Brueckner, J.K. 2011. Lectures on Urban Economics.Cambridge, MA: MIT Press.
Burton, E. 2000. The compact city: Just or just compact? A pre-liminary analysis. Urban Studies 37(11), 1969–2006.
Burton, E. 2002. Measuring urban compactness in UK townsand cities. Environment and Planning B: Planning andDesign 2002, 29(1), 219–250.
Busquets, J. 2005. Barcelona: The Urban Evolution of aCompact City. Rovereto: Nicolodi & Cambridge, MA:Harvard University, Graduate School of Design.
Capel, H. 2006. De nuevo el modelo Barcelona y el debatesobre el urbanismo barcelonés. Universidad de Barcelona(eds.) Biblio 3W. Revista Bibliográfica de Geografía yCiencias Sociales 9(629). http://www.ub.edu/geocrit/b3w-629.htm (accessed November 2018).
Centro Nacional de Información Geográfica. n.d. Centro desCargas. (accessed November 2018).
16 M. Adelfio et al.

Christiansen, P. & Loftsgarden, T. 2011. Drivers Behind UrbanSprawl in Europe. TØI Report 1136. https://www.toi.no/getfile.php/1317329/Publikasjoner/T%C3%98I%20rapporter/2011/1136-2011/1136-2011-el.pdf (accessed October 2018).
Churchman, A. 1999. Disentangling the concept of density.Journal of Planning Literature 13(4), 389–411.
Cronshaw, S. & McCulloch, A. 2008. Reinstating the Lewinianvision: From force field analysis to organization field assess-ment. Organization Development Journal 26(4), 89–103.
Dantzig, G. & Saaty T. 1973. Compact City: Plan for a LiveableUrban Environment. San Francisco: W. H. Freeman.
Dávila Cabanillas, N. 2007. La aplicación del modelo DPSIR alárea funcional de Gernika-Markina (Bizkaia): Un ensayometodológico de análisis territorial. https://old.reunionesdeestudiosregionales.org/cdromleon2007/htdocs/pdf/p1.pdf (accessed November 2018).
Dempsey, N. & Jenks, M. 2010. The future of the compact city.Built Environment 36(1), 116–121.
Dieleman, F. & Wegener, M. 2004. Compact city and urbansprawl. Built Environment 30(4), 308–323.
Dijkink, G. & Knippenberg, H. 2001. The Territorial Factor:Political Geography in a Globalising World. Amsterdam:Vossiuspers UvA [Amsterdam University Press].
Domene, E., Saurí, D. & Parés, M. 2005. Urbanization and sus-tainable resource use: The case of garden watering in themetropolitan region of Barcelona. Urban Geography 26(6),520–535.
EU. 2007. Leipzig Charter on Sustainable European Cities.Final draft (2 May 2007). http://ec.europa.eu/regional_policy/archive/themes/urban/leipzig_charter.pdf (accessedNovember 2018).
European Commission. 2011. Cities of Tomorrow – Challenges,Visions, Ways Forward. Luxembourg: Publications Office ofthe European Union.
European Environment Agency. 1999. EnvironmentalIndicators: Typology and Overview. EEA Technical reportNo 25/1999. Copenhagen: European Environment Agency-
Fieldhouse, E. & Cutts. D. 2010. Does diversity damage socialcapital? A comparative study of neighbourhood diversityand social capital in the US and Britain. Canadian Journalof Political Science–Revue Canadienne de Science Politique43(2), 289–318.
Franchini, T. & Dal Cin, A. 2000. Indicadores urbanos y sos-tenibilidad: Hacia un umbral sostenible del uso del suelo.Ciudad y Territorio 32(123), 41–55.
Garcia-López, M.A. & Muñiz Olivera, I. 2007. ¿Policentrismoo dispersión? Una aproximación desde la nueva economíaurbana. Investigaciones Regionales 11, 25–43.
Gray, R.N. 2007. Residential Intensification and the WellingtonUrban Development Strategy. Wellington: Wellington CityCouncil.
Hammond, A., Adriaanse, A., Rodenburg, E., Bryant, D. &Woodward, R. 1995. Environmental Indicators: A SystematicApproach to Measuring and Reporting on EnvironmentalPolicy Performance in the Context of SustainableDevelopment. Washington DC: World Resources Institute.
Hofstad, H. 2012. Compact city development: High ideals andemerging practices. European Journal of SpatialDevelopment. Refereed article No. 49. http://archive.nordregio.se/Global/EJSD/Refereed%20articles/refereed49.pdf (accessed October 2018).
Holman, N., Mace, A., Paccoud, A. & Sundaresan, J. 2015.Coordinating density: Working through conviction, suspi-cion and pragmatism. Progress in Planning 101(October2015), 1–38.
Idealista. 2016. Evolución del precio de la vivienda de segundamano. Tercer Trimestre 2016. http://www.idealista.com/informes-precio-vivienda (accessed July 2017).
Jenks, M., Burton, E. & Williams, K. (eds.) 1996. The CompactCity: A Sustainable Urban Form? London: Spon.
Kristensen, P. n.d. The DPSIR Framework. https://wwz.ifremer.fr/dce/content/download/69291/913220/file/DPSIR.pdf (accessed November 2018).
Lagrave, K. 2017. Barcelona Approves New Law to Limit TouristNumbers. http://www.cntraveler.com/story/barcelona-approves-new-law-to-limit-tourist-numbers (accessed 3 March2017).
Li, H., Peng, J., Yanxu, L. & Yi’na, H. 2017. Urbanizationimpact on landscape patterns in Beijing City, China: Aspatial heterogeneity perspective. Ecological Indicators 82,50–60.
Lim, H.K. & Kain, J.H. 2016. Compact cities are complex,intense and diverse but: Can we design such emergenturban properties? Urban Planning 1(1), 95–113.
Marraccini, E., Debolini, M., Moulery, M., Abrantes, P.,Bouchier, A., Chéry, J.-P., Sanz Sanz, E., Sabbatini, T. &Napoleone, C. 2015. Common features and different trajec-tories of land cover changes in six Western Mediterraneanurban regions. Applied Geography 62, 347–356.
Marshall, T. 2000. Urban planning and governance: Is there aBarcelona model? International Planning Studies 5,299–319.
Metzger, J., Allmendinger P. & Oosterlynck, S. 2015. PlanningAgainst the Political: Democratic Deficits in EuropeanTerritorial Governance. London: Routledge.
Moliní, F. & Salgado, M. 2012. Los impactos ambientales de laciudad de baja densidad en relación con los de la ciudadcompacta. Universidad de Barcelona. (eds.) Biblio 3W.Revista Bibliográfica de Geografía y Ciencias Sociales 17(958). http://www.ub.edu/geocrit/b3w-958.htm (accessed24 January 2018).
Moreno, L. 1993. Social Exchange and Welfare Development.Madrid: CSIC.
Morikawa, M. 2011. Economies of density and productivity inservice industries: An analysis of personal service industriesbased on establishment-level data. Review of Economics andStatistics 93(1), 179–192.
Muñiz, I. & Garcia-López, M.A. 2010. The polycentricknowledge economy in Barcelona. Urban Geography 31(6),774–799.
Muñoz, F. 2004. UrBANALització: La producció residencial debaixa densitat a la provincia de Barcelona, 1985-2001. PhDthesis. Department of Geography, Universitat Autònoma deBarcelona. Barcelona: Universitat Autònoma de Barcelona.
Niemeijer, D. & De Groot, R. 2008. Framing environmentalindicators: Moving from causal chains to causal networks.Environment, Development and Sustainability 10(1):89–106.
Neuman, M. 2005. The compact city fallacy. Journal ofPlanning Education and Research 25, 11–26.
OECD. 2012. Compact City Policies, A Comparative Assessment,OECD Green Growth Studies. Paris: OECD Publishing.
Norsk Geografisk Tidsskrift–Norwegian Journal of Geography 17

OECD. 2014. Is Migration Good for the Economy?OECD Migration Policy Debates (MPD No. 2, May 2014).http://www.oecd.org/els/mig/OECD%20Migration%20Policy%20Debates%20Numero%202.pdf (accessed October2018).
OECD. 2015. Ageing in Cities. Paris: OECD Publishing.Oelefse, M. 2003. Social justice, social integration, and the
ccompact city: Lessons from the inner city, Johannesburg.Harrison, P., Huchzermeyer. M. & Mayekiso. M. (eds.)Confronting Fragmentation: Housing and UrbanDevelopment in a Democratizing Society, 88–108.Landsdown: UCT Press.
Pili, S., Grigoriadis, E., Carlucci, M., Clemente, M. & Salvati, L.2017. Towards sustainable growth? A multi-criteria assess-ment of (changing) urban forms. Ecological Indicators 76,71–80.
Ramsey, P.G. 2015. Teaching and Learning in a Diverse World:Multicultural Education for Young Children. 4th ed.New York: Teachers College Press.
Rani, W.M. 2015. Compact urban form for sociability in urbanneighbourhoods. International Journal of Social Science andHumanity 5(10), 822–826.
Reid, J. 2016. Racial/ethnic diversity and language develop-ment in the pre-school classroom. Frankenberg, E.,Garces, L. & Hopkins, M. (eds.) Integration Matters:Research-based Strategies to Advance Equity, 39–55.New York: Teachers College Press.
Reid, J.L. & Kagan, S.L. 2015. A Better Start: WhyClassroom Diversity Matters in Early Education. https://files.eric.ed.gov/fulltext/ED571023.pdf (accessed November2018).
Rosenthal, S.S. & Strange W. 2004. Evidence on the nature andsources of agglomeration economies. Vernon Henderson, J.& Thisse, J.-F. (eds.) Handbook of Regional and UrbanEconomics. Vol. 4: Cities and Geography, 2119–2171.Amsterdam: Elsevier.
Saaty, T.L. 2013. Compact City: The Next Urban Evolution inResponse to Climate Change. Pittsburg, PA: RWSPublications.
Salvati, L. & Sabbi, A. 2014. Identifying urban diffusion incompact cities through a comparativemultivariate procedure. The Annals of Regional Science 53,557–575.
Scarnato, A. 2006. Multiple exposures or new cultural values?European historical centres and recent immigration fluxes.Monclús, J. & Guardia, M. (eds.) Culture, Urbanism andPlanning, 165–178. London: Routledge.
Sorensen, A. 2010. Urban sustainability and compact cityideas in Japan. Healey, P. & Upton, R. (eds.)Crossing Borders: International Exchange andPlanning Practices, 117–140. Abingdon and New York:Routledge.
Talen, E. & Koschinsky, J. 2013. The walkable neighborhood:A literature review. International Journal of SustainableLand Use and Urban Planning 1(1), 42–63.
Taylor, P. & Fry, R. 2012. The Rise of Residential Segregation byIncome. Pew Research Center Report. http://www.pewresearch.org/wp-content/uploads/sites/3/2012/08/Rise-of-Residential-Income-Segregation-2012.2.pdf (accessedOctober 2018).
Tillie, N., Aarts, M., Marijnissen, M., Stenhuijs, S., Borsboom,J., Rietveld, E., Doepel, D., Visschers, J. & Lap, S. 2012.Rotterdam: People Make the Inner City. Rotterdam:Mediacenter Rotterdam.
Tscherning, K., Helming, K., Krippner, B., Sieber, S. & Gomez yPaloma, S. 2012. Does research applying the DPSIRframework support decision making? Land Use Policy 29,102–110.
Tunström, M. & Bradley, K. 2015. Opposing the postpoliticalSwedish urban discourse. Metzger, J., Allmendinger, P. &Oosterlynck, S. (eds.) Planning Against the Political:Democratic Deficits in European Territorial Governance,69–84. Abingdon: Routledge.
UN. 1996. Indicators of Sustainable Development: Frameworkand Methodologies. New York: UNCSD.
UN. 2014. Global Biodiversity Outlook 4: A Mid-termAssessment of Progress Towards the Implementation of theStrategic Plan for Biodiversity 2011–2020. Secretariat of theConvention on Biological Diversity. ISBN- 92-9225-540-1.https://www.cbd.int/gbo/gbo4/publication/gbo4-en-hr.pdf(accessed October 2018).
UN-Habitat. 2012. Urban Patterns for a Green Economy:Leveraging Density. https://unhabitat.org/wp-content/uploads/2014/06/Leveraging-Density-Urban-Patterns-for-a-Green-Economy.pdf (accessed 18 October 2018).
UNESCO. 2016. Culture Urban Future. Paris. United NationsEducational, Scientific and Cultural Organization.
United Nations Environment Programme. 2007. GlobalEnvironment Outlook: Environment for Development, GEO4. https://na.unep.net/atlas/datlas/sites/default/files/GEO-4_Report_Full_en.pdf (accessed October 2018).
Vilà, G. 2014. From residents to citizens: The emergence ofneighbourhood movements in Spain. Gallent, N. & Ciaffi,D. (eds.) Community Action and Planning: Contexts,Drivers and Outcomes, 59–75. Bristol: Policy Press.
Walks, A. 2015. The Urban Political Economy and Ecology ofAutomobility. New York: Routledge.
Westerink, J., Haase, D., Bauer, A., Ravetz, J., Jarrige, F. &Aalbers,C.B.E.M. 2013. Dealing with sustainability trade-offs of thecompact city in peri-urban planning across European cityregions. European Planning Studies 21(3), 473–497.
Zhou, J. 2012. Urban Vitality in Dutch and Chinese NewTowns: A Comparative Study between Almere andTongzhou. Architecture and the Built Environment2012:3. PhD thesis. Delft: Urbanism Department, Facultyof Architecture, Delft University.
Zondag, B. & Borsboom, J. n.d. Driving Forces of Land-use Change. http://www.significance.nl/papers/2009-ERSA-Driving-forces-of-land-use-change.pdf (accessed November2018).
18 M. Adelfio et al.