disease outbreak as a determinant of international trade
TRANSCRIPT

Disease Outbreak as a Determinant of
International Trade
By
Elias Henderson
A Senior Honors Thesis Submitted to the Department of Political Science, University of California, San Diego
March 30th, 2015

Henderson ! 2
Table of Contents
I. Acknowledgments —— 3
II. Overview —— 4
III. Literature Review —— 7
A. Communicable Disease Outbreaks —— 7
B. The Gravity Model —— 9
IV. Research Design and Hypothesis —— 11
A. Hypotheses —— 11
B. Data Sources —— 13
C. Methods of Analysis —— 15
D. Operationalization of Hypotheses —— 18
V. Results — 23
A. Hypothesis 1 —— 23
B. Hypothesis 2 —— 25
C. Hypothesis 3 —— 26
D. Hypothesis 4 —— 28
E. Hypothesis 5 —— 29
F. Hypothesis 6 —— 34
VI. Discussion —— 38
VII. Conclusion —— 41
VIII. Bibliography —— 44
IX. Appendices —— 48

Henderson ! 3
Acknowledgments
To my Mother and Father,
To Jasper,
To Cassie and Deru,
To Griffin,
To Richard, Nick, Allison, and Jamie Rose,
To Isabella,
To Neil and Kevin,
To Professor David Lake and Konstantin Ash,

Henderson ! 4
Overview
It began quietly enough in December of 2013, in an isolated Guinean village several
miles from the Liberian border. Emile Omaouno, a two-year-old Guinean toddler, became
violently ill. What no one knew then was that he suffered from Ebola hemorrhagic fever, an 1
extremely deadly and contagious condition that would soon sweep Guinea, Liberia, and Sierra
Leone, with dramatic consequences for West Africa and the rest of the world. The human
consequences of this disease are staggering. Thousands dead. Families torn asunder.
Communities thrown into tumult. But the economic consequences of this outbreak have been
equally dire. Labor shortages have threatened the all-important rice, maize, and cassava crops,
causing food prices to soar. The production of lucrative commodities like oil, rubber, and cocoa
has become excruciatingly slow. The price of everyday goods has increased dramatically in the
face of tightening trade restrictions on the movement of goods and people. Foreign investment
has fallen severely. Multinational corporations have scaled back operations. Tourism has all but
ground to a halt. Airlines have cutoff service entirely to the afflicted nations. Government 2
revenues are dropping precipitously even as expenditures increase to combat the rampaging
disease. The World Bank estimates that the cost of stopping the epidemic will be in the billions. 3
The economic effects of Ebola have been every bit as devastating as the human ones, and
ultimately the severely crippled West African economy will beget human tragedies of its own.
This is the modern nightmare of epidemic disease: human devastation coupled with economic
isolation.
Stylianou, 2014.1
"FAO: Ebola Outbreak Putting West African Trade, Food Security in Jeopardy,” 2014.2
Sy and Copley, 2014.3

Henderson ! 5
The last three decades have witnessed a steady increase in the number of communicable
disease outbreaks in human populations around the world. These outbreaks are often 4
accompanied by widespread and sometimes irrational hysteria—witness the 2014 Ebola outbreak
in West Africa or the 2009 H1N1, or “Swine Flu,” outbreak. In light of the increasing frequency
and public awareness of disease outbreaks, many researchers have identified communicable
disease outbreak, transmission, and surveillance as an important area of study. While this has led
to a growing body of research studying the effects of a variety of international and domestic
factors on disease outbreaks, very little research has inverted this relationship by studying the
effects of disease outbreaks on international systems. This thesis will seek to begin the process of
examining how disease outbreaks affect the world economy.
The central question that this paper will seek to address is this: Does an outbreak of a
communicable disease affect a country’s international trade? To couch this question in more
economic verbiage: is the advent of a communicable disease outbreak an important determinant
of international trade? The answer to this question may be critically important both for nations
coping with an outbreak and for international aid organizations seeking to assist these nations.
Nations and aid organizations must constantly make decisions on how to direct a finite pool of
resources to the greatest effect with incomplete information about the conditions on the ground.
By identifying essential factors that can lead to economic shortfalls—in this case the outbreak of
an infectious disease—these nations and aid organizations can be better informed as to how best
to expend their limited resources. Recent research has corroborated the intuitive conclusion that
economic downturns result in worse outcomes for disease outbreaks. This means that a country 5
Smith et al. 2014.4
Suhrcke et al. 2011.5
Henderson ! 6
undergoing an economic shortfall while coping with the effects of an outbreak can expect to have
higher transmission and mortality rates than it would if it had a healthy economy. Assuming that
this is true, and assuming that a disease outbreak does in fact decrease international trade, my
research question takes on an important meaning. We must consider the possibility of a vicious
feedback loop for countries experiencing a disease outbreak. Consider the following
hypothetical: an outbreak is reported in Country X thereby causing a decline in international
trade involving said country, in turn this weakens the domestic economy of Country X, which in
turn leads to a worse outcome of the disease outbreak, which could further damage the economy
of Country X. If my findings suggest a negative effect on trade in the advent of an outbreak, it
will establish the first leg of this causal relationship. In conjunction with other studies
establishing the continued downward spiral of disease outbreak, my research may inform the
response of nations and aid organizations to disease outbreaks. By addressing outbreaks quickly
and thoroughly, countries and aid organizations may be able to cut off the feedback loop,
mitigating both the magnitude of the outbreak and longterm economic damage.
In the following sections of this thesis, I will review the relevant literature on
international disease outbreaks, explain my research design and hypotheses, present the findings
of my research, examine the implications of these results, and identify potential areas for further
research.

Henderson ! 7
Literature Review
In this section I will provide a brief overview of the current state of research on
communicable disease outbreaks and the gravity model of trade.
Communicable Disease Outbreaks:
The research most germane to my area of study involves the effects of economic
downturns on outcomes of communicable disease outbreaks. This research corroborates the 6
intuitive conclusion that an economic downturn will negatively affect containment and treatment
of disease outbreaks. According to Suhrcke et al., a weaker economy may lead to inadequate
nutrition, less widespread immunization, infrastructure degradation, larger at risk populations
(prisoners and homeless), a larger vector population, fewer doctors, and less access to drugs and
treatment. All of these economic effects may increase the infection and mortality rates of a 7
disease outbreak. As detailed in the overview of this thesis, in conjunction with my research
these findings raise the troubling possibility of a feedback loop between disease outbreaks and
economic wellbeing.
Some researchers have linked international trade in wildlife with increases in infectious
disease transmission. This body of work suggests that international trade in wildlife introduces 8
pathogens that are dangers to human and animal populations alike. Karesh et al. estimate that
outbreaks caused by this sector of trade have caused hundreds of billions of dollars worth of
Rechel et al., 2011. Suhrcke et al., 2011.6
Suhrcke et al., Pg. 3.7
Karesh et al., 2005.8
Henderson ! 8
damage to economies around the world. In terms of diseases that will be treated in this study,
Ebola, SARS, and H5N1 outbreaks have all been linked to the international wildlife trade.
Another area of research involves the work of international organizations on monitoring
and responding to communicable disease outbreaks. Aginam addresses the surveillance methods
of the World Health Organizations, the World Trade Organization, and others. In a similar vein, 9
MacLehose et al. have focused on the European Union. Of potential interest to the research 10
addressed in this paper are studies seeking to measure the response of organizations that are
significantly involved in international trade—the WTO, the EU—to the outbreak of
communicable disease. By understanding how these organizations interact with outbreaks and
interface with one another, we can begin to address how international organizations can help
nations address potential economic shortfalls in the wake of a disease outbreak.
There are a number of studies on the economic consequences of outbreaks of foot-and-
mouth disease. These studies are wide-ranging, looking at hypothetical and actual case studies in
the United Kingdom, Canada, and California. Superficially, these studies seem similar to the 11 12 13
research conducted in this thesis, but because foot-and-mouth disease is primarily carried and
transferred between livestock and only very rarely infects humans, these are not the sort of
outbreaks that this study takes interest in.
It should be noted that there is also a growing body of literature that studies the
relationship between international trade and chronic disease. Recent research suggests that the
Aginam, 2002.9
MacLehose et al., 2001.10
Haydon et al, 2004.11
Krystynak and Charlebois, 1998.12
Carpenter et al., 2011.13

Henderson ! 9
growth of international trade with high-income countries has led to the spread of certain chronic
diseases in many middle and low-income countries. In particular, unhealthy lifestyles—sugary
and fatty foods, alcohol, and tobacco—have been transmitted from wealthy countries to less
wealthy nations leading to an increase in chronic, non-communicable disease in those
countries. 14
The Gravity Model
The gravity model is a primary method used by economists to determine the relative
weight of international trade determinants. In 1995, Trefler published The Case of the Missing
Trade and Other Mysteries, which sought to tackle the theoretically sound but empirically
inadequate Heckshcer-Ohlin-Vanek model. The essential problem with the HOV-model, Trefler 15
argued, was that it predicts significantly more international trade than actually occurs. Since
then, many economists have sought to account for this “missing trade” by examining the
negative effects of distance and relative economic size on bilateral international trade. These two
factors are at the core of the gravity model. As with astral bodies, the larger and closer two
nations are, the greater the gravitational effect is expected to be. In other words, nations are much
less likely to trade with countries that are located a great distance away and/or that have small
economies. The explanatory power of the gravity model is tremendous—Eaton and Kortum
calculate that international trade would be 5 times greater in a world without gravity. Gravity 16
models often include a host of other variables that are expected to have some explanatory power
Labonté et al., 2011. Beaglehole and Yach, 2003.14
Trefler 199515
Eaton and Kortum, 2002. 1770.16
Henderson ! 10
on international trade. The gravity model is a powerful and oft-used tool for calculating 17
international trade determinants, hence its use in this study.
All of the variables included in the gravity model used in this study can be found in the Research 17
Design section below.

Henderson ! 11
Research Design and Hypothesis
In this section I will establish my hypotheses, introduce the datasets employed in this
study, and explain how I will analyze the data in order to produce results that will support or
contradict my hypotheses.
Hypotheses:
Hypothesis 1: The presence of a disease outbreak in a given country in a given year will depress international imports from and exports to that country in the following year.
This hypothesis derives from the assumption that diseased nations will suffer from an
internal loss of productivity due to sickness, hospitalization, quarantine, death, or the fear of
these occurrences. This lost productivity could result in decreased production of goods and
therefore exports. It could also result in decreased purchasing power due to lost earnings, thereby
decreasing imports. Furthermore, potential trading partners may have reservations about trading
with an afflicted nation for a bevy of reasons. Among these could be trepidation about disease
containment and transmission during business interactions with citizens of the afflicted nation,
fear of contaminated goods, and concern about domestic unrest in the afflicted nations. These
concerns may be well-founded or entirely speculative, but they affect global trade in real ways.
Hypothesis 2: Instances in which both members of a dyadic trade pair are undergoing an outbreak will result in an even greater negative effect on imports and exports.
If instances of an outbreak are likely to suppress exports from and imports to a given
country, and both an importer and an exporter are undergoing a disease outbreak, it would
logically follow that trade between two afflicted countries will be affected doubly.

Henderson ! 12
Hypothesis 3: Trade with a nation’s primary trade partners will be less affected than trade with less important trade partners.
This hypothesis is grounded in the notion that high volume trade relationships are more
durable than others. Countries that trade significant amounts of goods with one another are likely
to have more intertwined economies, more durable social and business connections, and may
have enacted diplomatic trade agreements that facilitate or even require certain thresholds of
trade. On the other hand, I hypothesize that countries that trade relatively little are more likely to
limit international commerce in the face of a disease outbreak, possibly to the point of cutting off
trade ties altogether.
Hypothesis 4: This negative effect on imports and exports will be exacerbated in the case of trade between contiguous nations.
I hypothesize that nations sharing a land border will suffer an even greater decline in
trade in the event of an outbreak. This is due to increased fear of cross-border transmission.
Countries contiguous to an afflicted nation are understandably more concerned about the
possibility of transmission, and may increase the cost of trade through more rigorous customs
and inspections in the event of an outbreak.
Hypothesis 5: The negative effect on trade will be greater in more impoverished countries.
I expect that countries with a lower Gross Domestic Product (GDP) per capita will
experience greater decreases in both imports and exports than more wealthy countries. As a
general rule, less wealthy countries have inferior infrastructural and institutional capabilities,
resulting in a lesser capacity to respond effectively to a wide range of natural phenomenon. I 18
Hendrix, 2010. Besley and Persson, 2010.18

Henderson ! 13
suspect that disease outbreaks will be no different, as a lesser ability to detect, monitor, treat, and
contain outbreaks eventually manifests as a greater loss of domestic productivity and trade. I also
suspect that the psychological deterrence of potential trade partners, as explained under
Hypothesis 1, will be even more salient in the case of impoverished countries.
Hypothesis 6: The pathological characteristics of a disease will be important in determining its effect on trade.
This hypothesis reflects the seemingly self-evident conclusion that an outbreak of AIDS
and an outbreak of anthrax are likely to affect trade differently in terms of magnitude and,
potentially, direction. It is a fact that all diseases are not created equally, and, as can be seen in
Appendix A, the range of diseases included in this study is extensive. Under this hypothesis, I
will attempt to categorize similar diseases and test their effect on trade independently of other
types of infections.
Data Sources:
I will test my hypotheses using two datasets. The first dataset I will use is the standard
gravity model originally used by Head, Mayer, and Ries in their paper titled, “The Erosion of
Colonial Trade Linkages After Independence.” The original model spans from 1946 to 2006 and
includes a host of control variables. Several of the control variables regarding colonial linkages
that were used in the original study have been dropped from this study due to minuscule
coefficients and issues of collinearity. The variables that have remained in the statistical model
are as follows: 19
Note that variables with the suffix “_o” relate to the country from which trade goods originate, while 19
the suffix “_d” denotes the destination of the goods.

Henderson ! 14
comcur — 1 for common currency comleg — 1 for common legal origin contig — 1 for contiguity comlang_off — 1 for common official primary language distw — weighted distance (pop-wt, km) pop_o — Population, total in millions gdp_o — GDP (current millions in US$) gdpcap_o — GDP per capita (current in US$) pop_d — Population, total in millions gdp_d — GDP (current millions in US$) gdpcap_d — GDP per capita (current in US$) col_fr — 1 for trade from colony to hegemon col_cur — 1 for pair currently in colonial relationship gatt_o — 1 if origin is GATT/WTO member gatt_d — 1 if destination is GATT/WTO member rta — 1 for regional trade agreement in force acp_to_eu — 1 for ACP to EU eu_to_acp — 1 for EU to ACP gsp — Global System of Preferences gsp_rec — Global System of Preferences: reciprocal
The second data source I will use is a dataset published by Smith et al. which catalogues
over 12,000 disease outbreaks between 1980 and July, 2013. The dataset was generated using a 20
Python script to parse the Global Infectious Disease and Epidemiology Network (GIDEON),
turning prose reports on global disease outbreaks from GIDEON into a workable dataset.
GIDEON gathers its information from a host of sources including Medline, national Health
Ministries, Centers for Disease Control, the World Health Organization, texts, monographs,
periodicals, journals, and user feedback. This dataset includes the following variables: 21 22
UID — A unique numerical ID assigned to each outbreak Disease — The disease name, as listed in GIDEON
See Appendix A for a list of all diseases included in the study.20
A complete list of the resources used by GIDEON is available here: http://www.gideononline.com/21
features/resources/ List gathered from Smith et al README file, available from the Ramachandran Lab Data Repository, 22
which can be found here: http://ramachandran-data.brown.edu/datarepo/request.php?request=explorePublicStudyTrial&StudyID=6&instit=BROWN&trialID=2

Henderson ! 15
Nation — The nation where the outbreak occurred, as listed in GIDEON Year — The year of the outbreak, or the first year if a range of years was given Total Cases — Total number of cases for the given outbreak (outbreaks with no case data listed have a value of 9999) Transmission Type — 0 for Non-vector borne, 1 for Vector Borne Host Type — 0 for Zoonotic, 1 for Human-specific Pathogen Taxonomy — 1 for Bacterium, 2 for Virus, 3 for Protozoon, 4 for Parasite, 5 for Fungus, 6 for Alga 23
Methods of Analysis:
This section will explain the methods of statistical analysis that will be employed in this
study. In the most elementary terms, I will incorporate a variable measuring disease outbreaks
under a range of conditions into the gravity model and perform a regression. Depending on the
coefficient of each regression, I will be able to weigh the relative importance of disease
outbreaks on international trade vis-à-vis the other control variables in the gravity model. What
follows is a more technical discussion of how I have prepared the dataset, introduced controls,
and performed regressions.
This study will focus on the time period from 1980-2005, as this is the largest possible
time period in which both disease outbreak and gravity model data are publicly available. I have
introduced a one-year lead to the dependent variable, trade flow, in order to address a potential
temporality flaw in this study. This problem arises from that fact that the Smith et al. dataset
codes outbreaks in the year in which they began. This means that whether an outbreak occurs
from January 1998 to February 1998, or from December 1998 to March 1999, the Year variable
in Smith et al. will be coded as 1998. This means that measuring the advent of an outbreak
There were no recorded outbreaks of alga during the period covered in this study.23

Henderson ! 16
against trade in the year of that outbreak opens the door to the possibility of measuring an
outbreak against trade outcomes that were largely determined before the outbreak occurred.
Measuring the effect before the cause would be a potentially fatal research design flaw. To
address the issue of putting the proverbial cart before the horse, I will introduce a one-year
“lead” on the flow variable. This means that a pandemic in year X will be measured against trade
in year X+1. This “lead” should address any issues of temporality in this study.
I have also taken the natural log of the dependent variable, flow. This normalizes the
variable which otherwise ranges massively from thousands to billions of dollars. I have also
taken the natural log of the GDP and GDP per capita variables, again to normalize the
distribution of widely varying values. Thusly, note that these variables are coded as lgdp and
lgdpcap in the regressions.
The methodology of treating instances of zero trade is a problem inherent to the gravity
model. In logging the monetary value of dyadic trade, instances of zero—the log of which is
mathematically undefined—are dropped from the data set. While there is precedent in the
literature for accepting these missing values as the cost of using the gravity model, that method 24
is potentially flawed in that it could potentially introduce selection bias, as only dyads with
measured trade are included in the statistical model. This is particularly relevant in the scope of
this study, as instances of trade falling suddenly to zero may be related to an outbreak in that
year. There are a number of methods used to circumvent this particular problem. Head, Mayer,
and Ries propose replacing zeroes with the smallest observed logged value, replacing all zeroes
with $500, replacing all zeroes with $5,000, adding $1 to all values, or adding $1 million to all
Head, Mayer, and Ries, 2010.24

Henderson ! 17
values. After extensive testing of these options, I have added $1 million to all trade flows in
order to retain all trade information in the final regressions. Of every method proposed, it results
in the highest R^2 value, meaning the explanatory power of the model is greatest when using the
logged value of trade plus one million. Just as importantly, it preserves nearly 200,000
observation of zero trade in the final statistical model. After leading the variable for trade (flow)
by one year, adding one million to all values, and taking the natural log, the dependent variable
that I use in the regressions is labeled somewhat clumsily as log_flowp1plus1mil.
I have introduced a number of geographic fixed-effect variables. These absorb some of
the statistical noise from unobserved heterogeneity. In other words, variations in independent
variables that are not otherwise controlled for in this model are “soaked up” in these variables. I
have created dummy variables for the following geographic regions:
Central America South America The Middle East West Africa East Africa Southeast Asia Asia Oceania
These variables should absorb uncontrolled similarities between nations in similar geographic
areas, including natural resource wealth, reporting error, and regionally robust or weak trade. I
have also introduced year fixed-effect variables for every year between 1980 and 2006. Again,
these soak up the effects of independent variables from year to year that are not already
controlled for in my model. Because of these fixed-effect variables, gradual increases in global

Henderson ! 18
population, GDP, and trade are not accidentally incorporated into other controls, including the
outbreak variables at the heart of this study. 25
Operationalization of Hypotheses:
Hypothesis 1: The presence of a disease outbreak in a given country in a given year will depress international imports from and exports to that country in the following year.
I test this hypothesis by incorporating a dummy variable gauging whether or not there
was an outbreak in a given country in a given year—varout —into the gravity model. By 26
regressing the existence of an outbreak in a given year in a given country on international trade
while controlling for the variables in the gravity model, I am able to measure the effects of the
presence of an outbreak on international trade. If the coefficients of the outbreak variables are
negative and the p-value suggests statistical significance, then we will have strong evidence that
disease outbreaks have a negative impact on international trade. 27
Hypothesis 2: Instances in which both members of a dyadic trade pair are undergoing an outbreak will result in an even greater negative effect on imports and exports.
To test this hypothesis, I include a dummy variable in every iteration of this regression
that tests for instances in which both countries in a dyad undergo disease outbreaks in the same
year. These variables are denoted by the suffix _b.
The introduction of fixed-effect variables is conventional when using the gravity model. Cheng and 25
Wall, 1999. Followed by the suffix _o, _d, or _b depending on whether the outbreak occurred in the country from 26
which trade originated, the destination of trade, or both. A more detailed discussion of the statistical methods used in this study is included below under the 27
heading Methods of Analysis.

Henderson ! 19
Hypothesis 3: Trade with a nation’s primary trade partners will be less affected than trade with less important trade partners.
I test this hypothesis by ranking the trade partners of a given nation by total trade flow in
a given year from 1 to X, where X is the number of nations with which there is a recorded trade
value in the dataset. The basic regression can then be limited to observations of trade that are
with a country’s top ten trade partners, or those outside of the top ten. This gives us an
admittedly broad understanding of the impact of disease outbreaks on major trade partners versus
auxiliary ones.
Hypothesis 4: This negative effect on imports and exports will be exacerbated in the case of trade between contiguous nations.
To test this I have created two binary interaction variables, outcontig_o and outcontig_d,
which are coded as one in instances in which a dyadic pair shares a land border and an outbreak
is present in either the origin or the destination of trade, respectively. In all cases in which 28
either or both conditions are not true, the variables are coded as zero.
Hypothesis 5: The negative effect on trade will be greater in more impoverished countries.
I test this hypothesis with several regressions using a number of variables which measure
the effect of disease outbreaks on trade only in countries falling below a certain GDP per capita
threshold. The income thresholds that I use in this study are $456.25 and below, $730 and below,
$1,500 and below, $2,500 and below, $5,000 and below, $10,000 and below, $20,000 and below,
and all values above $20,000. The first two thresholds are the World Bank standards for extreme
poverty and moderate poverty—$1.25 per day and $2 per day, respectively —extrapolated over 29
These interaction variables are generated by multiplying the variable for disease outbreak (varout) with 28
the variable for contiguity (contig). “Poverty Overview,” 2014.29
Henderson ! 20
the course of an entire year. The other thresholds are incremental benchmarks selected to give a
wider view of the issue at hand across a range of economic strata.
Hypothesis 6: The pathological characteristics of a disease will be important in determining its effect on trade.
I have also created outbreak dummy variables for nine ecological characteristics in order
to ascertain which types of diseases have a greater or lesser effect on trade. The nine
characteristics included in this study are listed and explained below:
Vector borne Non-vector borne
These variables measure whether or not a disease is transmitted between hosts by another
organism. Vector borne diseases include malaria, yellow fever, and chikungunya. Non-vector
borne diseases include AIDS, all forms of hepatitis, and Ebola.
Zoonotic Human-Specific
These variables measure the host type of a given disease. Zoonotic pathogens are capable
of living and reproducing indefinitely in non-human populations. Human-specific pathogens are
contagious only between humans, and are not capable of reproducing in non-human hosts.
Zoonotic diseases include dengue, giardiasis, and rabies. Human-specific diseases include
cholera, aseptic and bacterial meningitis, and adenovirus infection.
It should be noted that the distinction made between zoonotic and human-specific
pathogens, while conventional in the field of epidemiology, ignores a more versatile third type of
pathogen. A multi-host pathogen is capable of surviving and reproducing in both human and non-
human hosts. In the dataset used in this study, multi-host pathogens are coded as zoonotic. Due
Henderson ! 21
to constraints on time and a lack of expertise in the field of epidemiology, it was not practical to
individually code each disease in the dataset for multi-host pathology. This distinction could
have a meaningful effect on this study, as human-specific and multi-host pathogens seem more
likely to present obstacles to international trade on the basis that transmission between humans—
including businessmen, diplomats, and longshoreman—is possible.
Bacterium Virus Protozoon Parasite Fungus Alga
These distinctions denote the taxonomy of a given pathogen. They are listed here in order
of decreasing frequency in the dataset. Bacterial diseases include tuberculosis, plague, and all
categories of typhus. Viral diseases include influenza, rotavirus infection, and SARS. Protozoon
diseases include sarcocystosis, rhinosporidiosis, and cyclosporiasis. Parasitic diseases include
mercurial dermatitis, hookworm, and scabies. Fungal diseases include histoplasmosis,
candidiasis, and zygomycosis. There were zero instances of recorded alga disease outbreaks
during the time period covered in this study.
These categories are only a few of many ways to divide and categorize communicable
diseases. For example, an outbreak of influenza is unlikely to manifest in trade in the exact way
that an outbreak of Ebola would, despite both diseases being non-vector born, zoonotic, and
viral. There are a number of other disease characteristics that would be relevant to include in this
study, but which were not for various reasons. The fatality rate of a disease could help reconcile
the wide variety of diseases even within pathological subsets. Unfortunately, fatality rates lack

Henderson ! 22
standardization, varying widely from one source to the next. Also, the fatality rate for many
diseases is determined to a large degree by available treatment options and quality of care. An
excellent example of this is rabies which, if caught early, is curable, but if left untreated for too
long is almost unerringly a death sentence. Another category that would be germane to this 30
study is transmissivity. In epidemiology, this is measured by the basic reproduction number
which measures the number of new cases a single case of a disease would be expected to
generate if introduced to an uninfected population. As with fatality rates, this metric lacks
standardization, varies widely depending on a number of factors, and is questionably relevant in
terms of determining just how contagious a disease is in the traditional sense. Another category 31
that may be of note to this study is food borne disease. There is an argument to be made for
excluding all food-borne illnesses from the dataset, due to the fact that, at first blush, their effect
on trade ought to be predictably negative. However, I argue that this is not necessarily the case.
In fact, only a relatively small portion of international commerce is in foodstuffs. Of these an
even smaller fraction of livestock, poultry, or produce would be affected by an outbreak of any
given food-borne disease. To the degree that food-borne diseases do affect international trade, I
would argue that it is most likely due to the psychological aversion effects on potential trading
partners and lost productivity due to a partially sickened workforce at home, and therefore that
these diseases fall under the purview of this study.
Jabr, 2011.30
For example, according to one study AIDS has a basic reproduction number of 19.7 in the San 31
Francisco gay community, while another study suggests that during the 2014 West African outbreak, Ebola had a basic reproduction number of 1.51-1.59. However, there is little doubt that an Ebola patient is more likely to transmit the condition to those in their immediate vicinity than someone with HIV/AIDS. This example demonstrates the importance of transmissivity period along with time and place in determining a basic reproductive number. Dietz, 1993. Althaus, 2014.

Henderson ! 23
Results
This section will present and explain the results of the statistical regressions used to test
the hypotheses enumerated above. Again, all of these hypotheses are tested using standard
regressions that control for the variables in the standard gravity model as well as a number of
geographical and temporal fixed-effect variables. By comparing the relative size, direction, and
statistical significance of each coefficient, this method allows us to gauge the relative effect of
each control on trade in a given year. Converting these coefficients to dollar values is an inexact
science, due to the fact that the dependent variable is a logarithmic function and that it has had a
blanket addition of one million dollars added across all values. At the most basic level, a
coefficient of 1 or -1 would result in roughly a tenfold increase or decrease in trade in a given
year. Again, this is an imperfect measure. Any attempt to measure the real world cost of trade
gained or lost from this study should be viewed as relative to the other controls in the gravity
model, rather than as a strict dollar figure. It should be noted that comparing outbreak variables
to other dichotomous variables is simpler than comparing them to variables with a greater range
of values. For example, a variable such as weighted distance (distw) appears to have a very 32
small coefficient in the basic model, but this is measuring the impact per kilometer, as opposed 33
to a variable such as common official language (comlang_off), which is coded as either a zero or
one in all cases.
Hypothesis 1: The presence of a disease outbreak in a given country in a given year will depress international imports from and exports to that country in the following year.
The distance is weighted to reflect national population centers, as opposed to the shortest distance 32
between two borders. For example, Russia and Mongolia share a land border, despite their respective population centers being thousands of kilometers apart.
Appendix C33

Henderson ! 24
R-Squared: 0.670 34
Above are the results of the standard model used in this study, along with three binary
variables for an outbreak in the exporting country (varout_o), the importing country (varout_d),
or in both members of the dyad (varout_b). The R^2 value, 0.6705, tells us that the statistical
model as a whole is explaining just over 67 percent of the variance we see in our dependent
variable. This substantial value confirms the explanatory and predictive capabilities of the basic
statistical model used herein. It should also be noted that this value is a slight but relevant
increase over the R^2 value of the basic gravity model, which is 0.6681, suggesting that the 35
addition of the disease outbreak variables is a very small but still relevant explanatory factor in
international trade. For all three variables, the p-value is 0.000, meaning that the chance of 36
these results being achieved with a set of random values is less than one in one-thousand. This
establishes the statistical significance of these results and suggests that the findings are
meaningful from an academic standpoint.
Variables Coefficients Robust Standard Error
Outbreak in exporting country
-0.089*** 0.009
Outbreak in importing country
-0.147*** 0.009
Outbreak in both exporting and importing countries
0.389*** 0.013
As is standard in studies such as this, each statistically significant coefficient is followed by an asterisk 34
denoting the p-value of that particular finding. One asterisk denotes a p-value of less than 0.05, meaning that the finding would be generated by a random set of numbers at most five times out of 100. Two asterisks denote a p-value of at least 0.01. Three asterisks indicate the most significant findings with p-values of at least 0.001. The chance of these findings being the product of chance is less than one in 1,000. Coefficients without any asterisks are not statistically significant.
Appendix B35
The introduction of disease variables does not significantly alter the magnitude or direction of any other 36
independent variables included in the gravity model.

Henderson ! 25
The coefficients themselves tell an interesting story. According to the first two
coefficients listed above, an outbreak in either an exporting or an importing country results in a
decrease in dyadic trade flows. This effect is more pronounced in the case of afflicted importers.
These findings are in line with the first hypothesis explained in detail above. It stands to reason
that traders are hesitant to do business with an afflicted nation, whether importing or exporting.
While this hesitation may be well-founded in many cases, it may also be irrational, speculative,
or even hysterical. Forgoing trade with a nation simply because it is undergoing an outbreak may
be foolhardy in the case of outbreaks that are significantly contained geographically, limited to a
portion of the population, or unlikely to be transmitted in the course of international commerce.
This effect may also apply to consumers considering the purchase of something imported from
an afflicted country. It is possible that there is a psychological barrier to purchasing any goods
from such a nation, and that inability to sell goods to end-consumers may result in even the most
rational traders choosing to by goods from non-afflicted countries.
Other than the consternation of potential trading partners and foreign consumers, the
decline in trade in countries undergoing a disease outbreak may also be related to a dip in
domestic productivity and wage-earning due to sickness and even death in the workforce. The
results of such a decrease in economic productivity would affect both exports—fewer goods to
sell due to falling productivity—and imports—citizens lose expendable income due to lost
wages, healthcare expenses, etc.
Hypothesis 2: Instances in which both members of a dyadic trade pair are undergoing an outbreak will result in an even greater negative effect on imports and exports.

Henderson ! 26
While the first hypothesis set forth in this paper is born out by the data in cases where one
member of a dyad undergoes an outbreak, the second is decidedly not. The coefficient for dyads
in which both members are undergoing a disease outbreak is 0.3887, a massive value that defies
simple explanation. Keep in mind that these are not necessarily situations in which two countries
have the same disease. It simply means these countries are undergoing an outbreak of any
disease in the dataset. Not only is this effect inexplicably large—greater than the effect of a
shared currency or official language—but it is persistent across nearly every regression presented
in this study and nearly impervious to my attempts to explain it through controls and alternate
statistical methodologies. At first I speculated that this could be driven by massive countries like
the United States, China, Russia, Mexico, Canada and India frequently reporting outbreaks (due
to the size of their populations and superior detection and reporting mechanisms) while trading
massive amounts with one another. However, even without these countries, the results are
similar. Across the large majority of outbreak variables I have regressed, this effect remains
sizable and statistically significant. Applying Occam’s Razor to this problem, one might
conclude that countries figure that if they are both experiencing epidemics then they might as
well trade with one another. While there may be some truth to this, it strikes me as an overly
simplistic explanation. After all, what motivation does a country undergoing a syphilis outbreak
have to increase exports to or imports from a country afflicted with dengue? This is a puzzle that
I hope future research will continue to explore.
Hypothesis 3: Trade with a nation’s primary trade partners will be less affected than trade with less important trade partners.

Henderson ! 27
R-Squared: 0.849
R-Squared: 0.638
The above regression measures the effect of an outbreak on trade with a given nation’s
top ten trading partners. Both the origin and both variables have minuscule coefficients and are
statistically insignificant by a wide margin. This tells us that the outbreak of a disease essentially
has no meaningful effect on either exports or trade with other afflicted countries among major
trading partners. The data does suggest a negative effect on imports, even among a nation’s top
ten trading partners. Throughout the regressions presented herein, the prominent negative effect
on imports in the event of an outbreak is a common thread.
On the other hand, the coefficients for all trading partners outside of the top ten tells a
very different story. In this case, the negative effects on imports and exports are both statistically
significant and pronounced. The effect on exports that we see in the general model has
manifested, while the detrimental effect on imports already present in the top ten regression has
increased significantly. This tells us that while high-volume trade relationships—presumably the
result of historical familiarity, proximity, trade agreements, etc.—are durable in the face of
Variables Coefficients Robust Standard Error
Top ten: exporter 0.028 0.029
Top ten: importer -0.085** 0.026
Top ten: both 0.010 0.033
Variables Coefficients Robust Standard Error
Non-top 10: exporter -0.065*** 0.008
Non-top 10: importer -0.138*** 0.008
Non-top 10: both 0.372*** 0.012

Henderson ! 28
disease outbreaks, marginal trade relations are much more susceptible to the effects observed in
the general model.
It is also of note that the both variable, insignificant in the top ten regression, has reached
very nearly the same level that it was in the basic regression (0.3723 compared to 0.3887). This
tells us that the positive effect on trade between two afflicted nations exists almost entirely
outside of a nations top ten trading partners. While this may not shed light on the puzzling nature
of the both variable’s positive coefficient, it does tell an interesting story about the behavior of
afflicted nations.
Hypothesis 4: This negative effect on imports and exports will be exacerbated in the case of trade between contiguous nations.
R-Squared: 0.668
In terms of imports and exports, this regression produces results that are not statistically
significant. The minuscule coefficient and massive p-value of the imports variable tells us that
the presence of a disease has very little to do with imports from contiguous nations. In terms of
exports, we have a large coefficient, but a p-value that just misses statistical significance. If the
result is true however, it tells an important story about afflicted nations increasing their exports to
contiguous countries in times of disease outbreak. Again, no firm results can be drawn either
confirming or denying this hypothesis, although the lack of significant results in a dataset of this
Variables Coefficients Robust Standard Error
Contiguous: exporter 0.156 0.086
Contiguous: importer 0.009 0.087
Contiguous: both 0.339*** 0.101

Henderson ! 29
size strongly suggests that contiguous countries do not trade less with one another in the event of
an outbreak as conjectured in Hypothesis 4.
The one result that is statistically significant is the sizable coefficient attached to the both
variable. This variable tells us that contiguous countries reliably trade more when they are both
afflicted with an outbreak. One could surmise that contiguous countries are more likely to
undergo outbreaks of the same exact disease, in which case an increase in trade could be related
to sharing resources and coordinated containment and treatment efforts. However, subsequent
testing of cases that match that particular criteria contradicts this conjecture. The both variable
remains strong regardless of the particulars of each outbreak.
Hypothesis 5: The negative effect on trade will be greater in more impoverished countries.
GDP per capita over $20,000: R-Squared: 0.673
GDP per capita below $20,000: R-Squared: 0.668
Variables Coefficients Robust Standard Error
Over 20,000: exporter 0.298*** 0.023
Over 20,000: importer 0.093*** 0.025
Over 20,000: both 1.402*** 0.061
Variables Coefficients Robust Standard Error
Under 20,000: exporter -0.054*** 0.008
Under 20,000: importer -0.058*** 0.009
Under 20,000: both 0.101*** 0.011

Henderson ! 30
GDP per capita below $10,000: R-Squared: 0.668
GDP per capita below $5,000: R-Squared: 0.668
GDP per capita below $2,500: R-Squared: 0.668
GDP per capita below $1,500: R-Squared: 0.668
Variables Coefficients Robust Standard Error
Under 10,000: exporter -0.041*** 0.009
Under 10,000: importer -0.056*** 0.009
Under 10,000: both -0.004 0.013
Variables Coefficients Robust Standard Error
Under 5,000: exporter -0.065*** 0.010
Under 5,000: importer -0.078*** 0.009
Under 5,000: both -0.006 0.015
Variables Coefficients Robust Standard Error
Under 2,500: exporter -0.087*** 0.009
Under 2,500: importer -0.086*** 0.008
Under 2,500: both 0.032 0.016
Variables Coefficients Robust Standard Error
Under 1,500: exporter -0.117*** 0.010
Under 1,500: importer -0.100*** 0.009
Under 1,500: both 0.072*** 0.020

Henderson ! 31
GDP per capita below $670: R-Squared: 0.669
GDP per capita below $456.25: R-Squared: 0.669
The table above tells a fascinating story about the importance of wealth in deterring the
effects of an outbreak on trade. The first chart measures countries with a GDP per capita over
$20,000. These are generally wealthy European and North American countries, with robust 37
healthcare systems, large economies, and numerous trade relationships. This regression tells us
with a high degree of statistical certainty that nations in this GDP per capita slice actually
experience an increase in trade in the event of an outbreak. This pattern is particularly
pronounced in the case of exports, which spike significantly. The both variable for these
countries is enormous, and suggests a massive surge in trade between wealthy countries
undergoing an outbreak. As we will see below, the both characteristic is much smaller in all other
GDP per capita slices, suggesting that a large proportion of the both coefficient in the general
model is driven by these instances of large nations trading with one another. It is curious that a
Variables Coefficients Robust Standard Error
Moderate poverty: exporter -0.185*** 0.012
Moderate poverty: importer -0.142*** 0.012
Moderate poverty: both 0.140*** 0.027
Variables Coefficients Robust Standard Error
Extreme poverty: exporter -0.191*** 0.014
Extreme poverty: importer -0.137*** 0.014
Extreme poverty: both 0.179*** 0.035
The exact sample changes from year to year, as the GDP and population of each country shift over time.37
Henderson ! 32
disease outbreak would spur greater trade in wealthier nations. This effect may be attributable to
these nations trading treatments and potential cures with one another. It may also be that a
coordinated government response to a crisis such as a disease outbreak actually stimulates the
economy, as government money flows into treatment, research, and prevention measures.
The next regression measures the effect of an outbreak on countries with a GDP per
capita below $20,000. Immediately, negative effects on imports and exports appear. This tells us
that the cutoff for when a country begins experiencing the negative effects of an outbreak on
trade is somewhere around the $20,000 mark. The both variable remains positive, but is less than
one-tenth the magnitude that we saw in wealthier countries.
In the case of countries with a GDP per capita below $10,000, the coefficients for both
imports and exports are slightly less negative than in the previous regression, although the values
remain very similar. Meanwhile, the effect on the both variable is no longer significant,
suggesting that this variable may have no explanatory power for trade between countries below
this cutoff.
In the next regression, which measures countries below $5,000, we see a greater decline
in imports and exports. The both variable remains statistically insignificant. This regression kicks
off a series of results in which each GDP per capita slice portends more devastating effects on
imports and exports than the last. The effect on countries with a GDP per capita below the World
Bank standard for moderate poverty ($670 per year) and extreme poverty ($456.25 per year) are
particularly alarming. The coefficient for each nearly doubles that of any other GDP per capita
grouping. In the case of extreme poverty, the regression forecasts a drop in imports and exports
that is roughly equivalent to 1,975 and 1,419 kilometers of weighted distance respectively.

Henderson ! 33
Interestingly, for all groupings below $2,500, the negative effect on exports appears greater than
that on imports. This is the inverse of what we have come to expect in the other regressions,
which generally have a more negative-leaning coefficient for imports. It is also interesting that
the both variable which became insignificant in the middle groupings becomes both significant
and increasingly sizable in the lower income groupings.
Viewed as a whole, this set of results confirms the hypothesis that more impoverished
countries suffer a greater decrease in trade in the event of a disease outbreak. While the both
variable continues to confound—it has an enormous effect between wealthy countries, becomes
insignificant in middling countries, then surges again in increasingly poor nations—the results on
imports and exports are more readily explicable. Overall, the effect on both importers and
exporters grow steadily more negative as we descend into lower and lower GDP per capita
brackets. The most apparent explanation for this is that less wealthy countries lack the state
capacity—hospitals and other medical facilities, doctors and other medical personnel, adequate
systems of detection, roads and bridges to carry aid to backwater communities, government
institutions to coordinate relief efforts, intellectual capital to develop treatments and cures, etc.—
to respond effectively to an outbreak, and thereby mitigate the potential negative effects on trade
and the economy at large. This lack of state capacity could cause a decline in domestic
production, as the workforce is weakened. It could also present a legitimate deterrent for
potential trade partners who are concerned about traveling to a given country, or who are nervous
that end-consumer will have an aversion to goods produced in this country. No matter the
specific reason for this decline, it has very real consequences for the citizens of these nations
who may find themselves in both an afflicted country as well as an economically handicapped

Henderson ! 34
one. Foreign governments and international aid groups should keep this in mind when allocating
resources to afflicted countries around the world.
Hypothesis 6: The pathological characteristics of a disease will be important in determining its effect on trade.
R-Squared: 0.668
R-Squared: 0.670
According to this statistical model, vector borne diseases have no statistically significant
effect on trade. Meanwhile, non-vector borne diseases show results that track somewhat closely
to those in our basic trade model—a negative effect on exports, a stronger negative effect on
imports, and a very strong positive effect on both. This makes some intuitive sense. Diseases that
are vector borne may be less likely (or perceived as less likely) to be transmitted through the
course of trade, as they are generally transferred between humans by other organisms, as
opposed to human contact. An outbreak of a disease like malaria, which only transmits directly
between humans congenitally, through blood transfusions, organ transplants, or contaminated
Variables Coefficients Robust Standard Error
Vector borne: exporter 0.015 0.009
Vector borne: importer -0.011 0.008
Vector borne: both -0.007 0.027
Variables Coefficients Robust Standard Error
Non-vector borne: exporter -0.048*** 0.008
Non-vector borne: importer -0.099*** 0.008
Non-vector borne: both 0.352*** 0.013

Henderson ! 35
syringes, may be less likely to deter a trader than something that is contagious directly between 38
humans. In terms of the predictive capability of this study, this finding helps us weed out which
diseases are most devastating to trade. In this case, we know that diseases that transmit directly
between human hosts are likely to have strong negative effects on trade.
R-Squared: 0.669
R-Squared: 0.668
These results tell us that zoonotic diseases have a negative effect on imports, and an
insignificant effect on exports. Interestingly, human specific diseases seem to have a slight
positive effect on trade. This could be due to a government response that includes investment in
treatment, inoculation, medicine, research, etc. Due to a variety of possible reasons—frequency
of occurrence, severity of the disease, etc.—this government response may be less robust in the
case of zoonotic diseases.
Variables Coefficients Robust Standard Error
Zoonotic: exporter -0.010 0.006
Zoonotic: importer -0.071*** 0.007
Zoonotic: both 0.243*** 0.011
Variables Coefficients Robust Standard Error
Human specific: exporter 0.021*** 0.006
Human specific: importer 0.020*** 0.006
Human specific: both 0.143*** 0.012
“Malaria Transmission,” 2009.38
Henderson ! 36
R-Squared: 0.668
R-Squared: 0.668
R-Squared: 0.668
R-Squared: 0.668
Variables Coefficients Robust Standard Error
Bacterium: exporter 0.025*** 0.006
Bacterium: importer -0.023*** 0.007
Bacterium: both 0.156*** 0.011
Variables Coefficients Robust Standard Error
Virus: exporter -0.005 0.006
Virus: importer -0.017** 0.006
Virus: both 0.193*** 0.013
Variables Coefficients Robust Standard Error
Protozoon: exporter 0.010 0.011
Protozoon: importer -0.008 0.012
Protozoon: both 0.198* 0.078
Variables Coefficients Robust Standard Error
Parasite: exporter 0.074*** 0.013
Parasite: importer 0.069*** 0.014
Parasite: both 0.087 0.097

Henderson ! 37
R-Squared: 0.668
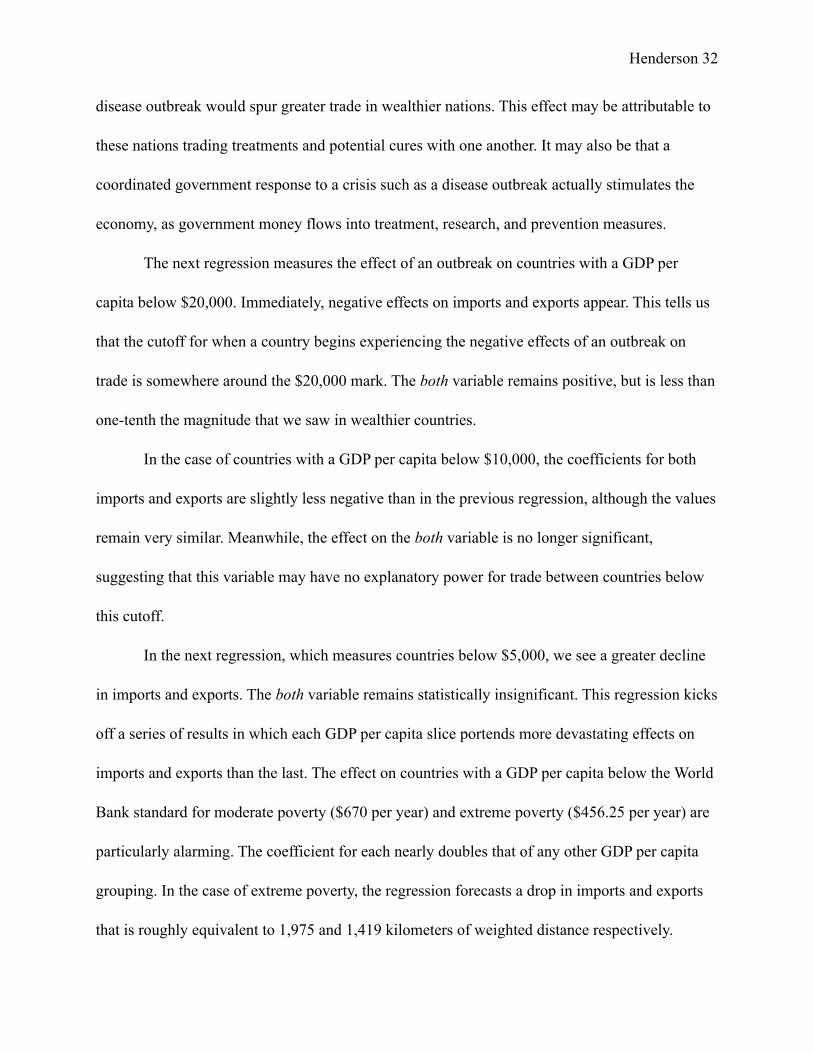
These results break down the effect on trade of each disease taxonomy included in the
dataset. The statistical significance falls below the commonly accepted academic threshold in a
number of cases, but there are still some important takeaways from these regressions. The
positive effect of the both variable remains strong across all regressions with the exception of
parasitic diseases, for which it is statistically insignificant. Bacterial and viral diseases, by far the
most common types of outbreaks, both have negative coefficients in the case of imports. This is
in line with the many of the other findings presented herein. Interestingly, bacteria, parasites, and
fungi all show positive coefficients in the case of exports. The could be related to government
responses to disease spurring the larger economy, or due to displaced consumption—citizens
who are sick buy less, so those goods are exported overseas.
With these caveats in place, I would like to reaffirm what may be the most important
finding in this study. When the both variable is removed from the regressions, it has a significant
positive effect on many variables. However, it does not significantly change the findings
regarding the increasing effects of disease outbreaks in increasingly impoverished countries.
Variables Coefficients Robust Standard Error
Fungus: exporter 0.117*** 0.018
Fungus: importer 0.047* 0.020
Fungus: both 0.800*** 0.172

Henderson ! 38
Discussion
While I have already explored many of the substantive findings and potential
ramifications of this study above, this section will delve more deeply into what I find to be the
most perplexing results: the strong coefficient for the both variable across nearly every
regression. The nature of the regression used in this study is such that each independent variable
controls against each other independent variable. Therefore, each instance of both countries
undergoing an outbreak (in the standard model: varout_b) actually removes the statistical effect
of that instance from the other outbreak variables (varout_o and varout_d). Coupled with the fact
that there are a large number of instances of outbreak in both countries, this indicates that 39
absent the both variable many of the negative origin and destination coefficients would become
positive. In other words, without the interaction term, the model would tell us that a disease
outbreak generally results in increased exports and an insignificant effect on imports. In this 40
light, the findings of the general model presented under hypothesis one (and reflected in many of
the other regressions) is that unilateral outbreaks drive trade down, joint outbreaks increase trade,
and the net effect of outbreaks on trade is either positive or insignificant.
The finding that the net effect of disease on trade is positive, often significantly so, runs
contrary to common sense. I have already presented several theories as to why this finding might
manifest. It could be a result of afflicted nations figuring they might as well trade with one
another if other nations are trading less with them. As mentioned above, I question the simplistic
nature of this explanation. A more plausible explanation would be that robust responses from aid
organizations and governments in fact stimulate a country’s economy more than disease outbreak
Appendix D39
Appendix E40

Henderson ! 39
hurts it. If this is the case, this finding may be important to larger discussions of the ideal role of
the government in stimulating the economy. While that particular issue is a massively important
and politically contentious one that is largely outside the scope of this study, it should be noted
that this potential explanation would reinforce the theory that government spending stimulates
the economy in the short term. Another explanation posits that disease outbreaks tend to decrease
the domestic supply of numerous goods, thereby increasing their value. Because the trade values
are recorded in dollars instead of the quantity of goods bought and sold, it may be that the same
or less volume of trade results in a higher monetary value. While it is impossible to verify this
theory without data detailing either a globally standardized value for goods traded or the actual
volume of goods traded, it would explain some this study’s findings rather neatly. Specifically, it
would help explain the increase in imports due to the soaring value of goods, as well as the both
variable, as both countries experience inflated values for goods traded with one another. While I
find some these theories to be compelling, absent further research untangling this relationship we
can only speculate.
A portion of the explanation for this strange finding may be endemic to the broad nature
of this study. The variety of diseases included in the statistical model used herein is expansive,
even when narrowed down by different epidemiological characteristics. Without an objective, 41
standardized, and publicly available way of assessing both disease severity and transmissibility,
it is nigh impossible to narrow down diseases according to the traits that we would expect to
have the greatest effect on human behavior—in this case trade. It may be that outbreaks of the
most severe diseases do in fact exert a negative effect on trade, but that less serious diseases
Appendix A41

Henderson ! 40
stimulate trade. If this is the case, the broad nature of this statistical model may obscure the
negative effect of the most serious conditions behind the positive effects of all the rest. It is my
hope that future research will systematically quantify the severity and transmissibility of
diseases, allowing more specific examination of the effects of disease outbreaks on trade.
While the majority of regressions are highly sensitive to the treatment of the both variable
and experience significant positive change when it is removed, the findings regarding the
increasing negative effect of disease outbreaks on poverty do not. Even without the both
variable, these findings remain both strongly negative and statistically significant. The fact that 42
this finding is largely insensitive to the treatment of the both variable further confirms its
importance as a statistical determinant. This is important for two reasons. First, it suggests that a
large part of the positive both effect is contained in wealthy countries trading with each other,
particularly those with a GDP per capita in excess of $20,000. Second, it reaffirms the conclusion
that impoverished countries are more greatly affected economically by disease outbreak. This
may be the most important finding uncovered in this study, as it can help inform international aid
organizations and other altruistic parties as to where best to allocate finite resources. This strong
negative relationship between disease and trade in the world’s poorest countries should raise
alarm bells for government agencies, aid groups, and future researchers alike.
Appendix F42

Henderson ! 41
Conclusion
This study began with the simple question of how disease outbreaks affect international
trade. As is so often the case with simple questions, the answer is much more complicated than a
simple yes or no. This study has confirmed the broad hypothesis that instances of an outbreak in
either the importing or exporting member of a dyadic trade pair results in a loss of trade. Upon
more nuanced inspection, this study finds that the direction and magnitude of this effect has a
tremendous amount to do with the individual nations involved and the nature of the disease itself.
This study has produced statistical results that suggest a number of conclusions. Instances in
which both members of a dyad undergo a disease outbreak generally result in more trade than
would otherwise be expected. Contiguity is not a significant factor in explaining the effect of
disease on imports or exports. Trade relations with an afflicted nation’s top trading partners are
less affected than those with peripheral partners. As a general rule, the more impoverished a
nation is, the greater the negative effect on trade is for that nation. Finally, the specific pathology
of a disease matters in terms of how it will affect trade. Specifically, bacterial and viral diseases
exert negative effects on imports, while other disease types have either positive or statistically
insignificant effects.
I have proposed a number of possible explanations for these results which are detailed
above. I believe that positive effects observed in the event of an outbreak are likely due to
increased trade in goods related to a specific outbreak (medicine, resources, food, miscellaneous
aid, etc.), to an increase in government spending in times of medical emergency that, in turn,
may lift the economy, or to an increase in the monetary value of trade goods as domestic
production falls. This second proposal is supported by the positive effects of outbreaks in

Henderson ! 42
wealthy nations capable of staging a robust and prolonged campaign against a public health
threat compared to negative effects in the type of impoverished country that lacks the resources
for this. I believe that the observed negative effects on trade can be attributed to internal and
external factors. Within a given country, a disease outbreak may weaken or kill members of the
workforce. In turn, this may lessen domestic production outputs, leading to fewer goods to
exports. Citizens may also lose wages due to illness, which could lessen their financial ability to
purchase imported goods. Externally, consumers in other countries may have an aversion to
purchasing goods from an afflicted nation, lessening exports. Traders may be concerned by the
risk of contagion when conducting business with citizens of an afflicted country, whether or not
these fears are rational. If true, this could drive a decrease in both imports and exports.
These findings are important for a number of reasons. There is inherent value in
understanding the underlying precepts and tectonic forces that control global marketplaces.
International trade is an important aspect of every nation’s economic success, which in turn
affects the lives of everyday citizens. Recognizing the determinants of the international
marketplace allows governments, businesses, aid organizations, and everyday people to predict
and prepare for an uncertain future. Recognizing the potential positive and negative effects of a
given disease outbreak on the amount of actual capital flowing into and out of a nation can allow
governments and aid organizations to fill the economic void that may follow an epidemic. In the
introduction to this thesis, I proposed the possibility of a vicious cycle in which disease causes
poverty which, in turn, causes more disease. While the overall net positive effect suggests that 43
in many cases this circle may not be as vicious as imagined, further testing confirms that
Suhrcke et al. 2011.43

Henderson ! 43
impoverished countries—those who can least afford economic calamity—are the most likely to
face economic devastation in the wake of disease outbreak. Sun Tzu teaches that, “if you know
your enemies and know yourself, you will not be imperiled in a hundred battles.” In this case,
disease is the enemy. In some cases this deadly adversary exerts a predictable negative economic
influence, in others a surprising positive one. In all cases, understanding the nature and effects of
disease is a vital weapon in the struggle to improve the human condition.

Henderson ! 44
Bibliography
Aginam, Obijiofor. “International Law and Communicable Diseases.” Bulletin of the World
Health Organization 80, no. 12 (January 2002): 946–51. doi:10.1590/
S0042-96862002001200008.
Althaus, Christian L. “Estimating the Reproduction Number of Ebola Virus (EBOV) During the
2014 Outbreak in West Africa.” PLoS Currents, 2014. doi:10.1371/currents.outbreaks.
91afb5e0f279e7f29e7056095255b288.
Beaglehole, R, and D Yach. “Globalisation and the Prevention and Control of Non-
Communicable Disease: The Neglected Chronic Diseases of Adults.” The Lancet 362, no.
9387 (September 13, 2003): 903–8. doi:10.1016/S0140-6736(03)14335-8.
Besley, Timothy, and Torsten Persson. “State Capacity, Conflict, and Development.”
Econometrica 78, no. 1 (January 1, 2010): 1–34. doi:10.3982/ECTA8073.
Carpenter, Tim E., Joshua M. O’Brien, Amy D. Hagerman, and Bruce A. McCarl. “Epidemic and
Economic Impacts of Delayed Detection of Foot-And-Mouth Disease: A Case Study of a
Simulated Outbreak in California.” Journal of Veterinary Diagnostic Investigation 23, no.
1 (January 1, 2011): 26–33. doi:10.1177/104063871102300104.
Cheng, I.-Hui, and Howard J. Wall. “Controlling for Heterogeneity in Gravity Models of Trade
and Integration.” Working Paper Series, no. No. 1999–010 (January 1999). http://
research.stlouisfed.org/wp/more/1999-010/.
Dietz, K. “The Estimation of the Basic Reproduction Number for Infectious Diseases.”
Statistical Methods in Medical Research 2, no. 1 (March 1, 1993): 23–41. doi:
10.1177/096228029300200103.

Henderson ! 45
Eaton, Jonathan, and Samuel Kortum. “Technology, Geography, and Trade.” Econometrica 70,
no. 5 (2002): 1741–79. doi:10.1111/1468-0262.00352.
"FAO: Ebola Outbreak Putting West African Trade, Food Security in Jeopardy." International
Center for Trade and Sustainable Development. September 10, 2014. Accessed March 9,
2015.
Haydon, Daniel T., Rowland R. Kao, and R. Paul Kitching. “The UK Foot-and-Mouth Disease
Outbreak — the Aftermath.” Nature Reviews Microbiology 2, no. 8 (August 2004): 675–
81. doi:10.1038/nrmicro960.
Head, Keith, Thierry Mayer, and John Ries. “The Erosion of Colonial Trade Linkages after
Independence.” Journal of International Economics 81, no. 1 (May 2010): 1–14. doi:
10.1016/j.jinteco.2010.01.002.
Hendrix, Cullen S. “Measuring State Capacity: Theoretical and Empirical Implications for the
Study of Civil Conflict.” Journal of Peace Research 47, no. 3 (May 1, 2010): 273–85. doi:
10.1177/0022343310361838.
Jabr, Ferris. "Rabies May Not Be the Invincible Killer We Thought." News Scientist. June 21,
2011. Accessed March 9, 2015.
Karesh, William B., Robert A. Cook, Elizabeth L. Bennett, and James Newcomb. “Wildlife
Trade and Global Disease Emergence.” Emerging Infectious Diseases 11, no. 7 (July
2005): 1000–1002. doi:10.3201/eid1107.050194.
Krystynak, Ronald H.E., and Pierre A. Charlebois. “The Potential Economic Impact of an
Outbreak of Foot-and-Mouth Disease in Canada.” The Canadian Veterinary Journal 28,
no. 8 (August 1987): 523–27.

Henderson ! 46
Labonté, Ronald, Katia S Mohindra, and Raphael Lencucha. “Framing International Trade and
Chronic Disease.” Globalization and Health 7, no. 1 (2011): 21. doi:
10.1186/1744-8603-7-21.
MacLehose, Laura, Martin McKee, and Julius Weinberg. “Responding to the Challenge of
Communicable Disease in Europe.” Science 295, no. 5562 (March 15, 2002): 2047–50.
doi:10.1126/science.1070025.
"Malaria Transmission." National Institute of Allergy and Infectious Disease. February 25, 2009.
Accessed March 9, 2015. http://www.niaid.nih.gov/topics/Malaria/understandingMalaria/
Pages/transmission.aspx.
"Poverty Overview." The World Bank. October 7, 2014. Accessed March 9, 2015. http://
www.worldbank.org/en/topic/poverty/overview#1.
Rechel, Boika, Marc Suhrcke, Svetla Tsolova, Jonathan E. Suk, Monica Desai, Martin McKee,
David Stuckler, et al. “Economic Crisis and Communicable Disease Control in Europe: A
Scoping Study among National Experts.” Health Policy 103, no. 2–3 (December 2011):
168–75. doi:10.1016/j.healthpol.2011.06.013.
Smith, Katherine F., Michael Goldberg, Samantha Rosenthal, Lynn Carlson, Jane Chen, Cici
Chen, and Sohini Ramachandran. “Global Rise in Human Infectious Disease Outbreaks.”
Journal of The Royal Society Interface 11, no. 101 (December 6, 2014): 20140950. doi:
10.1098/rsif.2014.0950.
Stylianou, Nassos. "How World’s Worst Ebola Outbreak Began with One Boy’s Death." BBC
News. November 26, 2014. Accessed March 9, 2015.

Henderson ! 47
Suhrcke, Marc, David Stuckler, Jonathan E. Suk, Monica Desai, Michaela Senek, Martin
McKee, Svetla Tsolova, et al. “The Impact of Economic Crises on Communicable
Disease Transmission and Control: A Systematic Review of the Evidence.” PLoS ONE 6,
no. 6 (June 10, 2011): e20724. doi:10.1371/journal.pone.0020724.
Sy, Amadou and Amy Copley. “Understanding the Economic Effects of the 2014 Ebola Outbreak
in West Africa.” The Brookings Institution. October 1, 2014. Accessed March 9, 2015.
http://www.brookings.edu/blogs/africa-in-focus/posts/2014/10/01-Ebola-outbreak-west-
africa-sy-copley.
Trefler, Daniel. “The Case of the Missing Trade and Other Mysteries.” American Economic
Review 85, no. 5 (1995): 1029–46.

Henderson ! 48
Appendix A - List of Diseases Included in Smith et al
ADENOVIRUS INFECTION AEROMONAS & MARINE VIBRIO INFX. AFRICAN TICK BITE FEVER AIDS AMOEBA - FREE LIVING AMOEBIC COLITIS ANAPLASMOSIS ANGIOSTRONGYLIASIS ANGIOSTRONGYLIASIS - ABDOMINAL ANISAKIASIS ANTHRAX ASPERGILLOSIS BABESIOSIS BACILLUS CEREUS FOOD POISONING BARMAH FOREST DISEASE BARTONELLOSIS - CAT BORNE BARTONELLOSIS - OTHER SYSTEMIC BARTONELLOSIS - SOUTH AMERICAN BLASTOCYSTIS HOMINIS INFECTION BLASTOMYCOSIS BOLIVIAN HEMORRHAGIC FEVER BOTULISM BRAINERD DIARRHEA BRAZILIAN PURPURIC FEVER BRUCELLOSIS BUNYAVIRIDAE INFECTIONS - MISC. CALIFORNIA ENCEPHALITIS GROUP CAMPYLOBACTERIOSIS CANDIDIASIS CAPILLARIASIS - INTESTINAL CERCARIAL DERMATITIS CHANCROID CHANDIPURA AND VESICULAR STOMATITIS VIRUSES CHIKUNGUNYA CHLAMYDIA INFECTIONS, MISC. CHLAMYDOPHILA PNEUMONIAE INFECTION CHOLERA CLONORCHIASIS CLOSTRIDIAL FOOD POISONING CLOSTRIDIAL MYONECROSIS CLOSTRIDIUM DIFFICILE COLITIS COCCIDIOIDOMYCOSIS CONJUNCTIVITIS - INCLUSION CONJUNCTIVITIS - VIRAL CRIMEAN-CONGO HEMORRHAGIC FEVER CRYPTOSPORIDIOSIS CUTANEOUS LARVA MIGRANS CYCLOSPORIASIS CYSTICERCOSIS
DENGUE DERMATOPHYTOSIS DIPHTHERIA DIPHYLLOBOTHRIASIS DRACUNCULIASIS EASTERN EQUINE ENCEPHALITIS Ebola ECHINOCOCCOSIS - UNILOCULAR EHRLICHIOSIS - HUMAN MONOCYTIC ENTERITIS NECROTICANS ENTEROVIRUS INFECTION ERYSIPELOID ESCHERICHIA COLI DIARRHEA FASCIOLIASIS FUNGAL INFECTION - INVASIVE GASTROENTERITIS - VIRAL GIANOTTI-CROSTI SYNDROME GIARDIASIS GLANDERS GNATHOSTOMIASIS GONOCOCCAL INFECTION HANTAVIRUS INFECTION - OLD WORLD HANTAVIRUS PULMONARY SYNDROME HEPATITIS A HEPATITIS B HEPATITIS C HEPATITIS D HEPATITIS E HERPES B INFECTION HERPES SIMPLEX INFECTION HERPES ZOSTER HETEROPHYID INFECTIONS HISTOPLASMOSIS HISTOPLASMOSIS - AFRICAN HOOKWORM HUMAN HERPESVIRUS 6 INFECTION INFLUENZA JAPANESE ENCEPHALITIS JAPANESE SPOTTED FEVER KAWASAKI DISEASE KINGELLA INFECTION KYASANUR FOREST DISEASE LARYNGOTRACHEOBRONCHITIS LASSA FEVER LEGIONELLOSIS LEISHMANIASIS - CUTANEOUS LEISHMANIASIS - MUCOCUTANEOUS LEISHMANIASIS - VISCERAL LEPROSY LEPTOSPIROSIS LISTERIOSIS

Henderson ! 49
LYME DISEASE LYMPHOCYTIC CHORIOMENINGITIS LYMPHOGRANULOMA VENEREUM MALARIA MARBURG VIRUS DISEASE MAYARO MEASLES MELIOIDOSIS MENINGITIS - ASEPTIC (VIRAL) MENINGITIS - BACTERIAL MICROSPORIDIOSIS MONKEYPOX MUMPS MYCOBACTERIOSIS - M. MARINUM MYCOBACTERIOSIS - M. ULCERANS MYCOBACTERIOSIS - MISCELLANEOUS NONTUBERCULOUS MYCOPLASMA (MISCELLANEOUS) INFECTIONS MYCOPLASMA PNEUMONIAE INFECTION MYIASIS NECROTIZING SKIN/SOFT TISSUE INFX. NIPAH AND NIPAH-LIKE VIRUS DISEASE NOCARDIOSIS O'NYONG NYONG OCKELBO DISEASE OLD WORLD PHLEBOVIRUSES ONCHOCERCIASIS OPISTHORCHIASIS ORBITAL AND EYE INFECTIONS ORF ORNITHOSIS OROPOUCHE PARAGONIMIASIS PARAINFLUENZA VIRUS INFECTION PARVOVIRUS B19 INFECTION PEDICULOSIS PERTUSSIS PHARYNGITIS - BACTERIAL PLAGUE PLESIOMONAS INFECTION PLEURODYNIA PNEUMOCYSTIS - PNEUMONIA POGOSTA DISEASE POLIOMYELITIS POWASSAN PSEUDOCOWPOX PYODERMAS (IMPETIGO, ABSCESS, ETC) PYOMYOSITIS PYTHIOSIS Q-FEVER RABIES RAT BITE FEVER - STREPTOBACILLARY RELAPSING FEVER
RESPIRATORY SYNCYTIAL VIRUS INFECTION RESPIRATORY VIRUSES - MISCELLANEOUS REYE'S SYNDROME RHEUMATIC FEVER RHINOSPORIDIOSIS RICKETTSIA FELIS INFECTION RICKETTSIALPOX RIFT VALLEY FEVER ROCKY MOUNTAIN SPOTTED FEVER ROSS RIVER DISEASE ROTAVIRUS INFECTION RUBELLA SALMONELLOSIS SARCOCYSTOSIS SARS SCABIES SCARLET FEVER SCHISTOSOMIASIS - HAEMATOBIUM SCHISTOSOMIASIS - JAPONICUM SCHISTOSOMIASIS - MANSONI SEPTICEMIA - BACTERIAL SHIGELLOSIS SINDBIS SPOROTRICHOSIS SPOTTED FEVERS - OLD WORLD ST. LOUIS ENCEPHALITIS STAPHYLOCOCCAL FOOD POISONING STAPHYLOCOCCAL SCALDED SKIN SYNDROME STREPTOCOCCUS SUIS INFECTION STRONGYLOIDIASIS SYPHILIS TAENIASIS TETANUS TICK-BORNE ENCEPHALITIS TOXIC SHOCK SYNDROME TOXOCARIASIS TOXOPLASMOSIS TRACHOMA TRICHINOSIS TRICHOSTRONGYLIASIS TRICHURIASIS TROPICAL PHAGEDENIC ULCER TRYPANOSOMIASIS - AFRICAN TRYPANOSOMIASIS - AMERICAN TUBERCULOSIS TULAREMIA TUNGIASIS TYPHOID AND ENTERIC FEVER TYPHUS - ENDEMIC TYPHUS - EPIDEMIC TYPHUS - SCRUB VACCINIA AND COWPOX
Henderson ! 50
VARICELLA VENEZUELAN EQUINE ENCEPHALITIS VENEZUELAN HEMORRHAGIC FEVER VIBRIO PARAHAEMOLYTICUS INFECTION WEST NILE FEVER WESTERN EQUINE ENCEPHALITIS YAWS YELLOW FEVER YERSINIOSIS ZIKA ZYGOMYCOSIS

Henderson ! 51
Appendix B - Basic Gravity Model
_cons -8.300985 .093325 -88.95 0.000 -8.483906 -8.118063 _Iyear_2006 0 (omitted) _Iyear_2005 -.5684358 .0146617 -38.77 0.000 -.5971736 -.5396981 _Iyear_2004 -.4842537 .013841 -34.99 0.000 -.5113827 -.4571247 _Iyear_2003 -.3877798 .0125617 -30.87 0.000 -.4124014 -.3631583 _Iyear_2002 -.3290744 .0118564 -27.76 0.000 -.3523135 -.3058353 _Iyear_2001 -.3339547 .0115556 -28.90 0.000 -.3566043 -.3113051 _Iyear_2000 -.3443034 .0114147 -30.16 0.000 -.3666767 -.3219301 _Iyear_1999 -.3278942 .0111716 -29.35 0.000 -.3497912 -.3059973 _Iyear_1998 -.3671142 .0109074 -33.66 0.000 -.3884933 -.3457352 _Iyear_1997 -.3765367 .0109003 -34.54 0.000 -.3979018 -.3551716 _Iyear_1996 -.3424588 .0108936 -31.44 0.000 -.3638108 -.3211069 _Iyear_1995 -.2887622 .0106528 -27.11 0.000 -.3096422 -.2678821 _Iyear_1994 -.180068 .0102476 -17.57 0.000 -.2001538 -.1599822 _Iyear_1993 -.2281962 .0097241 -23.47 0.000 -.247256 -.2091365 _Iyear_1992 -.3123092 .0094589 -33.02 0.000 -.3308491 -.2937693 _Iyear_1991 -.2343357 .0089302 -26.24 0.000 -.2518394 -.216832 _Iyear_1990 -.2653567 .0089109 -29.78 0.000 -.2828225 -.247891 _Iyear_1989 -.1708185 .0081131 -21.05 0.000 -.1867206 -.1549165 _Iyear_1988 -.2143078 .0079484 -26.96 0.000 -.229887 -.1987286 _Iyear_1987 -.1720398 .0076765 -22.41 0.000 -.1870863 -.1569934 _Iyear_1986 -.1461758 .0072556 -20.15 0.000 -.1603971 -.1319545 _Iyear_1985 -.0999086 .0070351 -14.20 0.000 -.1136976 -.0861195 _Iyear_1984 -.1164961 .006697 -17.40 0.000 -.1296225 -.1033697 _Iyear_1983 -.0762863 .0062046 -12.30 0.000 -.0884475 -.064125 _Iyear_1982 -.0961235 .0059358 -16.19 0.000 -.107758 -.0844889 _Iyear_1981 -.0690493 .005198 -13.28 0.000 -.0792376 -.058861 gsp_rec .3793542 .0313668 12.09 0.000 .3178738 .4408346 eu_to_acp -.4818718 .0352638 -13.66 0.000 -.5509906 -.412753 gsp .2618137 .0345678 7.57 0.000 .1940591 .3295682 acp_to_eu -.3773143 .0414952 -9.09 0.000 -.458647 -.2959817 rta 1.34425 .0334429 40.20 0.000 1.2787 1.4098 gatt_d .0297512 .0145566 2.04 0.041 .0012196 .0582828 gatt_o .0002522 .0147296 0.02 0.986 -.0286186 .0291229 col_cur -.7180254 .4553016 -1.58 0.115 -1.610439 .1743884 col_hist 1.372045 .0791958 17.32 0.000 1.216817 1.527272 col_fr -.1979607 .1167791 -1.70 0.090 -.4268536 .0309321 lgdpcap_o .1844481 .0073818 24.99 0.000 .1699794 .1989168 lgdpcap_d .1105056 .007069 15.63 0.000 .09665 .1243612 lgdp_d .4079044 .0050114 81.40 0.000 .3980819 .4177269 lgdp_o .4527133 .0051326 88.20 0.000 .4426531 .4627734 pop_o .0011125 .0000719 15.48 0.000 .0009716 .0012534 pop_d .000615 .0000815 7.55 0.000 .0004553 .0007746 distw -.0000966 2.08e-06 -46.44 0.000 -.0001007 -.0000925 comlang_off .3255803 .0217696 14.96 0.000 .2829107 .3682498 contig 1.159685 .0609677 19.02 0.000 1.040185 1.279185 comleg .1736884 .0161339 10.77 0.000 .1420652 .2053117 comcur .2506931 .0607213 4.13 0.000 .1316762 .3697099 oceania_d .2342458 .0415997 5.63 0.000 .1527083 .3157832 oceania_o .5592379 .0420577 13.30 0.000 .4768027 .6416732 seasia_d .2553467 .0383918 6.65 0.000 .1800968 .3305966 seasia_o .603461 .0402544 14.99 0.000 .5245604 .6823616 asia_d .0255699 .0353801 0.72 0.470 -.0437768 .0949166 asia_o .2940972 .0335237 8.77 0.000 .2283891 .3598053 eafrica_d -.1073401 .0260836 -4.12 0.000 -.1584653 -.0562148 eafrica_o .0442792 .02613 1.69 0.090 -.0069369 .0954953 wafrica_d -.1037849 .0258916 -4.01 0.000 -.1545337 -.0530361 wafrica_o .0485911 .027118 1.79 0.073 -.0045615 .1017437 mideast_d -.2491465 .02551 -9.77 0.000 -.2991473 -.1991458 mideast_o -.4492739 .0272842 -16.47 0.000 -.5027522 -.3957956 samerica_d -.2177423 .0273133 -7.97 0.000 -.2712777 -.1642069 samerica_o .0882219 .0285584 3.09 0.002 .032246 .1441977 camerica_d .0701555 .0330762 2.12 0.034 .0053246 .1349865 camerica_o .0815671 .0320635 2.54 0.011 .018721 .1444132 log_flo~1mil Coef. Std. Err. t P>|t| [95% Conf. Interval] Robust (Std. Err. adjusted for 27665 clusters in dyadcode)
Root MSE = 1.247 R-squared = 0.6681 Prob > F = 0.0000 F( 62, 27664) = 836.77Linear regression Number of obs = 559727

Henderson ! 52
Appendix C - Gravity Model with Outbreak Variables
_cons -8.168264 .0920086 -88.78 0.000 -8.348606 -7.987923 _Iyear_2006 0 (omitted) _Iyear_2005 -.5920584 .0149191 -39.68 0.000 -.6213006 -.5628163 _Iyear_2004 -.5108659 .0142149 -35.94 0.000 -.5387278 -.483004 _Iyear_2003 -.400375 .0128042 -31.27 0.000 -.4254719 -.3752781 _Iyear_2002 -.3386918 .0121018 -27.99 0.000 -.362412 -.3149717 _Iyear_2001 -.3472127 .0118896 -29.20 0.000 -.370517 -.3239085 _Iyear_2000 -.3525961 .0116499 -30.27 0.000 -.3754305 -.3297618 _Iyear_1999 -.338598 .0114351 -29.61 0.000 -.3610114 -.3161847 _Iyear_1998 -.3832113 .0112706 -34.00 0.000 -.4053022 -.3611204 _Iyear_1997 -.390973 .0112162 -34.86 0.000 -.4129573 -.3689886 _Iyear_1996 -.3534779 .0111761 -31.63 0.000 -.3753837 -.3315721 _Iyear_1995 -.2970338 .0109067 -27.23 0.000 -.3184115 -.275656 _Iyear_1994 -.1829431 .0104616 -17.49 0.000 -.2034483 -.1624379 _Iyear_1993 -.2300282 .0098951 -23.25 0.000 -.2494232 -.2106332 _Iyear_1992 -.3127581 .0096158 -32.53 0.000 -.3316055 -.2939106 _Iyear_1991 -.2308816 .0090591 -25.49 0.000 -.248638 -.2131253 _Iyear_1990 -.2614058 .0090444 -28.90 0.000 -.2791332 -.2436784 _Iyear_1989 -.1682313 .0083176 -20.23 0.000 -.1845342 -.1519284 _Iyear_1988 -.2132538 .0082133 -25.96 0.000 -.2293524 -.1971553 _Iyear_1987 -.1687928 .0078107 -21.61 0.000 -.1841022 -.1534834 _Iyear_1986 -.1433775 .0074417 -19.27 0.000 -.1579636 -.1287913 _Iyear_1985 -.0992775 .0071536 -13.88 0.000 -.113299 -.085256 _Iyear_1984 -.1161913 .0070127 -16.57 0.000 -.1299366 -.1024461 _Iyear_1983 -.0759063 .0063476 -11.96 0.000 -.0883479 -.0634646 _Iyear_1982 -.0989326 .0063329 -15.62 0.000 -.1113453 -.0865199 _Iyear_1981 -.066844 .0053217 -12.56 0.000 -.0772748 -.0564133 gsp_rec .3791692 .030997 12.23 0.000 .3184134 .4399249 eu_to_acp -.4688177 .0349781 -13.40 0.000 -.5373766 -.4002589 gsp .2644243 .0341917 7.73 0.000 .1974069 .3314417 acp_to_eu -.3632929 .0412748 -8.80 0.000 -.4441936 -.2823922 rta 1.319556 .0330963 39.87 0.000 1.254685 1.384426 gatt_d .0311919 .0144455 2.16 0.031 .002878 .0595059 gatt_o -.0018364 .0146153 -0.13 0.900 -.0304832 .0268104 col_cur -.7209592 .455033 -1.58 0.113 -1.612847 .1709281 col_hist 1.386596 .0779239 17.79 0.000 1.233861 1.539331 col_fr -.1976665 .1151245 -1.72 0.086 -.4233162 .0279832 lgdpcap_o .1888878 .0073386 25.74 0.000 .1745038 .2032719 lgdpcap_d .1124693 .0070378 15.98 0.000 .0986749 .1262638 lgdp_d .4030873 .0050593 79.67 0.000 .3931708 .4130037 lgdp_o .4414275 .0051904 85.05 0.000 .4312541 .4516009 pop_o .0011262 .0000707 15.92 0.000 .0009876 .0012648 pop_d .0006306 .0000802 7.86 0.000 .0004733 .0007879 distw -.0000965 2.06e-06 -46.76 0.000 -.0001005 -.0000924 comlang_off .320541 .0215875 14.85 0.000 .2782283 .3628537 contig 1.164813 .0607845 19.16 0.000 1.045673 1.283954 comleg .1740705 .0160482 10.85 0.000 .1426153 .2055257 comcur .2348854 .0603546 3.89 0.000 .1165875 .3531834 oceania_d .2358288 .0408452 5.77 0.000 .1557701 .3158875 oceania_o .5578235 .0414667 13.45 0.000 .4765468 .6391002 seasia_d .2564022 .0381256 6.73 0.000 .1816741 .3311304 seasia_o .6081632 .039888 15.25 0.000 .5299807 .6863456 asia_d .0246734 .0351325 0.70 0.483 -.044188 .0935348 asia_o .2957077 .0332802 8.89 0.000 .2304769 .3609386 eafrica_d -.108009 .0258229 -4.18 0.000 -.1586232 -.0573949 eafrica_o .0456445 .0258816 1.76 0.078 -.0050848 .0963738 wafrica_d -.1065995 .0256833 -4.15 0.000 -.15694 -.056259 wafrica_o .0470561 .0269253 1.75 0.081 -.0057188 .099831 mideast_d -.2428067 .0255704 -9.50 0.000 -.292926 -.1926873 mideast_o -.4303014 .0273065 -15.76 0.000 -.4838235 -.3767793 samerica_d -.2194056 .0270887 -8.10 0.000 -.2725008 -.1663104 samerica_o .0918419 .0283813 3.24 0.001 .0362132 .1474706 camerica_d .0705817 .0329928 2.14 0.032 .0059143 .1352491 camerica_o .0887072 .0318617 2.78 0.005 .0262568 .1511577 varout_b .3887311 .0126919 30.63 0.000 .3638544 .4136078 varout_d -.1469767 .0090515 -16.24 0.000 -.164718 -.1292353 varout_o -.0887332 .0088131 -10.07 0.000 -.1060074 -.071459 log_flo~1mil Coef. Std. Err. t P>|t| [95% Conf. Interval] Robust (Std. Err. adjusted for 27665 clusters in dyadcode)
Root MSE = 1.2426 R-squared = 0.6705 Prob > F = 0.0000 F( 65, 27664) = 836.49Linear regression Number of obs = 559727

Henderson ! 53
Appendix D - Tabulation of varout_b, varout_o, and varout_d
Total 617,016 100.00 1 287,127 46.53 100.00 0 329,889 53.47 53.47 dummy Freq. Percent Cum. outbreak
. tab varout_d
Total 617,016 100.00 1 287,443 46.59 100.00 0 329,573 53.41 53.41 dummy Freq. Percent Cum. outbreak
. tab varout_o
Total 617,016 100.00 1 134,217 21.75 100.00 0 482,799 78.25 78.25 both Freq. Percent Cum.outbreak in dummy:
. tab varout_b

Henderson ! 54
Appendix E - Outbreak Regression without Both Variable
R-Squared: 0.642
Variables Coefficients Robust Standard Error
Outbreak in exporting country
0.127*** 0.013
Outbreak in importing country
0.009 0.013

Henderson ! 55
Appendix F - Poverty Regressions without Both Variable
GDP per capita over $20,000: R-Squared: 0.670
GDP per capita below $20,000: R-Squared: 0.668
GDP per capita below $10,000: R-Squared: 0.668
GDP per capita below $5,000: R-Squared: 0.668
Variables Coefficients Robust Standard Error
Over 20,000: exporter 0.434*** 0.023
Over 20,000: importer 0.227*** 0.024
Variables Coefficients Robust Standard Error
Under 20,000: exporter -0.016* 0.008
Under 20,000: importer -0.019* 0.008
Variables Coefficients Robust Standard Error
Under 10,000: exporter -0.042*** 0.008
Under 10,000: importer -0.058*** 0.008
Variables Coefficients Robust Standard Error
Under 5,000: exporter -0.067*** 0.008
Under 5,000: importer -0.080*** 0.008

Henderson ! 56
GDP per capita below $2,500: R-Squared: 0.668
GDP per capita below $1,500: R-Squared: 0.668
GDP per capita below $670: R-Squared: 0.669
GDP per capita below $456.25: R-Squared: 0.669
Variables Coefficients Robust Standard Error
Under 2,500: exporter -0.080*** 0.008
Under 2,500: importer -0.079*** 0.007
Variables Coefficients Robust Standard Error
Under 1,500: exporter -0.104*** 0.009
Under 1,500: importer -0.088*** 0.008
Variables Coefficients Robust Standard Error
Moderate poverty: exporter -0.167*** 0.012
Moderate poverty: importer -0.125*** 0.011
Variables Coefficients Robust Standard Error
Extreme poverty: exporter -0.175*** 0.014
Extreme poverty: importer -0.121*** 0.014