discussion paper series - columbia university
TRANSCRIPT
DISCUSSION PAPER SERIES
ABCD
www.cepr.org
Available online at: www.cepr.org/pubs/dps/DP4989.asp www.ssrn.com/xxx/xxx/xxx
No. 4989
COMMERCIAL TELEVISION AND VOTER INFORMATION
Andrea Prat and David Strömberg
PUBLIC POLICY
ISSN 0265-8003
COMMERCIAL TELEVISION AND VOTER INFORMATION
Andrea Prat, London School of Economics (LSE) and CEPR David Strömberg, IIES, Stockholm University and CEPR
Discussion Paper No. 4989
April 2005
Centre for Economic Policy Research 90–98 Goswell Rd, London EC1V 7RR, UK
Tel: (44 20) 7878 2900, Fax: (44 20) 7878 2999 Email: [email protected], Website: www.cepr.org
This Discussion Paper is issued under the auspices of the Centre’s research programme in PUBLIC POLICY. Any opinions expressed here are those of the author(s) and not those of the Centre for Economic Policy Research. Research disseminated by CEPR may include views on policy, but the Centre itself takes no institutional policy positions.
The Centre for Economic Policy Research was established in 1983 as a private educational charity, to promote independent analysis and public discussion of open economies and the relations among them. It is pluralist and non-partisan, bringing economic research to bear on the analysis of medium- and long-run policy questions. Institutional (core) finance for the Centre has been provided through major grants from the Economic and Social Research Council, under which an ESRC Resource Centre operates within CEPR; the Esmée Fairbairn Charitable Trust; and the Bank of England. These organizations do not give prior review to the Centre’s publications, nor do they necessarily endorse the views expressed therein.
These Discussion Papers often represent preliminary or incomplete work, circulated to encourage discussion and comment. Citation and use of such a paper should take account of its provisional character.
Copyright: Andrea Prat and David Strömberg
CEPR Discussion Paper No. 4989
April 2005
ABSTRACT
Commercial Television and Voter Information*
What is the effect of liberalizing a country’s broadcasting system on the level of information of its citizens? To analyse this question, we first construct a model of state monopoly broadcasting where the government selects the amount of television news coverage of different public policy outcomes, and then sets public policy and political rents. Voters vote retrospectively given the news provided. In equilibrium, the incumbent provides some news coverage, and more so to groups for which reducing policy uncertainty is more important. We then introduce a profit-maximizing commercial channel. It provides more news coverage to groups of voters valuable to advertisers or underprovided by the state monopoly.
We test our predictions on a panel of individuals interviewed in the elections before and after the entry of commercial TV in Sweden. We find that people who start watching commercial TV news increase their level of political knowledge more than those who do not. They also increase their political participation more. The positive informational effects are particularly valuable since commercial TV news attracts ex ante uniformed voters.
JEL Classification: L33 Keywords: commercial television, mass media, public service broadcasting and voter information
Andrea Prat STICERD LSE, London School of Economics Houghton Street London WC2 2AE Tel: (44 20) 7955 6992 Fax: (44 20) 7955 6951 Email: [email protected] For further Discussion Papers by this author see: www.cepr.org/pubs/new-dps/dplist.asp?authorid=138721
David Strömberg Institute for International Economic Studies, IIES Stockholm University S-106 91 Stockholm SWEDEN Tel: (46 8) 16 43 76 Fax: (46 8) 16 14 43 Email: [email protected] For further Discussion Papers by this author see: www.cepr.org/pubs/new-dps/dplist.asp?authorid=131482

*We thank Tim Besley, Jordi Blanes, Peter Davis, Torsten Persson, Justin Wolfers, and audiences at Bristol (Political Economy Workshop), the LSE, Penn (IGIER-PIER Conference on Political Economics), Stanford (Conference on the Media and Economic Performance), and Toulouse (Conference on the Regulation of Media Markets) for useful comments.
Submitted 11 March 2005

Commercial Television and Voter Information�
Andrea PratLondon School of Economics
David StrömbergStockholm University
March 11, 2005
Abstract
What is the e¤ect of liberalizing a country�s broadcasting systemon the level of information of its citizens? To analyze this question,we �rst construct a model of state monopoly broadcasting where thegovernment selects the amount of television news coverage of di¤erentpublic policy outcomes, and then sets public policy and political rents.Voters vote retrospectively given the news provided. In equilibrium,the incumbent provides some news coverage, and more so to groups forwhich reducing policy uncertainty is more important. We then intro-duce a pro�t-maximizing commercial channel. It provides more newscoverage to groups of voters valuable to advertisers or underprovidedby the state monopoly.We test our predictions on a panel of individuals interviewed in the
elections before and after the entry of commercial TV in Sweden. We�nd that people who start watching commercial TV news increase theirlevel of political knowledge more than those who do not. They alsoincrease their political participation more. The positive informationale¤ects are particularly valuable since commercial TV news attracts exante uniformed voters.
In most countries the state is the dominant provider of television pro-grams. The most notable exception is the United States in which the �velargest channels are all privately owned (Djankov et al. [7]). While statetelevision plays an important, it is not as important as it was in the past.In 1980 all European countries had state TV monopolies, except for Britainand Italy (with dual systems) and Luxembourg (all commercial). There wereseven times as many public channels as private. By 1997 the balance wasreversed: only three countries had purely public national channels (Austria,Ireland, and Switzerland), and commercial channels outnumbered public.
�We thank Tim Besley, Jordi Blanes, Peter Davis, Torsten Persson, Justin Wolfers,and audiences at Bristol (Political Economy Workshop), the LSE, Penn (IGIER-PIERConference on Political Economics), Stanford (Conference on the Media and EconomicPerformance), and Toulouse (Conference on the Regulation of Media Markets) for usefulcomments.
1

The change in media structure may have important implications forpublic policy. Strömberg (1999, 2004) and Besley and Burgess [4] presentevidence that citizens with better access to mass media receive more fa-vorable public policies. Information is also necessary for voters to punishcorrupt or �shirking� politicians. Djankov et al.[7] analyze cross countryevidence which suggests that ownership matters for mass media conduct.Besley and Prat [5] construct a model of media ownership and political cap-ture. Gentzkow et al. [9] provide evidence that the transformation that theUS newspaper industry underwent between 1870 and 1920 was one of thecauses of the decline of political corruption in that period. Mullainathanand Shleifer [13] and Gentzkow and Shapiro [10] study how the structureof the media industry determines the bias in information provided by themedia to citizens.
The increased commercialization in broadcasting around the world hascaused a heated policy debate. Opponents have voiced fears that entertain-ment programs marginalize informational content, leading to an impover-ished public sphere. There are also fears that commercialization reducesdiversity in programming. At particular risk would be the interest of seg-ments of the poorly placed segments of the population: the poor, the lessinformed, children, elderly, etc. (Blumler, 1992).
In particular, there seems to be a consensus among political scientistsand media scholars that viewers receive more political information frompublic service broadcasters than from their commercial counteparts. This isbased on cross-sectional analyses, such as Holtz-Bacha and Norris [12], that�nd that people who watch relatively more commmercial television are lessinformed about public a¤airs.1
However, to our knowledge, there has been no attempt to undertakemore systematic research on this key topic in media policy. The goal ofthe present paper is to begin to �ll this gap in two ways. We �rst builda theoretical model of state TV, and subsequent commercial entry. Thiswill provide predictions regarding the programming choices of state andcommercial TV, the consequent channel selection of individuals, and theimpact on individuals� knowledge. We then test the predictions using aSwedish survey that interviewed the same respondents in two consecutiveelections, before and after the entry of commercial TV. This way, we canidentify the ex ante characteristics of those who select into private and publicTV, and hopefully isolate the e¤ect of commercial TV.
We begin with a brief description of the conceptual set-up we use. Theexisting theoretical comparisons between state broadcasting and commercial
1 In this debate, American commercial TV is seen as a discouraging example. Thisis not completely ungrounded, the conventional wisdom (among political scientists andmedia scolars) is that citizens learn nothing about politics from television in the US.This is backed up by consistent survey evidence that reported TV news watching is notcorrelated with knowledge (see for example Delli Carpini and Keeter, 1996).
2
broadcasting are based on the assumption that the former is managed bya benevolent planner.2 But in today�s democracies state broadcasting isto some degree under the control of elected governments. Moreover, massmedia play an important role in ensuring government accountability. Wethus face an interplay between elected politicians, an electorate that derivesinformation from mass media, and a mass media industry that is in partgovernment controlled. The present paper is a �rst step towards modelingthis complex interplay with political economy tools.
In this paper, we shall assume that the state broadcaster had full jour-nalistic independence. The government is unable to control speci�c newscontent. Instead, we allow the government to in�uence the amount of re-sources that are available to the state broadcaster and whether the broad-caster should tailor its news coverage to speci�c socio-economic groups (e.g.women, rural voters, senior citizens). As we argue in the text, we feelthat this is an acceptable representation of the structure of the prototypicalpublic-service broadcaster, the BBC.
We �rst see what happens when the broadcasting system is a statemonopoly. We use a retrospective voting model, in which voters have in-complete information on the politicians�ability. The incumbent politicianallocates resources to the broadcaster and decides its news coverage in orderto maximize his chances of re-election. Voters who know the incumbent�stype are able to forecast his future policies and can make better personaldecisions. Hence, voters have a direct value for information. However, infor-mation is also bene�cial because it allows voters to replace bad politicians.In equilibrium, the incumbent trades o¤ the electoral bene�t of providingmore information (informed voters are more likely to re-elect him becauseof the personal bene�ts) with the discipline cost (public scrutiny makes itharder for the politician to appropriate public resources). If groups areheterogenous in terms of personal bene�ts, the incumbent provides morecoverage to groups with a higher stake.
We then examine what happens when the state monopoly is broken bythe entry of a commercial rival. the new broadcaster maximizes advertisingrevenues. Certain groups (e.g. the rich and the young) have greater percapita advertising potential. Also the new entrant sets a coverage level forevery socio-economic group.
We also construct a model of viewer�s choice (inspired by discrete con-sumer choice). Viewers choose to watch commercial television based on their
2Coase [6] argued that broadcasting is an inherently non-excludable good and it islikely to be underprovided by the private sector. A factor that Coase did not predictwas the stunning growth of television advertising revenues, which potentially underminethe underprovision critique. Anderson and Coate [1] provide a comprehensive analysis ofpossible market failures in advertising-�nanced commercial broadcasting, and they showthat there may be both underprovision and overprovision. They also discuss the e¤ect ofintroducing technology that makes broadcasting excludable (pay television).
3
personal characteristics and the coverage that the new channel o¤ers to theirsocio-economic group. The arrival of commercial news may also reduce in-formation levels by deviating attention from state news. While one cannotsay whether the overall information level goes up or down, we show thatmore information is provided to: (1) groups with high advertising potential;(2) groups who had less information under state monopoly.
Predictions based on (1) and (2) are then tested using unique panel sur-vey data from the Swedish Election Studies. This data contains interviewswith over 1000 individuals in the two general elections immediately priorto (1988) and after (1991) the entry of commercial TV in Sweden.3 Therespondents answer a series of questions testing their objective knowledgeof Swedish politics. We also use another dataset to infer the relative valueof di¤erent socio-economic groups to advertisers.
We �nd that commercial TV news attracted viewers previously under-supplied with information and contributed both to increased voter informa-tion and political participation. Those who started watching commercialnews increased their level of political knowledge and participation signi�-cantly more than those who did not, and this e¤ect is largest among theyoung and the previously not well informed.
It is interesting to note that our data con�rms the cross-sectional re-sults found by Holtz-Bacha and Norris [12, p. 15]. Commercial televisionis watched by people who are on average less informed. However, our panelevidence sheds a completely di¤erent light on such cross-sectional results.The pessimistic conclusion by that the commercialization of broadcastingworsens the average level of information and increases the information di-vide is refuted, at least for Sweden. The worries that certain groups wouldlose from commercial entry (the poor, the less informed, children, and theelderly) seem largely unwarranted. First, we �nd that the poor did not lose,or rather that they lose under both systems and therefore are not mucha¤ected by the change. They are neither a target audience of commercialTV, nor of state TV. Second, we �nd that the less informed and the youngare the big winners of the shift to commercial TV. Finally, the elderly maylose from the liberalization, being a key target audience for state, but notfor commercial, TV.
The next two sections provide a theoretical analysis. Section 1 examinesthe political game for a given coverage vector. We construct and analyze atwo-period retrospective voting model. We consider both sincere and piv-otal voting. Section 2 endogenizes news provision. The incumbent choosesthe coverage of state television. Commercial broadcasters maximize pro�t.We �rst consider a scenario in which only the state channel is active. Then,
3Before 1990 Sweden had a state monopoly in broadcasting. The state network (SVT)was consciously modelled after the BBC. In 1990, the government granted a license to acommercial channel (TV4).
4

we analyze what happens when commercial news and commercial entertain-ment are introduced. Section 3 considers evidence from Sweden. Section 4concludes.
1 A Political Model
We use a relatively standard retrospective voting model (Persson and Tabellini[14, Chapter 4]). There are n socio-economic groups of equal size 1
n : i =1; :::n. Voters� payo¤s are additive over the two periods and there is nodiscounting. In period 1, voter j in group i receives utility
gi + �j + �:
where:
� gi is the level of public good provision targeted to group i (to bediscussed shortly);
� �j is an idiosyncratic preference shock about the incumbent that af-fects the utility that voter j derives from the incumbent. It is inde-pendent across voters (and across voter groups) and it is uniformlydistributed on
��12B;
12B�where B > 2;
� � is a systematic preference shock about the incumbent that a¤ects allvoters in the same way. It is uniformly distributed on
��12 ;12
�.
Public consumption for voters in group i is given by
gi = �i + ei
where �i is the innate ability (type) of the incumbent to provide worthypublic goods for group i. The �i�s are mutually independent and they aredrawn from a uniform distribution on
��12�;
12��, where � � 1
2 . The variableei is the amount of government resources the incumbent spends on group i.4
In period 2, voters�payo¤s depend on whether the voters have chosenthe incumbent or the challenger. Under the incumbent, the payo¤ of voterj of group i is
gi2 + �j + � + TiI (aj = gi2) :
The last term captures the value of news about the incumbent�s policies.Voters would like to know future in order to adapt to these. News aboutpresent policies will help the voter deduce the type of the politician andguess his future policies. Formally, knowing the incumbent�s type will enable
4The assumption that �i is independently distributed is not necessary. One could re-dothe present analysis assuming that �i is correlated. Indeed, a previous version of the modelassumed that �i was the same across all groups.
5

individual j to take an action aj which increases his or her utility by Ti if aj =gi2: Here Ti is a positive parameter which is smaller than 1
4 ; and I (aj = gi2)is an indicator function which takes the value 1 if aj = gi2 and zero otherwise.Under the challenger, the payo¤ of voter j is gci2 + �j + � + TiI (aj = g
ci2) :
The incumbent has a �xed budget B in each period. This can be spenton the public goods, to increase ei at the cost 1
21ne2i .The incumbent keeps
the residual funds, r = B � 121n
Pe2i . The incumbent�s payo¤ is�
B � 121n
Pe2i if he is not re-elected
2B � 121n
Pe2i � 1
21n
Pe2i2 if he is re-elected
:
It is a dominant strategy for the incumbent to keep all resources in thesecond period. In every equilibrium e2 = 0 and gi2 = �i. The challengerreceives payo¤B � 1
21n
P(eci2)
2 if he is elected and zero otherwise. Like theincumbent, also the challenger always exerts minimal e¤ort, and gc2 = �
ci .
Timing is:
Period 1 �Nature selects f�igi=1;:::;n, which remains unknown.� Incumbent selects e¤ort vector e. g is realized
�A share 1�si of voters in group i are uninformed and they observeonly �j + �. A share si of voters are informed and they observegi and �j + �.
�Voters select the action a.
Period 2 �Voters vote for the incumbent or the challenger.
� If the incumbent won, gi2 is realized. If the challenger wins, gci2is realized.
As there is a continuum of voters, this electoral game has multiple equi-libria. The literature usually focuses on two classes of equilibria: sincerevoting (in which each voter picks the candidate who provides the higherexpected utility) and pivotal voting (each voter picks the candidate whoprovides the higher expected utility, conditional on that voter being pivotalin the election). It is important to emphasize that the equilibria we �ndare all perfect Bayesian equilibria. Whether one prefers sincere voting orpivotal voting is therefore mostly a matter of one�s views on which one ismore plausible.
While we o¤er a full characterization of sincere voting, we can onlyprovide incomplete results in pivotal voting. However, on the key dimensionof information aggregation the �ndings are not dissimilar in the two cases.
1.1 Sincere Voting
We prove:
6

Proposition 1 In a pure-strategy sincere equilibrium, the incumbent selectse¤ort
e�i = Bsi;
for all i = 1; 2; :::; n. An informed voter j has belief �i = gi � e�i and shevotes for the incumbent if and only if
�i + �j + � � �Ti;
An uninformed voter j re-elects the incumbent if and only if
�j + � � 0:
The incumbent is re-elected with probability
P (e�) =1
2+
Pi siTin
:
Proof. Assume there exists a pure-strategy sincere equilibrium. Voters votefor the politician who provides higher second period expected utility. Anuninformed voter prefers the incumbent if
E�gi2 + �j + �
�� E [gci2] ;
which implies�j + � � 0
as �i and �ci have the same distribution (g2 = �i and gc2 = �
ci ).
Consider now an informed voter in group i who believes that the in-cumbent�s i-type is �i. The voter will select the action aj = �i: This willgive the bene�t Ti if the incumbent wins and is of type b�i. In a pure-strategy equilibrium, the voters� belief is correct on the equilibrium pathand the informed voter receives Ti with certainty if the incumbent is re-
elected (EhI��i = �i
�i= 1). Any other action gives zero expected bene�ts
since the distribution of �i is continuous. The informed voter prefers theincumbent if
�i + �j + � + Ti � E [gc2] :
As E [gc2] = 0, the probability that an informed voter in i votes for theincumbent is
Pr��j � �� � �i � Ti
�=1
2+1
B
�� + �i + Ti
�;
and the probability that an uninformed voter chooses the incumbent is
Pr��j � �
�=1
2+1
B�:
7
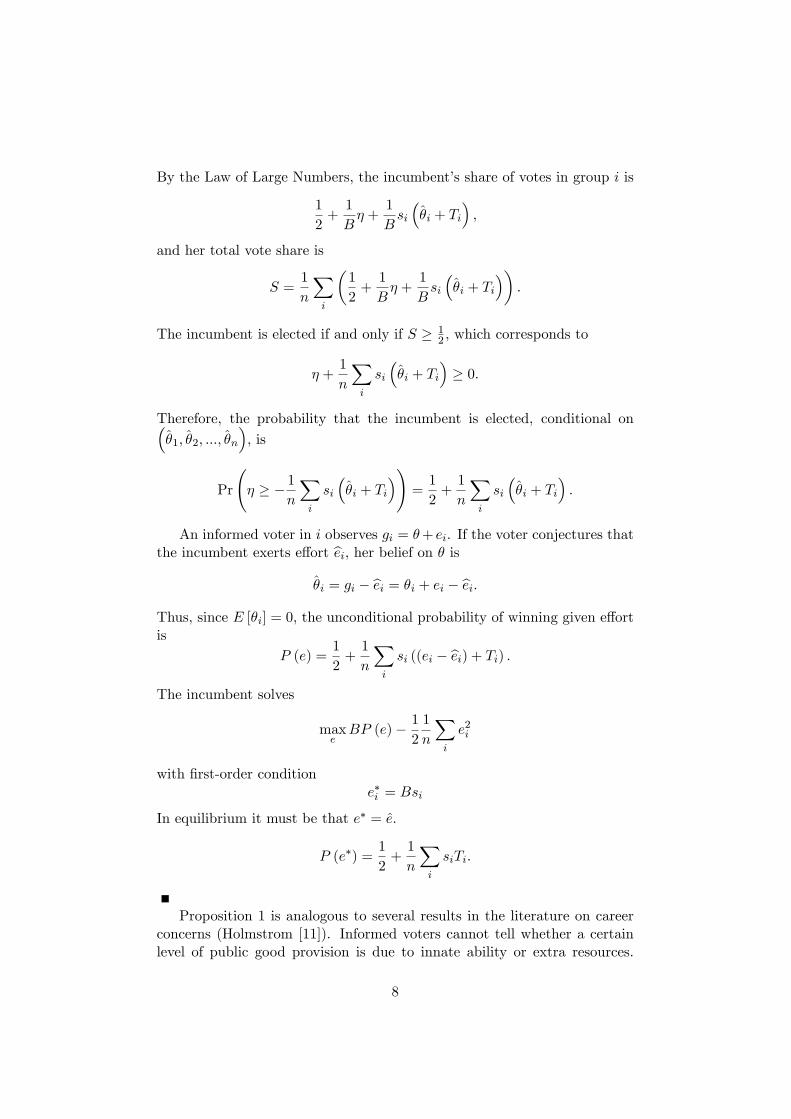
By the Law of Large Numbers, the incumbent�s share of votes in group i is
1
2+1
B� +
1
Bsi
��i + Ti
�;
and her total vote share is
S =1
n
Xi
�1
2+1
B� +
1
Bsi
��i + Ti
��:
The incumbent is elected if and only if S � 12 , which corresponds to
� +1
n
Xi
si
��i + Ti
�� 0:
Therefore, the probability that the incumbent is elected, conditional on��1; �2; :::; �n
�, is
Pr
� � � 1
n
Xi
si
��i + Ti
�!=1
2+1
n
Xi
si
��i + Ti
�:
An informed voter in i observes gi = �+ ei. If the voter conjectures thatthe incumbent exerts e¤ort bei, her belief on � is
�i = gi � bei = �i + ei � bei:Thus, since E [�i] = 0; the unconditional probability of winning given e¤ortis
P (e) =1
2+1
n
Xi
si ((ei � bei) + Ti) :The incumbent solves
maxeBP (e)� 1
2
1
n
Xi
e2i
with �rst-order conditione�i = Bsi
In equilibrium it must be that e� = e.
P (e�) =1
2+1
n
Xi
siTi:
Proposition 1 is analogous to several results in the literature on careerconcerns (Holmstrom [11]). Informed voters cannot tell whether a certainlevel of public good provision is due to innate ability or extra resources.
8
However, in equilibrium they know the level of extra resources that theincumbent chooses (e�i = Bsi). The incumbent sets this level by equatinghis marginal bene�t of �fooling�informed voters into thinking that he is ofhigher quality (Bsin ) and the marginal cost of devoting resources to publicgoods instead of private rent ( ddei
121ne2i =
1nei). As in other career concerns
model, the more informed voters are, the more e¤ort the incumbent exerts.If voters of group i have a higher si, the incumbent will provide a higher e�i .
If Ti were zero in every group, the incumbent would be re-elected halfof the time. However, if some Ti�s are positive, there is a certain degreeof incumbency advantage. Informed voters receive private bene�ts fromknowing the type of the incumbent and are more likely to vote for her.The extent of the incumbency advantage depends on the share of informedvoters. As we shall see in the next section, this creates an incentive for theincumbent to provide voters with some information.
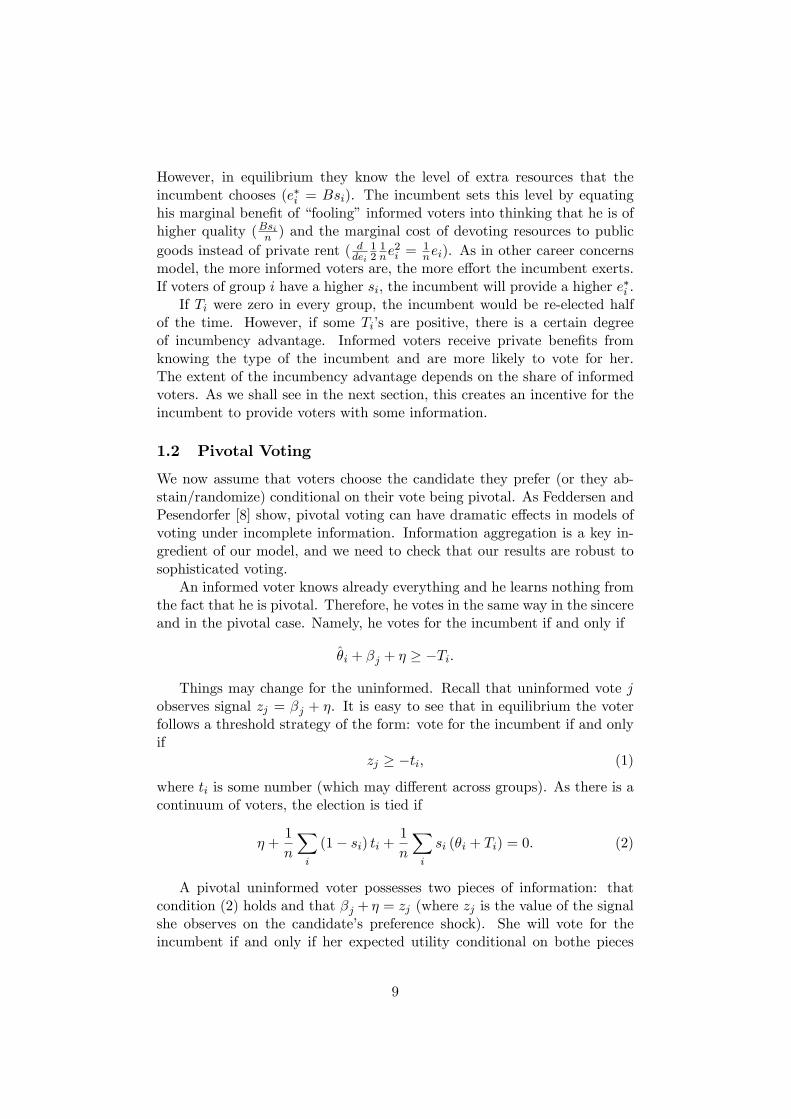
1.2 Pivotal Voting
We now assume that voters choose the candidate they prefer (or they ab-stain/randomize) conditional on their vote being pivotal. As Feddersen andPesendorfer [8] show, pivotal voting can have dramatic e¤ects in models ofvoting under incomplete information. Information aggregation is a key in-gredient of our model, and we need to check that our results are robust tosophisticated voting.
An informed voter knows already everything and he learns nothing fromthe fact that he is pivotal. Therefore, he votes in the same way in the sincereand in the pivotal case. Namely, he votes for the incumbent if and only if
�i + �j + � � �Ti:
Things may change for the uninformed. Recall that uninformed vote jobserves signal zj = �j + �. It is easy to see that in equilibrium the voterfollows a threshold strategy of the form: vote for the incumbent if and onlyif
zj � �ti; (1)
where ti is some number (which may di¤erent across groups). As there is acontinuum of voters, the election is tied if
� +1
n
Xi
(1� si) ti +1
n
Xi
si (�i + Ti) = 0: (2)
A pivotal uninformed voter possesses two pieces of information: thatcondition (2) holds and that �j + � = zj (where zj is the value of the signalshe observes on the candidate�s preference shock). She will vote for theincumbent if and only if her expected utility conditional on bothe pieces
9
of information is greater for the incumbent than for the challenger. Thisdetermines the equilibrium threshold ti.
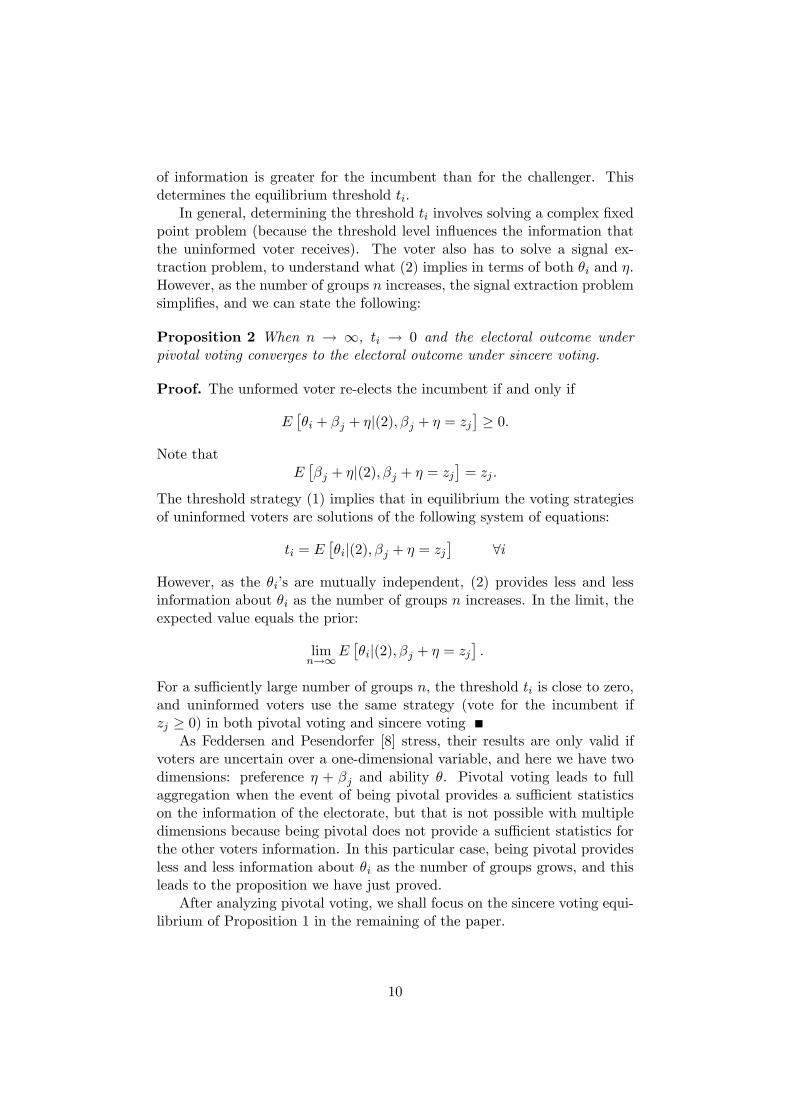
In general, determining the threshold ti involves solving a complex �xedpoint problem (because the threshold level in�uences the information thatthe uninformed voter receives). The voter also has to solve a signal ex-traction problem, to understand what (2) implies in terms of both �i and �.However, as the number of groups n increases, the signal extraction problemsimpli�es, and we can state the following:
Proposition 2 When n ! 1, ti ! 0 and the electoral outcome underpivotal voting converges to the electoral outcome under sincere voting.
Proof. The unformed voter re-elects the incumbent if and only if
E��i + �j + �j(2); �j + � = zj
�� 0:
Note thatE��j + �j(2); �j + � = zj
�= zj :
The threshold strategy (1) implies that in equilibrium the voting strategiesof uninformed voters are solutions of the following system of equations:
ti = E��ij(2); �j + � = zj
�8i
However, as the �i�s are mutually independent, (2) provides less and lessinformation about �i as the number of groups n increases. In the limit, theexpected value equals the prior:
limn!1
E��ij(2); �j + � = zj
�:
For a su¢ ciently large number of groups n, the threshold ti is close to zero,and uninformed voters use the same strategy (vote for the incumbent ifzj � 0) in both pivotal voting and sincere voting
As Feddersen and Pesendorfer [8] stress, their results are only valid ifvoters are uncertain over a one-dimensional variable, and here we have twodimensions: preference � + �j and ability �. Pivotal voting leads to fullaggregation when the event of being pivotal provides a su¢ cient statisticson the information of the electorate, but that is not possible with multipledimensions because being pivotal does not provide a su¢ cient statistics forthe other voters information. In this particular case, being pivotal providesless and less information about �i as the number of groups grows, and thisleads to the proposition we have just proved.
After analyzing pivotal voting, we shall focus on the sincere voting equi-librium of Proposition 1 in the remaining of the paper.
10
2 Endogenous Information Provision
We now endogenize the vector of voter information. We �rst study thebehavior of a state monopolist and then we see what happens when themonopoly is broken by the entry of a pro�t-driven competitor.
2.1 The BBC Model
To understand the relationship between government and government-ownedbroadcasting, it is instructive to examine the governance structure of theBritish Broadcasting Corporation (BBC). Being the �rst state-owned broad-caster and one of the most respected, the BBC model has represented ablueprint for state television across the world. The BBC is overseen by aBoard of Governors who: (1) Sets key objectives; (2) appoints the DirectorGeneral and the members of the Executive Committee; (3) Approves strat-egy and monitors performance. The twelve BBC Governors are formallyappointed by the Queen but they are in practice chosen by the government.The BBC is mostly �nanced through a television licence fee, which is paidby households. The fee level is set by the government.5
On the one hand, it is widely accepted that the BBC enjoys a highlevel of journalistic independence. It is often critical of government policy,sometimes in a harsh adversarial fashion �witness its recent reporting onevidence of weapons of mass destruction in Iraq. On the other hand, thereis no doubt that the government, through the Board of Governors, hassome control on what the BBC does. By setting the key objectives (andappointing people who agree with them), the Board in�uences the focus ofBBC programming. A typical key objective is to increase the audience sharein certain segments of the population. For instance, in 2001/2 the boardasked the BBC to increase coverage for the young and for ethnic minorities.To comply with this key objective, the BBC has plans to launch a newchannel aimed at a young audience (BBC3), a digital services targeting theblack community and a digital service targeting the Asian community (BBC[2, p. 13]).
At the risk of oversimpli�cation, we will de�ne the BBC model of statetelevision as one in which the government has some ex ante control on re-source allocation but no ex post control on news production. The gov-ernment has a say on total budget and on how di¤erent segments of thepopulation should be covered. But once the key objectives are in place,there is full journalistic freedom. Our stylized BBC model is clearly not theonly possible view of state broadcasting. One could assume that the gov-ernment has ex post control as well: it is able to suppress news after eventsoccur. This more pessimistic take on the media is explored in Besley and
5 Information about the governance of the BBC is available on:http://www.bbc.co.uk/info/running/.
11

Prat [5]. Here, we wish to analyze what is perhaps the best-case scenario ofgovernment-controlled television.6
2.2 State Monopoly
We begin by assuming that there is only state broadcasting. Everybodywatches state news. News is �nanced as part of the budget. The cost ofinforming a share si in group i is 1
21npss
2i . As before, the budget is of size
B, and the politician gets to keep the residual funds
r = B � 12
1
n
Xe2i �
1
2
1
n
Xpss
2i :
The timing is now the following:
Period 1 �The incumbent selects vector s, which everyone observes.
�Nature selects f�igi=1;:::;n, which remains unknown.� Incumbent selects e¤ort vector e. g is realized
�A share 1�si of voters in group i are uninformed and they observeonly �j + �. A share si of voters are informed and they observegi and �j + �.
�Voters select the action a.
Period 2 �Voters vote for the incumbent or the challenger.
� If the incumbent won, gi2 is realized. If the challenger wins, gci2is realized.
We assume that in period 2 there is no information. It is clear that noperiod-2 incumbent would spend money on providing information.
The subgame beginning with the incumbent choosing �rst-period e¤ort isidentical to the game analyzed in the previous section. From Proposition 1,we know that an incumbent who chooses vector s is elected with probability
P =1
2+1
n
Xi
siTi:
In the �rst-period, the incumbent maximizes
maxe;sPB + r (3)
From the �rst-order condition, the following is immediate:
6Obviously, there could exist a state-owned television over which the government hasno control. However, it is di¢ cult to imagine who the management of such an organizationwould be accountable to. Would voters elect them directly? Would they be appointed byco-optation?
12

Proposition 3 A monopoly state television provides the level of coverage
si =B
ps +B2Ti:
The above formula shows how the incumbent weighs the pros and consof news. On the bene�t side, increased publicity makes voters better ac-quainted with the politician and this reduced uncertainty about the politi-cians type creates an electoral advantage (an incumbency advantage). Thise¤ect is larger for groups for which reducing policy uncertainty is very im-portant (high Ti). On the cost side, more news makes it more electoralycostly for the incumbent to extract rents (B2), and there is a direct cost ofproducing news ps.
2.3 Introducing Commercial Television
We now study what happens when the state monopoly is broken by the entryof commercial broadcasting. For simplicity, we assume that the coveragechosen by the state monopoly is not a¤ected. This describes a situation inwhich: (i) the state broadcaster did not predict the entry of a commercialcompetitor; (ii) coverage cannot be modi�ed, at least is the short-mediumterm. While these assumptions have no general validity, we feel that theyare a reasonable approximation to what happened in Sweden in the periodunder consideration.7
We thus hold constant the si�s that we found above, and we consider thechoice of viewers and of the commercial entrant. If viewer j in group i keepswatching state news only, he still receives expected utility
usij = siP Ti:
where P is the probability that the incumbent is re-elected in equilibrium.If the voter also watches commercial news, the probability that he becomesinformed about Ti is
si + (1� si) i � ksi iwhere (1� si) i represents the probability that he becomes informed bycommercial television (if he had not become informed by state news). Byintroducing the factor k 2 (0; 1) we allow for the possibility that watchingtwo news broadcasts decreases the viewer�s attention to each news. Thetotal expected utility of viewer j in group i, if he also watches commercialnews, is
ucij = (si + (1� (1 + k) si) i � �j) P Ti � t;7One of the dimensions on which broadcasters could compete is an ideological one
(Baron [3], Gentzkow and Shapiro [10], Mullainathan and Shleifer [13]). While it wouldbe desirable to model this element as well, we believe that ideological bias has played adistinctly secondary role in the case of Swedish broadcasting.
13
where �j represents an idiosyncratic preference for public television (distastefor commercial tv), uniformly distributed on [0; 1], and t is a time cost ofwatching.8
A viewer j in group i starts watching commercial news if and only ifucij � usij . That is,
(1� (1 + k) si) i � �j �t
P Ti� 0:
The share of �switchers�in group i is
Si = Pr
��j � (1� (1 + k) si) i �
t
P Ti
�= max
�(1� (1 + k) si) i �
t
P Ti; 0
�We have worked under the implicit assumption that voter j takes the proba-bility that the incumbent is re-elected (P ) as given. However, a fully rationalvoter should realize that a change in i can a¤ect the equilibrium proba-bility that the incumbent is elected. Taking this into account will greatlycomplicate the analysis, without changing the nature of the comparativestatics that is of interest. We assume that P is �xed (at the level that cor-responds to the equilibrium value i): any deviation of i from i does notcause P to vary. Note that if i and "i are small enough (even when t = 0)voters behave in an approximately similar way even if they realize that P isendogenous.
Given viewer behavior, how should the entrant choose its news coverage?We assume that the commercial broadcaster faces a production cost 12pc
2i .
It receives revenue ai for every viewer it attracts. The pro�t maximizationproblem is
max i:"i
Xi
�aiSi �
1
2pc
2i
�:
The �rst-order conditions are
i =ai (1� (1 + k) si)
pc:
The commercial channel�s targets audience are viewers with high value toadvertisers ai and low Ti. The latter is true since the low Ti viewers areneglected by state TV and cheaper to attract on the margin. We summarizethe key comparative on the behavior of commercial television as follows:
8We assume that the idiosincratic preference for public television is multiplied by Ti.This is done to simplify analysis. The results would be qualitatively similar if �j wereintroduced in an additive manner.
14

Proposition 4 A commercial channel that breaks state monopoly choosescoverage i that is increasing in the commercial attractiveness of that group(ai) and decreasing in the state news coverage (si) that the group receives.
Given the equilibrium behavior of the entrant and of viewers (and re-calling from Proposition 3 that we can write Ti =
ps+B2
B si, the share ofswitchers in group i is
bSi = max ai (1� (1 + k) si)2pc
� t
P ps+B2
B si; 0
!: (4)
The share of switchers in group i is an increasing function of the commer-cial appeal of that group: ai. This is unsurprising because the commercialentrant o¤ers better programming to lucrative audience groups.
Instead, the e¤ect of si on the share of switchers is ambiguous. On theone hand, viewers in groups with high si, who are already well-served bystate television, are less appealing to the commercial entrant. This e¤ect,which we label the target audience e¤ect, is captured by the �rst addendin expression (4). On the other hand, the state broadcaster is providingbetter coverage to groups with large political stakes (high Ti). Viewersin those groups are also keen to increase their information by watchingcommercial news. This news specialist e¤ect is captured by the secondaddend in expression (4).
We thus have the following predictions with regards to switching:
A1 Selection and si. Theory does not tell whether the target audiencee¤ect dominates the news specialist e¤ect. We must use empirics todetermine the relationships between si and bSi.
A2 Selection and ai. Having high value to advertisers is positively corre-lated with watching commercial news.
Finally, we should ask how a viewer who switches to commercial tele-vision fares in terms of information when compared to a viewer who stayswith state television. A viewer in group i who switches experiences a changein her information level given by
(1� (1 + k) si) i =ai (1� (1 + k) si)2
pc
This can be positive or negative. As one would expect, the e¤ect is increasingin ai and decreasing in k and si. To summrize:
I1 Average e¤ect of watching commercial TV news. People who startwatching commercial TV news increase their information unless klarge.
15
I2 Heterogenous e¤ects of watching commercial TV across groups. Thetarget audience of commercial news (high ai, low si) will have a largerincrease in their knowledge about politics than other groups.
3 Empirics
We will now investigate empirically the implications above, in the case ofthe entry of the commercial channel TV4 in Sweden. Prior to this entry,television in Sweden was run by a public service TV-monopoly, presentlynamed Swedish Television (SVT). The organization is similar to that of theBBC, in that the majority of the board is appointed by the government andthat and that the programming choice is independent of direct governmentinvolvement. In 1991 a concession was given to the privately owned stationTV4 to start commercial terrestrial broadcasts. After its introduction, TV4has carried less informational content than the public broadcasters SVT.For example, in 1995, news and documentaries was 16 percent of the pro-gramming time in SVT and 7 percent of the programming time in TV4.9
We will mainly rely on data from the Swedish Election Studies (SES).This survey asks respondents which news channels they watch, a number ofknowledge question, and questions about political behavior. For summarystatistics and variable de�nitions, please see the Appendix.
Fortunately for our purposes, the SES is a rotating panel where respon-dents are interviewed in two consecutive elections. This enables us to studythe 1045 individuals who were surveyed both before the entry of TV4 (1988)and in the �rst election after the entry of TV4 (1991). These individualsare split into two groups. The 687 individuals who only watch SVT newsboth in 1988 and 1991 are called SVT viewers. The 358 individuals whoonly watched SVT news in 1988, but who started watching TV4 news in1991 are called TV4 viewers.
1988 1991 NTV4 viewers watched only SVT news watched TV4 news (358)SVT viewers watched only SVT news watched only SVT news (687)
We will use this data to test predictions on who selected into each group,based on implications A1 and A2 above. We will then test predictions onthe e¤ect of starting to watch TV4 news, contained in I1-I3.
3.1 Audience composition
Whether individuals chose to watch TV4 news depends both on the pro-gramming choice of TV4 and SVT, and on individual heterogeneity in the
9Source Svenskt TV-utbud 1996. Granskningsnämnden för radio och tv.
16
valuation of news. This section will �rst identify the demographic character-istics of the target audiences of TV4 and SVT, and then set up and test thepredictions on audience choice based on the two factors menationed above.
To empirically indentify the target audiences of state and commercialTV, we need to �nd identifyable characteristcs related to aj and si. We�rst identify demographic characteristics correlated with high advertisingpotential, aj . We �nd that in Sweden, advertising revenues are larger fornewspapers with a younger and richer audience, see Appendix. This is con-sistent with the common claim that advertisers pay more for audiences withmany young, rich, and women. The reason being that the rich have higherpurchasing power, that the young have not yet formed rigid purchasing pat-terns, and that women carry out a large share of the household purchases.Regarding si, we observe the share of correct answers to questions regardingpolitics in 1988, sj ; which we take as a proxy for si. We �nd that being wellinformed in 1988 is positively related to being rich and negatively related tobeing young, see Appendix.10
Hence, the target audience of SVT are old, rich, and the target audienceof commercial TV are young (perhaps rich). To sum up, we have
young richaj + +sj � +
Commercial TV target audience, i = i(ai+; si�) + ?
State TV target audience, si � +
We will now use the SES data to study the characteristics of those whowatched commercial TV in 1991. We will use a linear speci�cation of theform:
watchTV 41991 = c0 + youngyoung + richrich+ �sj :
Here, watchTV 41991 is a dummy variable for whether the respondent watchedTV4 news in 1991. The right-hand side varibles are respodent character-istics in 1988: young is a dummy variable for people aged 18-35; rich is adummy variable for respondents with income above SEK 115 000 in 1988(23 percent of the sample); and sj is the share correct answers to a set ofpolitical knowledge questions.
We use the model to interpret the result. If � < 0 then there is anegative correlation between being previously informed and being a TV4viewers. The interpretation is that the target audience e¤ect dominates.This implies that being a TV4 viewer should be positively correlated with
10Tj is positively correlated with being male. We do not have gender information inour advertising data. However, if the common claim that advertisers value women more,then women would be a target audience of commercial TV and men would be a targetaudience of public TV.
17

TV4
view
ers
SV
T vi
ewer
s
0 .2 .4 .6 .8 11
1.5
2
2.5
3
5
6
7
8
9
10
11
Share correct answers 1988
TV4 viewers
SVT viewers
18-21 21-30 31-40 41-50 51-60 61-70 70-801
1.5
2
2.5
3
5
6
7
8
9
10
11
Age 1988
TV4 viewers
SVT viewers
TV4
view
ers
SV
T vi
ewer
s
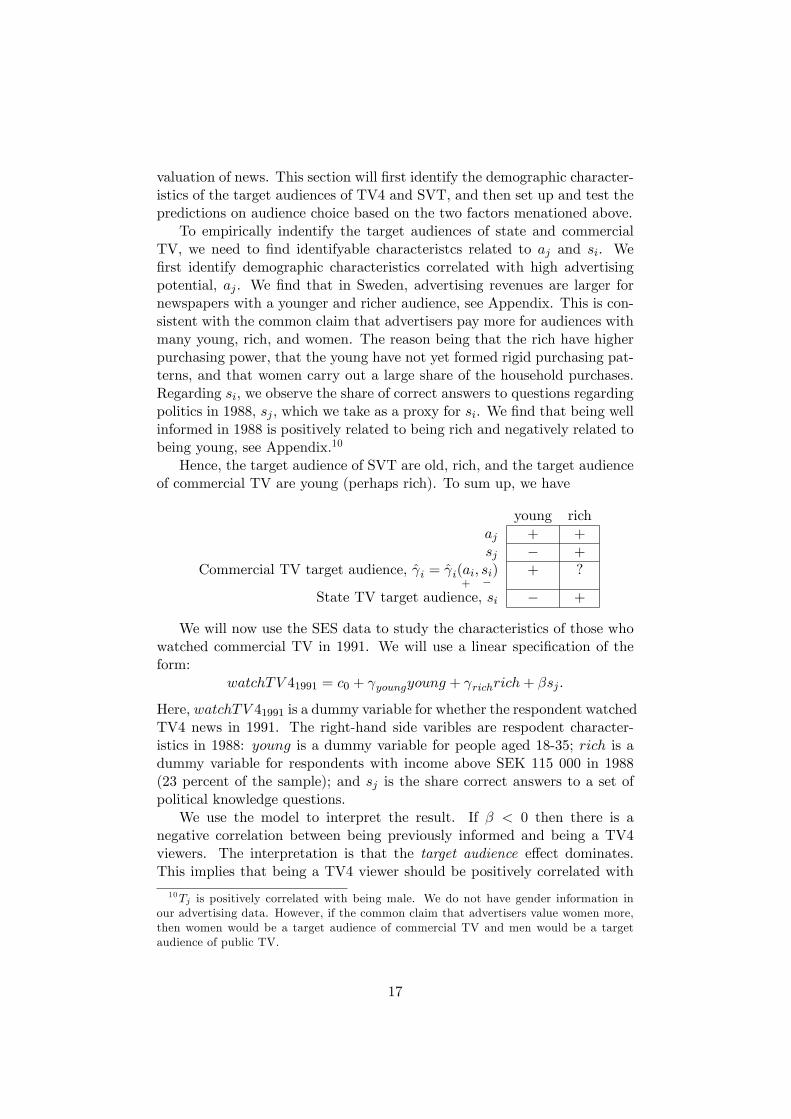
Figure 1: Hours news watching 1991 by respondent characteristics 1988
being young and female. If we �nd that � > 0 then the interpretation is thatthe news specialist e¤ect dominates. In this case we have no predictions onthe other coe¢ cients. For example, the young have aj and low sj . If bothaj and sj are positively related to watching TV4 news, then we do not havea prediction.
The results are shown in Table 1, column 2. We �nd that � is signi�-cantly negative. So it was not the previously well informed news specialistswho started watching commercial TV news. Rather TV4 news attractedthe previously uninformed. Consistent with the target audience e¤ect dom-inating, the young are also signi�cantly over represented among TV4 newsviewers.
The same picture appears in the simple group means shown in Table 2and Figure 1 below. The number of hours watching SVT news in 1991 ispositively correlated with respondent knowledge (left graph) and age (rightgraph). The number of hours watching TV4 news in 1991 is negativelycorrelated with the share correct answers and age in 1988.
In light of the model, the correlation between watching TV4 and beingyoung results from the young being a key target group for TV4 but not forSVT. Therefore, news are not tailored to the young in SVT, but they are inTV4. The opposite holds for the previously well informed. In consequence,knowledge in 1988 is negatively related to watching TV4 news. It is not thecase that the news specialists started watching TV4 news.
3.2 E¤ects of watching commercial news
These results on audience choice highlights the problems with cross-sectionalanalysis. A number of studies use cross sections to measure the impact onvoter knowledge or other outcome variables. Holz-Bacha and Norris (2001)�nd that people with a preference for public TV are better informed thanthose preferring commercial TV. A number of studies in the US �nd that
18
TV4 viewers SVT viewers
T1
T0
T1
T0
E(T1-T0|TV4)E(T0|SVT) - E(T0|TV4)
E(T1|TV4) - E(T0|SVT)
TV4 viewers SVT viewers
T1
T0
T1
T0
E(T1-T0|TV4)E(T0|SVT) - E(T0|TV4)
E(T1|TV4) - E(T0|SVT)
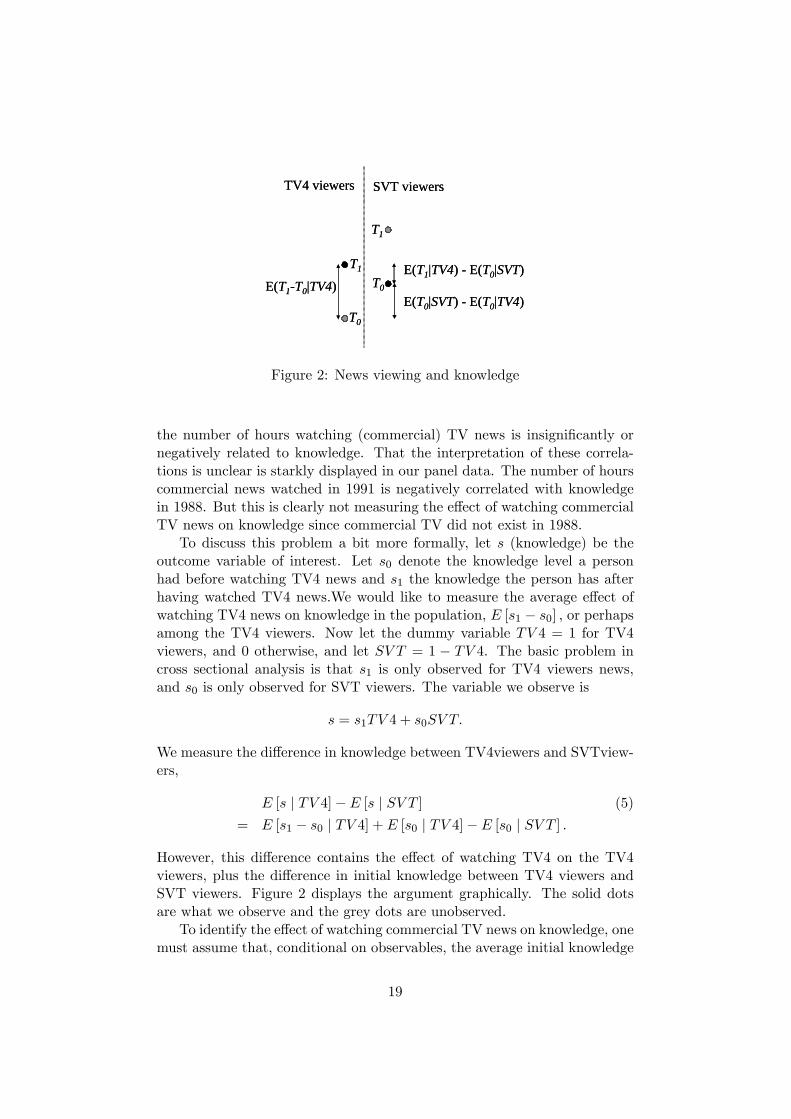
Figure 2: News viewing and knowledge
the number of hours watching (commercial) TV news is insigni�cantly ornegatively related to knowledge. That the interpretation of these correla-tions is unclear is starkly displayed in our panel data. The number of hourscommercial news watched in 1991 is negatively correlated with knowledgein 1988. But this is clearly not measuring the e¤ect of watching commercialTV news on knowledge since commercial TV did not exist in 1988.
To discuss this problem a bit more formally, let s (knowledge) be theoutcome variable of interest. Let s0 denote the knowledge level a personhad before watching TV4 news and s1 the knowledge the person has afterhaving watched TV4 news.We would like to measure the average e¤ect ofwatching TV4 news on knowledge in the population, E [s1 � s0] ; or perhapsamong the TV4 viewers. Now let the dummy variable TV 4 = 1 for TV4viewers, and 0 otherwise, and let SV T = 1 � TV 4. The basic problem incross sectional analysis is that s1 is only observed for TV4 viewers news,and s0 is only observed for SVT viewers. The variable we observe is
s = s1TV 4 + s0SV T:
We measure the di¤erence in knowledge between TV4viewers and SVTview-ers,
E [s j TV 4]� E [s j SV T ] (5)
= E [s1 � s0 j TV 4] + E [s0 j TV 4]� E [s0 j SV T ] :
However, this di¤erence contains the e¤ect of watching TV4 on the TV4viewers, plus the di¤erence in initial knowledge between TV4 viewers andSVT viewers. Figure 2 displays the argument graphically. The solid dotsare what we observe and the grey dots are unobserved.
To identify the e¤ect of watching commercial TV news on knowledge, onemust assume that, conditional on observables, the average initial knowledge
19

of TV4 viewers and SVT viewers is the same. Let X denote a vector ofobservable covariates, then one must assume
E [s0 j TV 4; X] = E [s0 j SV T;X] : (6)
However, the model and the data shows that this is unlikely to be satis�ed.Individuals� decisions to watch TV4 will depend directly on their initiallevel of information, sj . This problem is endemic to all studies of cross-sectional e¤ects of media use on voter information. It may be addressed byinstrumental variables or panel data.
Fortunately, we have the SES panel of voters. This allows us to get ameasure of the initial level of information before the entry of TV4 (s0), andthus identify the e¤ect of watching TV4 news without making the assump-tion in equation (6). From Table 2, the share correct answers for the TV4viewers prior to watching TV4 news (E [s0 j TV 4]) is 0.44 and the corre-sponding �gure for the SVT viewers (E [s0 j SV T ]) is 0.51. So we can plugthese numbers into equation (5) and identify the e¤ect of watching TV4.
To do this more formally, we compare the changes in knowledge amongpeople who started to watch TV4 with the change in knowledge among thosewho stayed with SVT. We will use the speci�cation
�s = �TV 4viewer + �X + ";
where X contains a set of control variables. This is the same econometricspeci�cation as a di¤erence-in-di¤erence (DD) estimator, but our design isweaker than the typical DD because selection is based on individual decisionsrather than a law or rule.
Two assumptions are needed for the validity of this estimator: that be-ing a TV4 viewer is uncorrelated with time-varying unobservables that a¤ectpolitical knowledge; and that the composition of the group of TV4 viewersremains stable before and after the introduction of TV4 (see for exampleBlundell and McCurdy, 1999). The latter assumption is automatically full-�lled since we are studying a panel of individuals. However, the formerassumption is particularly sensitive in our case becasue selection is basedon individual decisions. Reformulated for our case, the assumption is thatthe change in knowledge would have been the same among TV4 viewers andSVT viewers, had TV4 not been introduced.
We start by investigating whether SVT news watching was a¤ected bythe entry of TV4. In the model we made the assumption that this was notthe case. In the data this is true. Basically everyone watches SVT, a totalof 6 respondents reported not watching SVT news in 1991, none of thesewatched TV4 news. Regarding hours of news watched, it seems that TV4news viewing was just added to pre-existing news watching. From 1988 to1991, TV4 viewers increased their average reported hours of news watchingper week from 8.0 to 9.6, while their hours of SVT news watching only fell
20

from 8.0 to 7.7. Among SVT viewers news watching was roughly constant(it went from 7.8 to 7.9 hours a week).
The increase in total news hours among TV4 viewers remains basicallythe same, and signi�cant at one percent level when controlling for age, in-come, sex and residence location; see Table 3, column 1. More precisely, theregressions include a complete set of dummy variables for ages 18,19,...,80.There are three dummy variables for income: below the 33 percentile (in-comed1), between the 33rd and 66th percentile (incomed2), and above the66 percentile (incomed3, excluded). A dummy variable for gender (sex),which takes the value 1 if the respondent is female is included. Finally,four dummy variables indicate whether the respondent lives in a rural area(locd1), a small town (locd2), a towns or city (locd3), or Stockholm, Göte-borg or Malmö (locd4, excluded).
Next, we study prediction I1, that people who started watching TV4became better informed: Between 1988 and 1991, respondents who startedwatching TV4 news increased their average number of correct answers from44 to 52 percent, while the respondents who stayed with SVT did not im-prove their scores at all (51 percent correct in both years). Including con-trols, being a TV4 viewer is associated with a 3 percent higher increase incorrect answers relative to the SVT viewers. The di¤erence is signi�cant atthe 5 percent level, see Table 3, Column 2.
As an additional test, we examine whether political participation wasalso in�uenced by the start of TV4. Voter turnout may be increasing in theamount of information about politics that the respondent has. The directmeasure of information provided by the SES is admittedly coarse, by alsostudying how watching TV-news correlates with voter turnout, we hope tocapture a deeper knowledge about politics and perhaps interest in politicswhich is not captured by the direct measure of information. This also inter-esting in its own right since it directly addresses the concern that commercialTV may decrease participation in politics. The dependent variable used iswhether the respondent voted in the election. The data are from o¢ cialvote registers and not based on the respondents survey answers. From 1988to 1991, the share TV4 viewers who voted increased from 89 to 93 percent,while the share SVT viewers increased from 91 to 92 percent. After includ-ing controls in a linear probability model of vote choice (OLS), TV4 viewersare estimated to have increased their voter turnout probability by 5 percentrelative to that of the SVT viewers. The di¤erence is signi�cant at the 5percent level, see Table 3, Column 3.
Finally, we will test the hypothesis stated in I2 that watching TV4 hasthe largest impact on knowledge for high ai low si individuals. To test this wegenerate two dummy variables for respondents who had a less than averageshare correct number and were younger than 35 in 1988, respectively. Letthe vector containing these dummy variables be x and let x be the samplemean of this vector. We run the regression
21
�s = �TV 4viewer + TV 4viewer (x� x) + �X + ";
where X now also contains the variables in x. The result is presented inTable 4 columns 1 and 2. The e¤ect was signi�cantly larger for the previouslyuninformed but not for the young. The e¤ect on voting is signi�cantlydi¤erent from zero only among the uninformed.
4 Conclusions and discussion
Following the entry of commercial TV stations in Europe, there has beena heated debate. People have worried that entertainment will crowd outinformation and that diversity will be lost. Previous evidence based on cross-sectional data supports these conclusions as people watching commercial TVare less informed.
This paper addresses the obvious selection problem acknowledged in thisdebate. First, we build a model to understand the programming choicesof state and commercial TV, and the resulting selection of individuals inwhat channels to watch. We �nd that state TV should target viewers forwhom information about policy is valuable, commercial TV should targetan audience valuable to advertisers, and uninformed viewers not targeted bythe state TV. Theoretically, it is unclear whether the audience of commercialTV news will consist of its target audience, or also of information experts.
Next we study a panel of individuals before and after commercial TVentry. This allows us to determine the characteristics of commercial newsviewers before they start watching commercial news, and hopefully measurethe impact of commercial TV news. We study the case of Sweden where thecommercial TV provider TV4 entered into the state TV monopoly in 1991.We also �nd that commercial TV news did not attract news specialists.Rather being ex ante well informed is negatively correlated with watchingcommercial TV news. Further, we �nd that the young are overrepresentedamong the commercial TV viewers. We interpret this as a consequence ofthe young being a key target group of commercial TV since they are highlyvalued audience to advertisers.
Regarding information, we �nd that those who started watching com-mercial news increased their level of political knowledge signi�cantly morethan those who did not. We also �nd that the increase in knowledge fromwatching commercial news is highest among the target audience of com-mercial TV, the young and the previously not well informed. We interpretthis as a consequence commercial TV news providing material of interest tothese target groups.
In response to the worries stated above, we �nd that information mayhave been marginalized by entertainment in the commercial channels. How-ever, commercial TV has attracted groups previously undersupplied with
22

information and contributed both to increased voter information and polit-ical participation.
We also �nd that the worries about decreased diversity are not sup-ported by our evidence. The worries were in particular that certain groupswould lose from commercial entry: poor, the less informed, children, andthe elderly. First, we �nd that the poor did not lose, or rather that theylose under both systems and therefore are not much a¤ected by the change.They are not a target audience of commercial TV, but they are also not atarget audience of state TV. Second, we �nd that the ex ante less informedin fact are one of the big winners of the shift to commercial TV. Third, we�nd that the young are the other winner in the shift to commercial TV.
The obvious limitation of the empirical part of our study is that it ap-plies to a certain country at a certain time. It would be of great interestto see what has happened in all the other countries that have liberalizedtheir television market. In some sense, Sweden is an extreme case becausethe public service broadcaste has always had high standards of journalisticindependence. Besley and Prat�s [5] would predict that breaking up thestate monopoly would have an even more positive e¤ect in countries wheregovernment has a more direct in�uence on the news production process.The other limitation of our study is that it only considers one dimensionof the e¤ects of broadcasting commercialization, namely voter information.Further research should use micro data to study other important dimen-sions, such as change in social values (acceptance of violence, gender roles,nationalism, etc.) and the intellectual development of children.
References
[1] Simon P. Anderson and Stephen Coate. Market provision of publicgoods: The case of broadcasting. NBER Working Paper 7513. 2000.
[2] British Broadcasting Corporation (BBC). Annual Re-ports and Accounts: 2001/2002. 2002. Available on:http://www.bbc.co.uk/info/report2002/print.shtml).
[3] David P. Baron. Persistent media bias. Stanford Graduate School ofBusiness Research Paper 1845, February 2004.
[4] Timothy Besley and Robin Burgess. The political economy of govern-ment responsiveness: Theory and evidence from India. Quarterly Jour-nal of Economics, November 2002, 117(4), 1415-1452.
[5] Timothy Besley and Andrea Prat. Handcu¤s for the grabbing hand?The role of the media in political accountability. Working paper, 2003.
[6] Ronald Coase. British Broadcasting: A Study in Monopoly. HarvardUniversity Press, Cambridge, Massachusetts, 1950.
23

[7] Simeon Djankov, Caroline McLiesh, Tatiana Nenova, and AndreiShleifer. Who owns the media?, Journal of Law and Economics, Oc-tober, 2003.
[8] Timothy Feddersen and Wolfgang Pesendorfer. Voting behavior andinformation aggregation in elections with private information. Econo-metrica 65(5): 1029�1058, 1997.
[9] Matthew Gentzkow, Edward L. Glaeser, and Claudia Goldin. The Riseof the Fourth Estate: How Newspapers Became Informative and Whyit Mattered. NBER Working Paper 10791, 2004.
[10] Matthew Gentzkow and Jesse M. Shapiro. Media bias and reputation.Mimeo, 2004.
[11] Bengt Holmström. Managerial incentive problems: A dynamic perspec-tive. Review of Economic Studies 66(1): 169� 182, 1999.
[12] Chritina Holtz-Bacha and Pippa Norris. To entertain, inform and edu-cate: Still the Role of Public Television. Political Communication, 18,123-140, 2001.
[13] Sendhil Mullainathan and Andrei Shleifer. The market for news. Amer-ican Economic Review, forthcoming.
[14] Torsten Persson and Guido Tabellini. Political Economy: ExplainingEconomic Policy. MIT Press, 2000.
24
5 Appendix
This appendix studies how value to advertisers and prior knowledge varywith demographic characteristics. We �rst study how the advertisementrevenues per reader in Swedish local newspapers vary with the characteristicsof their readers. The data on advertising revenues contains 99 Swedishlocal newspapers advertising revenues in 1994. This is merged with data onnewspaper reader characteristics provided by Orvesto. This data is used bythe newspapers when selling advertisements. Their original sample containsaround 20 000 individuals aged between 17 and 80. We do not have accessto the individual level data, but only the share respondents who said theyread newspaper A and had personal income B, etc. Unfortunately, the dataavailable to us does not include gender although this is part of the originaldata set.
A regression of advertisement revenue per reader on reader demographicsis shown below. The dependent variable, aj ; is the log advertisement revenueper reader of newspaper j. The set of demographic variables, xj , contains aconstant, the share readers aged 17-35, young, a group which comprises 31percent of the sample, and the share readers with household income aboveSEK 300 000, rich, a group which comprises 36 percent of the sample. Weestimate
aj = 5:5(0:8)
+ 5:5(1:7)
young + 3:2(1:6)
rich; N = 99:
We �nd advertising revenues per reader to be higher for newspapers with ayounger and richer audience.
To identify groups with higher levels of value of information, we assumethat these the ones who were well informed prior to the introduction ofcommercial TV. The measure of knowledge we use is the number of correctanswers to questions regarding politicians and policy, in the Swedish ElectionStudy. One type of question asks the respondents to identify the partyof particular politicians. The 1988 SES contained 5 such questions andthe 1991 SES contained 6. The other type are true/false questions suchas "Today�s sick bene�t is 90 percent of income for most people." (true)and "The rate of unemployment in Sweden today is less than 5 percent."(true). The 1988 survey contained 5 such questions and the 1991 contained7. The questions are listed in the data appendix. Let Tj be the share ofcorrect answers individual i gives in 1988. We regress this on the a similarset of demographic variables, xj , as in the advertisement case. It containsa constant, the a dummy variable for people aged 18-35, young, and adummy variable for respondents with income above SEK 115 000, rich, agroup which comprises 23 percent of the sample. The estimation yields
Tj = :53(:01)
� :11(:01)
young + :08(:02)
rich� :05(:01)
; N = 1045:
25

Young and female respondents are less, and rich respondents more, knowl-edgeable.
26

Appendix 1: Definitions of Variables
Variable Definition
tv4view 1 if viewer watched TV4 in second interview(election), but not in first , 0 otherwise
stview 1 if viewer exclusively watched SVT news in both interviews (elections), 0 otherwise
knowl see below
voted 1 if voted in national election, 0 otherwise
tnews total hours reported news watching per week
income personal income in SEK
sex 1 if female, 0 if male
birth year of birth
incomed1 income below 33rd percentile
incomed2 income between 33rd and 66th percentile
incomed3 income above 66th percentile
locd1 resident in rural area
locd2 resident in smaller town
locd3 resident in town or city
locd4 resident in Stockholm, Göteborg, or Malmö (omitted)
aj newspaper advertisement revenue per reader ( SEK 1000) * Original source: Registret för totalbefolkningen. ** Original source: Official voting registers. Knowledge index In 1988, the respondents were asked to identify the party of Birgit Friggebo (fp), Thage G. Pettersson (s), Karl Erik Olsson (c), Lars Tobisson (m) and Eva Goes (g). In 1991 they were asked to identify the party of Birgit Friggebo (fp), Göran Persson (s), Karl Erik Olsson (c), Lars Tobisson (m), Eva Goes (g), and Gudrun Schyman (v). In 1988 the respondents were asked to respond to the following true/false questions A. Today’s sick benefit is 90 percent of income for most people. (true) B. There is a wage earners’ fund in each county. (false) C. The rate of unemployment in Sweden today is less than 5 percent. (true) D. Price inceses (inflation) have so far in 1988 been over 9 percent. (false) E. It has been decided in parliament that the most toxic radio-active waste from the Swedish nuclear power plants
shall be stored abroad. (false) In 1991 the respondents were asked the following true/false questions. A. Today’s sick benefit is 90 percnet of the income for most people. (true) B. There is a wage earners’ fund in each county. (false) C. The Swedish Parliament has 349 members. (true) D. The ratio of unemployment in Sweden is at the moment less than 5 percent. (true) E. Last year, Sweden accepted more than 50 000 refugees from other countries. (false) F. It has been decided in Parliament that the most toxic radio-active waste from the Swedish nuclear power plants
shall be stored abroad. (false) G. Denmark is a member of the EC. (true)

Appendix 2: Summary Statistics
Variable Obs Mean Std. Dev. Min Max
stview 2090 .6574163 .4746872 0 1
tv4view 2090 .3425837 .4746872 0 1
knowl2 2090 .492039 .2124404 0 .9230769
voted 2090 .9124402 .2827213 0 1
tnews 2052 8.191764 3.788843 0 19.5
sex 2090 .4516746 .4977783 0 1
locd1 2022 .1790307 .3834728 0 1
locd2 2022 .235905 .4246682 0 1
locd3 2022 .4371909 .496162 0 1
locd4 2022 .1478734 .3550622 0 1
incomed1 2090 .1956938 .3968288 0 1
incomed2 2090 .4851675 .4998996 0 1
incomed3 2090 .3191388 .4662545 0 1
incomedd 2090 .4397129 .4964709 0 1
birth 2090 44.66986 16.15107 11 70
Table 1. Audience characteristics dependent variable knowledge TV4viewer young -.10** .09**
(.01) (.03)
rich .0.10** -.00 (.02) (.04)
knowledge index -.26**
(.07)
constant .50** .44**
(.01) (.04)
R2 .11 .03 # observations 1045 1045 OLS estimates. Standard errors in parenthesis. **Denotes significance at 1 percent level. *Denotes significance at 5 percent level. Table 2. Audience characteristics age knowledge income sex voted TV4 viewers 40.1 0.44 99000 0.45 0.89 (0.9) (0.01) (3000) (0.03) (0.02) SVT viewers 44.9 0.51 105000 0.45 0.91 (0.6) (0.01) (2000) 0.02 (0.01)
p-value, same means 0 0 0.10 0.87 0.34 (Standard errors in parenthesis.)
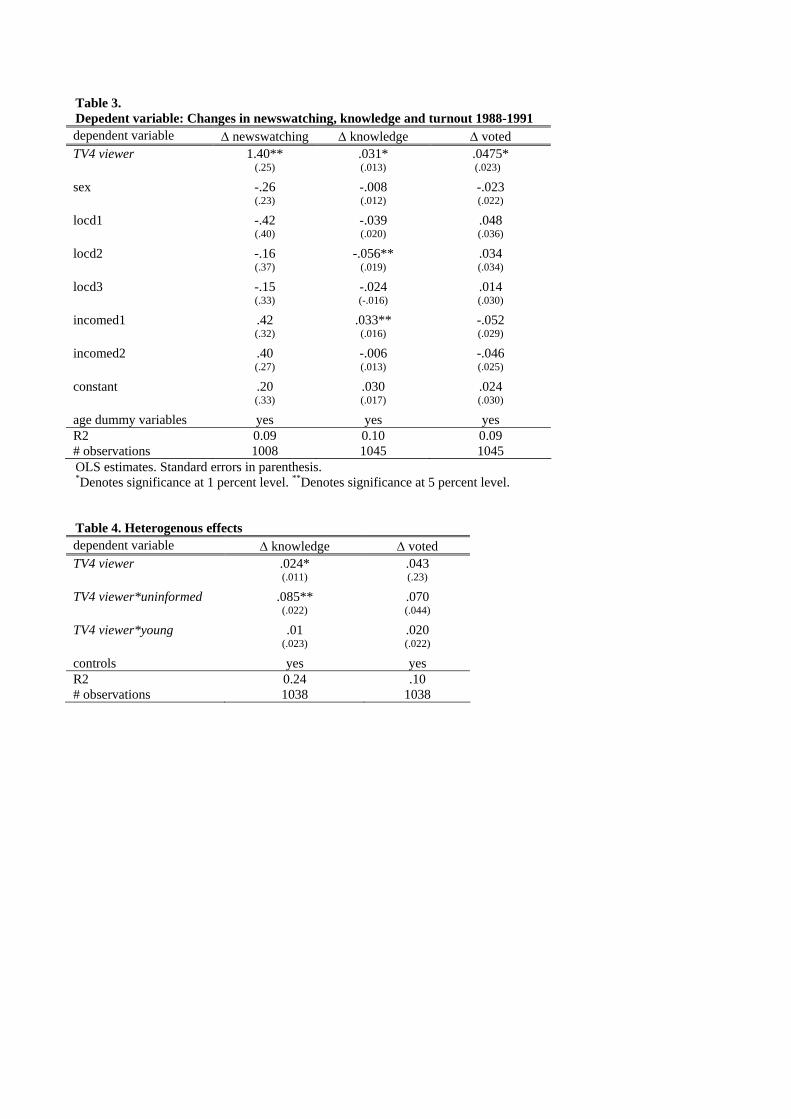
Table 3. Depedent variable: Changes in newswatching, knowledge and turnout 1988-1991 dependent variable ∆ newswatching ∆ knowledge ∆ voted TV4 viewer 1.40** .031* .0475* (.25) (.013) (.023)
sex -.26 -.008 -.023 (.23) (.012) (.022)
locd1 -.42 -.039 .048 (.40) (.020) (.036)
locd2 -.16 -.056** .034 (.37) (.019) (.034)
locd3 -.15 -.024 .014 (.33) (-.016) (.030)
incomed1 .42 .033** -.052 (.32) (.016) (.029)
incomed2 .40 -.006 -.046 (.27) (.013) (.025)
constant .20 .030 .024 (.33) (.017) (.030)
age dummy variables yes yes yes R2 0.09 0.10 0.09 # observations 1008 1045 1045 OLS estimates. Standard errors in parenthesis. *Denotes significance at 1 percent level. **Denotes significance at 5 percent level. Table 4. Heterogenous effects dependent variable ∆ knowledge ∆ voted TV4 viewer .024* .043 (.011) (.23)
TV4 viewer*uninformed .085** .070 (.022) (.044)
TV4 viewer*young .01 .020 (.023) (.022)
controls yes yes R2 0.24 .10 # observations 1038 1038