discussion of financial metrics for simple model points - ifrs phase...
TRANSCRIPT

Discussion of financial metrics for simple model points - IFRS Phase 2
Disclaimer
The views expressed in this presentation are those of the presenters and should not be taken to represent those of ICICI Prudential Life Insurance Company Limited, or the Institute of Actuaries of India.
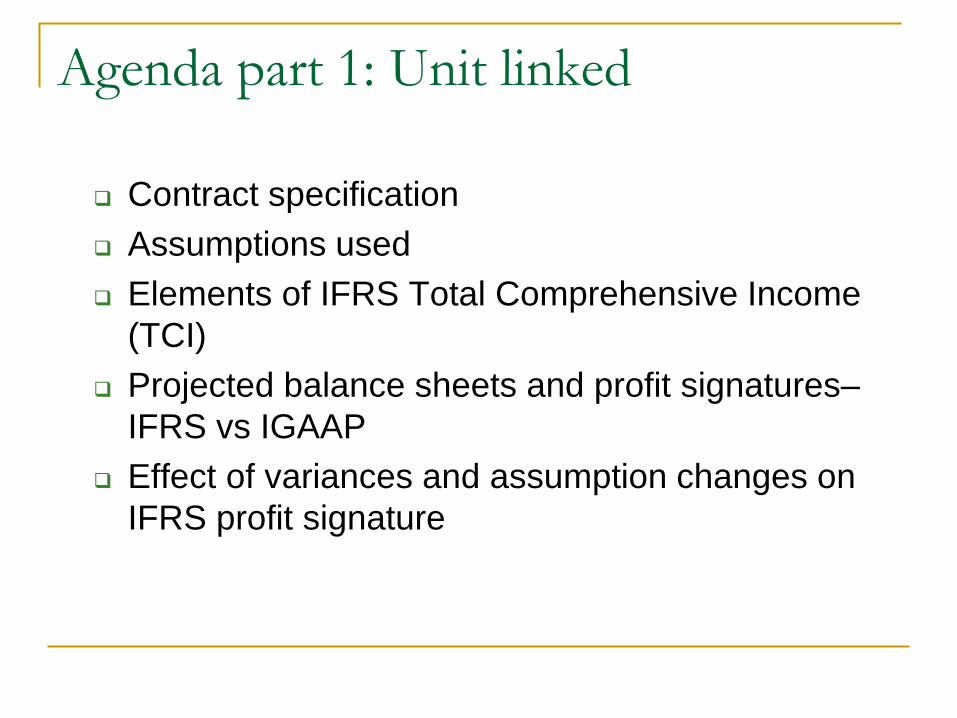
Agenda part 1: Unit linked
Contract specification Assumptions used Elements of IFRS Total Comprehensive Income
(TCI) Projected balance sheets and profit signatures–
IFRS vs IGAAP Effect of variances and assumption changes on
IFRS profit signature

Agenda part 2: Immediate annuity
Contract specification Assumptions used Elements of IFRS Total Comprehensive Income
(TCI) Projected balance sheets and profit signatures–
IFRS vs IGAAP Effect of variances and assumption changes on
IFRS profit signature
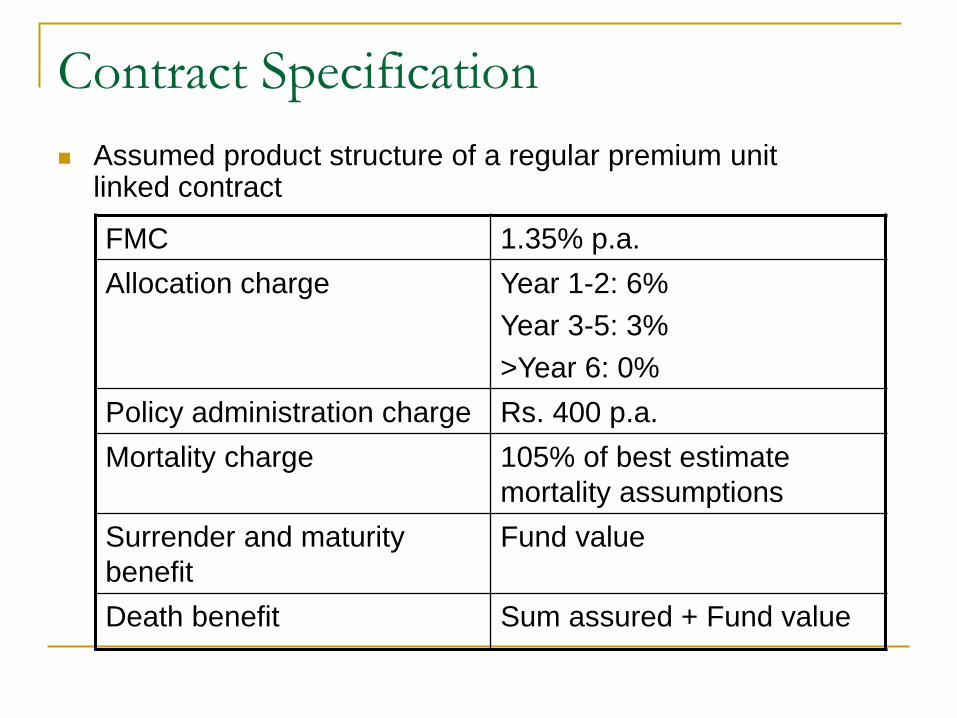
Contract Specification Assumed product structure of a regular premium unit
linked contract FMC 1.35% p.a.
Allocation charge Year 1-2: 6% Year 3-5: 3% >Year 6: 0%
Policy administration charge Rs. 400 p.a. Mortality charge 105% of best estimate
mortality assumptions Surrender and maturity benefit
Fund value
Death benefit Sum assured + Fund value
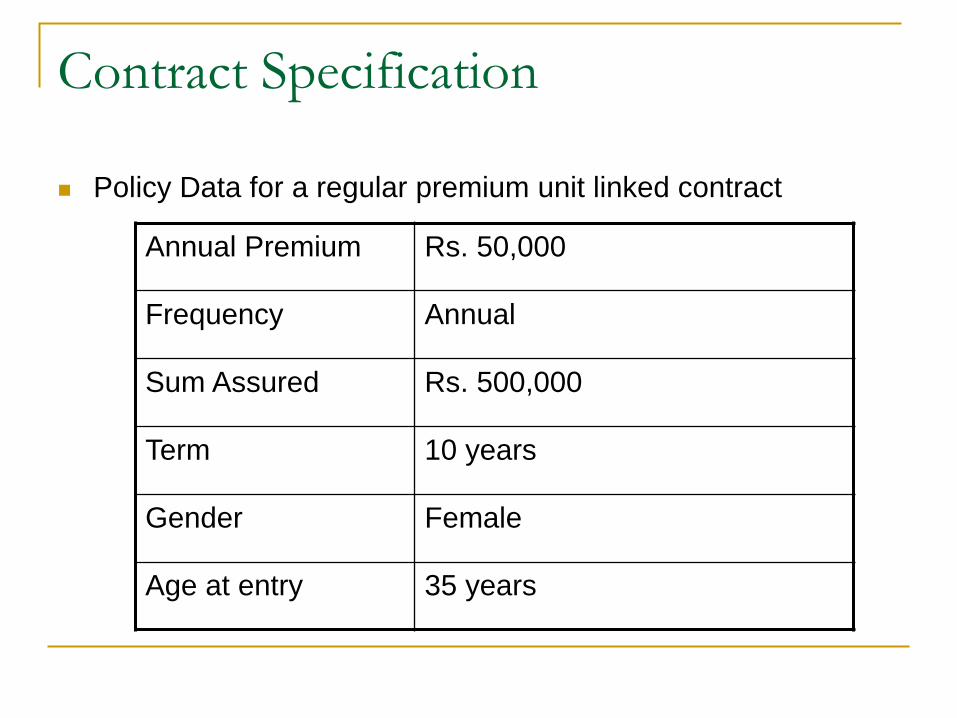
Contract Specification
Policy Data for a regular premium unit linked contract
Annual Premium Rs. 50,000
Frequency Annual
Sum Assured Rs. 500,000
Term 10 years
Gender Female
Age at entry 35 years

Assumptions used (best estimate)
Mortality Proportion of standard table
Surrenders 10% p.a.
Acquisition Expenses Per premium: 10% Per policy: Rs. 1000
Maintenance Expenses Per premium: 0.5% p.a. Per policy: Rs. 300 p.a.
Proportion of direct expenses
80% of total
Fund earning rate/Discount Rate
8% p.a.

Elements of balance sheet and total comprehensive income Cash flows under the contract Charges Direct Expenses Indirect Expenses Claims
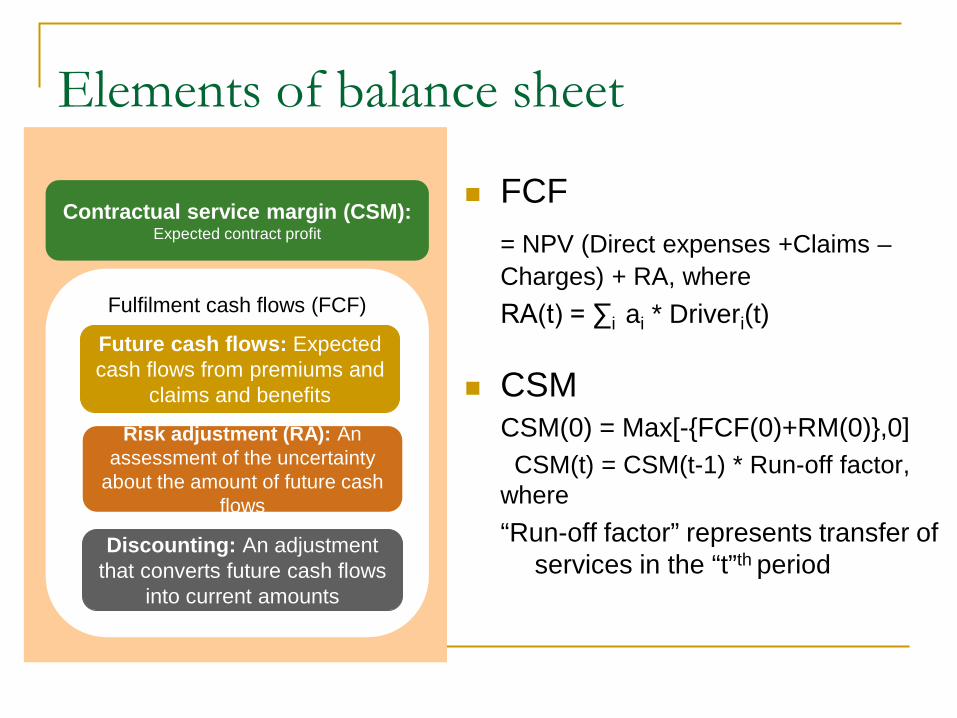
FCF = NPV (Direct expenses +Claims –
Charges) + RA, where RA(t) = ∑i ai * Driveri(t)
CSM CSM(0) = Max[-{FCF(0)+RM(0)},0]
CSM(t) = CSM(t-1) * Run-off factor, where “Run-off factor” represents transfer of
services in the “t”th period
Elements of balance sheet
Fulfilment cash flows
Contractual service margin: Expected contract profit
Discounting: An adjustment that converts future cash flows into
current amounts
Future cash flows: Expected cash flows from premiums and
claims and benefits
Risk adjustment: An assessment of the uncertainty about the amount of future cash flows
Net contract asset or liability*
Fulfilment cash flows
Contractual service margin: Expected contract profit
Discounting: An adjustment that converts future cash flows into current
amounts
Future cash flows: Expected cash flows from premiums and claims and benefits
Risk adjustment: An assessment of the uncertainty about the amount of future
cash flows
Fulfilment cash flows (FCF)
Contractual service margin (CSM): Expected contract profit
Discounting: An adjustment that converts future cash flows
into current amounts
Future cash flows: Expected cash flows from premiums and
claims and benefits
Risk adjustment (RA): An assessment of the uncertainty
about the amount of future cash flows

Total comprehensive income
Description Calculated as Insurance contracts revenue (a) Expected (Direct Expenses + Claims) +
Release of RA+ Release of CSM in respect of services provided in the period
Incurred claims and expenses (b) (Claims+Expenses)
Operating result (c) = (a)-(b) Investment income (d) Investment income on assets Interest on insurance liability (e) Unwind of discount on opening liability Investment result (f) = (d) – (e) Profit or loss (g) = (c) + (f) Effect of discount rate changes on insurance liability (h)
(X)
Total comprehensive income (i) = (g) + (h)

Components of profit and loss account
Paragraph Description 60(a) Losses, if any, at initial recognition of insurance contracts 60(b) Change in the risk adjustment
60(c) Change in the contractual service margin that reflects the transfer of services in the period
60(d) Change in estimates of future cash flows that do not adjust the contractual service margin

Components of profit and loss account
Paragraph Description 60(e) Differences between actual cash flows that occurred
during the period and previous estimates of those cash flows (experience adjustments)
60(f) Change in the carrying amount of onerous contracts 60(g) Effect of changes in the credit standing of the issuer of
reinsurance contracts held 60(h) Interest expense on insurance contract liabilities
determined using the discount rates that applied at the date that the contract was initially recognised.
60(i) Gains or losses other than those recognised in other comprehensive income
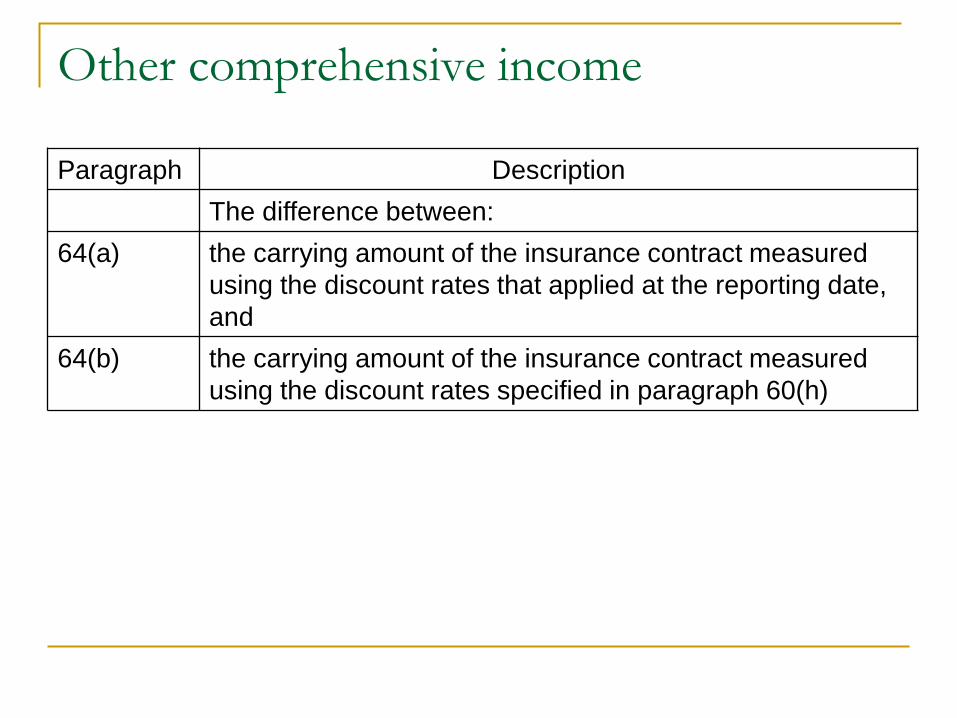
Other comprehensive income
Paragraph Description The difference between:
64(a) the carrying amount of the insurance contract measured using the discount rates that applied at the reporting date, and
64(b) the carrying amount of the insurance contract measured using the discount rates specified in paragraph 60(h)

Comparison of profit signatures
-14-12-10-8-6-4-2024
1 2 3 4 5 6 7 8 9 10
Thou
sand
s
IGAAP IFRS Phase 2

Projected liabilities per policy in-force
-16-14-12-10-8-6-4-20
1 2 3 4 5 6 7 8 9 10
Thou
sand
s
Policy Year
Indian GAAP IFRS Phase 2
Comparison of projected liabilities

Projected liabilities per policy sold
-14-12-10-8-6-4-20
1 2 3 4 5 6 7 8 9 10
Thou
sand
s
Policy Year
Indian GAAP IFRS Phase 2
Comparison of projected liabilities
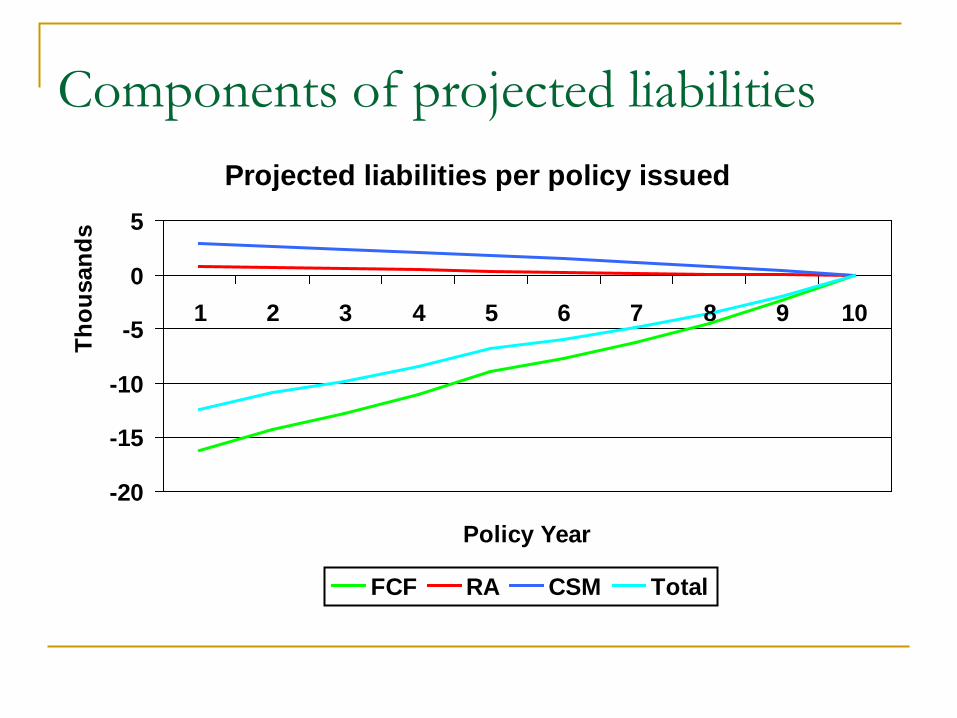
Projected liabilities per policy issued
-20
-15
-10
-5
0
5
1 2 3 4 5 6 7 8 9 10
Thou
sand
s
Policy Year
FCF RA CSM Total
Components of projected liabilities

Scenario 1: Description
• Surrender experience in line with assumed up to policy year 4
• Experience in policy year 5 higher than assumed rates by 20% (multiplicative),
• Increase in assumed decrement rates at the end of policy year 5 by 20% (multiplicative)
• Impact of change in assumptions fully absorbed by CSM

Scenario 1: Impact on CSM – year 5
Increase in liability Decrease in liability
Impact on CSM in year 5
0.00200.00400.00600.00800.00
1,000.001,200.001,400.001,600.001,800.002,000.00
CSM: Base Asumptionchangeimpact
absorbed byCSM
CSM:Scenario 1

Scenario 1: Impact on components of liability – year 5
Increase in liability Decrease in liability
Impact on liability in year 5
(7,100.00)
(6,600.00)
(6,100.00)
(5,600.00)
(5,100.00)
(4,600.00)
(4,100.00)
Liability:Base
Changein FCF
Changein RA
Changein CSM
Liability:Scenario
1

Scenario 1: Projected liabilities
Projected liabilities per policy issued
-14-12-10-8-6-4-20
1 2 3 4 5 6 7 8 9 10
Th
ou
san
ds
Policy Year
Base Scenario 1
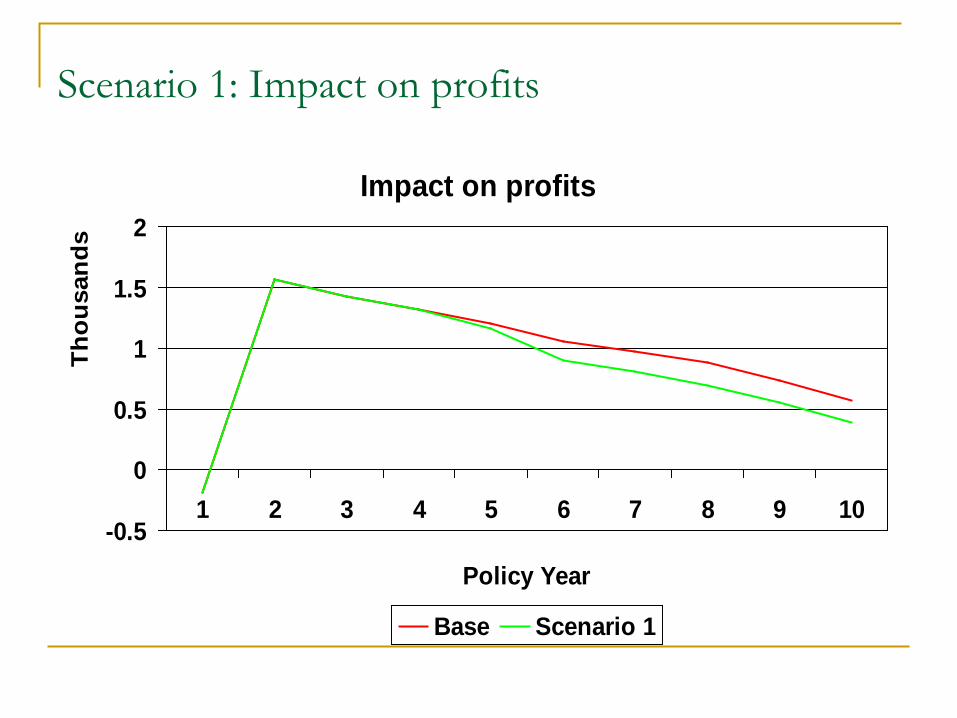
Impact on profits
-0.5
0
0.5
1
1.5
2
1 2 3 4 5 6 7 8 9 10
Thou
sand
s
Policy Year
Base Scenario 1
Scenario 1: Impact on profits

Scenario 1: Impact on profits: Year 5
Increase in profits Decrease in profits
Impact on components of total comprehensive income
700.00
800.00
900.00
1,000.00
1,100.00
1,200.00
1,300.00
Profit:Base
60(a) 60(b) 60(c) 60(d) 60(e) 60(f) 60(g) 60(h) 60(i) OCI Profit:Scenario
1

Scenario 1: Impact on profits: Year 6
Increase in profits Decrease in profits
Impact on components of total comprehensive income
800.00
850.00
900.00
950.00
1,000.00
1,050.00
1,100.00
Profit:Base
60(a) 60(b) 60(c) 60(d) 60(e) 60(f) 60(g) 60(h) 60(i) OCI Profit:Scenario
1

Scenario 2: Description
• Surrender experience in line with assumptions up to policy year 4
• Experience in policy year 5 higher than assumed rates by 70% (multiplicative),
• Increase in assumed decrement rates at the end of policy year 5 by 70% (multiplicative)
• Impact of change in assumptions not fully absorbed by CSM
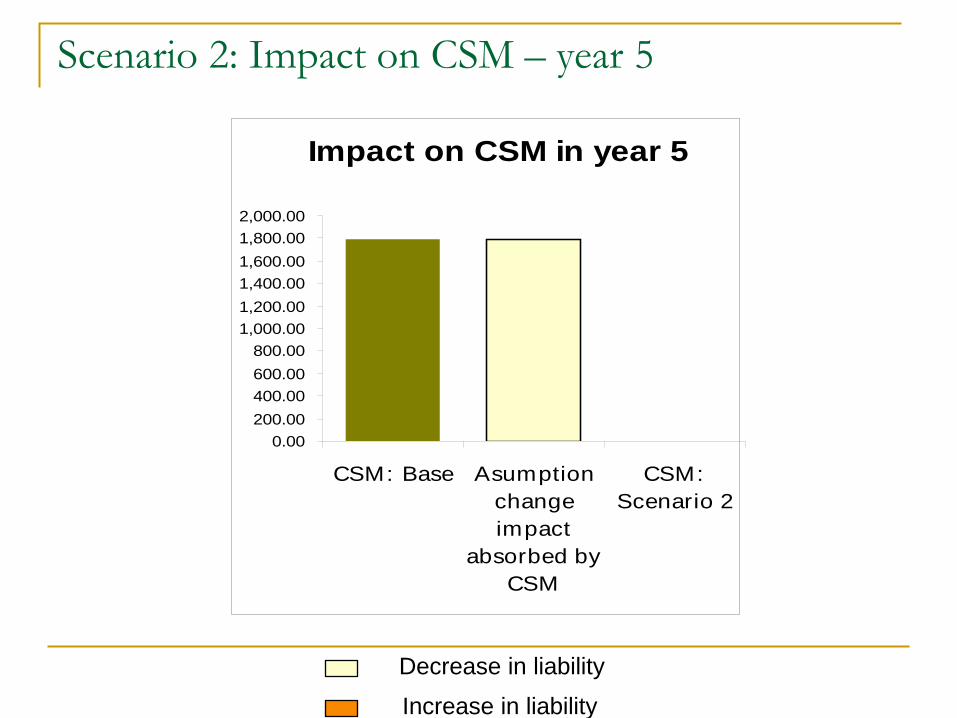
Scenario 2: Impact on CSM – year 5
Increase in liability Decrease in liability
Impact on CSM in year 5
0.00200.00400.00600.00800.00
1,000.001,200.001,400.001,600.001,800.002,000.00
CSM: Base Asumptionchangeimpact
absorbed byCSM
CSM:Scenario 2

Scenario 2: Impact on components of liability – year 5
Increase in liability Decrease in liability
Impact on liability in year 5
(7,100.00)
(6,600.00)
(6,100.00)
(5,600.00)
(5,100.00)
(4,600.00)
(4,100.00)
Liability:Base
Changein FCF
Changein RA
Changein CSM
Liability:Scenario
2

Scenario 2: Projected liabilities
Projected liabilities per policy issued
-14-12-10-8-6-4-20
1 2 3 4 5 6 7 8 9 10
Th
ou
san
ds
Policy Year
Base Scenario 2

Impact on profits
-0.5
0
0.5
1
1.5
2
1 2 3 4 5 6 7 8 9 10
Thou
sand
s
Policy Year
Base Scenario 2
```
Scenario 2: Impact on profits

Scenario 2: Impact on profits: Year 5
Increase in profits Decrease in profits
Impact on components of total comprehensive income
450.00
550.00
650.00
750.00
850.00
950.00
1,050.00
1,150.00
1,250.00
Profit:Base
60(a) 60(b) 60(c) 60(d) 60(e) 60(f) 60(g) 60(h) 60(i) OCI Profit:Scenario
2

Scenario 2: Impact on profits: Year 6
Increase in profits Decrease in profits
Impact on components of total comprehensive income
300.00
400.00
500.00
600.00
700.00
800.00
900.00
1,000.00
1,100.00
Profit:Base
60(a) 60(b) 60(c) 60(d) 60(e) 60(f) 60(g) 60(h) 60(i) OCI Profit:Scenario
2

Scenario 3: Description
• Fund earning rates higher than expected by 20% (multiplicative) in policy year 5
• No change in assumptions
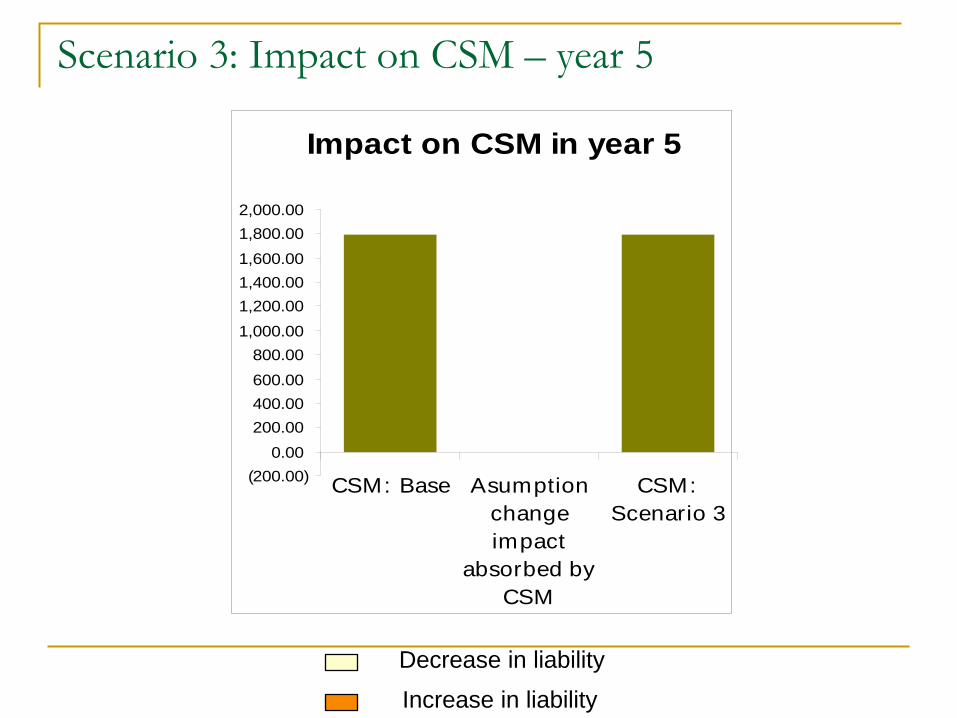
Scenario 3: Impact on CSM – year 5
Increase in liability Decrease in liability
Impact on CSM in year 5
(200.00)0.00
200.00400.00600.00800.00
1,000.001,200.001,400.001,600.001,800.002,000.00
CSM: Base Asumptionchangeimpact
absorbed byCSM
CSM:Scenario 3

Scenario 3: Impact on components of liability – year 5
Increase in liability Decrease in liability
Impact on liability in year 5
(7,000.00)
(6,800.00)
(6,600.00)
(6,400.00)
(6,200.00)
(6,000.00)
(5,800.00)
(5,600.00)
(5,400.00)
(5,200.00)
(5,000.00)
Liability:Base
Changein FCF
Changein RA
Changein CSM
Liability:Scenario
3

Scenario 3: Projected liabilities
Projected liabilities per policy issued
-14-12-10-8-6-4-20
1 2 3 4 5 6 7 8 9 10
Th
ou
san
ds
Policy Year
Base Scenario 3

Impact on profits
-0.5
0
0.5
1
1.5
2
1 2 3 4 5 6 7 8 9 10
Thou
sand
s
Policy Year
Base Scenario 3
Scenario 3: Impact on profits

Scenario 3: Impact on profits: Year 5
Increase in profits Decrease in profits
Impact on components of total comprehensive income
700.00
800.00
900.00
1,000.00
1,100.00
1,200.00
1,300.00
1,400.00
Profit:Base
60(a) 60(b) 60(c) 60(d) 60(e) 60(f) 60(g) 60(h) 60(i) OCI Profit:Scenario
3
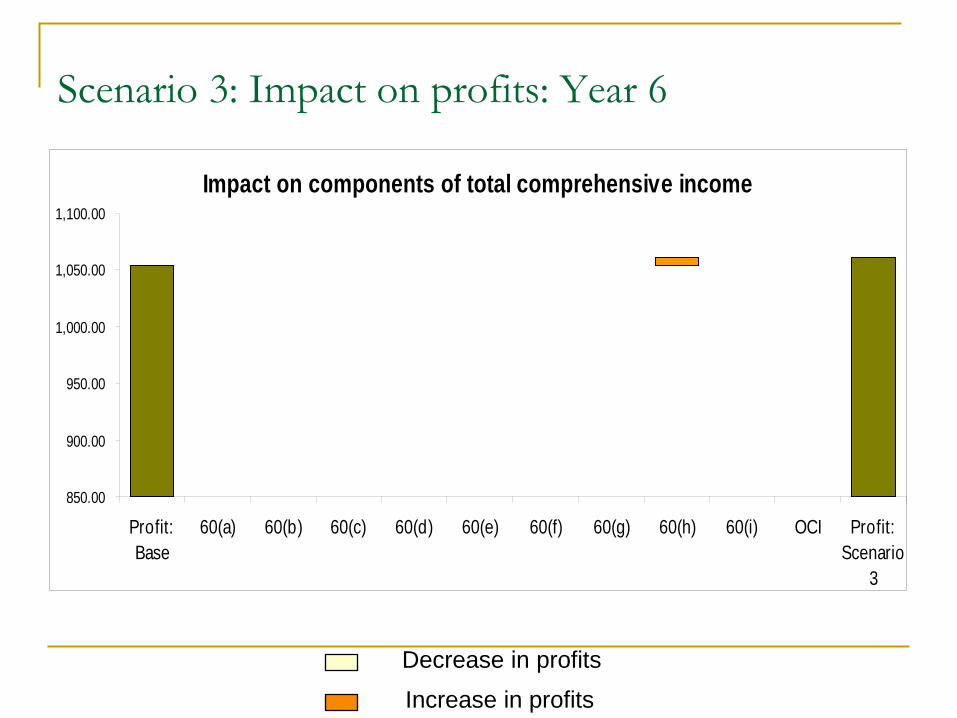
Scenario 3: Impact on profits: Year 6
Increase in profits Decrease in profits
Impact on components of total comprehensive income
850.00
900.00
950.00
1,000.00
1,050.00
1,100.00
Profit:Base
60(a) 60(b) 60(c) 60(d) 60(e) 60(f) 60(g) 60(h) 60(i) OCI Profit:Scenario
3
Scenario 4: Description
• Increase in assumption in respect of fund earning rates and discount rates by 20% (multiplicative) at the end of policy year 5
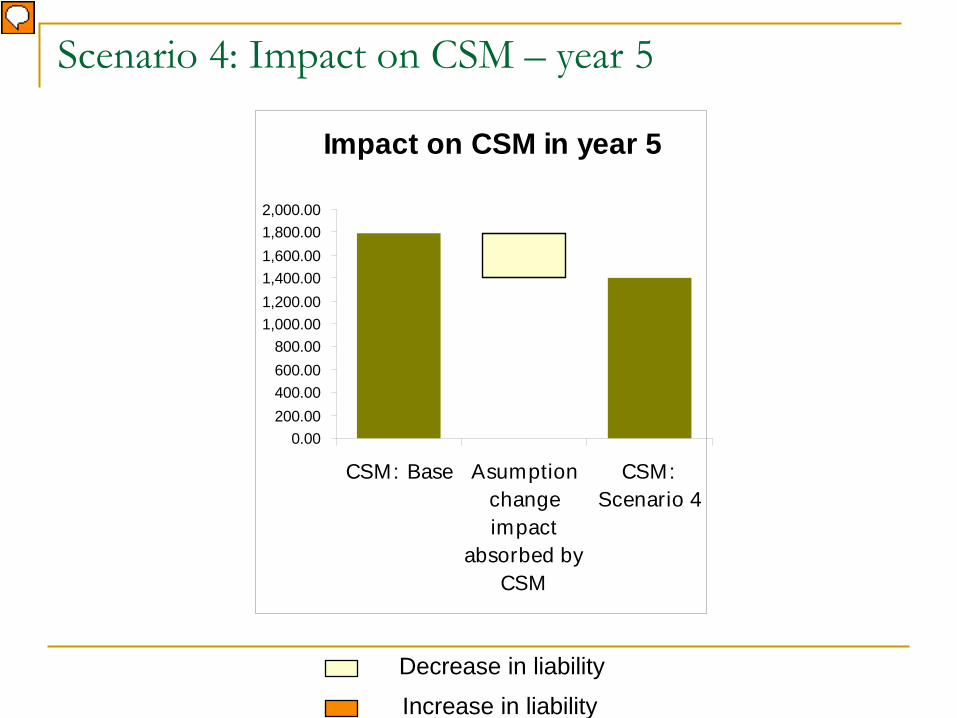
Scenario 4: Impact on CSM – year 5
Increase in liability Decrease in liability
Impact on CSM in year 5
0.00200.00400.00600.00800.00
1,000.001,200.001,400.001,600.001,800.002,000.00
CSM: Base Asumptionchangeimpact
absorbed byCSM
CSM:Scenario 4

Scenario 4: Impact on components of liability – year 5
Increase in liability Decrease in liability
Impact on liability in year 5
(6,900.00)
(6,800.00)
(6,700.00)
(6,600.00)
(6,500.00)
(6,400.00)
(6,300.00)
(6,200.00)
(6,100.00)
(6,000.00)
(5,900.00)
Liability:Base
Changein FCF
Changein RA
Changein CSM
Liability:Scenario
4

Scenario 4: Projected liabilities
Projected liabilities per policy issued
-14-12-10-8-6-4-20
1 2 3 4 5 6 7 8 9 10
Th
ou
san
ds
Policy Year
Base Scenario 4

Impact on profits
-0.5
0
0.5
1
1.5
2
1 2 3 4 5 6 7 8 9 10
Thou
sand
s
Policy Year
Base Scenario 4
Scenario 4: Impact on profits

Scenario 4: Impact on profits: Year 5
Increase in profits Decrease in profits
Impact on components of total comprehensive income
700.00
800.00
900.00
1,000.00
1,100.00
1,200.00
1,300.00
Profit:Base
60(a) 60(b) 60(c) 60(d) 60(e) 60(f) 60(g) 60(h) 60(i) OCI Profit:Scenario
4

Scenario 4: Impact on profits: Year 6
Increase in profits Decrease in profits
Impact on components of total comprehensive income
475.00
575.00
675.00
775.00
875.00
975.00
1,075.00
1,175.00
Profit:Base
60(a) 60(b) 60(c) 60(d) 60(e) 60(f) 60(g) 60(h) 60(i) OCI Profit:Scenario
4

Agenda part 2: Immediate annuity
Contract specification Assumptions used Elements of IFRS Total Comprehensive Income
(TCI) Projected balance sheets and profit signatures–
IFRS vs IGAAP Effect of variances and assumption changes on
IFRS profit signature
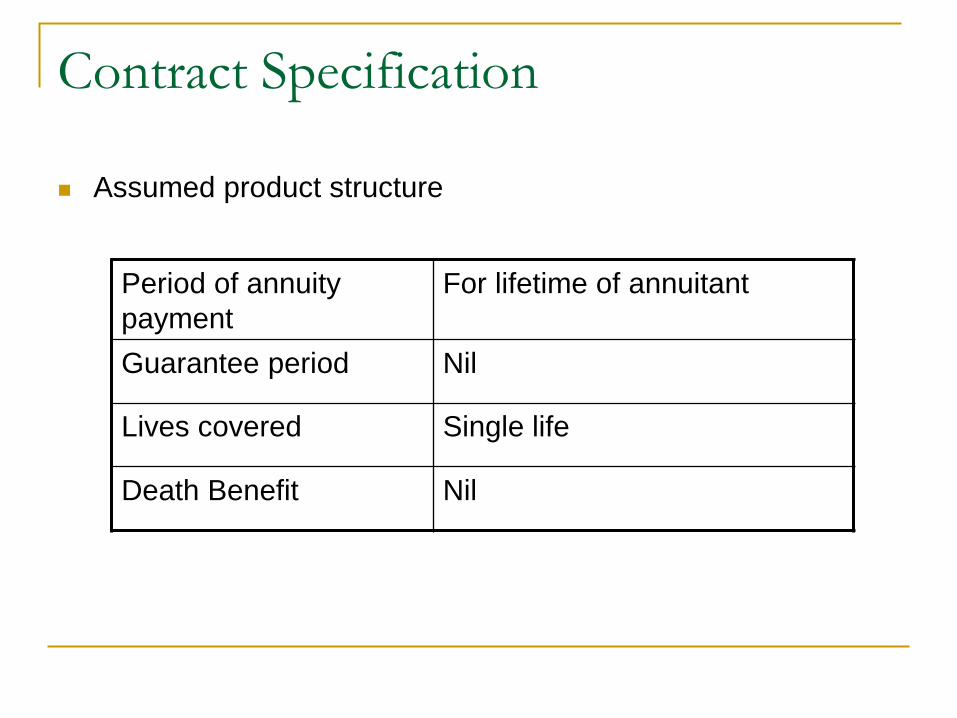
Contract Specification
Assumed product structure
Period of annuity payment
For lifetime of annuitant
Guarantee period Nil
Lives covered Single life
Death Benefit Nil

Contract Specification
Policy Data for an immediate annuity contract
Single premium Rs. 70,000
Annuity payable Rs. 4,500 p.a.
Annuity frequency Annual
Gender Male
Age at entry 31 years

Assumptions used (best estimate)
Mortality Proportion of standard table
Surrenders (by policy year) NA
Acquisition expenses Per premium: 5% Per policy: Rs. 300
Maintenance expenses Per policy: Rs. 50 p.a.
Proportion of direct expenses
80% of total
Investment return, discount rate
8% p.a.

Assumptions used (IGAAP reserving)
Mortality 90% of best estimate
Maintenance Expenses Per policy: Rs. 60 p.a.
Investment return, discount rate
6% p.a.
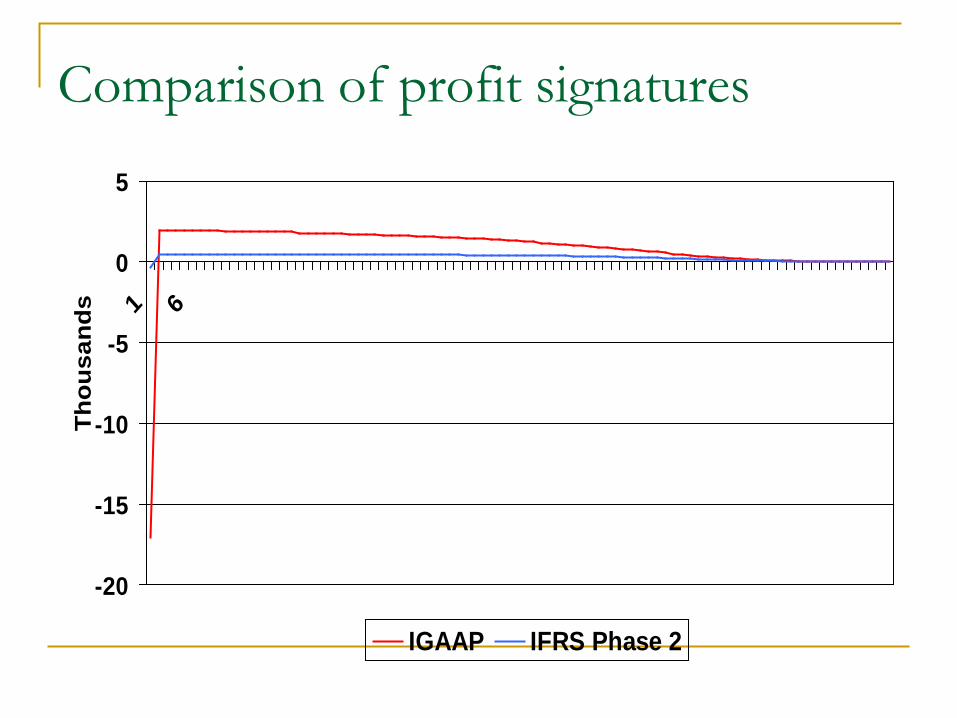
Comparison of profit signatures
-20
-15
-10
-5
0
5
1 6
Thou
sand
s
IGAAP IFRS Phase 2

Projected liabilities per policy issued
-20
0
20
40
60
80
100
1 7 13 19 25 31 37 43 49 55 61 67 73 79 85
Th
ou
san
ds
Policy Year
Indian GAAP IFRS Phase 2
Comparison of projected liabilities
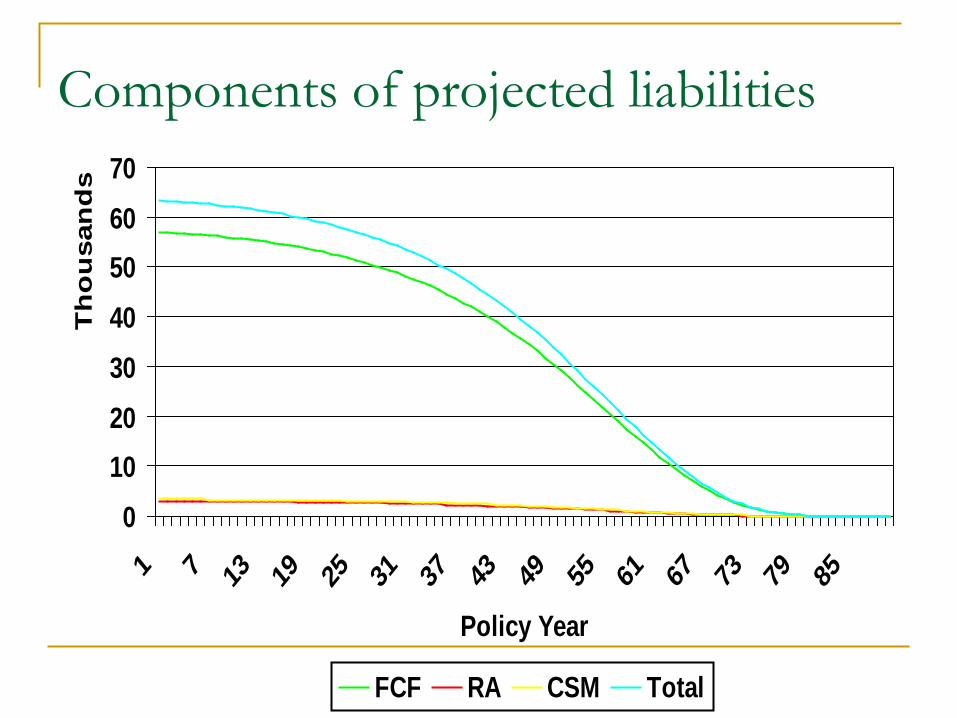
010203040506070
1 7 13 19 25 31 37 43 49 55 61 67 73 79 85
Th
ou
san
ds
Policy Year
FCF RA CSM Total
Components of projected liabilities
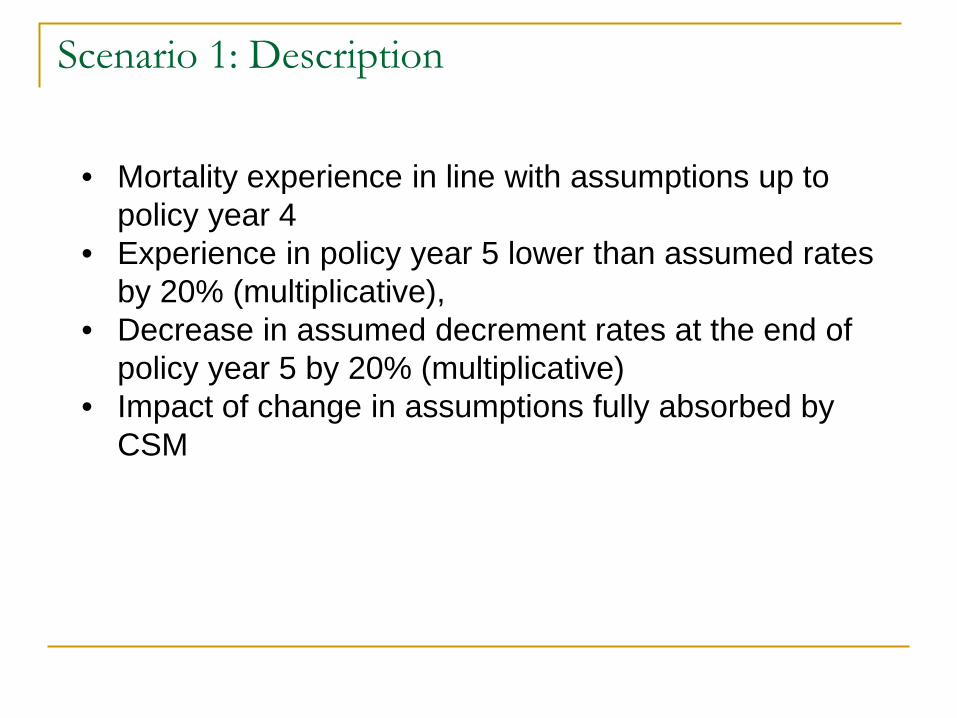
Scenario 1: Description
• Mortality experience in line with assumptions up to policy year 4
• Experience in policy year 5 lower than assumed rates by 20% (multiplicative),
• Decrease in assumed decrement rates at the end of policy year 5 by 20% (multiplicative)
• Impact of change in assumptions fully absorbed by CSM

Scenario 1: Impact on CSM – year 5
Increase in liability Decrease in liability
Impact on CSM in year 5
0.00
500.00
1,000.00
1,500.00
2,000.00
2,500.00
3,000.00
3,500.00
CSM: Base Asumptionchangeimpact
absorbed byCSM
CSM:Scenario 1
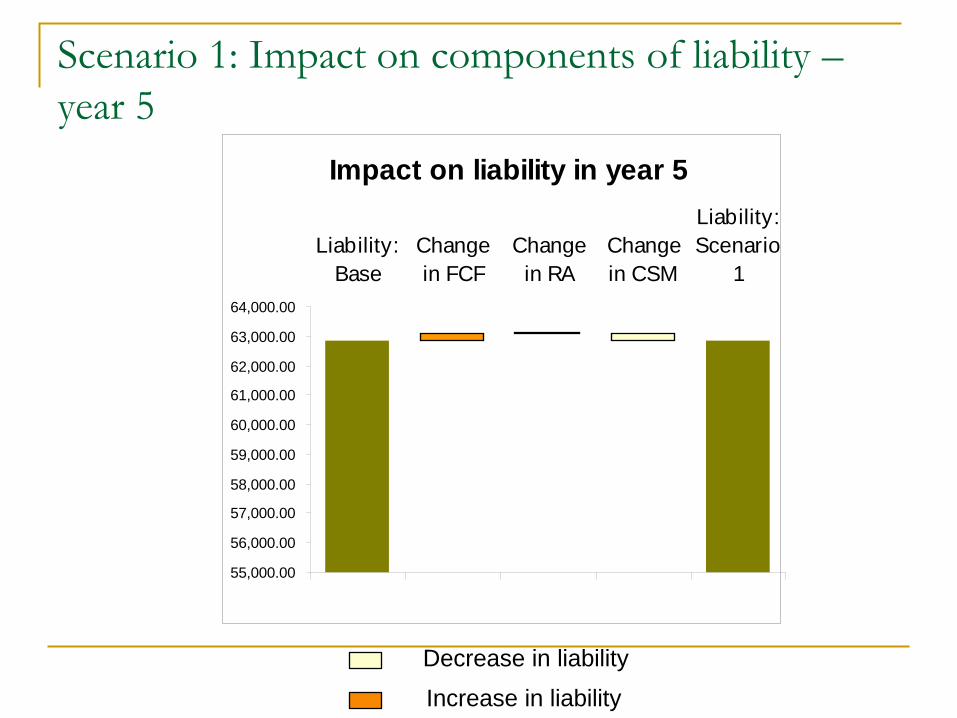
Scenario 1: Impact on components of liability – year 5
Increase in liability Decrease in liability
Impact on liability in year 5
55,000.00
56,000.00
57,000.00
58,000.00
59,000.00
60,000.00
61,000.00
62,000.00
63,000.00
64,000.00
Liability:Base
Changein FCF
Changein RA
Changein CSM
Liability:Scenario
1

Scenario 1: Projected liabilities
Projected liabilities per policy issued
010203040506070
1 7 13 19 25 31 37 43 49 55 61 67 73 79 85
Th
ou
san
ds
Policy Year
Base Scenario 1

Impact on profits
-400
-200
0
200
400
600
1 7 13 19 25 31 37 43 49 55 61 67 73 79 85
Policy Year
Base Scenario 1
Scenario 1: Impact on profits

Scenario 1: Impact on profits: Year 5
Increase in profits Decrease in profits
Impact on components of total comprehensive income
470.00
471.00
472.00
473.00
474.00
475.00
476.00
Profit:Base
60(a) 60(b) 60(c) 60(d) 60(e) 60(f) 60(g) 60(h) 60(i) OCI Profit:Scenario
1
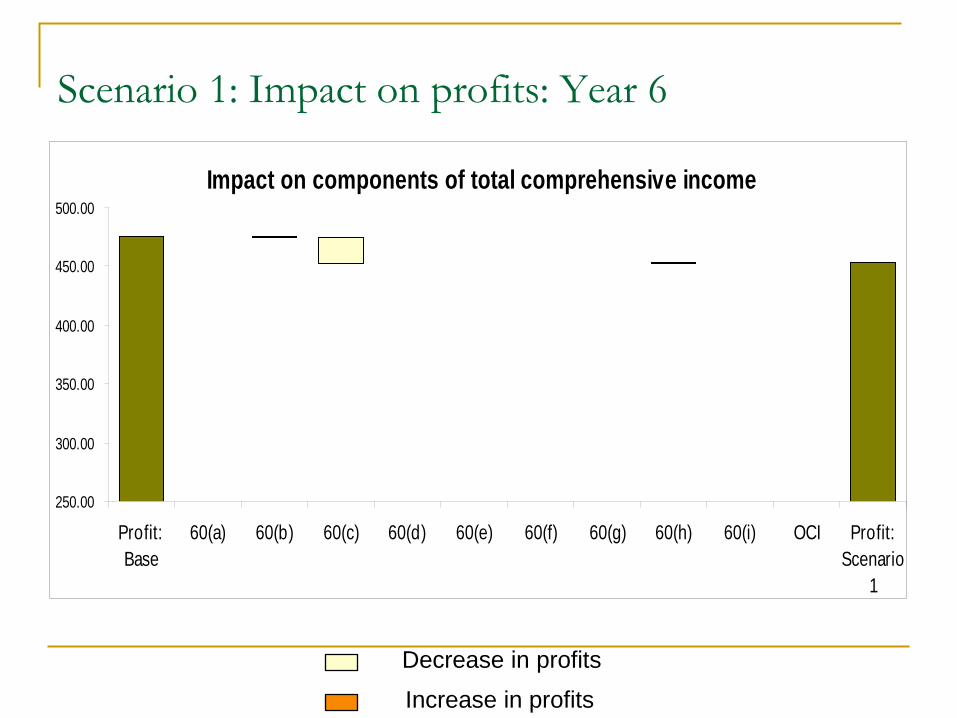
Scenario 1: Impact on profits: Year 6
Increase in profits Decrease in profits
Impact on components of total comprehensive income
250.00
300.00
350.00
400.00
450.00
500.00
Profit:Base
60(a) 60(b) 60(c) 60(d) 60(e) 60(f) 60(g) 60(h) 60(i) OCI Profit:Scenario
1

Scenario 2: Description
• Investment returns lower than expected by 20% (multiplicative) in policy year 5
• No change in assumptions

Scenario 2: Impact on CSM – year 5
Increase in liability Decrease in liability
Impact on CSM in year 5
0.00
500.00
1,000.00
1,500.00
2,000.00
2,500.00
3,000.00
3,500.00
CSM: Base Asumptionchangeimpact
absorbed byCSM
CSM:Scenario 2

Scenario 2: Impact on components of liability – year 5
Increase in liability Decrease in liability
Impact on liability in year 5
0.00
10,000.00
20,000.00
30,000.00
40,000.00
50,000.00
60,000.00
70,000.00
Liability:Base
Changein FCF
Changein RA
Changein CSM
Liability:Scenario
2

Scenario 2: Projected liabilities
Projected liabilities per policy issued
010000200003000040000500006000070000
1 7 13 19 25 31 37 43 49 55 61 67 73 79 85
Policy Year
Base Scenario 2

Impact on profits
-600
-400
-200
0
200
400
600
1 7 13 19 25 31 37 43 49 55 61 67 73 79 85
Policy Year
Base Scenario 2
Scenario 2: Impact on profits
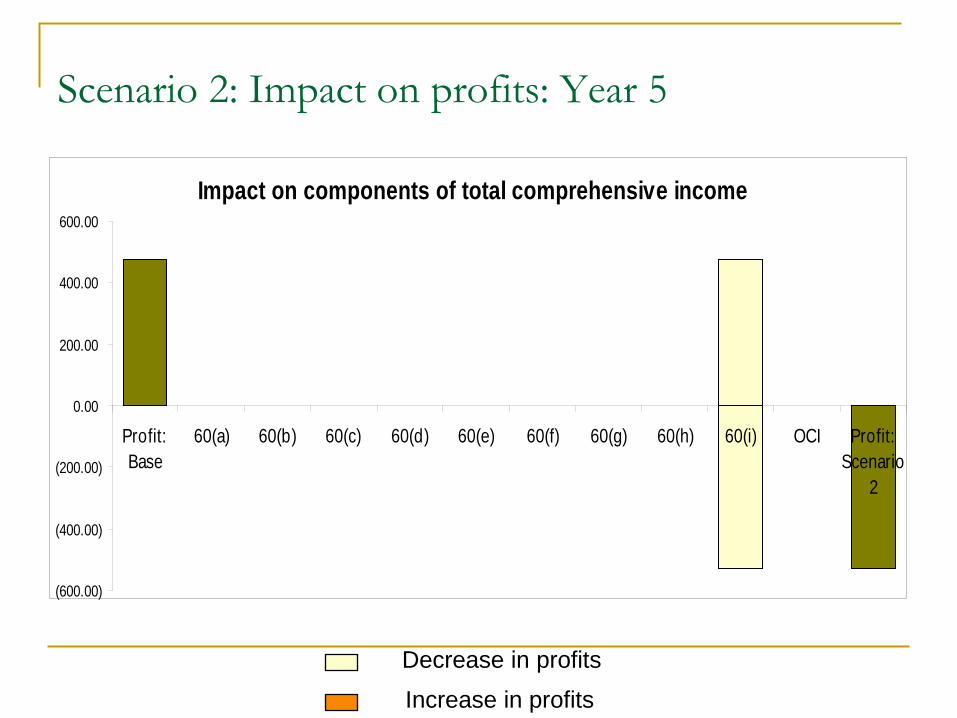
Scenario 2: Impact on profits: Year 5
Increase in profits Decrease in profits
Impact on components of total comprehensive income
(600.00)
(400.00)
(200.00)
0.00
200.00
400.00
600.00
Profit:Base
60(a) 60(b) 60(c) 60(d) 60(e) 60(f) 60(g) 60(h) 60(i) OCI Profit:Scenario
2
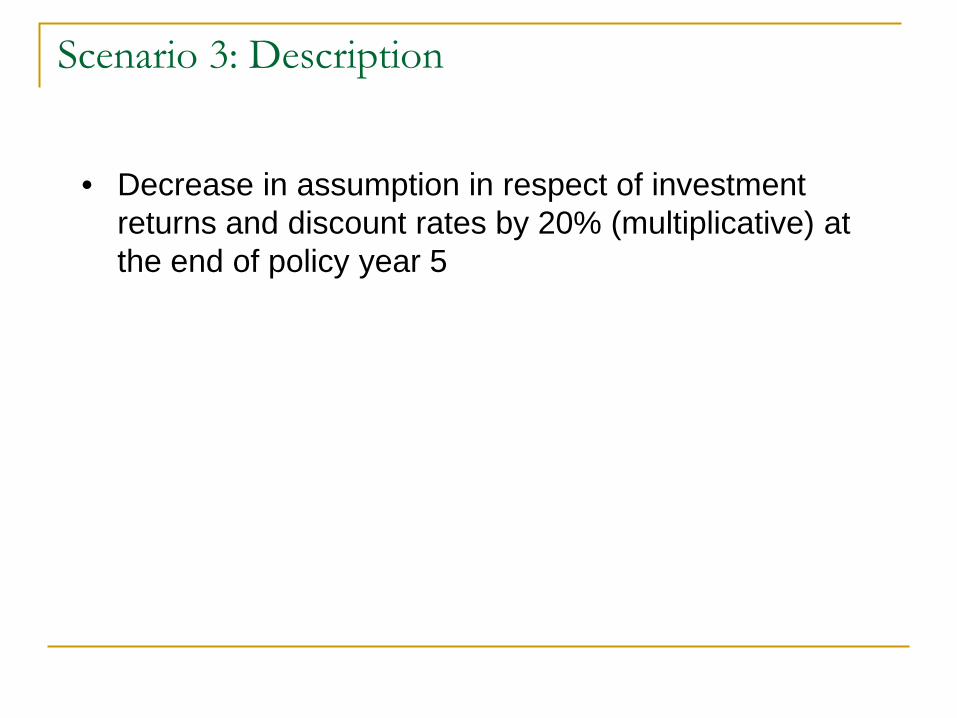
Scenario 3: Description
• Decrease in assumption in respect of investment returns and discount rates by 20% (multiplicative) at the end of policy year 5

Scenario 3: Impact on CSM – year 5
Increase in liability Decrease in liability
Impact on CSM in year 5
0.00
500.00
1,000.00
1,500.00
2,000.00
2,500.00
3,000.00
3,500.00
CSM: Base Asumptionchangeimpact
absorbed byCSM
CSM:Scenario 3

Scenario 3: Impact on components of liability – year 5
Increase in liability Decrease in liability
Impact on liability in year 5
0.00
10,000.00
20,000.00
30,000.00
40,000.00
50,000.00
60,000.00
70,000.00
80,000.00
Liability:Base
Changein FCF
Changein RA
Changein CSM
Liability:Scenario
3
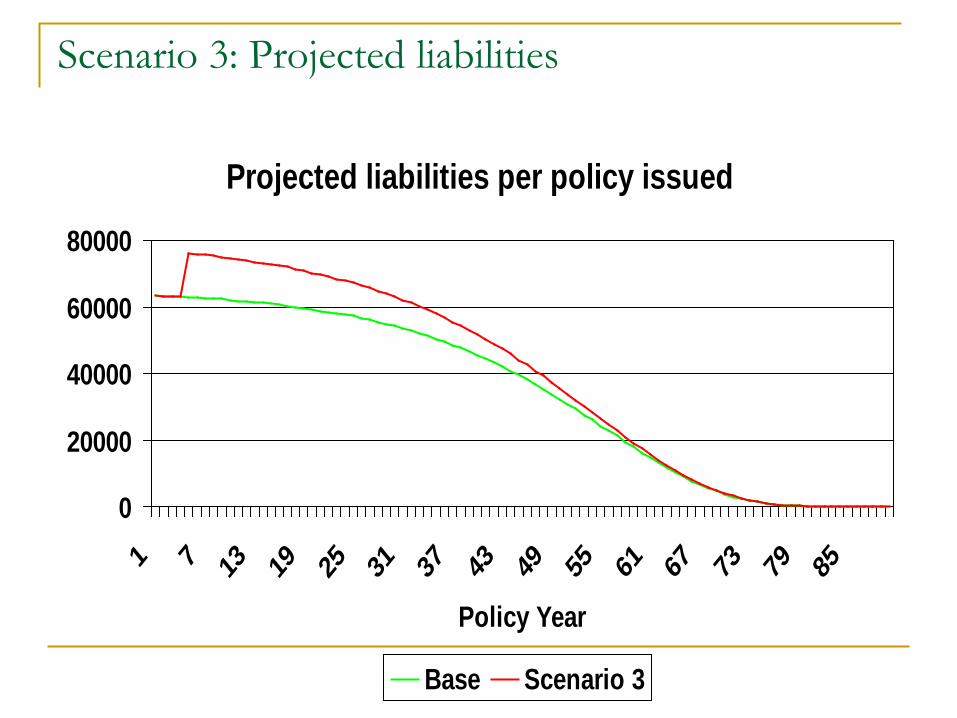
Scenario 3: Projected liabilities
Projected liabilities per policy issued
0
20000
40000
60000
80000
1 7 13 19 25 31 37 43 49 55 61 67 73 79 85
Policy Year
Base Scenario 3

Impact on profits
-14000-12000-10000-8000-6000-4000-2000
020004000
1 7 13 19 25 31 37 43 49 55 61 67 73 79 85
Policy Year
Base Scenario 3
Scenario 3: Impact on profits
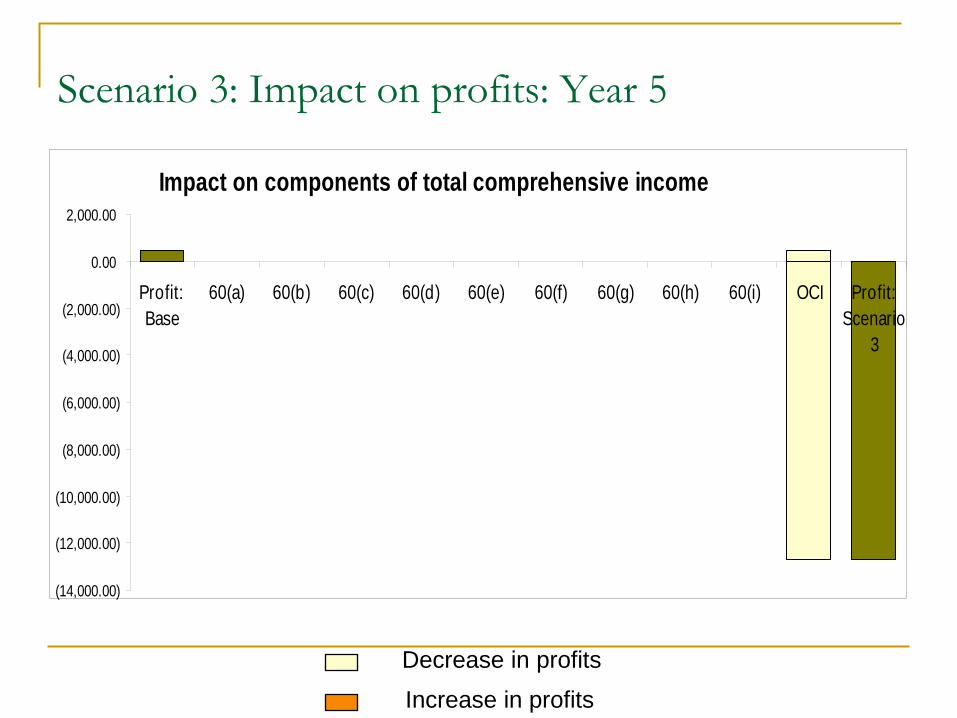
Scenario 3: Impact on profits: Year 5
Increase in profits Decrease in profits
Impact on components of total comprehensive income
(14,000.00)
(12,000.00)
(10,000.00)
(8,000.00)
(6,000.00)
(4,000.00)
(2,000.00)
0.00
2,000.00
Profit:Base
60(a) 60(b) 60(c) 60(d) 60(e) 60(f) 60(g) 60(h) 60(i) OCI Profit:Scenario
3

Scenario 3: Impact on profits: Year 6
Increase in profits Decrease in profits
Impact on components of total comprehensive income
0.00
200.00
400.00
600.00
800.00
1,000.00
1,200.00
1,400.00
1,600.00
1,800.00
Profit:Base
60(a) 60(b) 60(c) 60(d) 60(e) 60(f) 60(g) 60(h) 60(i) OCI Profit:Scenario
3

Thank you