discussion of analyses of prenatal - epa archives | us epa iq -5.98 5.0 0.229 1.715 5.66 0.762...
TRANSCRIPT

Discussion of analyses of prenatal Discussion of analyses of prenatal chlorpyrifoschlorpyrifos exposure and exposure and
neurodevelopmentalneurodevelopmental outcomesoutcomes
Virginia A. Rauh, ScD.

Outline
• Discussion of 2004 EHP paper
• Comparison of our results with data from other cohort studies
• Further discussion of mechanisms as described in the table

Purpose of the 2006 Pediatrics paper
This paper looked at the relationship between prenatal chlorpyrifos exposure and neurodevelopmental outcomes in 228 children born in the cohort between 3/1998 and 7/2002
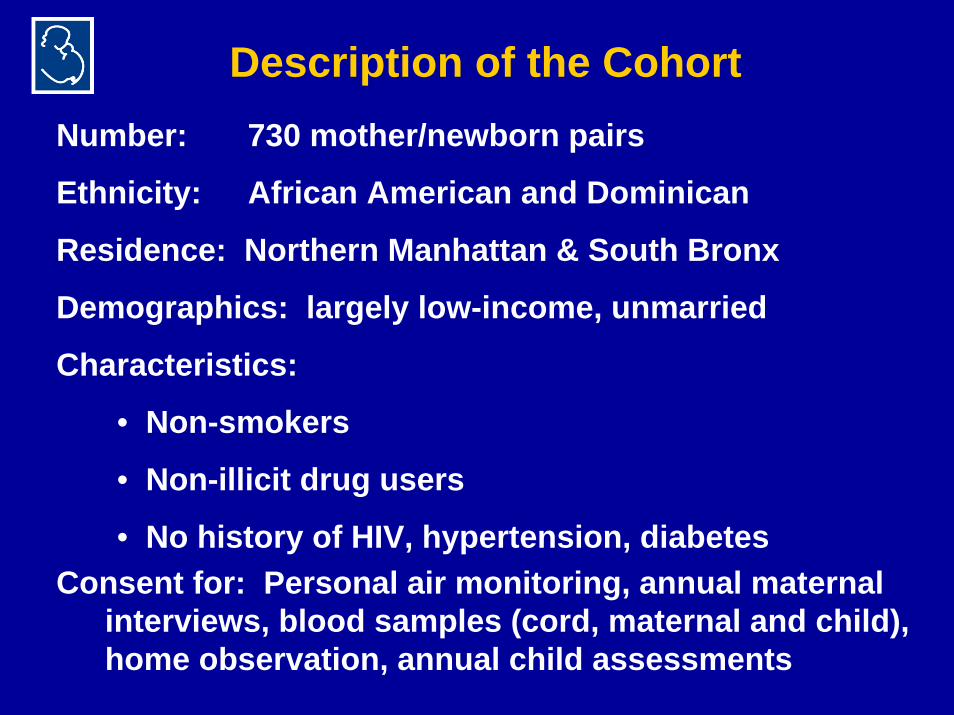
Description of the CohortNumber: 730 mother/newborn pairs
Ethnicity: African American and Dominican
Residence: Northern Manhattan & South Bronx
Demographics: largely low-income, unmarried
Characteristics:
• Non-smokers
• Non-illicit drug users
• No history of HIV, hypertension, diabetesConsent for: Personal air monitoring, annual maternal
interviews, blood samples (cord, maternal and child), home observation, annual child assessments
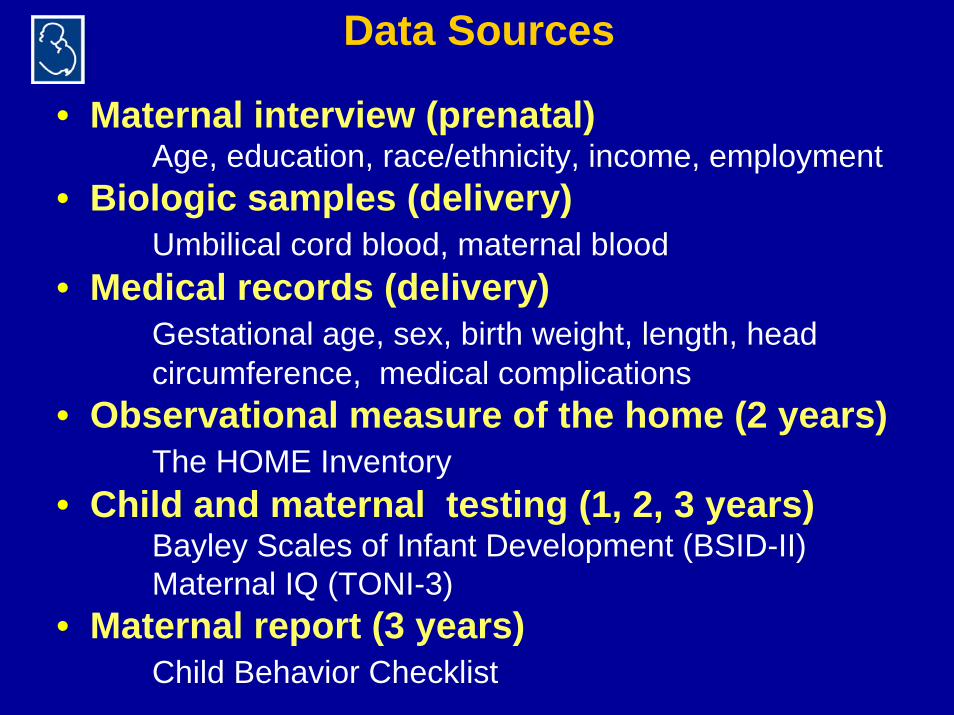
Data Sources
• Maternal interview (prenatal)Age, education, race/ethnicity, income, employment
• Biologic samples (delivery)Umbilical cord blood, maternal blood
• Medical records (delivery)Gestational age, sex, birth weight, length, headcircumference, medical complications
• Observational measure of the home (2 years)The HOME Inventory
• Child and maternal testing (1, 2, 3 years)Bayley Scales of Infant Development (BSID-II)Maternal IQ (TONI-3)
• Maternal report (3 years)Child Behavior Checklist

Postnatal Measures
Bayley Scales of X X X
Infant Intelligence
HOME Scale X
Childhood Behavior Checklist X
Wechsler Pre-School & Primary X
Scale of Intelligence - R
Wechsler Intelligence X
Scale for Children IV4
12 Month
6 Month
48 Month
36 Month
24 Month
72 Month
60 Month
84 MonthTimeline

Means and Proportions on Measures of Development at 12, 24, and 36 Months of Age
Domain Age of Assessment
12 mo. 24 mo. 36 mo.
Mean (sd) Mean (sd) Mean (sd)
Mental Development 94.03 ( 9.8) 85.10 (12.4) 89.58 (11.4)
Motor Development 96.22 (12.2) 97.04 (11.5) 100.46 (13.0)
% % %
Mental Delay (<85) 14.30 29.20 22.60
Motor Delay (<85) 12.20 15.30 9.20
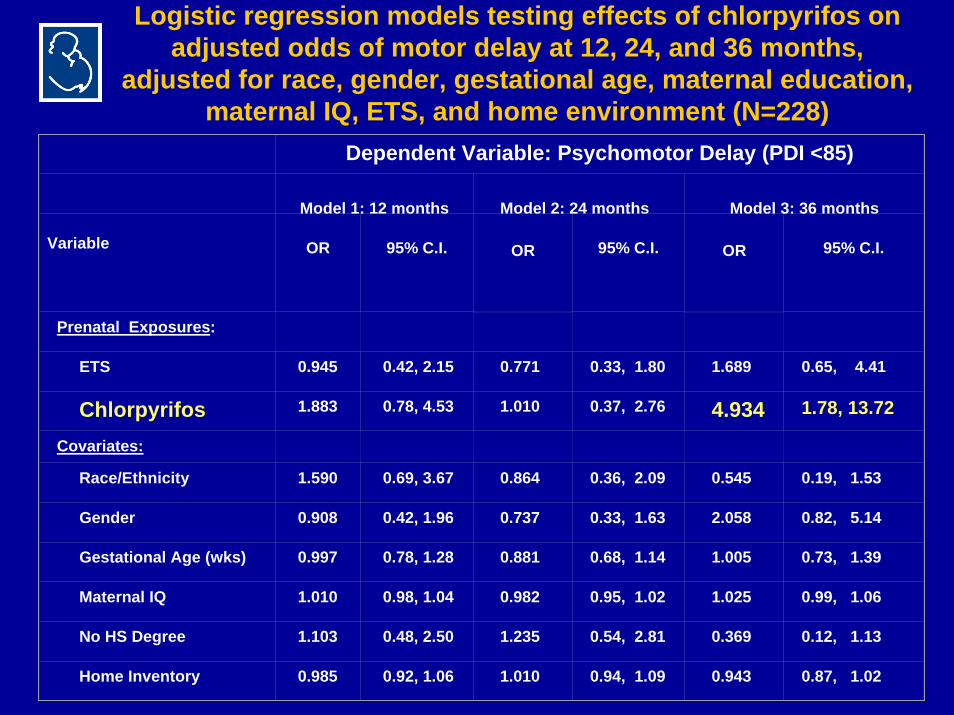
Logistic regression models testing effects of chlorpyrifos on adjusted odds of motor delay at 12, 24, and 36 months,
adjusted for race, gender, gestational age, maternal education, maternal IQ, ETS, and home environment (N=228)
Dependent Variable: Psychomotor Delay (PDI <85)
Model 1: 12 months Model 2: 24 months Model 3: 36 months
Variable OR 95% C.I. OR 95% C.I. OR 95% C.I.
Prenatal Exposures:
ETS 0.945 0.42, 2.15 0.771 0.33, 1.80 1.689 0.65, 4.41
Chlorpyrifos 1.883 0.78, 4.53 1.010 0.37, 2.76 4.934 1.78, 13.72
Covariates:
Race/Ethnicity 1.590 0.69, 3.67 0.864 0.36, 2.09 0.545 0.19, 1.53
Gender 0.908 0.42, 1.96 0.737 0.33, 1.63 2.058 0.82, 5.14
Gestational Age (wks) 0.997 0.78, 1.28 0.881 0.68, 1.14 1.005 0.73, 1.39
Maternal IQ 1.010 0.98, 1.04 0.982 0.95, 1.02 1.025 0.99, 1.06
No HS Degree 1.103 0.48, 2.50 1.235 0.54, 2.81 0.369 0.12, 1.13
Home Inventory 0.985 0.92, 1.06 1.010 0.94, 1.09 0.943 0.87, 1.02
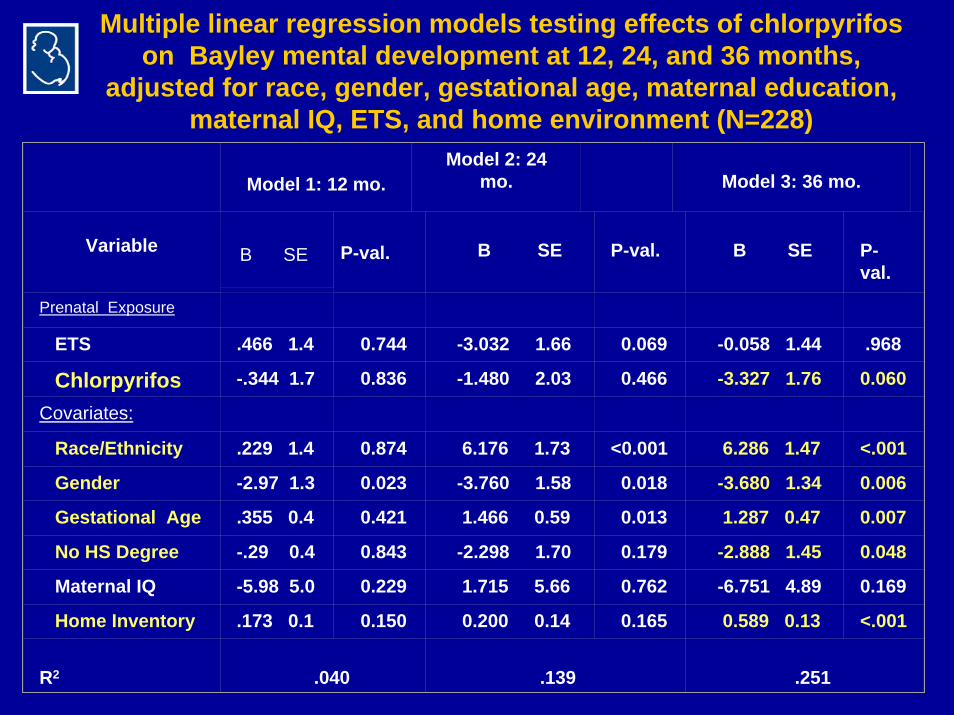
Multiple linear regression models testing effects of chlorpyrifoson Bayley mental development at 12, 24, and 36 months,
adjusted for race, gender, gestational age, maternal education, maternal IQ, ETS, and home environment (N=228)
Model 1: 12 mo.Model 2: 24
mo. Model 3: 36 mo.
Variable P-val. B SE P-val. B SE P-val.
Prenatal Exposure
ETS .466 1.4 0.744 -3.032 1.66 0.069 -0.058 1.44 .968
Chlorpyrifos -.344 1.7 0.836 -1.480 2.03 0.466 -3.327 1.76 0.060
Covariates:
Race/Ethnicity .229 1.4 0.874 6.176 1.73 <0.001 6.286 1.47 <.001
Gender -2.97 1.3 0.023 -3.760 1.58 0.018 -3.680 1.34 0.006
Gestational Age .355 0.4 0.421 1.466 0.59 0.013 1.287 0.47 0.007
No HS Degree -.29 0.4 0.843 -2.298 1.70 0.179 -2.888 1.45 0.048
Maternal IQ -5.98 5.0 0.229 1.715 5.66 0.762 -6.751 4.89 0.169
Home Inventory .173 0.1 0.150 0.200 0.14 0.165 0.589 0.13 <.001
R2 .040 .139 .251
B SE

Estimated Effects of Prenatal Chlorpyrifos Exposure on Cognitive Development in Children 12 through 36 months of
Age, using General Linear Modeling (GLM)
80
85
90
95
100
105
110
12 months 24 months 36 monthsAge
Bay
ley
Scal
es o
f Inf
ant
Dev
elop
men
t High exposure
Low exposure
Models are adjusted for race/ethnicity, sex, gestational age, maternal education, maternal IQ, Home Inventory, ETS; High CPF (upper quartile) versus all other
Rauh et al., Pediatrics, in press

Multiple linear regression models testing effects of chlorpyrifoson Bayley psychomotor development at 12, 24, and 36 months, adjusted for race, gender, gestational age, maternal education,
maternal IQ, ETS, and home environment (N=228)
Model 1: 12 months Model 2: 24 months Model 3: 36 months
VariableB SE P-val. B SE P-val. B SE P-val.
Prenatal Exposures:
ETS 0.312 1.76 0.859 2.826 1.63 0.084 -0.135 1.79 .940
Chlorpyrifos -3.304 2.11 0.118 1.171 1.98 0.555 -6.463 2.18 .003Covariates:
Race/Ethnicity -2.004 1.81 0.270 2.149 1.70 0.207 3.876 1.82 .034Male Gender 0.112 1.64 0.947 0.079 1.54 0.959 -2.954 1.66 .077
Gestational Age -0.161 0.56 0.773 0.203 0.53 0.699 1.376 0.64 .033Maternal IQ -0.807 1.77 0.650 -1.258 1.66 0.449 1.693 1.81 .350
No HS Degree -0.711 6.26 0.910 0.092 5.56 0.987 -5.775 6.08 .343
Home Inventory -0.077 0.15 0.611 0.089 0.14 0.527 0.298 0.16 .057
R2 .024 .035 .106
Estimated Effects of Prenatal Chlorpyrifos Exposure on Motor Development in Children 12 through 36 months of
Age, using General Linear Modeling (GLM)
80
85
90
95
100
105
110
12 months 24 months 36 monthsAge
Bay
ley
Scal
es o
f Inf
ant
Dev
elop
men
t
High exposure
Low exposure
Models are adjusted for race/ethnicity, sex, gestational age, maternal education, maternal IQ, Home Inventory, ETS
High chlorpyrifos (upper quartile) versus all other levels

Logistic regression models testing effects of chlorpyrifos on adjusted odds of mental delay at 12, 24, and 36 months, adjustedfor race, gender, gestational age, maternal education, maternal
IQ, ETS, and home environment (N=228)
Dependent Variable: Significant Delay (MDI <85)
Model 1: 12 months Model 2: 24 months Model 3: 36 months
Variable OR 95% CI OR 95% CI OR 95% CI
Prenatal Exposures:
ETS 0.582 0.25, 1.33 1.258 0.70, 2.26 1.232 0.65, 2.32
Chlorpyrifos 1.219 0.49, 3.06 1.754 0.86, 3.60 2.383 1.12, 5.08 Covariates:
Race/Ethnicity 1.064 0.48, 2.38 0.473 0.26, 0.87 0.358 0.18, 0.72
Male Gender 1.658 0.80, 3.44 1.678 0.96, 2.92 1.950 1.08, 3.52Gestational Age 1.001 0.79, 1.27 0.890 0.72, 1.10 0.829 0.68, 1.02
Maternal IQ 1.015 0.98, 1.05 0.985 0.96, 1.01 1.008 0.98, 1.03
No HS Degree 1.487 0.69, 3.22 0.951 0.52, 1.73 1.365 0.73, 2.55
Home Inventory 0.955 0.89, 1.02 0.963 0.92, 1.01 0.912 0.86, 0.96
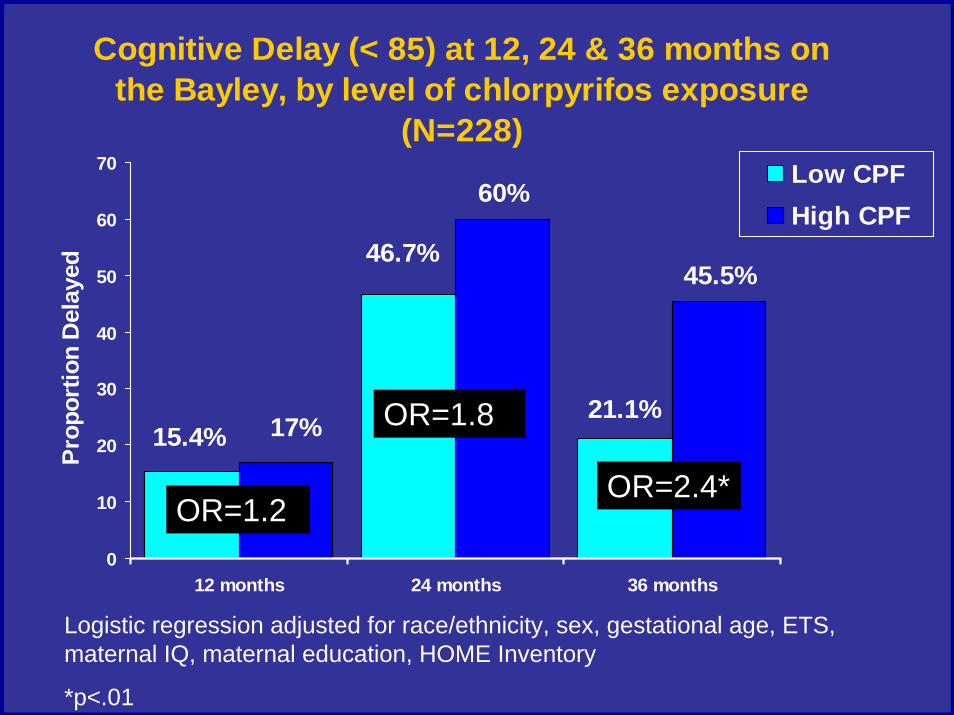
Cognitive Delay (< 85) at 12, 24 & 36 months on the Bayley, by level of chlorpyrifos exposure
(N=228)
21.1%
46.7%
15.4%
45.5%
60%
17%
0
10
20
30
40
50
60
70
12 months 24 months 36 months
Prop
ortio
n D
elay
ed
Low CPFHigh CPF
Logistic regression adjusted for race/ethnicity, sex, gestational age, ETS, maternal IQ, maternal education, HOME Inventory
*p<.01
OR=1.2
OR=1.8
OR=2.4*

Logistic regression models testing effects of chlorpyrifos on adjusted odds of motor delay at 12, 24, and 36 months,
adjusted for race, gender, gestational age, maternal education, maternal IQ, ETS, and home environment (N=228)
Dependent Variable: Psychomotor Delay (PDI <85)
Model 1: 12 months Model 2: 24 months Model 3: 36 months
Variable OR 95% C.I. OR 95% C.I. OR 95% C.I.
Prenatal Exposures:
ETS 0.945 0.42, 2.15 0.771 0.33, 1.80 1.689 0.65, 4.41
Chlorpyrifos 1.883 0.78, 4.53 1.010 0.37, 2.76 4.934 1.78, 13.72
Covariates:
Race/Ethnicity 1.590 0.69, 3.67 0.864 0.36, 2.09 0.545 0.19, 1.53
Gender 0.908 0.42, 1.96 0.737 0.33, 1.63 2.058 0.82, 5.14
Gestational Age (wks) 0.997 0.78, 1.28 0.881 0.68, 1.14 1.005 0.73, 1.39
Maternal IQ 1.010 0.98, 1.04 0.982 0.95, 1.02 1.025 0.99, 1.06
No HS Degree 1.103 0.48, 2.50 1.235 0.54, 2.81 0.369 0.12, 1.13
Home Inventory 0.985 0.92, 1.06 1.010 0.94, 1.09 0.943 0.87, 1.02

Motor Delay (< 85) at 12, 24 & 36 months on the Bayley, by level of chlorpyrifos exposure
(N=228)
7.1%
13.3% 12.1%
31.1%
13%
21.7%
0
10
20
30
40
50
12 months 24 months 36 months
Prop
ortio
n D
elay
ed
Low CPFHigh CPF
Logistic regression adjusted for race/ethnicity, sex, gestational age, ETS, maternal IQ, maternal education, HOME Inventory
**p<.001
OR=1.9 OR=1.0OR=4.9**

Logistic Regression Models Testing Effects of Chlorpyrifos and ETS on the Odds of Behavior Problems at 36 Months, adjusted for Race, Sex, Gestational Age, Maternal Education, IQ, ETS, and Home Environment (N=228)
AttentionProblems
ADHD Problems
Pervasive Developmental
Disorder Problems
OR 95% C.I. 95% C.I. OR 95% C.I.
CPF 11.63 1.82, 74.22 6.30 1.03, 38.42 5.64 1.23, 25.72
Prenatal Exposures
OR
ETS 2.59 0.41, 6.52 7.88 1.17, 53.19 0.72 0.16, 3.29

Possible Mechanisms
• Prenatal CPF exposure has been shown in animals to inhibit acetylcholinesterase, which acts as a neurotropicfactor during brain development1;
• Organophosphates may also disrupt brain development by noncholinergic mechanisms, at doses that cause only minimal acetylcholinesterase inhibition1;
• Unlike classic teratology, in which the greatest sensitivity is seen during the first trimester, the window of vulnerability for organophosphates is likely to extend from the embryonic period into postnatal life;
• Changes may emerge or re-emerge later in development, accompanied by behavioral anomalies
1Slotkin. Cholinergic systems in brain development & disruption by neurotoxicants, nicotine, environmental tobacco smoke, organophosphates. Toxicol ApplPharmacol. 2004; 198:132-151.

Prenatal Postnatal
Birth
Neurogenesis and Migration
Synaptogenesis
Myelination
Gliogenesis
Multiple Mechanisms: A Shifting Target
CPF levels in the home are fairly stable in the short-run, so that it is difficult to pinpoint time of exposure during gestation and the early postnatal period

Summary of Results
1. Prenatal pesticide exposure was associated with a 3.5 to 6-point adjusted mean decrement in 36-month development scores (Bayley MDI and PDI) in a low-income minority sample (sex-dependent? cerebral cortex effects?)
2. This mean decrement resulted in a 2-fold risk of developmental delay (< 80) on the Bayley MDI, and a 5-fold risk of delay on the PDI
3. Prenatal pesticide exposure was associated with significantly increased risk for ADHD problems, Attention problems, and Pervasive Developmental Disorder problems (consequence of reduced serotonergic function?)

Comparison of our results with data from other cohort studies

Virginia Rauh, Robin Wyatt, Frederica Perera
Columbia University
Mary Wolff, Stephanie Engel, Gertrud Berkowitz
Mount Sinai School of Medicine
Brenda Eskenazi, Kim Harley, AsaBradman, Amy Marks
University of California, Berkeley
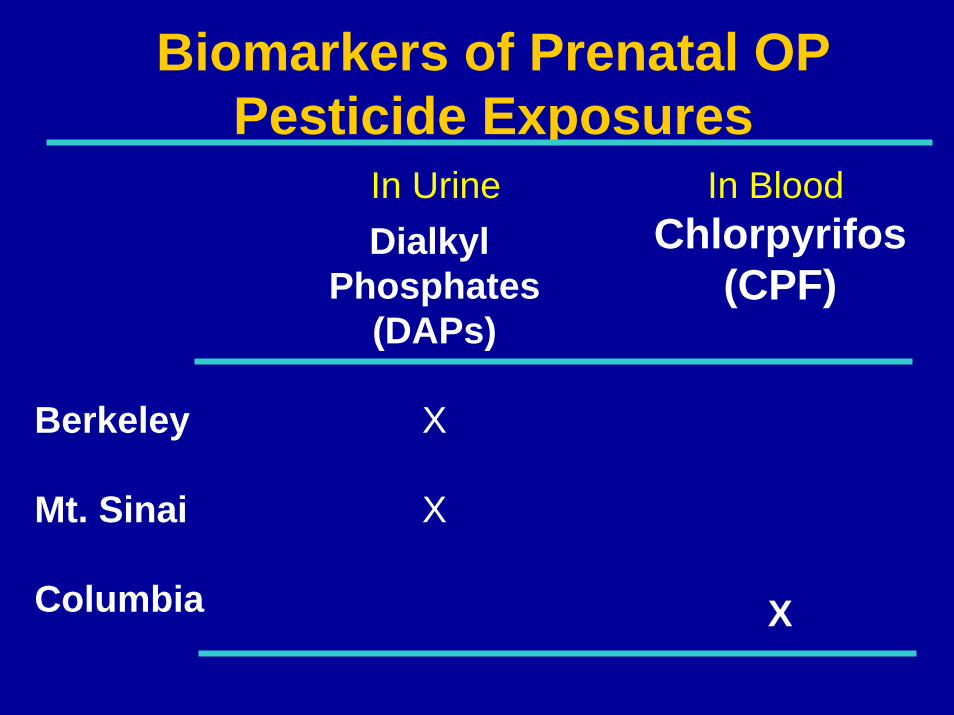
Biomarkers of Prenatal OP Pesticide Exposures
Berkeley
Mt. Sinai
Columbia
Dialkyl Phosphates
(DAPs)
X
X
Chlorpyrifos(CPF)
X
In Urine In Blood

Early Childhood Neurodevelopmental Outcomes
Berkeley
Mt. Sinai
Columbia
Neonatal
X
X
3Y
X
2Y
X
X
X
1Y
X
X
X
6M
X
BayleyBrazelton WPPSI3.5Y
X
5Y
X*
X
* Verbal IQ assessed with PPVT

Early Childhood Neurobehavioral Outcomes
Berkeley
Mt. Sinai
Columbia
Child Behavior Checklist (CBCL)
3Y
X
2Y
X
3.5Y
X

Prenatal OPs and BayleyPsychomotor Development Index
6 Months1 Year2 Years3 Years
--0.10.6--
Berkeley(Log10DAPs)
Adj b
Mt. Sinai(Log10DAPs)
Adj b
-0.7-0.6-1.3--
Columbia(High v. Low CPF)
Adj b
---3.31.2-6.5**
** p <0.05
Eskenazi et al. 2007; Engel et al. in preparation; Rauh et al. 2006

Prenatal OPs and BayleyMental Development Index
6 Months1 Year2 Years3 Years
---1.3-1.9**--
Berkeley(Log10DAPs)
Adj b
Mt. Sinai(Log10DAPs)
Adj b
-1.2-1.3-3.5**--
Columbia(High v. Low CPF)
Adj b
---0.3-1.5-3.3*
* p <0.1 **p <0.05
Eskenazi et al. 2007; Engel et al. in preparation; Rauh et al. 2006

Prenatal Ops and Neuro-Development at 3.5 and 5 Years
WPPSI (3.5 yrs)Performance IQVerbal IQ Full Scale IQ
WPPSI/PPVT (5 yrs)Performance IQVerbal IQ/PPVT Full Scale IQ
Berkeley(Log10DAPs)Adj b (n≈300)
-0.5-3.6**-2.3*
-0.7-6.1** (PPVT)--
* p <0.1; ** p <0.05
Columbia(High v. Low CPF)
Adj b (n=231)
---5.6** (VIQ)-5.1**
Eskenazi et al. in preparation; Engel et al. in preparation
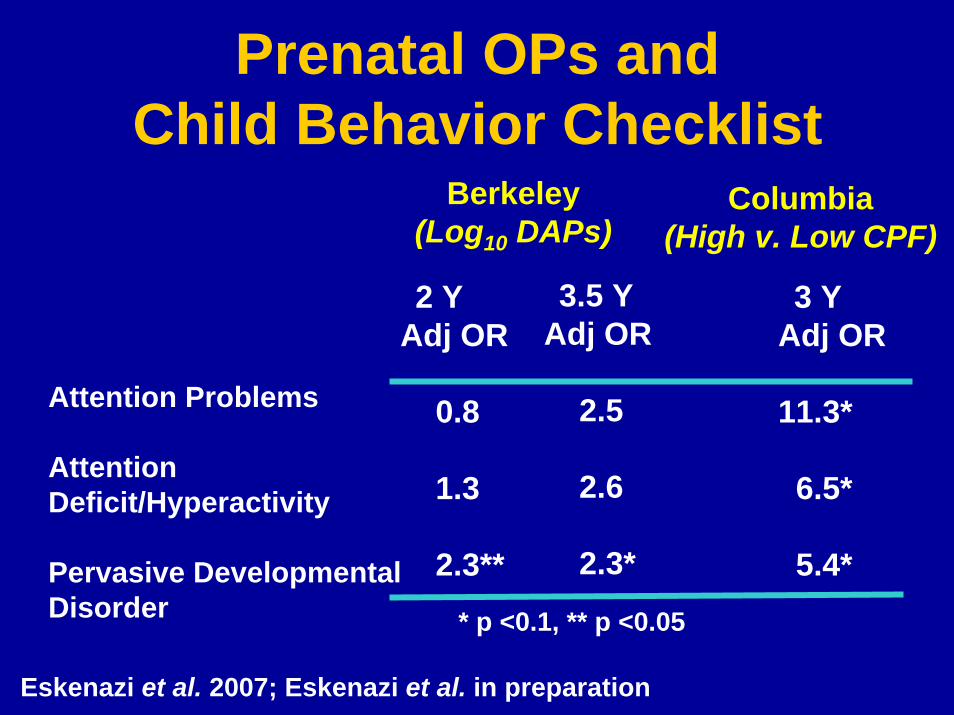
Prenatal OPs and Child Behavior Checklist
Berkeley (Log10 DAPs)
Columbia (High v. Low CPF)
Attention Problems
Attention Deficit/Hyperactivity
Pervasive Developmental Disorder
3 YAdj OR
11.3*
6.5*
5.4*
2 YAdj OR
0.8
1.3
2.3*** p <0.1, ** p <0.05
3.5 YAdj OR
2.5
2.6
2.3*
Eskenazi et al. 2007; Eskenazi et al. in preparation
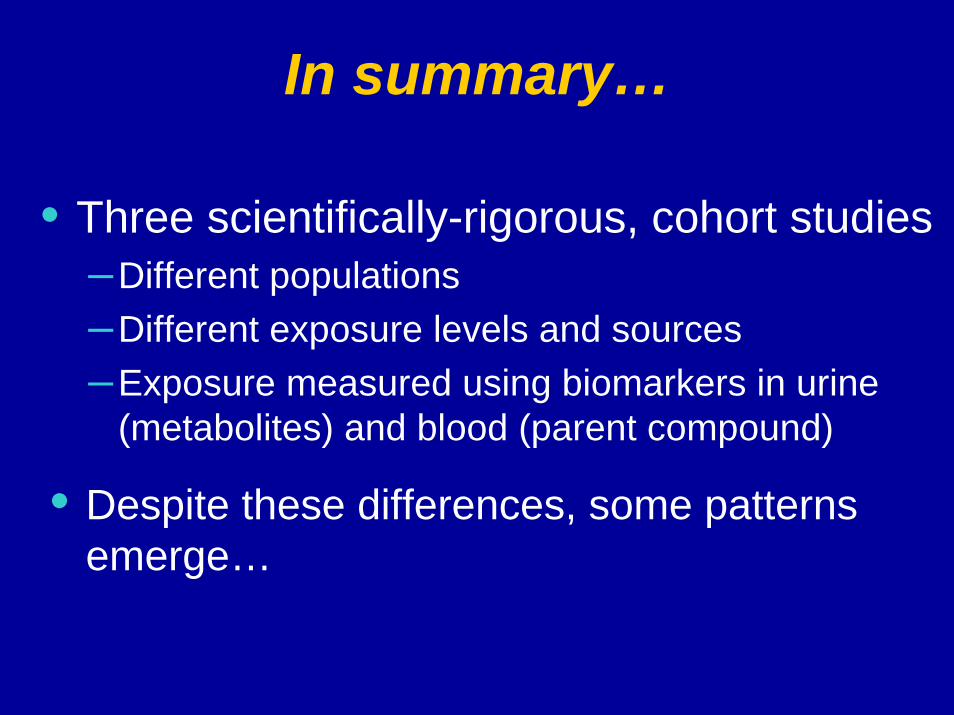
In summary…
• Three scientifically-rigorous, cohort studies–Different populations–Different exposure levels and sources–Exposure measured using biomarkers in urine
(metabolites) and blood (parent compound)
• Despite these differences, some patterns emerge…

In summary…
• Prenatal OP exposure associated with:– Increased odds of abnormal reflexes in
neonates– Poorer mental development in 2 and 3 year
olds– Poorer verbal IQ in 3½ and 5 year olds– Increased odds of pervasive developmental
disorder in 2, 3 and 3½ year olds