discrete element simulation and modeling of dense granular
TRANSCRIPT

Discrete Element Simulation and
Modeling of Dense Granular Flows
Shankar Subramaniam,
Vidyapati, Jin Sun,
Sankaran Sundaresan and Gabriel Tardos
NETL Workshop on Multiphase Flow Science 2010
Department of Mechanical Engineering
Iowa State University
Funding:DE-FG26-07NT43070 UCR

Workshop on Multi phase Flow Science, 2010 Shankar Subramaniam, Iowa State U.
Outline
• Homogeneous shear simulations
– Established intermediate regime map for granular flows
• Couette cell simulations
– Established regime transition observed in experiments
– Database for continuum model assessment
• Silo simulations
– Assessment of existing continuum models
– Comparison with experiments
• Inhomogeneous wall shear simulations
– OP model development and validation

Shankar Subramaniam, Iowa State U.
• Dense flow in hoppers, discharge from bins
− Regime transitions are not sharp
− Need physics-based models for transitional regime
Inertial regime
Rapid flow
Strain rate dependent
Quasi-static regime
Slow flow
Strain rate independent
Intermediate regime
Experiments and DEM simulations reveal that this regime spreads
over a range of volume fraction, friction coefficient and shear rate
Regime transition in granular flows
Workshop on Multi phase Flow Science, 2010

Regime transition in Couette cell
Two distinct regimes present
in the flow: quasi-static and
intermediate
Continuous mode
Experimental setup
Simulation setupx
z
yVx
Vz
g
Vz
Vidyapati, M. Kheiripour, J. Sun, S. Sundaresan, G.I. Tardos and S. Subramaniam, Discrete element simulation of an assembly of spherical particles in Couette device: Comparison with experiments, In preparation, to be submitted to Powder Technology Journal

0.5p
1.0p
• Identified different regimes of
granular flow through DEM
simulations of homogeneous flows
− Identified intermediate regime
between quasi-static and inertial (rapid
flow) regime
− Identification based on power law
dependence of shear stress on shear
rate ( , with 0<n<2)
− Experimental results* also verify the
existence of the intermediate regime
which spans over a range of solid
volume fractions and shear rates
n
*Tardos et al., Powder Technology, vol. 131, 2003
Regime map for granular flows
Workshop on Multi phase Flow Science, 2010

Workshop on Multi phase Flow Science, 2010 Shankar Subramaniam, Iowa State U.
Outline
• Homogeneous shear simulations
– Established intermediate regime map for granular flows
• Couette cell simulations
– Established regime transition observed in experiments
– Database for continuum model assessment
• Silo simulations
– Assessment of existing continuum models
– Comparison with experiments
• Inhomogeneous wall shear simulations
– OP model development and validation
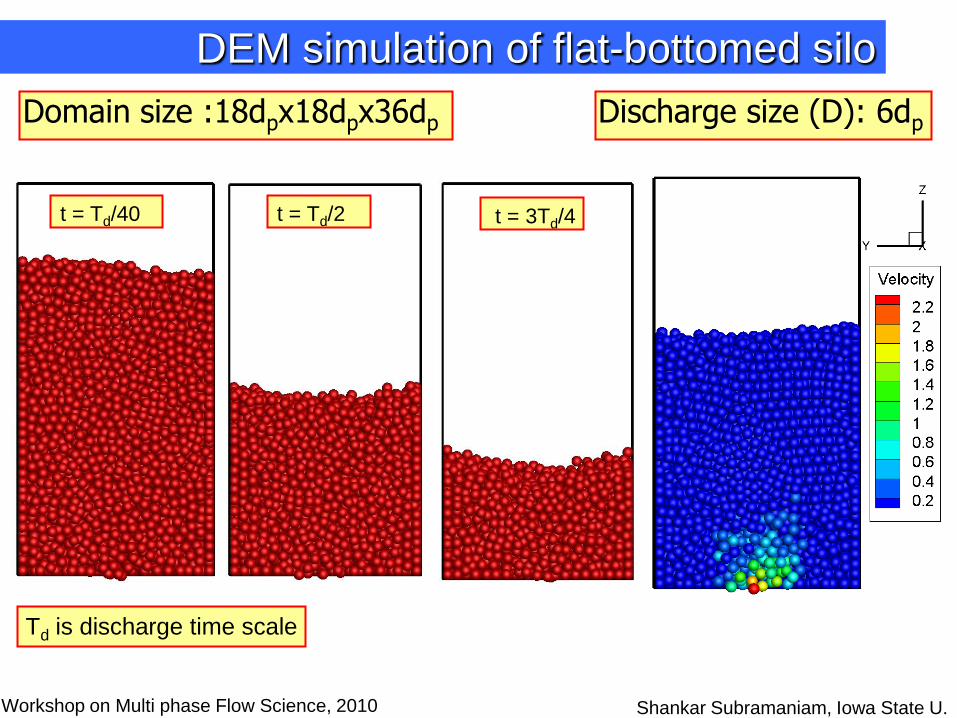
DEM simulation of flat-bottomed silo
Domain size :18dpx18dpx36dp Discharge size (D): 6dp
Td is discharge time scale
Shankar Subramaniam, Iowa State U.Workshop on Multi phase Flow Science, 2010
t = Td/40 t = Td/2 t = 3Td/4

Shankar Subramaniam, Iowa State U.
Effect of domain size on discharge rate
2.5W
D
3.0W
D
2.67W
D
W Hopper widthD Discharge outlet sizedp Particle diameter
– Discharge rate obtained from DEM
study was compared with
Beverloo’s correlation
dp= 0.05 cm, ρ= 2300 kg/m3, D=6dp
– Beverloo’s correlation
= 4.8x10⁻⁴ kg/s
– Current DEM study
= 7.2x10⁻⁴ kg/s
0.5 2.50.58 ( )b pm g D kd
Discharge rate is independent of silo dimensions as long as,
W/D>2.5
Workshop on Multi phase Flow Science, 2010

Snapshot of particle velocity magnitude2 2 2
x y zv v v v
Shankar Subramaniam, Iowa State U.Workshop on Multi phase Flow Science, 2010
t = Td/40 t = 0.85Td
Stagnant zone near corners
DEM is able to capture the experimental observation of formation
of stagnant zone near the silo corner

Effect of friction on discharge rate
Shankar Subramaniam, Iowa State U.
Particle friction Wall friction
Discharge rate is almost independent of the wall friction coefficient
Workshop on Multi phase Flow Science, 2010
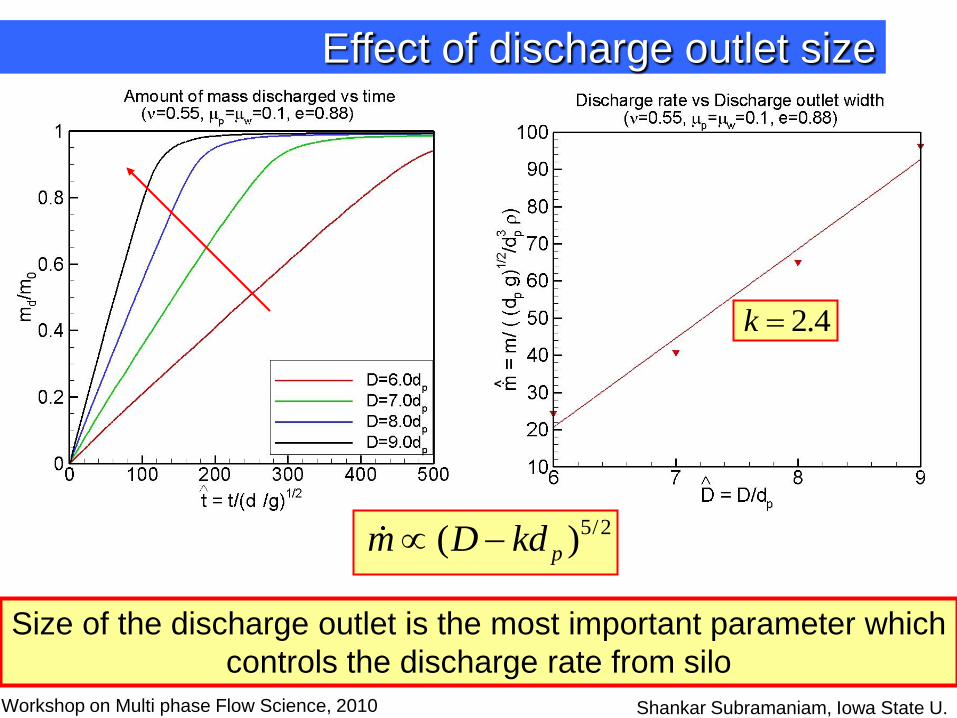
Effect of discharge outlet size
Shankar Subramaniam, Iowa State U.
Size of the discharge outlet is the most important parameter which
controls the discharge rate from silo
Workshop on Multi phase Flow Science, 2010
2.4k
5/2( )pm D kd

Experiments on flat bottom silo
Stress Sensors
•Bottom Plate: view from above
Porosity
Sensor
Radio Transmitters
zz1
zz2
rr2
Shankar Subramaniam, Iowa State U.Workshop on Multi phase Flow Science, 2010

Comparison of normal stresses
Shankar Subramaniam, Iowa State U.Workshop on Multi phase Flow Science, 2010
DEM simulations were able to reproduce the observations found
in experiments
DEM Simulation Experiments
Both studies verify that normal stress on the bottom plate (away from the
discharge outlet) is very small

Comparison of continuum models with DEM
Shankar Subramaniam, Iowa State U.
• Quantitative assessment of continuum
models by comparing with DEM
• 3D MFIX continuum simulations (square
outlet) compared to DEM (circular
outlet)
• Boundary conditions for continuum
simulations
– Partial slip wall boundary conditions (Johnson and
Jackson) for solid phase all vertical walls
– Free slip BC for gas at the wall
– At top and bottom boundary gas pressure was set to
atmospheric, whereas normal continuation condition
(zero gradient) applied for other variables
3D flat-bottomed silo
Workshop on Multi phase Flow Science, 2010

Solid velocity prediction
Shankar Subramaniam, Iowa State U.
Solid velocity predicted by both the continuum models are higher
than the DEM data
Workshop on Multi phase Flow Science, 2010
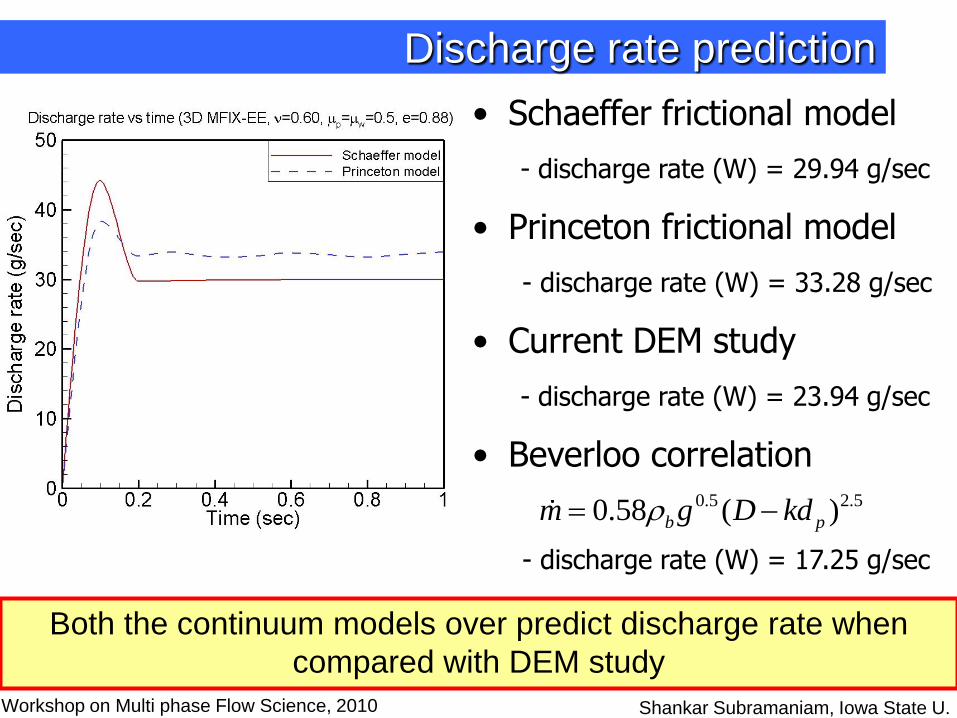
Discharge rate prediction
• Schaeffer frictional model
- discharge rate (W) = 29.94 g/sec
• Princeton frictional model
- discharge rate (W) = 33.28 g/sec
• Current DEM study
- discharge rate (W) = 23.94 g/sec
• Beverloo correlation
- discharge rate (W) = 17.25 g/sec
0.5 2.50.58 ( )b pm g D kd
Both the continuum models over predict discharge rate when
compared with DEM study
Workshop on Multi phase Flow Science, 2010 Shankar Subramaniam, Iowa State U.

Workshop on Multi phase Flow Science, 2010 Shankar Subramaniam, Iowa State U.
Outline
• Homogeneous shear simulations
– Established intermediate regime map for granular flows
• Couette cell simulations
– Established regime transition observed in experiments
– Database for continuum model assessment
• Silo simulations
– Assessment of existing continuum models
– Comparison with experiments
• Inhomogeneous wall shear simulations
– OP model development and validation
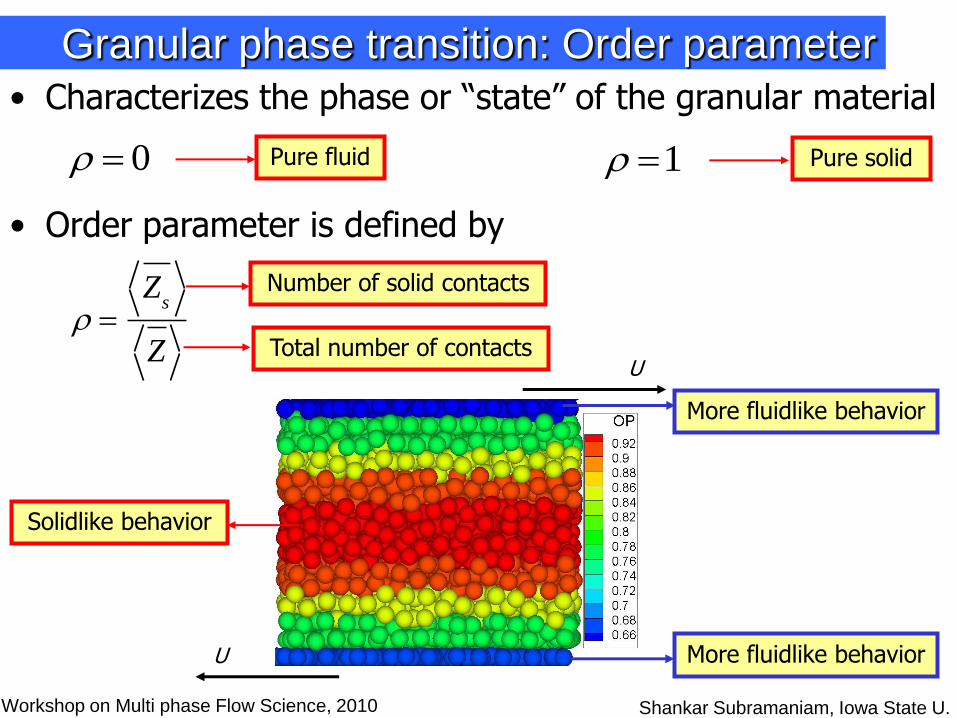
Granular phase transition: Order parameter
Shankar Subramaniam, Iowa State U.
• Characterizes the phase or “state” of the granular material
0 Pure fluid 1 Pure solid
• Order parameter is defined by
Z
s
Z
Number of solid contacts
Total number of contactsU
More fluidlike behavior
Solidlike behavior
U More fluidlike behavior
Workshop on Multi phase Flow Science, 2010

Description of OP model
Shankar Subramaniam, Iowa State U.
• Decomposition of total granular stress
• OP model expresses each of the solidlike and fluidlike
parts in terms of order parameter and total granular
stress tensor
s f
ij ij ij Total Stress = Solidlike stress + Fluidlike Stress
, , ,f
ij of
, , ,s
ij of
(Order Parameter), , f Scale of total granular stress
0
Objective OP Model, Subramaniam Group, Phys. Rev. E (2005)
Workshop on Multi phase Flow Science, 2010

New model coefficients from 3D DEM data
Shankar Subramaniam, Iowa State U.
Error incurred in both models < 11%
Linear Model is as good as nonlinear version
Refined OP Model: Linear coefficients from 3D DEM data
Advantage: Total granular stress can be inverted from solidlike and fluidlike stress relations
Linear Model
Model coefficient remains close to zero
Nonlinear Model

OP constitutive model specification
Shankar Subramaniam, Iowa State U.
• To complete the OP constitutive model specification
− Fluidlike stress is taken from kinetic theory of granular flows
f
ijσ KTGF
• Need the order parameter and granular temperature
− Solved transport equation for order parameter (generic Ginzburg
Landau equation*)
− Solved pseudo thermal energy (PTE) equation
• With new model coefficients and fluid component of the
total stress (from KTGF), the ROP-KT model can predict
total granular stress
*Volfson et al., Phys. Rev. Lett., vol. 90, 254301 (2003)
Workshop on Multi phase Flow Science, 2010

Solution for order parameter
• Order parameter was obtained by solving generic
Ginzburg-Landau (GL) equation
2 ,D
D FDt
2 2 2 2
* * *, 1 2 exp ( )F A
* *0.6, 25, and 0.26A
• Solution of GL equation requires the knowledge of
diffusion coefficient and proper boundary conditions for
the order parameter
• Diffusion coefficient was calculated by using two different methods
− From mean square displacement (MSD) of enduring contacts
− From velocity autocorrelation function
Shankar Subramaniam, Iowa State U.Workshop on Multi phase Flow Science, 2010

Extraction of diffusion coefficient: MSD • Diffusion coefficient was approximated by calculating the
MSD of “enduring contacts” and use of Einstein relation
2
2
1
10
cNi i
c c
ic
r t X t XN
Shankar Subramaniam, Iowa State U.
Cross flow directions
Cross flow directions
Workshop on Multi phase Flow Science, 2010
Diffusion coefficient is anisotropic with largest component along
direction of mean motion

Diffusion coefficient: Velocity autocorrelation
• Diffusion tensor can also be determined using velocity
autocorrelation function (VACF)
1/2
2 2
ij i j ijD u u 0
ij ij s ds
1/2 1/22 2
i j
ij
i j
u t u t ss
u u
x component Y and z component
Shankar Subramaniam, Iowa State U.Workshop on Multi phase Flow Science, 2010
Both MSD and VACF predict the largest diffusion in along
direction of mean motion within maximum difference of 18%
DMSD DVACF % diff.
0.45 1.046 1.242 18.65
0.53 1.017 1.176 15.60
0.57 1.012 1.133 11.85
0.60 1.007 1.093 8.53
0.62 1.005 1.052 4.63
% difference in diffusion coefficient prediction

ROP model performance, inertial regime
Fluidlike Shear Stress
Non dimensional shear rate
Non d
imensi
onal sh
ear
stre
ss
Total Shear Stress
Non dimensional shear rate
Non d
imensi
onal sh
ear
stre
ss
Shankar Subramaniam, Iowa State U.Workshop on Multi phase Flow Science, 2010
Refined OP model with KT (ROP-KT) performs well for all volume
fraction and friction coefficient in the inertial regime
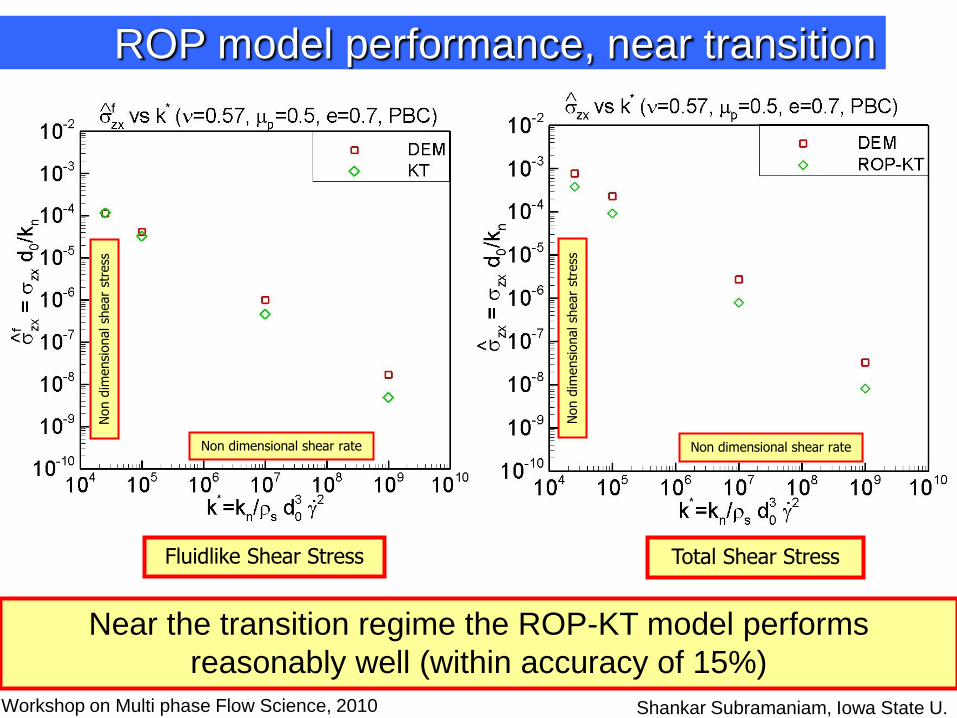
ROP model performance, near transition
Fluidlike Shear Stress
Non dimensional shear rate
Non d
imensi
onal sh
ear
stre
ss
Total Shear Stress
Non dimensional shear rate
Non d
imensi
onal sh
ear
stre
ss
Workshop on Multi phase Flow Science, 2010 Shankar Subramaniam, Iowa State U.
Near the transition regime the ROP-KT model performs
reasonably well (within accuracy of 15%)

ROP model performance, intermediate regime
Fluidlike Shear Stress Total Shear Stress
Shankar Subramaniam, Iowa State U.
Non dimensional shear rate
Non d
imensi
onal sh
ear
stre
ss
Non d
imensi
onal sh
ear
stre
ss
Non dimensional shear rate
dependencen
Workshop on Multi phase Flow Science, 2010
In the intermediate regime the ROP-KT model is not able to
predict the correct trends of shear stress with shear rate

% contribution of the total stress
Shankar Subramaniam, Iowa State U.
Contribution from solidlike stress is more than 95% in the dense regime
In dense regime the contribution from the solidlike stress
dominates over the fluidlike stress contribution
Workshop on Multi phase Flow Science, 2010

Shankar Subramaniam, Iowa State U.
Decomposition of stresses
Contact (virial) part of the stress exhibits dependence, while
streaming part exhibits dependence in intermediate regime
n
2
dependence2
dependencen
Contact (virial) stress Streaming stress
Workshop on Multi phase Flow Science, 2010

Shankar Subramaniam, Iowa State U.
Decomposition of stresses
Both solidlike and fluidlike part exhibits dependence on
shear rate in the intermediate regime
n
dependencen
Fluidlike stress
dependencen
Solidlike stress
Workshop on Multi phase Flow Science, 2010

Workshop on Multi phase Flow Science, 2010 Shankar Subramaniam, Iowa State U.
Outline
• Homogeneous shear simulations
– Established intermediate regime map for granular flows
• Couette cell simulations
– Established regime transition observed in experiments
– Database for continuum model assessment
• Silo simulations
– Assessment of existing continuum models
– Comparison with experiments
• Inhomogeneous wall shear simulations
– OP model development and validation

Current Efforts
• Coupling the ROP model with the “Dissipative plasticity
model” developed by Princeton team for the solidlike
contribution of the total granular stress in dense regime
• New formulation of the free energy density function to
accommodate the third stable value of the order
parameter at the steady state
Workshop on Multi phase Flow Science, 2010 Shankar Subramaniam, Iowa State U.
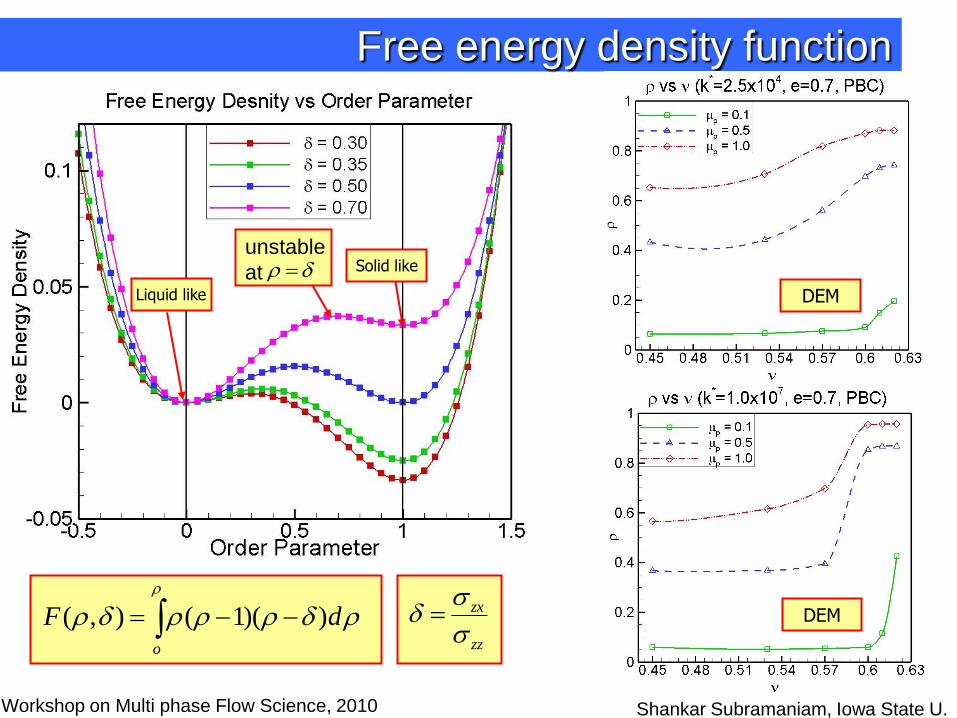
Free energy density function
Liquid like
Solid likeunstable
at
( , ) ( 1)( )o
F d
zx
zz
Workshop on Multi phase Flow Science, 2010 Shankar Subramaniam, Iowa State U.
DEM
DEM