discrepancy between actual and estimated speeds of drivers in presence of child pedestrians
DESCRIPTION
Discrepancy between actual and estimated speeds of drivers in presence of child pedestrians. 學生:董瑩蟬. Purpose. This paper aim investigated the driver estimated vehicles speed different between children present and no children present. - PowerPoint PPT PresentationTRANSCRIPT

Discrepancy between actual and estimated speeds of drivers in presence of child pedestrians
學生:董瑩蟬
Purpose
• This paper aim investigated the driver estimated vehicles speed different between children present and no children present.
• Used observed investigated the driver’s speed and used questionnaire collect the driver estimated speed. They want to know the different between measure and estimated speed.
Reference
• Some studies found a strong association between vehicle speed and injury risk. (Stevenson et al.,1995; Roberts et al.,1995)
• The vehicle speed 40 Kph were ca 25% fatal crashes, and 50 kph rises to 58%. (Anderson et al.,1997)

Reference
• The age had impact on the driver behavior, the pedestrians appeared effect avoidance action. (Howarth et al.,1980)
• The studies showed when an adult pedestrian presence that the speed were significantly higher than no pedestrian present. And present a children pedestrian no significant difference in speed. (Thomson et al.,1985)
Method-1
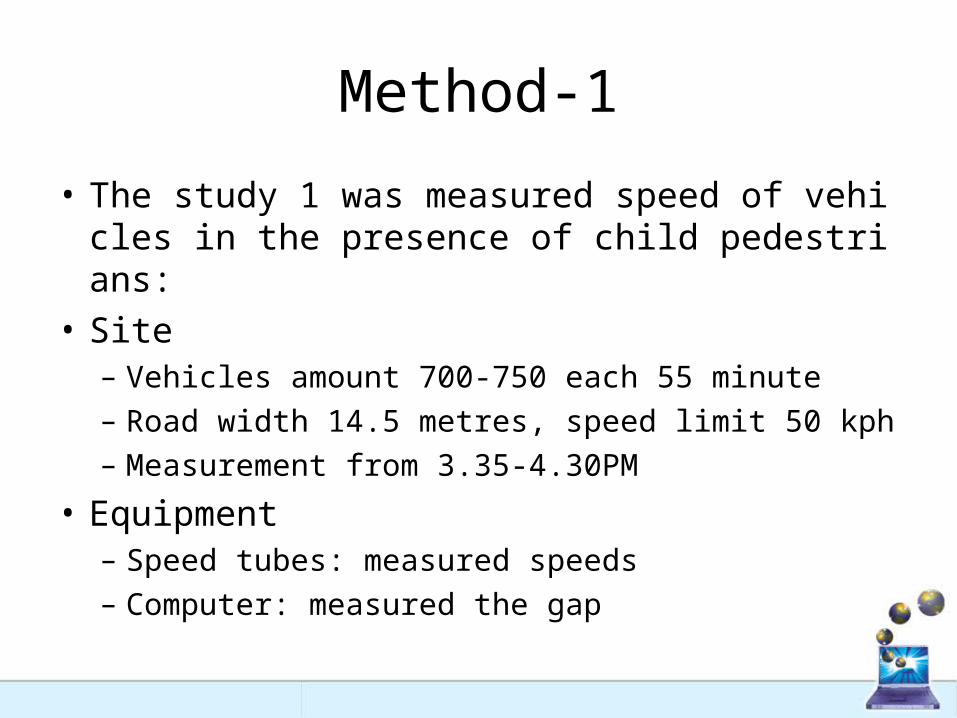
• The study 1 was measured speed of vehicles in the presence of child pedestrians:
• Site– Vehicles amount 700-750 each 55 minute
– Road width 14.5 metres, speed limit 50 kph
– Measurement from 3.35-4.30PM
• Equipment – Speed tubes: measured speeds
– Computer: measured the gap
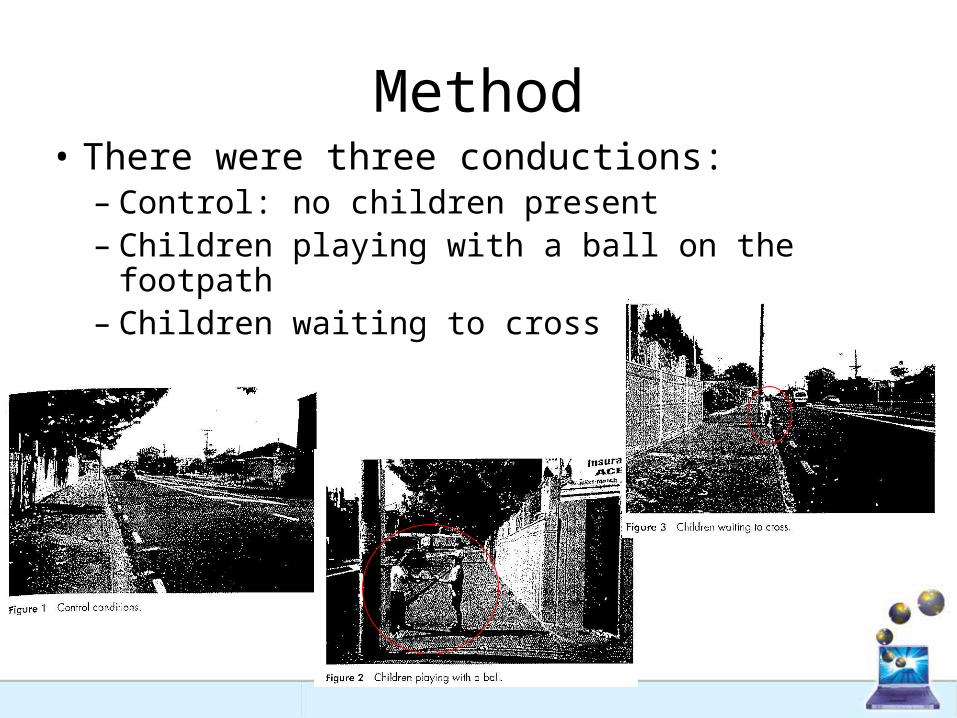
Method• There were three conductions:
– Control: no children present– Children playing with a ball on the footpath– Children waiting to cross

Method• Participant
– Total of 1446 vehicle speed recorded – The conditions were run in five minute slots in
the following order: 1,2,1,3,1,2,3,1,2,1,3
• Study 2: driver’s perceptions of the speed they travel past children– The question also record participants’ gender and
age. There are 67 male and 26 female. Age group include 28 person16-25 years, and 47 was 26-45 years, 18 aged was more than 46 years.
– The questionnaire was delivered to 100 drivers

Method• The questionnaires was include five
question:– In normal traffic conditions during the day or
weekend– When there are children playing with a ball on
the footpath– When there are children waiting to cross the
road– When there is an elderly pedestrian in the
middle of the road– When there is heavy traffic and a lot of cars
pulling in and out
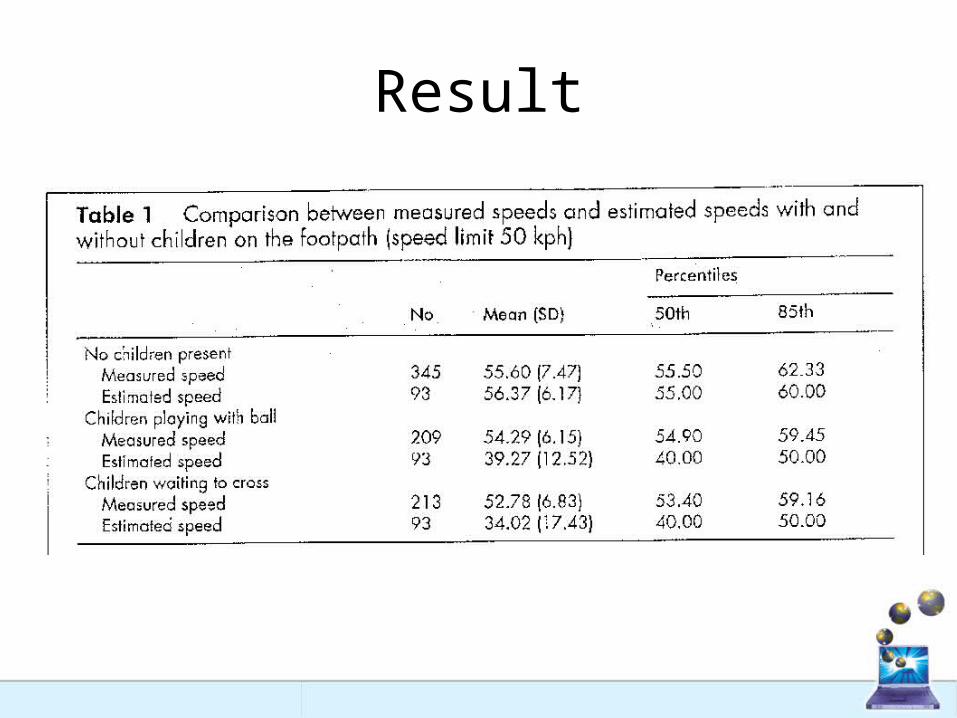
Result

Result
• The three conduction was significant different on vehicles speed. F(2,764)=10.89,P<0.001
• The questionnaire version was significant different on speed estimate. F(3,79)=3.22,P<0.05
• The measure speed was 42.76 significant higher than estimated 35.38 on the children playing with a ball. F(1,81)=4.21, P<0.05
Result• The no children pedestrian present was no
significant different between measure speed and estimated speed.
• There were different between measure speed and estimated speed in the children playing with a ball. F(1,300)=195.34,P<0.001
• There were different between measure speed and estimated speed on waiting to cross. F(1,304)=183.12,P<0.001

Discussion
• The similar result found that the children present the driver’s speed may minimal reductions. (Varhelyi. A, 1998; Thomson SJ et al.,1985.
• The previous studies showed that a large number of pedestrian tend to slow drivers down. (Varhelyi. A, 1998; Thomson SJ et al.,1985; Katz A et al.,1975)
Discussion
• The was evidence that driver has different response between children present and no pedestrian. The result Similar on pedestrian judging the speed and distance of approaching. (Connelly ML et a.,1998; Demetre JD et al., 1992)
Conclusion
• The children present effect driver’s speed.
• The measure speed was 42.76 higher than estimated 35.38 on the children playing with a ball.
• The estimated speed and estimated speed has different on children playing with a ball and waiting to cross.