discovery of two millisecond pulsars in fermi sources … · the astrophysical journal, 732:47...
TRANSCRIPT

HAL Id: in2p3-00605514http://hal.in2p3.fr/in2p3-00605514
Submitted on 5 Jul 2017
HAL is a multi-disciplinary open accessarchive for the deposit and dissemination of sci-entific research documents, whether they are pub-lished or not. The documents may come fromteaching and research institutions in France orabroad, or from public or private research centers.
L’archive ouverte pluridisciplinaire HAL, estdestinée au dépôt et à la diffusion de documentsscientifiques de niveau recherche, publiés ou non,émanant des établissements d’enseignement et derecherche français ou étrangers, des laboratoirespublics ou privés.
Discovery of two millisecond pulsars in Fermi sourceswith the Nancay Radio Telescope
Ismaël Cognard, Lucas Guillemot, T. J. Johnson, D. A. Smith, C. Venter, A.K. Harding, M. T. Wolff, C. C. Cheung, D. Donato, A.A. Abdo, et al.
To cite this version:Ismaël Cognard, Lucas Guillemot, T. J. Johnson, D. A. Smith, C. Venter, et al.. Discovery of two mil-lisecond pulsars in Fermi sources with the Nancay Radio Telescope. Astrophysical Journal, AmericanAstronomical Society, 2011, 732, 47 (11 p.). <10.1088/0004-637X/732/1/47>. <in2p3-00605514>
The Astrophysical Journal, 732:47 (11pp), 2011 May 1 doi:10.1088/0004-637X/732/1/47C© 2011. The American Astronomical Society. All rights reserved. Printed in the U.S.A.
DISCOVERY OF TWO MILLISECOND PULSARS IN FERMI SOURCES WITH THENANCAY RADIO TELESCOPE
I. Cognard1, L. Guillemot
2, T. J. Johnson
3,4, D. A. Smith
5, C. Venter
6, A. K. Harding
3, M. T. Wolff
7, C. C. Cheung
8,20,
D. Donato4,9
, A. A. Abdo8,20
, J. Ballet10
, F. Camilo11
, G. Desvignes12,13
, D. Dumora5, E. C. Ferrara
3, P. C. C. Freire
2,
J. E. Grove7, S. Johnston
14, M. Keith
14, M. Kramer
2,15, A. G. Lyne
15, P. F. Michelson
16, D. Parent
17,20, S. M. Ransom
18,
P. S. Ray7, R. W. Romani
16, P. M. Saz Parkinson
19, B. W. Stappers
15, G. Theureau
1, D. J. Thompson
3,
P. Weltevrede15
, and K. S. Wood7
1 Laboratoire de Physique et Chimie de l’Environnement et de l’Espace LPC2E CNRS-Universite d’Orleans, F-45071 Orleans Cedex 02, and Station deradioastronomie de Nancay, Observatoire de Paris, CNRS/INSU, F-18330 Nancay, France; [email protected]
2 Max-Planck-Institut fur Radioastronomie, Auf dem Hugel 69, 53121 Bonn, Germany; [email protected] NASA Goddard Space Flight Center, Greenbelt, MD 20771, USA; [email protected]
4 Department of Physics and Department of Astronomy, University of Maryland, College Park, MD 20742, USA5 Universite Bordeaux 1, CNRS/IN2p3, Centre d’Etudes Nucleaires de Bordeaux Gradignan, 33175 Gradignan, France
6 North-West University, Potchefstroom Campus, Potchefstroom 2520, South Africa7 Space Science Division, Naval Research Laboratory, Washington, DC 20375, USA
8 National Research Council, National Academy of Sciences, Washington, DC 20001, USA9 Center for Research and Exploration in Space Science and Technology (CRESST) and NASA Goddard Space Flight Center, Greenbelt, MD 20771, USA
10 Laboratoire AIM, CEA-IRFU/CNRS/Universite Paris Diderot, Service d’Astrophysique, CEA Saclay, 91191 Gif sur Yvette, France11 Columbia Astrophysics Laboratory, Columbia University, New York, NY 10027, USA
12 Department of Astronomy, University of California, Berkeley, Berkeley, CA 94720-3411, USA13 Radio Astronomy Laboratory, University of California, Berkeley, Berkeley, CA 94720, USA
14 Australia Telescope National Facility, CSIRO, Epping, NSW 1710, Australia15 Jodrell Bank Centre for Astrophysics, School of Physics and Astronomy, The University of Manchester, M13 9PL, UK
16 W. W. Hansen Experimental Physics Laboratory, Kavli Institute for Particle Astrophysics and Cosmology, Department of Physics and SLAC NationalAccelerator Laboratory, Stanford University, Stanford, CA 94305, USA
17 College of Science, George Mason University, Fairfax, VA 22030, USA18 National Radio Astronomy Observatory (NRAO), Charlottesville, VA 22903, USA
19 Santa Cruz Institute for Particle Physics, Department of Physics and Department of Astronomy and Astrophysics, University of California at Santa Cruz,Santa Cruz, CA 95064, USA
Received 2010 November 9; accepted 2011 February 20; published 2011 April 14
ABSTRACT
We report the discovery of two millisecond pulsars in a search for radio pulsations at the positions of Fermi-Large Area Telescope sources with no previously known counterparts, using the Nancay Radio Telescope. Thetwo millisecond pulsars, PSRs J2017+0603 and J2302+4442, have rotational periods of 2.896 and 5.192 ms andare both in binary systems with low-eccentricity orbits and orbital periods of 2.2 and 125.9 days, respectively,suggesting long recycling processes. Gamma-ray pulsations were subsequently detected for both objects, indicatingthat they power the associated Fermi sources in which they were found. The gamma-ray light curves and spectralproperties are similar to those of previously detected gamma-ray millisecond pulsars. Detailed modeling of theobserved radio and gamma-ray light curves shows that the gamma-ray emission seems to originate at high altitudesin their magnetospheres. Additionally, X-ray observations revealed the presence of an X-ray source at the positionof PSR J2302+4442, consistent with thermal emission from a neutron star. These discoveries along with thenumerous detections of radio-loud millisecond pulsars in gamma rays suggest that many Fermi sources with noknown counterpart could be unknown millisecond pulsars.
Key words: gamma rays: general – pulsars: general – pulsars: individual (J2017+0603, J2302+4442)
Online-only material: color figures
1. INTRODUCTION
During its first year of activity, the Large Area Telescope(LAT) aboard the Fermi Gamma-Ray Space Telescope (Atwoodet al. 2009) firmly established millisecond pulsars (MSPs) asbright sources of gamma rays, with the detection of pulsedemission from at least nine Galactic disk MSPs above 0.1 GeV(Abdo et al. 2009a, 2009d, 2010b). Normal pulsars had alreadybeen established as an important class of gamma-ray sourcesby previous experiments (see, e.g., Thompson et al. 1999).The First Fermi Catalog of gamma-ray pulsars (Abdo et al.2010f) tabulated the properties of 46 pulsars, including 8 MSPs.In addition, the LAT has observed gamma-ray emission from
20 Resident at Naval Research Laboratory, Washington, DC 20375, USA.
several globular clusters (GCs) with spectral properties that areconsistent with those of populations of MSPs (Abdo et al. 2009c,2010a) and thus the flux is due to the combined MSPs in thecluster.
MSPs are rapidly rotating neutron stars (with rotationalperiods of a few tens of milliseconds) with very small spin-down rates (P < 10−17). They are thought to have acquired theirhigh rotational rate by accretion of matter, and thereby transferof angular momentum, from a binary companion (Bisnovatyi-Kogan & Komberg 1974; Alpar et al. 1982), which is nowsupported by observational evidence (Archibald et al. 2009).About 10% of the ∼2000 known pulsars are MSPs, eitherin the Galactic disk or in GCs (Manchester et al. 2005).Estimates for the Galactic population of MSPs range from40,000 to 90,000 objects (see Lorimer 2008, and references
1

The Astrophysical Journal, 732:47 (11pp), 2011 May 1 Cognard et al.
therein). A small fraction of these have large enough spin-downluminosities E and small enough distances d to be detectableby the LAT. The minimum
√E/d2 of pulsars in the Fermi
First Pulsar Catalog is 0.1% of the value for Vela. Furthermore,the sparsity of the photons recorded by the LAT makes MSPsmuch easier to discover at radio wavelengths than in gammarays (for a discussion of blind period searches of gamma-raypulsars, see, e.g., Abdo et al. 2009b, and references therein).However, when blindly searched in the radio band, the MSPsare difficult targets to detect. On one hand they are faint sourcesso that their detection generally requires long exposures withlarge radio telescopes. In addition, most MSPs are in binarysystems so the orbital motions need to be taken into accountwhen searching for pulsations, which introduces additionalparameter combinations, and therefore makes data analysescomputationally intensive and searches less sensitive than fornormal pulsars.
Radio emission from pulsars is also affected by pulse scat-tering induced by the ionized component of the interstellarmedium, with a characteristic timescale τs ∝ f −4d2, where f isthe observing frequency and d is the pulsar distance (Lorimer& Kramer 2005). The short rotational periods of MSPs thusintroduce an observational bias favoring nearby objects. As aconsequence of their proximity and their age, they are morewidely distributed in Galactic latitude than normal pulsars.
The Fermi-LAT First Source Catalog (1FGL; Abdo et al.2010c) has 1451 sources, including 630 which are not clearlyassociated with counterparts known at other wavelengths. Thedetection of nine radio-loud MSPs in gamma rays stronglysuggests that a fraction of high Galactic latitude unassociatedFermi sources must be unknown MSPs. Such a source ofcontinuous gamma-ray emission can be deeply scanned forpulsations at radio wavelengths, resulting in MSP discoveries,provided their radio emission beam is pointing toward the Earth.Such searches have been conducted at several radio telescopesaround the world, yielding positive results (see, e.g., M. Kerret al. 2011, in preparation; Keith et al. 2011; Ransom et al. 2011;M. S. E. Roberts et al. 2011, in preparation).
Most high Galactic latitude gamma-ray sources are blazarsand other active galactic nuclei (AGNs). Fortunately, distinctiveindicators of gamma-ray emission from a pulsar are the shapeof the spectral emission and the lack of flux variability ingamma rays. Gamma-ray pulsars indeed exhibit sharp cutoffsat a few GeV (Abdo et al. 2010f), while blazars are known toemit above 10 GeV with no sharp energy cutoff (flat spectrumradio quasars are well described by broken power-law spectra;Abdo et al. 2010d). Also, known gamma-ray pulsars are steadysources, whereas blazars show variations of flux over time (Abdoet al. 2010c). In this exploratory study, we limited our sourcediscrimination criterion to spectral shapes. As suggested byStory et al. (2007), follow-up radio searches of Fermi sourceshaving hard spectra with cutoffs should yield discoveries of newMSPs. Gamma-ray variability will be exploited in future studies.
In this article, we present the observations of pulsar candidatesmade at the Nancay Radio Telescope that led to the discovery ofthe MSPs J2017+0603 and J2302+4442 (Section 2). Followingthe detections, we made radio timing observations at the Nancay,Jodrell Bank, and Green Bank telescopes (see Sections 3.1 and4.1). The initial ephemerides for these 2.896 and 5.192 mspulsars in low-eccentricity orbits around light companionsallowed us to detect gamma-ray pulsations in the data recordedby the LAT. In Sections 3.3, 4.3, and 5.2, we discuss the gamma-ray properties of the two MSPs and compare the measured
light curves and spectral properties with those of previouslyobserved gamma-ray MSPs. We finally present results of radioand gamma-ray light curve modeling in the context of theoreticalmodels of emission in the magnetosphere in Section 5.1.
2. SEARCH OBSERVATIONS
The list of 1FGL catalog sources searched for pulsationswith the Nancay Radio Telescope was constructed using thefollowing criteria. The radio search was based on a preliminarylist of Fermi-LAT sources used internally by the instrumentteam. The selection described here is the same, but was appliedto the 1FGL catalog and yielded the same targets. We firstremoved gamma-ray sources associated with known objects.Sources below −39◦ in declination were rejected, as theyare not observable with the telescope. Sources with Galacticlatitudes |b| < 3◦ were excluded, being more likely affected byradio pulse scattering and also being less accurately localizedin gamma rays because of the intense diffuse gamma-raybackground at low Galactic latitudes (Abdo et al. 2010c). TheNancay beam has a width at half maximum of 4′ in rightascension; therefore, we applied a conservative cut by requiringthe semimajor axis of the gamma-ray source 95% confidenceellipse to be less than 3′. Finally, we selected objects with spectradeviating from simple power laws, i.e., showing evidence for acutoff, and therefore likely pointing to gamma-ray pulsars. Forthat we excluded sources with curvature indices below 11.34,the limit at which spectra start departing from simple power laws(Abdo et al. 2010c). Details on the determination of positionsand curvature indices of 1FGL sources can be found in Abdoet al. (2010c).
From these selection criteria we obtained a list of sixsources. Four of them, 1FGL J0614.1−3328, J1231.1−1410,J1311.7−3429, and 1FGL J1942.7+1033, have been searchedfor pulsations with the Green Bank and Effelsberg radio tele-scopes, and radio pulsars have been detected in the first twosources. The results of these searches are reported elsewhere(Ransom et al. 2011; E. Barr et al. 2011, in preparation). Wecarried out radio observations at the Nancay Radio Telescopeof the other two sources in this list, 1FGL J2017.3+0603 andJ2302.8+4443, using the modified Berkeley-Orleans-Nancay(BON) instrumentation (Theureau et al. 2005; Cognard &Theureau 2006) at 1.4 GHz. Instead of doing the usual co-herent dedispersion of the signal, the code was modified to geta 512 × 0.25 MHz incoherent filter bank sampled every 32 μs.The very first data samples were used to determine an amplitudescaling factor, and total intensity is recorded as a four-bit value.Observations were usually one hour long, mainly limited by thefact that Nancay is a meridian telescope.
Data were searched for a periodic dispersed signal using thePRESTO package (Ransom et al. 2002). After the standard RFI-excision procedure, a total of 1959 dispersion measure (DM)values up to 1244 pc cm−3 were chosen to dedisperse the data.Searches for periodicity were done using the harmonic summingmethod (up to eight harmonics). We also searched the data forsingle pulses, and did not find any.
An observation of 1FGL J2302.8+4443 performed on 2009November 4 revealed a candidate with a period of 5.192 ms anda DM of 13.4 pc cm−3. Confirmation observations scheduled atNancay and Green Bank (at 350 MHz) later firmly establishedthis new MSP. A week after that first discovery, a secondcandidate in 1FGL J2017.3+0603 with a period of 2.896 msand DM of 23.9 pc cm−3 was also confirmed with subsequentNancay and Green Bank Telescope observations as well as
2

The Astrophysical Journal, 732:47 (11pp), 2011 May 1 Cognard et al.
Pulse Phase0 0.2 0.4 0.6 0.8 1 1.2 1.4 1.6 1.8 2
Rad
io F
lux Nançay 1.4 GHz
Cou
nts
10
20
30
40
50
60 E > 0.1 GeV
Cou
nts
5
10
15
20
25
30
35 0.1 GeV < E < 1 GeV
Cou
nts
510152025303540
E > 1 GeVPSR J2017+0603
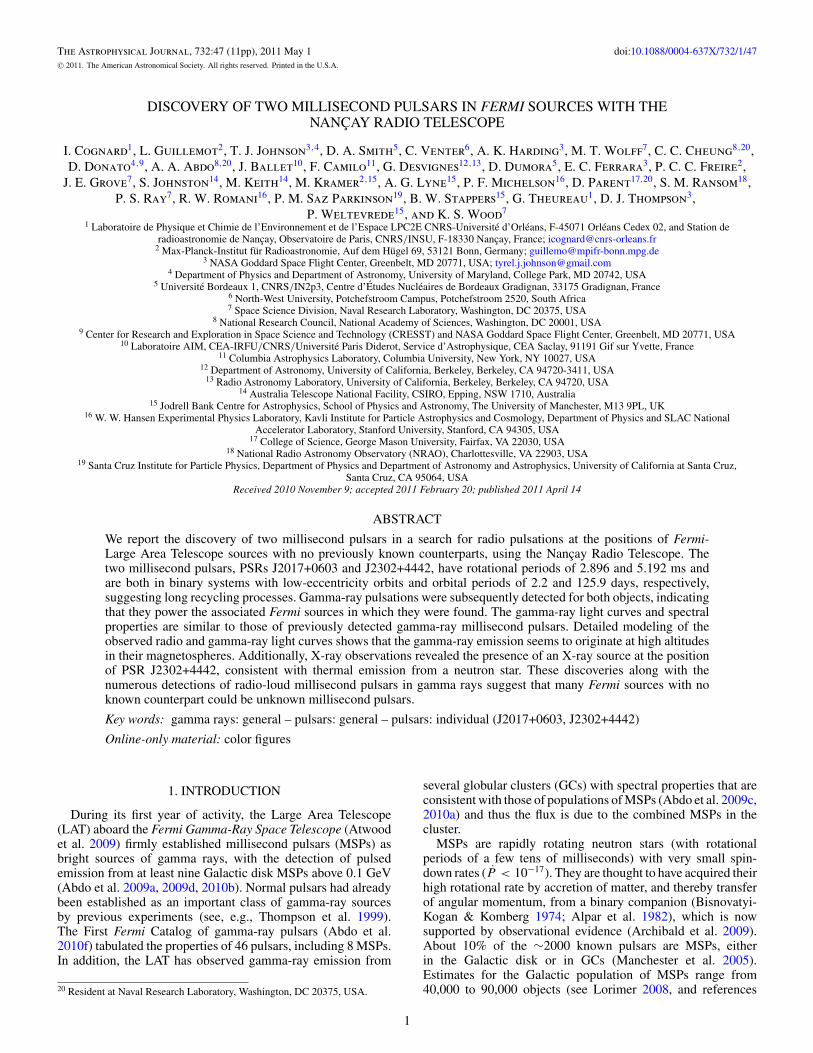
Figure 1. Radio and gamma-ray light curves of PSR J2017+0603. The bottompanel shows an integrated radio profile at 1.4 GHz with 2048 bins per rotation,recorded with the Nancay Radio Telescope, based on 16.2 hr of coherentlydedispersed observations. The top three panels show light curves in differentenergy bands (labeled) for gamma-ray events within 0.◦8 of the pulsar position,with 50 bins per rotation. Two full rotations are shown for clarity. See Section 3.3for details on the determination of background levels, shown by horizontaldashed lines.
(A color version of this figure is available in the online journal.)
with old observations made at the Arecibo telescope. In bothcases, substantial variations of the pulsar rotational periodwere observed, indicating orbital motions, as discussed inSections 3.1 and 4.1.
Integrated radio profiles at 1.4 GHz are presented in Figures 1and 2. The pulse profile of PSR J2017+0603 is complex andexhibits at least five components. A sharp peak is observed,making PSR J2017+0603 a promising addition to pulsar timingarray programs. The radio profile of PSR J2302+4442 is broad,with at least four pulsed components, three of which form afirst structure whose midpoint is separated by ∼0.6 rotationfrom the fourth component. The mean flux density averagedover all observations for the two pulsars was determined usinga calibrated pulse noise diode fired for 10 s before eachobservation (see Theureau et al. 2011 for a description ofradio flux measurements with the Nancay Radio Telescope).PSR J2017+0603 presents a mean flux density at 1.4 GHz of0.5 ± 0.2 mJy, while PSR J2302+4442 is brighter at 1.2 ±0.4 mJy, both being typical values for MSPs.
3. PSR J2017+0603
3.1. Timing Observations
After the initial discovery of PSR J2017+0603, timing ob-servations were undertaken at the Nancay Radio Telescope and
Pulse Phase0 0.2 0.4 0.6 0.8 1 1.2 1.4 1.6 1.8 2
Rad
io F
lux Nançay 1.4 GHz
Cou
nts
20
40
60
80
100
120 E > 0.1 GeV
Cou
nts
51015202530354045
0.1 GeV < E < 1 GeV
Cou
nts
1020304050607080 E > 1 GeVPSR J2302+4442
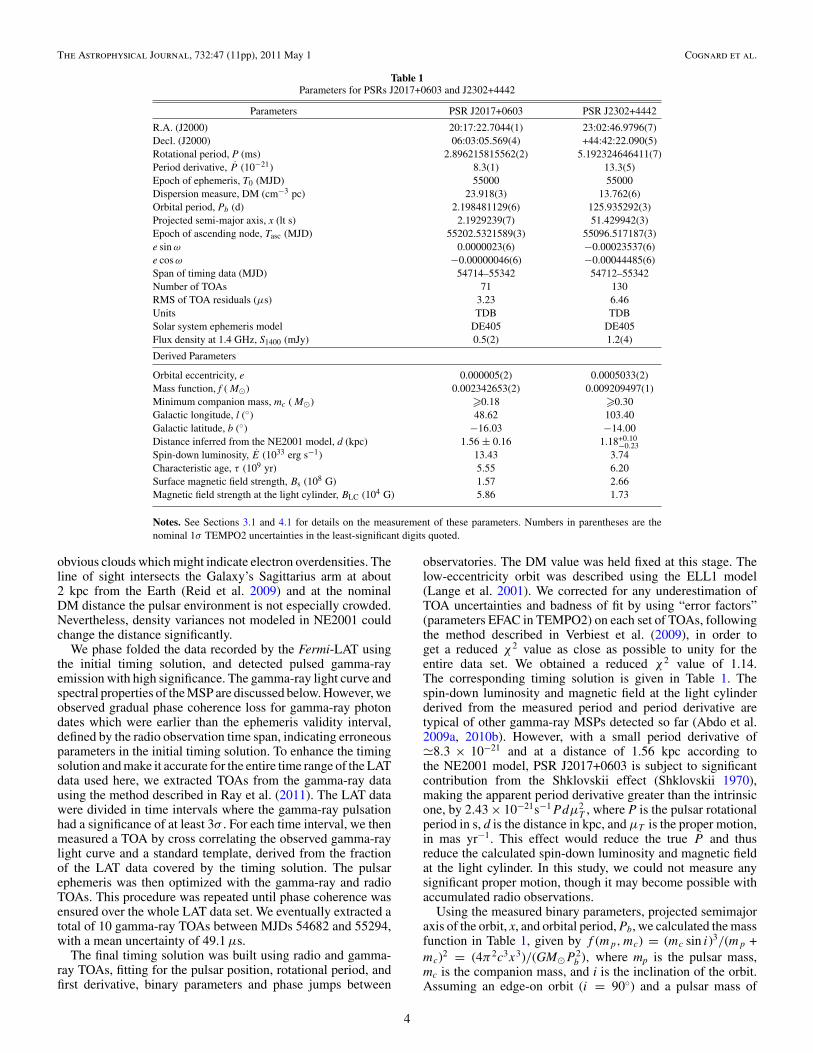
Figure 2. Same as Figure 1, for PSR J2302+4442. The radio profile is based on20.9 hr of observation.
(A color version of this figure is available in the online journal.)
the Lovell Telescope at the Jodrell Bank Observatory (Hobbset al. 2004). Nancay timing observations were done using twodifferent configurations of the BON instrumentation describedabove. Between MJDs 55142 and 55228, we used the 512 ×0.25 MHz incoherent filter bank at 1334 MHz, and the stan-dard coherent dedispersor (Cognard et al. 2009) between MJDs55232 and 55342. The coherent dedispersion is performed in4 MHz channels over a total bandwidth of 128 MHz centeredat 1408 MHz. Eighteen times of arrival (TOAs) were recordedwith the filter bank BON with a mean uncertainty of the TOAdetermination of 6.3 μs, and 19 TOAs were measured with thecoherent dedispersor BON with a mean uncertainty of 2.5 μs.In addition, 24 radio TOAs were recorded with the Lovell Tele-scope at 1520 MHz between MJDs 55218 and 55305, with amean uncertainty of 17.8 μs. These data were used to derive aninitial timing solution covering the first seven months of post-discovery, using the TEMPO2 pulsar timing package21 (Hobbset al. 2006). The DM was estimated independently: the datarecorded with the BON backend of the Nancay telescope werecut in four frequency bands of 32 MHz, centered at 1358, 1390,1422, and 1454 MHz. We fitted the multifrequency data setwith the initial timing solution, where the DM was left free. Wemeasured DM = 23.918 ± 0.003 pc cm−3.
For this DM and line of sight, the NE2001 model of theGalactic distribution of free electrons22 assigns a distance of1.56 ± 0.16 kpc (Cordes & Lazio 2002). Archival optical andinfrared images (POSS-II) and radio images (NVSS) show no
21 http://sourceforge.net/projects/tempo2/22 Available at http://rsd-www.nrl.navy.mil/7213/lazio/ne_model/.
3
The Astrophysical Journal, 732:47 (11pp), 2011 May 1 Cognard et al.
Table 1Parameters for PSRs J2017+0603 and J2302+4442
Parameters PSR J2017+0603 PSR J2302+4442
R.A. (J2000) 20:17:22.7044(1) 23:02:46.9796(7)Decl. (J2000) 06:03:05.569(4) +44:42:22.090(5)Rotational period, P (ms) 2.896215815562(2) 5.192324646411(7)Period derivative, P (10−21) 8.3(1) 13.3(5)Epoch of ephemeris, T0 (MJD) 55000 55000Dispersion measure, DM (cm−3 pc) 23.918(3) 13.762(6)Orbital period, Pb (d) 2.198481129(6) 125.935292(3)Projected semi-major axis, x (lt s) 2.1929239(7) 51.429942(3)Epoch of ascending node, Tasc (MJD) 55202.5321589(3) 55096.517187(3)e sin ω 0.0000023(6) −0.00023537(6)e cos ω −0.00000046(6) −0.00044485(6)Span of timing data (MJD) 54714–55342 54712–55342Number of TOAs 71 130RMS of TOA residuals (μs) 3.23 6.46Units TDB TDBSolar system ephemeris model DE405 DE405Flux density at 1.4 GHz, S1400 (mJy) 0.5(2) 1.2(4)
Derived Parameters
Orbital eccentricity, e 0.000005(2) 0.0005033(2)Mass function, f ( M�) 0.002342653(2) 0.009209497(1)Minimum companion mass, mc ( M�) �0.18 �0.30Galactic longitude, l (◦) 48.62 103.40Galactic latitude, b (◦) −16.03 −14.00Distance inferred from the NE2001 model, d (kpc) 1.56 ± 0.16 1.18+0.10
−0.23Spin-down luminosity, E (1033 erg s−1) 13.43 3.74Characteristic age, τ (109 yr) 5.55 6.20Surface magnetic field strength, Bs (108 G) 1.57 2.66Magnetic field strength at the light cylinder, BLC (104 G) 5.86 1.73
Notes. See Sections 3.1 and 4.1 for details on the measurement of these parameters. Numbers in parentheses are thenominal 1σ TEMPO2 uncertainties in the least-significant digits quoted.
obvious clouds which might indicate electron overdensities. Theline of sight intersects the Galaxy’s Sagittarius arm at about2 kpc from the Earth (Reid et al. 2009) and at the nominalDM distance the pulsar environment is not especially crowded.Nevertheless, density variances not modeled in NE2001 couldchange the distance significantly.
We phase folded the data recorded by the Fermi-LAT usingthe initial timing solution, and detected pulsed gamma-rayemission with high significance. The gamma-ray light curve andspectral properties of the MSP are discussed below. However, weobserved gradual phase coherence loss for gamma-ray photondates which were earlier than the ephemeris validity interval,defined by the radio observation time span, indicating erroneousparameters in the initial timing solution. To enhance the timingsolution and make it accurate for the entire time range of the LATdata used here, we extracted TOAs from the gamma-ray datausing the method described in Ray et al. (2011). The LAT datawere divided in time intervals where the gamma-ray pulsationhad a significance of at least 3σ . For each time interval, we thenmeasured a TOA by cross correlating the observed gamma-raylight curve and a standard template, derived from the fractionof the LAT data covered by the timing solution. The pulsarephemeris was then optimized with the gamma-ray and radioTOAs. This procedure was repeated until phase coherence wasensured over the whole LAT data set. We eventually extracted atotal of 10 gamma-ray TOAs between MJDs 54682 and 55294,with a mean uncertainty of 49.1 μs.
The final timing solution was built using radio and gamma-ray TOAs, fitting for the pulsar position, rotational period, andfirst derivative, binary parameters and phase jumps between
observatories. The DM value was held fixed at this stage. Thelow-eccentricity orbit was described using the ELL1 model(Lange et al. 2001). We corrected for any underestimation ofTOA uncertainties and badness of fit by using “error factors”(parameters EFAC in TEMPO2) on each set of TOAs, followingthe method described in Verbiest et al. (2009), in order toget a reduced χ2 value as close as possible to unity for theentire data set. We obtained a reduced χ2 value of 1.14.The corresponding timing solution is given in Table 1. Thespin-down luminosity and magnetic field at the light cylinderderived from the measured period and period derivative aretypical of other gamma-ray MSPs detected so far (Abdo et al.2009a, 2010b). However, with a small period derivative of8.3 × 10−21 and at a distance of 1.56 kpc according tothe NE2001 model, PSR J2017+0603 is subject to significantcontribution from the Shklovskii effect (Shklovskii 1970),making the apparent period derivative greater than the intrinsicone, by 2.43 × 10⁻²¹s−1Pdμ2
T , where P is the pulsar rotationalperiod in s, d is the distance in kpc, and μT is the proper motion,in mas yr−1. This effect would reduce the true P and thusreduce the calculated spin-down luminosity and magnetic fieldat the light cylinder. In this study, we could not measure anysignificant proper motion, though it may become possible withaccumulated radio observations.
Using the measured binary parameters, projected semimajoraxis of the orbit, x, and orbital period, Pb, we calculated the massfunction in Table 1, given by f (mp,mc) = (mc sin i)3/(mp +mc)2 = (4π2c3x3)/(GM�P 2
b ), where mp is the pulsar mass,mc is the companion mass, and i is the inclination of the orbit.Assuming an edge-on orbit (i = 90◦) and a pulsar mass of
4
The Astrophysical Journal, 732:47 (11pp), 2011 May 1 Cognard et al.
Table 2Light Curve and Spectral Parameters of PSRs J2017+0603 and J2302+4442 in Gamma Rays, Fixing β = 1 in Equation (1)
Parameter PSR J2017+0603 PSR J2302+4442
First peak position, Φ1 0.348 ± 0.009 0.310 ± 0.021First peak FWHM, FWHM1 0.248 ± 0.054 0.033 ± 0.013Second peak position, Φ2 0.636 ± 0.005 0.629 ± 0.003Second peak FWHM, FWHM2 0.050 ± 0.013 0.037 ± 0.006Radio-to-gamma-ray lag, δ 0.225 ± 0.009 ± 0.002 0.350 ± 0.021 ± 0.002Gamma-ray peak separation, Δ 0.288 ± 0.010 0.320 ± 0.021
Spectral index, Γ 1.00 ± 0.16 ± 0.16 1.25 ± 0.13 ± 0.14Cutoff energy, Ec (GeV) 3.12 ± 0.57 ± 0.75 2.97 ± 0.51 ± 0.54Photon flux, F (> 0.1 GeV) (10−8 cm−2 s−1) 2.21 ± 0.31 ± 0.11 3.34 ± 0.38 ± 0.20Energy flux, G (> 0.1 GeV) (10−11 erg cm−2 s−1) 3.71 ± 0.24 ± 0.19 3.94 ± 0.22 ± 0.10Luminosity, Lγ /fΩ (1033 erg s−1) 10.79 ± 1.72 ± 1.66 6.57 +0.87
−1.85+0.80−1.82
Efficiency, η/fΩ 0.80 ± 0.13 ± 0.12 1.75 +0.23−0.49
+0.21−0.48
Notes. See Sections 3.3 and 4.3 for details on the measurement of these parameters. Peak positions, widths, and separationsare given in phase units, between 0 and 1.
1.4 M�, we calculate a lower limit on mc of 0.18 M�. As notedin Lorimer & Kramer (2005), the probability of observing abinary system with an inclination of less than i0 for a randomdistribution of orbital inclinations is 1−cos(i0); therefore, a 90%confidence upper limit on the companion mass can be derived byassuming an inclination angle i of 26◦. Doing so gives an upperlimit of 0.45 M� for the companion mass of PSR J2017+0603.These mass function and range of likely companion mass valuesindicate that the companion star probably is a He-type whitedwarf.
3.2. Optical, UV, and X-Ray Analysis
We searched for X-ray and optical/UV counterparts in Swift(Gehrels et al. 2004) observations obtained from 2009 Februaryto March. In an X-ray Telescope (XRT) (Burrows et al. 2005)image with 16.4 ks of cumulative exposure, we measuredan upper limit to the 0.5–8 keV count rate of <1.5 countsks−1 at the position of PSR J2017+0603. Adopting a fluxconversion of 5 × 10⁻¹¹ erg cm−2 counts−1 (0.3–10 keV)from Evans et al. (2007), and an appropriate conversion toour choice of energy range, results in a flux limit between 0.5and 8 keV of <6 × 10⁻¹⁴ erg cm−2 s−1. The UVOT (Rominget al. 2005) images show a relatively bright field source (B =19.8 mag, R.A. = 20:17:22.51, decl. = +06:03:07.7 with <0.′′1uncertainty, from Monet et al. 2003), that is 3.′′6 away from thepulsar position, which contaminates the photometry. Moving theaperture sufficiently to avoid this source, we estimate optical/UV upper limits for the pulsar to be 80 (V), 47 (B), 17 (U), 7(W1), 5 (M2), and 3 (W2) μJy. All flux upper limits are at the3σ confidence level.
3.3. Gamma-Ray Analysis
The gamma-ray data recorded by the LAT were analyzedusing the Fermi science tools (STs) v9r16p1.23 Using gtselect,we selected events recorded between 2008 August 4 and2010 May 26, with energies above 0.1 GeV, zenith angles�105◦, and within 20◦ of the pulsar’s position. We furthermoreselected events belonging to the “Diffuse” class of events underthe P6_V3 instrument response function (IRFs), those eventshaving the highest probability of being photons (Atwood et al.2009). We finally rejected times when the rocking angle of
23 http://fermi.gsfc.nasa.gov/ssc/data/analysis/scitools/overview.html
the satellite exceeded 52◦, required that the DATA_QUAL andLAT_CONFIG are equal to 1, and that the Earth’s limb didnot infringe upon the region of interest (ROI) using gtmktime.Finally, we phase-folded gamma-ray events using the pulsarephemeris given in Table 1 and the Fermi plug-in now distributedwith the TEMPO2 pulsar timing package.
Figure 1 shows radio and gamma-ray light curves ofPSR J2017+0603, for gamma-ray events within 0.◦8 of the pul-sar. Under this cut, most high-energy photons (energies above1 GeV) coming from the pulsar are kept, while the contributionof background emission, mostly present at lower energies, isreduced. The bin-independent H-test parameter (de Jager et al.1989; de Jager & Busching 2010) has a value of 235, corre-sponding to a pulsation significance well above 10σ . As can beseen in Figure 1, the gamma-ray pulse profile comprises twoclose peaks, offset from the radio emission. The absolute phas-ing in these light curves is such that the maximum of the firstFourier harmonic of the radio profile transferred back into thetime domain is at phase 0. Under that convention, the maxi-mum of the radio profile is at Φr = 0.123 in phase. We fittedthe gamma-ray light curve above 0.1 GeV using a two-sidedLorentzian function for the asymmetrical first peak and a simpleLorentzian function for the second peak above constant back-ground. For each peak, the peak position Φi and the FWHMi arelisted in Table 2. The table also lists the values of the radio-to-gamma-ray lag δ = Φ1−Φr , and the gamma-ray peak separationΔ = Φ2 −Φ1. Quoted uncertainties are statistical. For the radio-to-gamma-ray lag δ we quote a second error bar, reflecting theuncertainty on the conversion of a TOA recorded at 1.4 GHz toinfinite frequency, due to the uncertainty on the DM value givenin Table 1. With δ 0.22 and Δ 0.29, PSR J2017+0603follows the correlation between δ and Δ expected in outer mag-netospheric models as pointed out by Romani & Yadigaroglu(1995) and effectively observed for currently known gamma-ray pulsars (see Figure 4 of Abdo et al. 2010f). However, it isinteresting to note that this MSP occupies a region of the δ–Δplot where few gamma-ray pulsars were known.
The spectral analysis was done by fitting the region aroundPSR J2017+0603 using a binned likelihood method (Cash 1979;Mattox et al. 1996), implemented in the pyLikelihood moduleof the Fermi STs. All 1FGL catalog sources (Abdo et al.2010c) within 15◦ from the pulsar as well as additional pointsources found in an internal LAT source list using 18 monthsof data were included in the model. Sources were modeled with
5
The Astrophysical Journal, 732:47 (11pp), 2011 May 1 Cognard et al.
Energy (GeV)
-110 1 10
)-1
s-2
dN/d
E (
erg
cm2
E
-1310
-1210
-1110
Energy Band Fits
1 Maximum Likelihood Model≡β
Free Maximum Likelihood Modelβ
PSR J2017+0603
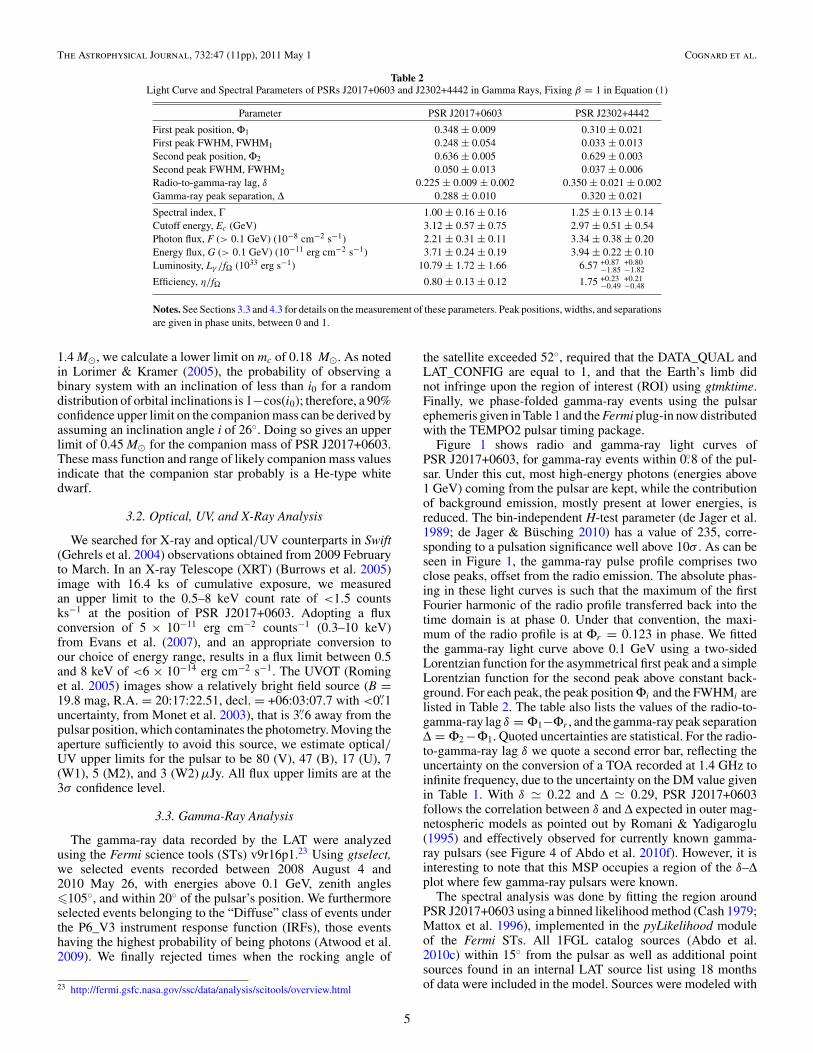
Figure 3. Phase-averaged gamma-ray energy spectrum for PSR J2017+0603.The solid black line shows the best-fit model from fitting the full energy rangewith a simple exponentially cutoff power-law functional form (β ≡ 1). Dashedlines indicate 1σ errors on the latter model. The dot-dashed line representsthe spectral fit with the β parameter left free. Data points are derived fromlikelihood fits of individual energy bands where the pulsar is modeled with asimple power-law form. A 95% confidence level upper limit was calculated forany energy band in which the pulsar was not detected above the backgroundwith a significance of at least 2σ .
power-law spectra, except for PSR J2017+0603 which wasmodeled with an exponentially cutoff power law, of the form
dN
dE= N0
(E
1 GeV
)−Γ
exp
[−
(E
Ec
)β]
. (1)
In Equation (1), N0 is a normalization factor, Γ denotes thephoton index, and Ec is the cutoff energy of the pulsar spectrum.The parameter β determines the steepness of the exponential cut-off. Fermi-LAT pulsar spectra are generally well described bya simple exponential model, β ≡ 1. The Galactic diffuse emis-sion was modeled using the gll_iem_v02 mapcube file, while theextragalactic diffuse and residual instrument background com-ponents were modeled using the isotropic_iem_v02 template.24
Normalization factors and indices for all point sources within7◦ from PSR J2017+0603 and normalization factors for diffusecomponents were left free. The best-fit values for the photonindex and cutoff energy of PSR J2017+0603 for a simple ex-ponentially cutoff power law (β = 1) are listed in Table 2,and the corresponding gamma-ray energy spectrum is shownin Figure 3. The first errors are statistical, and the second aresystematic. These last uncertainties were calculated by follow-ing the same procedure as above, but using bracketing IRFs forwhich the effective area has been perturbed by ±10% at 0.1 GeV,±5% near 0.5 GeV, and ±20% at 10 GeV with linear interpo-lations in log space between. We also modeled the MSP with apower-law fit, β = 0, and found that the exponentially cutoffpower-law model (β = 1) is preferred at the 9σ level. A fit ofthe pulsar’s spectrum with the β parameter in Equation (1) leftfree led to β = 1.5 ± 0.6. This value is consistent with 1 withinstatistical errors, and the extra free parameter did not improvethe quality of the fit, as can be seen in Figure 3. We thereforeconclude that the simple exponentially cutoff power-law model(with β = 1) reproduces the present data well.
With the full spectral model obtained with this analysis andthe Fermi ST gtsrcprob, we calculated probabilities that each
24 The diffuse models are available through the Fermi Science Support Center(see http://fermi.gsfc.nasa.gov/ssc/).
photon originates from the different gamma-ray sources in theROI. If we denote ωi as the probability that a given photonhas been emitted by PSR J2017+0603, and therefore (1 − ωi)the probability that the photon is due to background, thenthe background level in the considered ROI can be estimatedby calculating b = ∑N
i (1 − ωi), where N is the number ofphotons in the ROI. The background levels shown in Figure 1were calculated with this method, which is more powerfulat discriminating background events than methods involvingsurrounding annuli.
The photon index Γ and cutoff energy Ec measured inthis analysis are reminiscent of those of previously detectedgamma-ray MSPs (Abdo et al. 2009a, 2010b). IntegratingEquation (1) above 0.1 GeV yields the photon flux F andenergy flux G given in Table 2. The 1FGL catalog quotes anenergy flux above 0.1 GeV for 1FGL J2017.3+0603 of (4.5 ±0.5) ×10−11 erg cm−2 s−1, consistent with the value measuredfor PSR J2017+0603. Nevertheless, the high-redshift blazarCLASS J2017+0603 (Myers et al. 2003; Abdo et al. 2010e)located 2.′3 from the pulsar could also contribute to the gamma-ray flux of the 1FGL source. We checked that hypothesis byselecting the off-peak region of the spectrum (pulse phasesbetween 0.25 and 0.75) and by performing a likelihood analysisof the selected data, where the blazar was modeled by a powerlaw. Following this procedure we did not detect any significantemission from the blazar. PSR J2017+0603, therefore, is thenatural counterpart of 1FGL J2017.3+0603.
4. PSR J2302+4442
4.1. Timing Observations
Radio timing observations of the pulsar in 1FGLJ2302.8+4443 were conducted at the Nancay Radio Telescopein the two configurations described in Section 3.1, the GreenBank Telescope in West Virginia with the GUPPI backend,25
and the Lovell Telescope at the Jodrell Bank Observatory. Be-tween MJDs 55139 and 55218, 29 TOAs were recorded withthe filter bank BON with a mean uncertainty on the determi-nation of arrival times of 7.6 μs, while the coherent dedisper-sor was used to measure 22 TOAs between MJDs 55150 and55342, with a mean uncertainty of 2.1 μs. The Green Bank Tele-scope recorded 32 TOAs in two observation sessions, at MJDs55095 and 55157, with a mean uncertainty of 5.1 μs. The LovellTelescope recorded a total of 38 TOAs at 1520 MHz betweenMJDs 55217 and 55304, with a mean uncertainty of 20.4 μs.An initial timing solution was built using these radio timingobservations and the TEMPO2 pulsar timing package. As withPSR J2017+0603, data recorded with the BON backend werecut in four frequency bands of 32 MHz, and the multifrequencyTOAs extracted from these observations were used to determinethe DM.
We measured DM = 13.762 ± 0.006 pc cm−3. The NE2001model assigns this DM and line of sight a distance of1.18+0.10
−0.23 kpc. Again, optical, infrared, and radio images showno clouds. These line of sight and distance place the pulsarwithin the Orion spur of the Sagittarius arm. As above, un-modeled electron density variations could change the distancesignificantly.
We used the initial timing solution to phase fold the LATdata and detected highly significant gamma-ray pulsations. Thegamma-ray light curve and spectral properties of the MSP are
25 https://safe.nrao.edu/wiki/bin/view/CICADA/NGNPP
6

The Astrophysical Journal, 732:47 (11pp), 2011 May 1 Cognard et al.
discussed below. Similarly to PSR J2017+0603, we could notfold all LAT data properly using the initial timing solution,as we observed loss of phase coherence for photons recordedbefore the first radio timing data were taken. Following the iter-ative procedure described in Section 3.1, we extracted TOAs forthe gamma-ray data, optimized the timing solution by addingthe gamma-ray TOAs to the radio data set, and phasefolded the LAT data until we obtained phase coherence over theentire Fermi data set described previously. We finally measurednine TOAs between MJDs 54682 and 55294 with an uncertaintyof 44.6 μs.
The final timing solution obtained by fitting for the pulsarposition, rotational period, and first time derivative and binaryparameters is listed in Table 1. The low-eccentricity orbit ofPSR J2302+4442 was also described using the ELL1 model. Thesame procedure to correct underestimated TOA uncertaintieswith EFAC parameters as described in 3.1 was used, resulting ina reduced χ2 value of 1.04. Like PSR J2017+0603, J2302+4442is subject to significant contribution from the Shklovskii effect,with a relatively small period derivative of 1.33 × 10⁻²⁰. Wewere not able to measure any significant proper motion with thepresent data set; however, accumulated radio observations mayhelp constrain the Shklovskii contribution.
Under the assumption of an edge-on orbit and a pulsarmass of 1.4 M�, the lower limit on the companion massis found to be 0.30 M�. However, assuming an inclinationof i = 26◦ leads to an upper limit of 0.81 M� for thecompanion mass, suggesting that the companion star couldeither be a He-type or a CO-type white dwarf. Nevertheless,the orbital period and eccentricity of PSR J2302+4442 arein good agreement with the Pb–e relationship predicted byPhinney (1992), whereas “intermediate-mass binary pulsars”with heavier companion stars do not necessarily follow therelationship. This suggests that PSR J2302+4442 is in orbit witha low-mass He-type companion, and thus that its inclinationangle i must be large. Future radio timing observations mayhelp determine the companion mass and orbital inclination, viathe measurement of the Shapiro delay (see, e.g., Lorimer &Kramer 2005). As discussed in detail in Freire & Wex (2010),the amplitude of the measurable part of the Shapiro delay foran orbit with medium to high inclination is proportional toh3 = T�mc × (sin(i)/(1 + | cos(i)|)), where T� = GM�/c3 ∼4.925 490 947 μs. With a current average uncertainty on TOAsrecorded with the Nancay BON backend of ∼2.1 μs, we expectthe Shapiro delay to be measurable for large mc and i values.
4.2. Optical, UV, and X-Ray Analysis
In the Swift/XRT image of the PSR J2302+4442 field(9.1 ks summed exposure), there is a marginal detection (2.6σ )of an X-ray source (R.A. = 23:02:47.00, decl. = +44:42:20.7;90% confidence radius of 6.′′3) that is consistent with the pulsarposition. The 0.5–8 keV flux corresponding to the observedcount rate of (1.0 ± 0.4) counts ks−1 is ∼4×10⁻¹⁴ erg cm−2 s−1
(see Section 3.2 for details on the flux conversion). The opticaland UV upper limits at the pulsar position are: 53 (V), 26 (B),13 (U), 6 (W1), 4 (M2), and 3 (W2) μJy.
On 2009 December 25, while this Fermi-LAT source wasas yet unidentified, the XMM-Newton satellite observed theLAT-source field with the EPIC-MOS and -PN cameras inan effort to explore the source region. We reduced these datawith the Science Analysis Software version 10.0.0 released on2010 April 28. After filtering the observation for intervals ofhigh particle background we were left with good time intervals
0 1 2 3 4 5 6 7 8 9 10
+44 40 00
+44 42 00
+44 44 00
23 02 3023 02 4023 02 5023 03 00
C
B
A
PSR J2302+4442
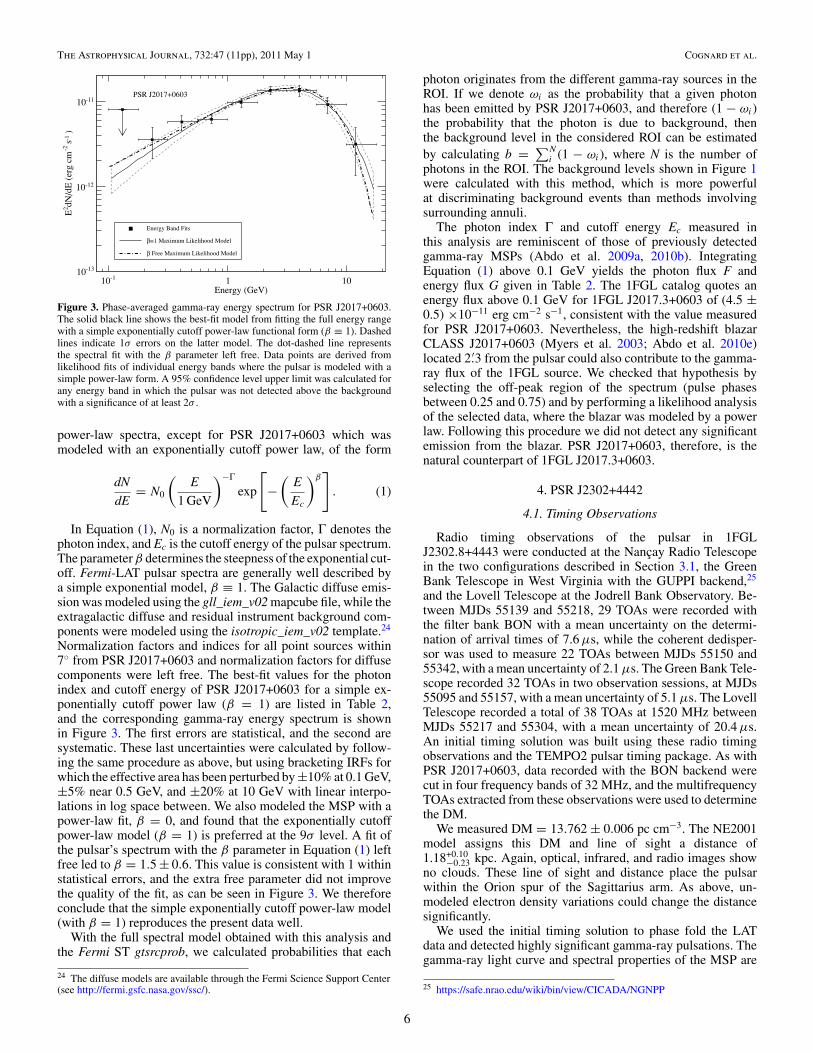
Figure 4. Combined EPIC-MOS1 and -MOS2 image of the field of the pulsarPSR J2302+4442, based on 24.9 and 25.1 ks exposures, respectively, andsmoothed by 3 pixel widths (∼3.′′3). The color scale represents counts per pixel.The position of the pulsar is shown by the green cross and is indistinguishableto the accuracy of the X-ray image from the position of the X-ray source wecall XMMUJ230247+444219. This source, and the source labeled A, were bothdetected by the Swift/XRT in its exploration of this field (see the text), but thetwo other labeled sources (B and C) apparently were not detected by the XRT.
(A color version of this figure is available in the online journal.)
consisting of 24.9 ks, 25.1 ks, and 20.8 ks exposures in the EPIC-MOS1, -MOS2, and -PN instruments, respectively. A numberof sources were detected in the field of the Fermi-LAT source,as can be seen in Figure 4. Once the radio pulsar position wasrefined to the arcsecond level, one X-ray source in particularwas positionally identified as the likely pulsar candidate and wename this source XMMUJ230247+444219.
We extracted events from a 50′′ region around the sourcefrom both the MOS1 and MOS2 event files, and backgroundevents from a 100′′ region nearby and apparently free of faintX-ray sources but still on the same respective MOS CCDchips. For the PN event files, in order to avoid a gap betweenadjacent CCDs, we extracted events from a region only 10′′ inradius and a background region of radius 80′′. From the MOSinstruments, we obtain 269 and 262 events, and from the PNwe obtain 176 events, respectively, from the source regions.This yields, along with the background estimates, a combineddetection significance of 13.2σ from all three detectors forXMMUJ230247+444219.
We grouped these events into spectral bins of at least20 counts per bin and performed a simultaneous XSPEC26
fit to an absorbed power-law model to all three spectra inthe 0.4–3.0 keV range. This yields a power-law index of5.9 which we regard as unphysical and so we discard thismodel. On the other hand, an absorbed neutron star hydrogenatmosphere model (phabs × nsatmos; see Heinke et al. 2006)yields an acceptable fit, provided that the neutron star massand radius are fixed at 1.4 M� and 10.0 km, respectively,and the source distance is fixed at the DM value of 1.18 kpc.However, while we obtain an acceptable reduced χ2 of 1.032 for17 degrees of freedom, we measure a column density of NH =0.018+0.31
−0.018 × 1022 cm−2 (90% confidence) meaning that NH ispoorly constrained and consistent with values anywhere from
26 http://heasarc.gsfc.nasa.gov/docs/xanadu/xspec/
7
The Astrophysical Journal, 732:47 (11pp), 2011 May 1 Cognard et al.
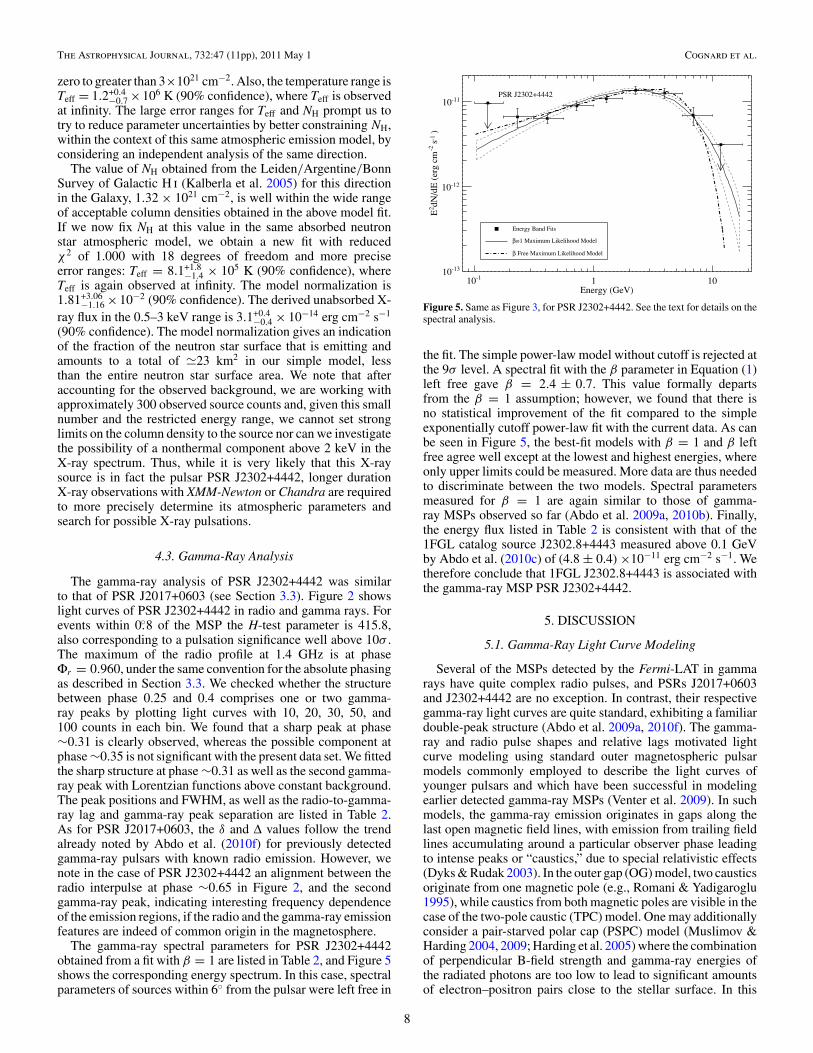
zero to greater than 3×1021 cm−2. Also, the temperature range isTeff = 1.2+0.4
−0.7 ×10⁶ K (90% confidence), where Teff is observedat infinity. The large error ranges for Teff and NH prompt us totry to reduce parameter uncertainties by better constraining NH,within the context of this same atmospheric emission model, byconsidering an independent analysis of the same direction.
The value of NH obtained from the Leiden/Argentine/BonnSurvey of Galactic H i (Kalberla et al. 2005) for this directionin the Galaxy, 1.32 × 1021 cm−2, is well within the wide rangeof acceptable column densities obtained in the above model fit.If we now fix NH at this value in the same absorbed neutronstar atmospheric model, we obtain a new fit with reducedχ2 of 1.000 with 18 degrees of freedom and more preciseerror ranges: Teff = 8.1+1.8
−1.4 × 10⁵ K (90% confidence), whereTeff is again observed at infinity. The model normalization is1.81+3.06
−1.16 × 10⁻² (90% confidence). The derived unabsorbed X-ray flux in the 0.5–3 keV range is 3.1+0.4
−0.4 × 10⁻¹⁴ erg cm−2 s−1
(90% confidence). The model normalization gives an indicationof the fraction of the neutron star surface that is emitting andamounts to a total of 23 km2 in our simple model, lessthan the entire neutron star surface area. We note that afteraccounting for the observed background, we are working withapproximately 300 observed source counts and, given this smallnumber and the restricted energy range, we cannot set stronglimits on the column density to the source nor can we investigatethe possibility of a nonthermal component above 2 keV in theX-ray spectrum. Thus, while it is very likely that this X-raysource is in fact the pulsar PSR J2302+4442, longer durationX-ray observations with XMM-Newton or Chandra are requiredto more precisely determine its atmospheric parameters andsearch for possible X-ray pulsations.
4.3. Gamma-Ray Analysis
The gamma-ray analysis of PSR J2302+4442 was similarto that of PSR J2017+0603 (see Section 3.3). Figure 2 showslight curves of PSR J2302+4442 in radio and gamma rays. Forevents within 0.◦8 of the MSP the H-test parameter is 415.8,also corresponding to a pulsation significance well above 10σ .The maximum of the radio profile at 1.4 GHz is at phaseΦr = 0.960, under the same convention for the absolute phasingas described in Section 3.3. We checked whether the structurebetween phase 0.25 and 0.4 comprises one or two gamma-ray peaks by plotting light curves with 10, 20, 30, 50, and100 counts in each bin. We found that a sharp peak at phase∼0.31 is clearly observed, whereas the possible component atphase ∼0.35 is not significant with the present data set. We fittedthe sharp structure at phase ∼0.31 as well as the second gamma-ray peak with Lorentzian functions above constant background.The peak positions and FWHM, as well as the radio-to-gamma-ray lag and gamma-ray peak separation are listed in Table 2.As for PSR J2017+0603, the δ and Δ values follow the trendalready noted by Abdo et al. (2010f) for previously detectedgamma-ray pulsars with known radio emission. However, wenote in the case of PSR J2302+4442 an alignment between theradio interpulse at phase ∼0.65 in Figure 2, and the secondgamma-ray peak, indicating interesting frequency dependenceof the emission regions, if the radio and the gamma-ray emissionfeatures are indeed of common origin in the magnetosphere.
The gamma-ray spectral parameters for PSR J2302+4442obtained from a fit with β = 1 are listed in Table 2, and Figure 5shows the corresponding energy spectrum. In this case, spectralparameters of sources within 6◦ from the pulsar were left free in
Energy (GeV)
-110 1 10
)-1
s-2
dN/d
E (
erg
cm2
E
-1310
-1210
-1110
Energy Band Fits
1 Maximum Likelihood Model≡β
Free Maximum Likelihood Modelβ
PSR J2302+4442
Figure 5. Same as Figure 3, for PSR J2302+4442. See the text for details on thespectral analysis.
the fit. The simple power-law model without cutoff is rejected atthe 9σ level. A spectral fit with the β parameter in Equation (1)left free gave β = 2.4 ± 0.7. This value formally departsfrom the β = 1 assumption; however, we found that there isno statistical improvement of the fit compared to the simpleexponentially cutoff power-law fit with the current data. As canbe seen in Figure 5, the best-fit models with β = 1 and β leftfree agree well except at the lowest and highest energies, whereonly upper limits could be measured. More data are thus neededto discriminate between the two models. Spectral parametersmeasured for β = 1 are again similar to those of gamma-ray MSPs observed so far (Abdo et al. 2009a, 2010b). Finally,the energy flux listed in Table 2 is consistent with that of the1FGL catalog source J2302.8+4443 measured above 0.1 GeVby Abdo et al. (2010c) of (4.8 ± 0.4) ×10−11 erg cm−2 s−1. Wetherefore conclude that 1FGL J2302.8+4443 is associated withthe gamma-ray MSP PSR J2302+4442.
5. DISCUSSION
5.1. Gamma-Ray Light Curve Modeling
Several of the MSPs detected by the Fermi-LAT in gammarays have quite complex radio pulses, and PSRs J2017+0603and J2302+4442 are no exception. In contrast, their respectivegamma-ray light curves are quite standard, exhibiting a familiardouble-peak structure (Abdo et al. 2009a, 2010f). The gamma-ray and radio pulse shapes and relative lags motivated lightcurve modeling using standard outer magnetospheric pulsarmodels commonly employed to describe the light curves ofyounger pulsars and which have been successful in modelingearlier detected gamma-ray MSPs (Venter et al. 2009). In suchmodels, the gamma-ray emission originates in gaps along thelast open magnetic field lines, with emission from trailing fieldlines accumulating around a particular observer phase leadingto intense peaks or “caustics,” due to special relativistic effects(Dyks & Rudak 2003). In the outer gap (OG) model, two causticsoriginate from one magnetic pole (e.g., Romani & Yadigaroglu1995), while caustics from both magnetic poles are visible in thecase of the two-pole caustic (TPC) model. One may additionallyconsider a pair-starved polar cap (PSPC) model (Muslimov &Harding 2004, 2009; Harding et al. 2005) where the combinationof perpendicular B-field strength and gamma-ray energies ofthe radiated photons are too low to lead to significant amountsof electron–positron pairs close to the stellar surface. In this
8

The Astrophysical Journal, 732:47 (11pp), 2011 May 1 Cognard et al.
Cou
nts
10
20
30
40
50 PSR J2017+0603
Pulse Phase0 0.2 0.4 0.6 0.8 1 1.2 1.4 1.6 1.8 2
Rad
io F
lux
LAT > 0.1 GeV
Radio Data
TPC Model
OG Model
Figure 6. Top: gamma-ray data and modeled light curves for PSR J2017+0603with 60 bins per rotation. Bottom: Nancay 1.4 GHz radio profile and modeledlight curves. Modeled light curves were made using α = 16◦, ζ = 68◦ and aninfinitely thin gap for the TPC model, and α = 17◦, ζ = 68◦ and an infinitelythin gap for the OG geometry. See Section 5.1 for emission altitude extents.
(A color version of this figure is available in the online journal.)
case, the magnetosphere is “pair-starved” and no pair formationfront is established, so that the primaries continue to acceleratealong the B-field lines and emit curvature gamma-ray radiationup to near the light cylinder. The nonzero lags between thegamma-ray and radio pulses led us to model the radio usinga phenomenological model proposed by Story et al. (2007),where one assumes that the radio emission originates in a conebeam centered on the magnetic dipole axis at a single altitude.Different combinations of inclination and observer angles α andζ will result in zero, one, or two radio peaks from each pole,along with different gamma-ray profile shapes, depending onhow close an observer’s line of sight sweeps with respect to themagnetic axis.
We have used a Markov chain Monte Carlo (MCMC)maximum-likelihood fitting technique to jointly model thegamma-ray and radio pulse profiles in order to statistically pickthe best-fit emission model geometry (details will be describedin T. J. Johnson et al. 2011, in preparation). Additionally, wehave generated simulations with 1◦ resolution in α as opposedto the 5◦ used in Venter et al. (2009) and included the Lorentztransformation of the magnetic field from the inertial observer’sframe to the corotating frame which was missing in previousstudies and advocated by Bai & Spitkovsky (2010) as necessaryfor self-consistency. An MCMC technique involves taking ran-dom steps in parameter space, evaluating the likelihood at thatstep, and accepting the step based on the likelihood ratio withthe previous step. In particular, we use a Metropolis–Hastingsmethod (Hastings 1970) to update the parameter state, acceptingsteps if the likelihood at the new step is greater than the previousstep or if the ratio is greater than a random number ∈ [0, 1). Foreach model fit, we verify that our MCMC has converged usingthe method proposed by Gelman & Rubin (1992).
The gamma-ray light curves are fit using Poisson likelihoodand the radio profiles using a χ2 statistic. In order to balancethe contributions from the radio and gamma-ray data, andin particular to balance the high statistical precision of theradio data against our simple cone-beam model, we haveused a relative error for the radio data equal to the averagegamma-ray relative uncertainty in the on-peak region timesthe radio maximum. It is important to note that the choiceof uncertainty for the radio profile can strongly affect thebest-fit results. A smaller uncertainty will decrease the overall
Cou
nts
20
40
60
80
100PSR J2302+4442
Pulse Phase0 0.2 0.4 0.6 0.8 1 1.2 1.4 1.6 1.8 2
Rad
io F
lux
LAT > 0.1 GeV
Radio Data
TPC Model
OG Model
Figure 7. Same as Figure 6, for PSR J2302+4442. Modeled light curves weremade using α = 58◦, ζ = 46◦ and an infinitely thin gap for the TPC emissiongeometry, and α = 63◦, ζ = 39◦ and an infinitely thin gap for the OG model.
(A color version of this figure is available in the online journal.)
likelihood, which can in some cases lead to a different best-fitgeometry favoring the radio light curve. For both MSPs, we havetaken the gamma-ray on-peak interval to be φ ∈ [0.25, 0.75].Our geometric models assume constant-emissivity gamma-ray emission extending from the stellar surface in the TPCmodel, while the minimum radius is set to the radius of thenull charge surface (which depends on magnetic azimuth andcolatitude) in the OG model. For all simulations we have useda maximum emission altitude for the gamma rays of 1.2 RLC,where RLC = cP/(2π ), with the added caveat that the emissiondoes not go beyond a cylindrical radius equal to 0.95 RLC. Wefound that the likelihood surfaces are very multimodal which canlead to a low acceptance rate and an incomplete exploration ofthe parameter space; therefore, we have implemented simulatedtempering (Marinari & Parisi 1992) with small-world chainsteps (Guan et al. 2006) in α and ζ . The MCMC parameterspace includes α, ζ (both with 1◦ resolution), gap widthw (with a resolution of 0.05, normalized to the polar capradius), and phase shift, which accounts for the fact that thedefinitions of phase zero are different between the data and ourmodels. Our MCMC is implemented in python using the SciPymodule27 and the light curve fitting for each step is done usingthe scipy.optimize.fmin_l_fbgs_b multivariate, bound optimizer(Zhu et al. 1997).
In order to match the data with our simulations we re-binnedboth the gamma-ray and radio data to 60 bins (see Figures 6 and7). This has the effect of smoothing out very fine scale variationsin the radio profile, but, as we discuss below, our radio profilesimulations are not refined enough to reproduce these structures,and, thus, fitting to the 60 bin radio profiles is sufficient toreproduce the general features, namely the gamma-to-radio lag.For PSR J2017+0603 we find best-fit solutions of α = 16◦ andζ = 68◦ with an infinitely thin gap for a TPC model and α =17◦ and ζ = 68◦ with an infinitely thin gap for an OG model.For PSR J2302+4442, we find best-fit solutions of α = 58◦ andζ = 46◦ with an infinitely thin gap for a TPC model and α = 63◦and ζ = 39◦ with an infinitely thin gap for an OG model. Whenwe find best-fit models with infinitely thin gap widths for bothpulsars, we do not think this represents the truth, as a zero-widthgap is unphysical; rather, we take this to mean that the best gapwidth is somewhere between 0 and 0.05 and the best-fit value of0 is chosen only as a result of the resolution of our simulations.
27 See http://docs.scipy.org/doc/ for documentation.
9

The Astrophysical Journal, 732:47 (11pp), 2011 May 1 Cognard et al.
Note also that we have not yet calibrated the fitting procedure toaddress the significance of differences in −log(likelihood), sowe cannot be more quantitative in discussing the preference ofone model over another. However, for both MSPs differences in−log(likelihood) were close to 0, meaning that neither of TPCand OG geometries are preferred.
Neither of the model fits for PSR J2017+0603 are ableto produce a wide enough first gamma-ray peak, but bothproduce the correct peak separation. Also, the model fits cannotreproduce all the features observed in the radio profile. However,the best-fit geometries are able to produce radio-to-gamma-ray lags close to what is observed. The situation is similarfor PSR J2302+4442, with both models matching the sharpsecond gamma-ray peak, but neither is able to produce astrong enough first peak. The TPC model implies two smallpeaks near phase 0.3 for slightly different values of α and ζ ,close to the best-fit values. Tests have shown that lowering themaximum emission altitude can affect the prominence of thesetwo peaks, which suggests that more investigation is merited inthis parameter. With more data the significance, or lack thereof,of this two-peaked structure will serve as a further discriminatorbetween the models. Neither best-fit geometry produces tworadio peaks with the correct spacing. The TPC geometry doespredict two closely spaced radio peaks while the OG geometryapproximately matches the radio peak near 0.15 in phase.
For both MSPs, it is of interest to note that geometries with αand ζ both near 20◦ produce two radio peaks with approximatelycorrect spacing, but the resultant gamma-ray TPC light curvesare similar to square waves while the gamma-ray emission inOG models is missed entirely. Clearly, our simple radio modeldoes not adequately reproduce the data. Both MSPs have at leastthree components in their radio profiles, while the model canonly produce zero, one, or two peaks from each magnetic pole.This points to more complex radio emission geometries, withradio emission from both magnetic poles visible, and it is likelythat emission may occur higher up in the magnetosphere as hasbeen suggested by Ravi et al. (2010).
We also fit both MSPs with the PSPC model, though this isnot as successful at producing sharp gamma-ray peaks. For bothMSPs, the fits predict α ∼ 70◦ and ζ ∼ 80◦ which suggestthat we would see radio emission from both magnetic poles.The gamma-ray PSPC models are able to reproduce the second,sharp peak for each MSP but have trouble matching the firstpeak properly. The best-fit geometries result in more complexradio profiles, but are still not able to match all of the observedfeatures. For both MSPs, the PSPC models are disfavored bythe likelihood when compared to the TPC and OG fits. Ourmodeling and fit results also show that there is still much to belearned about the radio beam structure.
5.2. Gamma-Ray Efficiencies
One can derive the total gamma-ray luminosity above 0.1 GeVand the efficiency of conversion of spin-down energy intogamma rays with the following expressions:
Lγ = 4πfΩGd2, (2)
η = Lγ /E. (3)
In these expressions, d and E are the pulsar distance and spin-down energy, respectively, fΩ is the correction factor dependingon the viewing geometry defined above, and G is the energy flux
measured above 0.1 GeV. Table 2 lists Lγ and η values underthe assumption that fΩ = 1, and using the pulsar distancesinferred from the NE2001 model (see Table 1). For both pulsars,gamma-ray efficiencies are found to be suspiciously large,and even greater than 100% in the case of PSR J2302+4442,which is unphysical. Overestimated fΩ factors and distances areplausible explanations for the large efficiency values. The best-fit TPC and OG emission geometries discussed in Section 5.1predict geometrical correction factors of 0.48 and 0.30 forPSR J2017+0603, leading to realistic gamma-ray efficienciesof 0.39 and 0.24, respectively. However, fΩ factors calculatedunder TPC and OG geometries for PSR J2302+4442 are 0.95and 0.97, leading to gamma-ray efficiencies greater than 1.6. Thedistance inferred from the NE2001 model is therefore likelyoverestimated, or the model is incorrect. In addition, propermotions could make the apparent spin-down energy loss ratesE larger than the intrinsic values because of the Shklovskiieffect, thereby increasing gamma-ray efficiencies. The averageefficiency of gamma-ray MSPs observed so far (Abdo et al.2009a, 2010b) is ∼10% (we excluded PSR J1614−2230,which also has an unphysical gamma-ray efficiency of 100%with the NE2001 distance). Assuming an efficiency of 10%for PSR J2302+4442, we find that the distance has to besmaller by a factor of four, which would place the pulsar atd � 300 pc. Note, however, that the X-ray energy flux GX of∼3.1 × 10⁻¹⁴ erg cm−2 s−1 measured between 0.5 and 3 keVleads to an X-ray efficiency of 4πGXd2/E ∼ 1.4 × 10⁻³, if weassume the NE2001 distance of 1.18 kpc, while it decreases to∼9 × 10⁻⁵ with a distance of 300 pc. The former efficiency isvery close to the 10−3 value empirically predicted by Becker& Truemper (1997) at these energies. The X-ray analysis,therefore, does not support such an important reduction of thedistance. If the pulsar distance is indeed that small, a timingparallax π = 1
d(kpc) � 3.3 mas should be measurable withaccumulated radio timing observations. This parallax couldalso be measured via the very long baseline interferometrymeasurements being undertaken for all Fermi pulsars.28
6. CONCLUSIONS
In a search for radio pulsations at the position of Fermi1FGL catalog sources with the Nancay Radio Telescope, wediscovered two MSPs, PSRs J2017+0603 and J2302+4442, bothorbiting low-mass companion stars. Both pulsars were foundto emit pulsed gamma-ray emission, indicating that they areassociated with the previously unidentified gamma-ray sources.The gamma-ray light curves and spectral properties of thetwo MSPs are reminiscent of those of other gamma-ray MSPsobserved previously.
Prior to Fermi, error boxes of unidentified gamma-ray sourceswere much larger than radio telescope beams, making searchesfor pulsars difficult, as multiple pointings were required tocover the gamma-ray source contour entirely (see, for example,Champion et al. 2005). Unassociated Fermi-LAT sources aretypically localized to within 10′, which is comparable to radiobeam sizes and therefore makes radio pulsation searches easierand more efficient. With its improved localization accuracy andits homogeneous coverage of the gamma-ray sky, the Fermi-LAT is therefore revealing the population of energetic pulsarsand MSPs, providing a complementary view of the Galacticpopulation of pulsars, which has mostly been studied at radiowavelengths until now.
28 Cycle 3 Fermi Guest Investigator proposal: S. Chatterjee et al.
10

The Astrophysical Journal, 732:47 (11pp), 2011 May 1 Cognard et al.
The Fermi-LAT Collaboration acknowledges generous ongo-ing support from a number of agencies and institutes that havesupported both the development and the operation of the LAT aswell as scientific data analysis. These include the National Aero-nautics and Space Administration and the Department of Energyin the United States, the Commissariat a l’Energie Atomique andthe Centre National de la Recherche Scientifique/Institut Na-tional de Physique Nucleaire et de Physique des Particules inFrance, the Agenzia Spaziale Italiana and the Istituto Nazionaledi Fisica Nucleare in Italy, the Ministry of Education, Culture,Sports, Science and Technology, High Energy Accelerator Re-search Organization and Japan Aerospace Exploration Agencyin Japan, and the K. A. Wallenberg Foundation, the SwedishResearch Council, and the Swedish National Space Board inSweden.
Additional support for science analysis during the operationsphase is acknowledged from the Istituto Nazionale di Astrofisicain Italy and the Centre National d’Etudes Spatiales in France.
The Nancay Radio Observatory is operated by the Paris Ob-servatory, associated with the French Centre National de laRecherche Scientifique. The Green Bank Telescope is operatedby the National Radio Astronomy Observatory, a facility of theNational Science Foundation operated under cooperative agree-ment by Associated Universities, Inc. The Lovell Telescope isowned and operated by the University of Manchester as partof the Jodrell Bank Centre for Astrophysics with support fromthe Science and Technology Facilities Council of the UnitedKingdom.
The authors are greatly saddened by the passing of ProfessorDonald C. Backer in 2010 July. He was not only an outstandingscientist and a leader of the instrumental developments leadingto this paper, but he was also a wonderful friend.
REFERENCES
Abdo, A. A., et al. 2009a, Science, 325, 848Abdo, A. A., et al. 2009b, Science, 325, 840Abdo, A. A., et al. 2009c, Science, 325, 845Abdo, A. A., et al. 2009d, ApJ, 699, 1171Abdo, A. A., et al. 2010a, A&A, 524, A75Abdo, A. A., et al. 2010b, ApJ, 712, 957Abdo, A. A., et al. 2010c, ApJS, 188, 405Abdo, A. A., et al. 2010d, ApJ, 710, 1271Abdo, A. A., et al. 2010e, ApJ, 715, 429Abdo, A. A., et al. 2010f, ApJS, 187, 460Alpar, M. A., Cheng, A. F., Ruderman, M. A., & Shaham, J. 1982, Nature, 300,
728Archibald, A. M., et al. 2009, Science, 324, 1411Atwood, W. B., et al. 2009, ApJ, 697, 1071Bai, X., & Spitkovsky, A. 2010, ApJ, 715, 1270
Becker, W., & Truemper, J. 1997, A&A, 326, 682Bisnovatyi-Kogan, G. S., & Komberg, B. V. 1974, SvA, 18, 217Burrows, D. N., et al. 2005, Space Sci. Rev., 120, 165Cash, W. 1979, ApJ, 228, 939Champion, D. J., McLaughlin, M. A., & Lorimer, D. R. 2005, MNRAS, 364,
1011Cognard, I., & Theureau, G. 2006, in IAU Joint Discussion, 2, On the Present
and Future of Pulsar Astronomy, 36Cognard, I., Theureau, G., Desvignes, G., & Ferdman, R. 2009, arXiv:0911.1612Cordes, J. M., & Lazio, T. J. W. 2002, arXiv:astro-ph/0207156v3de Jager, O. C., & Busching, I. 2010, A&A, 517, L9de Jager, O. C., Raubenheimer, B. C., & Swanepoel, J. W. H. 1989, A&A, 221,
180Dyks, J., & Rudak, B. 2003, ApJ, 598, 1201Evans, P. A., et al. 2007, A&A, 469, 379Freire, P. C. C., & Wex, N. 2010, MNRAS, 409, 199Gehrels, N., et al. 2004, ApJ, 611, 1005Gelman, A., & Rubin, D. 1992, Stat. Sci., 7, 457Guan, Y., Fleissner, R., Joyce, P., & Krone, S. M. 2006, Stat. Comput., 16, 193Harding, A. K., Usov, V. V., & Muslimov, A. G. 2005, ApJ, 622, 531Hastings, W. K. 1970, Biometrika, 57, 97Heinke, C. O., Rybicki, G. B., Narayan, R., & Grindlay, J. E. 2006, ApJ, 644,
1090Hobbs, G., Lyne, A. G., Kramer, M., Martin, C. E., & Jordan, C. 2004, MNRAS,
353, 1311Hobbs, G. B., Edwards, R. T., & Manchester, R. N. 2006, MNRAS, 369, 655Kalberla, P. M. W., Burton, W. B., Hartmann, D., Arnal, E. M., Bajaja, E.,
Morras, R., & Poppel, W. G. L. 2005, A&A, 440, 775Keith, M., et al. 2011, MNRAS, in press (arXiv:1102.0648v1)Lange, C., Camilo, F., Wex, N., Kramer, M., Backer, D. C., Lyne, A. G., &
Doroshenko, O. 2001, MNRAS, 326, 274Lorimer, D. R. 2008, Living Rev. Relativ., 11, 8Lorimer, D. R., & Kramer, M. (ed.) 2005, Handbook of Pulsar Astronomy
(Cambridge: Cambridge Univ. Press)Manchester, R. N., Hobbs, G. B., Teoh, A., & Hobbs, M. 2005, AJ, 129, 1993Marinari, E., & Parisi, G. 1992, Europhys. Lett., 19, 451Mattox, J. R., et al. 1996, ApJ, 461, 396Monet, D. G., et al. 2003, AJ, 125, 984Muslimov, A. G., & Harding, A. K. 2004, ApJ, 617, 471Muslimov, A. G., & Harding, A. K. 2009, ApJ, 692, 140Myers, S. T., et al. 2003, MNRAS, 341, 1Phinney, E. S. 1992, Phil. Trans. R. Soc. A, 341, 39Ransom, S. M., Eikenberry, S. S., & Middleditch, J. 2002, AJ, 124, 1788Ransom, S. M., et al. 2011, ApJ, 727, L16Ravi, V., Manchester, R. N., & Hobbs, G. 2010, ApJ, 716, L85Ray, P. S., et al. 2011, ApJS, in press (arXiv:1011.2468v2)Reid, M. J., et al. 2009, ApJ, 700, 137Romani, R. W., & Yadigaroglu, I. 1995, ApJ, 438, 314Roming, P. W. A., et al. 2005, Space Sci. Rev., 120, 95Shklovskii, I. S. 1970, SvA, 13, 562Story, S. A., Gonthier, P. L., & Harding, A. K. 2007, ApJ, 671, 713Theureau, G., et al. 2005, A&A, 430, 373Theureau, G., et al. 2011, A&A, 525, A94Thompson, D. J., et al. 1999, ApJ, 516, 297Venter, C., Harding, A. K., & Guillemot, L. 2009, ApJ, 707, 800Verbiest, J. P. W., et al. 2009, MNRAS, 400, 951Zhu, C., Byrd, R. H., Lu, P., & Nocedal, J. 1997, ACM Trans. Math. Softw., 23,
550
11