discovery of distinct immune phenotypes using machine
TRANSCRIPT

DOI: 10.1161/CIRCRESAHA.118.313911 1
Discovery of Distinct Immune Phenotypes Using Machine Learning in Pulmonary Arterial Hypertension
Andrew J. Sweatt1,2, Haley K. Hedlin3, Vidhya Balasubramanian3, Andrew Hsi2, Lisa K. Blum4, William
H. Robinson4, Francois Haddad5,6, Peter M. Hickey7, Robin A. Condliffe8, Allan Lawrie7, Mark R. Nicolls1,2,9, Marlene Rabinovitch2,10, Purvesh Khatri9,11, Roham T. Zamanian1,2
1Division of Pulmonary and Critical Care Medicine, Stanford University (Stanford, CA, USA); 2Vera
Moulton Wall Center for Pulmonary Vascular Disease, Stanford University (Stanford, CA, USA); 3Quantitative Sciences Unit, Stanford University (Stanford, CA, USA); 4Division of Immunology and
Rheumatology, Stanford University (Stanford, CA, USA); 5Division of Cardiovascular Medicine, Stanford University (Stanford, CA, USA); 6Stanford Cardiovascular Institute, Stanford University
(Stanford, CA, USA); 7Department of Infection, Immunity, and Cardiovascular Disease, University of Sheffield (Sheffield,UK); 8Sheffield Pulmonary Vascular Disease Unit, Royal Hallamshire Hospital
(Sheffield, UK); 9Institute for Immunity, Transplantation, and Infection, Stanford University (Stanford, CA, USA); 10Department of Pediatric Cardiology, Stanford University (Stanford, CA, USA), and;
11 Division of Biomedical Informatics Research, Stanford University (Stanford, CA, USA)
Running title: Pulmonary Arterial Hypertension Immune Phenotyping Subject Terms: Growth Factors/Cytokines Inflammation Proteomics Pulmonary Hypertension Address correspondence to: Dr. Andrew J. Sweatt 300 Pasteur Drive Room H2143, MC 5236 Stanford, CA 94305 Tel: 650-736-3677 [email protected] In December 2018, the average time from submission to first decision for all original research papers submitted to Circulation Research was 14.99 days.
Dow
nloaded from http://ahajournals.org by on January 22, 2019
DOI: 10.1161/CIRCRESAHA.118.313911 2
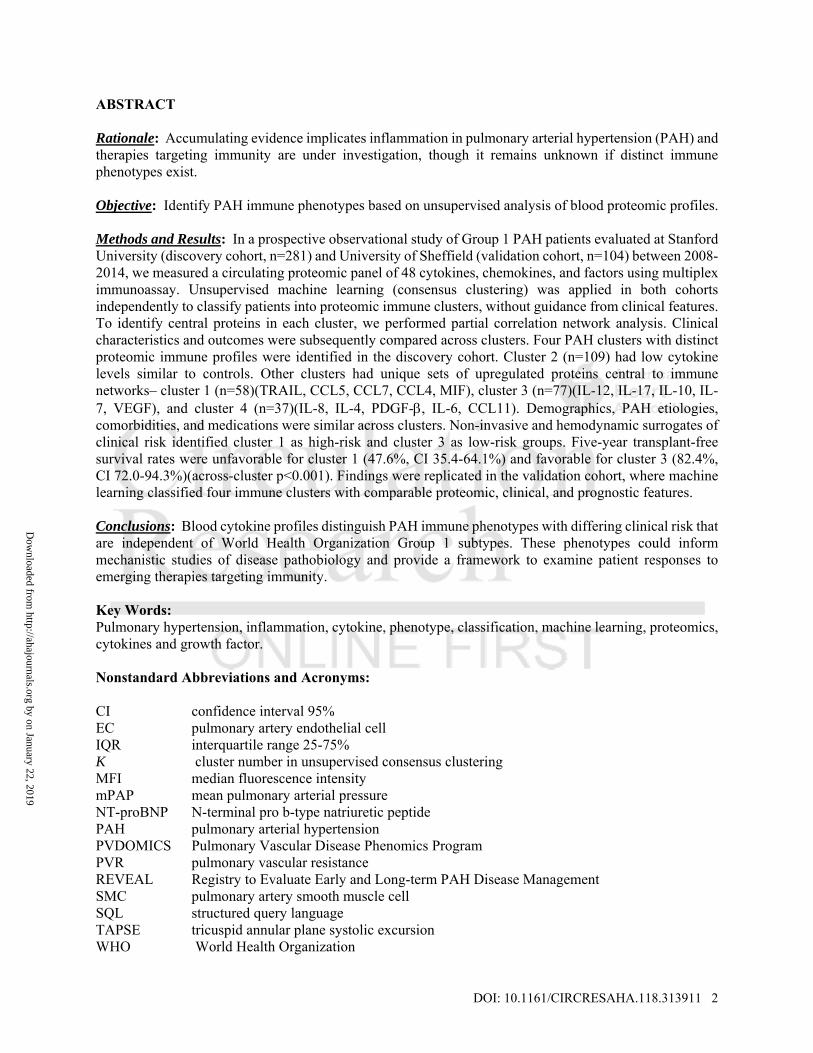
ABSTRACT Rationale: Accumulating evidence implicates inflammation in pulmonary arterial hypertension (PAH) and therapies targeting immunity are under investigation, though it remains unknown if distinct immune phenotypes exist. Objective: Identify PAH immune phenotypes based on unsupervised analysis of blood proteomic profiles. Methods and Results: In a prospective observational study of Group 1 PAH patients evaluated at Stanford University (discovery cohort, n=281) and University of Sheffield (validation cohort, n=104) between 2008-2014, we measured a circulating proteomic panel of 48 cytokines, chemokines, and factors using multiplex immunoassay. Unsupervised machine learning (consensus clustering) was applied in both cohorts independently to classify patients into proteomic immune clusters, without guidance from clinical features. To identify central proteins in each cluster, we performed partial correlation network analysis. Clinical characteristics and outcomes were subsequently compared across clusters. Four PAH clusters with distinct proteomic immune profiles were identified in the discovery cohort. Cluster 2 (n=109) had low cytokine levels similar to controls. Other clusters had unique sets of upregulated proteins central to immune networks– cluster 1 (n=58)(TRAIL, CCL5, CCL7, CCL4, MIF), cluster 3 (n=77)(IL-12, IL-17, IL-10, IL-7, VEGF), and cluster 4 (n=37)(IL-8, IL-4, PDGF-, IL-6, CCL11). Demographics, PAH etiologies, comorbidities, and medications were similar across clusters. Non-invasive and hemodynamic surrogates of clinical risk identified cluster 1 as high-risk and cluster 3 as low-risk groups. Five-year transplant-free survival rates were unfavorable for cluster 1 (47.6%, CI 35.4-64.1%) and favorable for cluster 3 (82.4%, CI 72.0-94.3%)(across-cluster p<0.001). Findings were replicated in the validation cohort, where machine learning classified four immune clusters with comparable proteomic, clinical, and prognostic features. Conclusions: Blood cytokine profiles distinguish PAH immune phenotypes with differing clinical risk that are independent of World Health Organization Group 1 subtypes. These phenotypes could inform mechanistic studies of disease pathobiology and provide a framework to examine patient responses to emerging therapies targeting immunity. Key Words: Pulmonary hypertension, inflammation, cytokine, phenotype, classification, machine learning, proteomics, cytokines and growth factor. Nonstandard Abbreviations and Acronyms: CI confidence interval 95% EC pulmonary artery endothelial cell IQR interquartile range 25-75% K cluster number in unsupervised consensus clustering MFI median fluorescence intensity mPAP mean pulmonary arterial pressure NT-proBNP N-terminal pro b-type natriuretic peptide PAH pulmonary arterial hypertension PVDOMICS Pulmonary Vascular Disease Phenomics Program PVR pulmonary vascular resistance REVEAL Registry to Evaluate Early and Long-term PAH Disease Management SMC pulmonary artery smooth muscle cell SQL structured query language TAPSE tricuspid annular plane systolic excursion WHO World Health Organization
Dow
nloaded from http://ahajournals.org by on January 22, 2019

DOI: 10.1161/CIRCRESAHA.118.313911 3
INTRODUCTION
Pulmonary arterial hypertension (PAH) is a heterogeneous disorder that rarely presents in isolation and is more commonly associated with a range of predisposing factors including genetic mutations, drug or toxin exposures, and various systemic diseases. The World Health Organization (WHO) classification defines Group 1 PAH subtypes according to etiology,1 a practical system that has cultivated productive dialogue among clinicians and shaped the current approach to patient care. However, this broad clinical classification may ignore subtle pathophysiologic differences across patients that could contribute to observed variation in rates of disease progression and outcomes. Moreover, clinical PAH subclasses neither inform therapy selection nor forecast the diverse responses to treatment.2 To address and deconstruct sources of disease heterogeneity, PAH consensus statements have called for ‘deep phenotyping’ approaches that center on high-throughput molecular data and leverage modern computational tools. Identification of PAH endophenotypes may translate to patient classification schemes that sit closer to underlying pathobiology, assist in clinical trial cohort selection, and pave a road to precision medicine.3-5
An expanding body of knowledge indicates that inflammation and autoimmunity underlie PAH pathogenesis. Pre-clinical work suggests that aberrant reparative immunity and loss of self-tolerance result in exuberant inflammation, which appears to perpetuate vascular injury and remodeling.6-8 In PAH patients, inflammatory cells localize around remodeled lung vessels and levels of multiple cytokines are abnormally elevated in peripheral blood.9, 10 Immunity may therefore offer a logical platform for PAH molecular phenotyping. It remains unknown if different degrees and forms of inflammation exist across patients, or whether WHO Group 1 subtypes have characteristic immune profiles. The circulating immune milieu has not been investigated across subtypes or examined as a multivariable profile with system-based analysis, as existing studies have only assessed the prognostic significance of individual inflammatory markers in idiopathic PAH.11, 12 These studies and other reported molecular phenotyping efforts to date have inherent limitations, as analyses are anchored to specific clinical definitions and PAH subtypes that may not adequately reflect disease heterogeneity.13-17 ‘Unsupervised’ phenotyping is a more agnostic strategy, where molecular profiles directly define phenotypes that are subsequently related to clinical characteristics.18 These molecular phenotypes can be identified by machine learning, which is the inference of substructure in complex unlabeled data with computer algorithms.
Unsupervised immune phenotyping efforts are warranted to determine if inflammation is an important source of heterogeneity and a viable framework for patient classification in PAH. We hypothesized that immune heterogeneity exists for all forms of Group 1 PAH and that patient subsets may express distinct patterns of inflammation in blood. In this study, we aimed to identify PAH immune phenotypes by using unsupervised machine learning to classify patients based on circulating proteomic profiles of cytokines, chemokines, and growth factors. We postulated that this molecular phenotyping approach may identify immune phenotypes that have distinct proteomic profiles, are independent of Group 1 PAH subtypes, and associated with differing clinical disease severity and outcomes.
Dow
nloaded from http://ahajournals.org by on January 22, 2019

DOI: 10.1161/CIRCRESAHA.118.313911 4
METHODS Data sharing. De-identified proteomic and clinical data supporting the findings of this study are available from the corresponding author upon appropriate request. Study population and design. In this prospective observational study of Group 1 PAH patients who had peripheral blood biobanked at Stanford University between 2008-2014 (discovery cohort, n=281) and the University of Sheffield between 2009-2012 (external validation cohort, n=104), a proteomic immune panel was measured and utilized for unsupervised molecular phenotyping. PAH was confirmed hemodynamically with mean pulmonary arterial pressure (mPAP) ≥25 mmHg, pulmonary vascular resistance (PVR) >240 dynes·sec/cm5, and pulmonary arterial wedge pressure ≤15 mmHg.1 The discovery cohort included patients with incident (treatment naïve) and prevalent PAH (on therapy). Peripheral venous blood was collected from the antecubital fossa during diagnostic or surveillance cardiac catheterization, then plasma was processed and stored in the Stanford Pulmonary Hypertension Biobank (online supplement p.1). Of patients with available samples (n=301), we excluded those with chronic infections (n=7), active malignancy (n=4), primary immunodeficiency (n=1), or acute illness other than decompensated right heart failure within one month of sampling (n=8). The Vera Moulton Wall Center structured query language (SQL) relational database (online supplement p.2-3) was used to capture patient demographics, PAH etiology, comorbidities, clinical disease metrics available within one month of blood sampling (non-invasive markers and hemodynamics), background therapies, and survival data. Plasma was also obtained for proteomic measurements from age-matched healthy controls (n=88), who were screened at Stanford by questionnaire, bloodwork, echocardiography, and multi-site vascular ultrasound (online supplement p.1). Validation cohort PAH samples were collected from treatment naïve subjects at the time of diagnostic catheterization, then stored in the Sheffield Pulmonary Vascular Disease Unit biobank (online supplement p.1-2). Validation cohort clinical features were obtained from a SQL database that links University of Sheffield hospital records and survival data from National Health Service Digital (online supplement p.3). Comorbidity and NT-proBNP data were unavailable in the validation cohort, and the incremental shuttle walk test (ambulation around cones nine meters apart at externally-cued speed that is escalated until patient fatigues or fails to keep pace) was used in place of the six-minute walk to assess functional capacity. In the discovery cohort, the immune phenotyping approach entailed (i) unsupervised machine learning (consensus clustering) to identify PAH clusters based on proteomic immune profiles without guidance from clinical data, then (ii) proteomic network analysis to ascertain central proteins in discovered clusters, and (iii) comparison of clinical features across clusters (Figure 1A). We then reapplied unsupervised consensus clustering in the validation cohort, to determine if the approach yielded immune clusters with cytokine profiles and clinical characteristics similar to those identified in the discovery stage (Figure 1B). Proteomic measurement and pre-processing. We measured a panel of 48 cytokines, chemokines, and growth factors using the Bio-Plex® multiplex immunoassay (Bio-Rad Inc., Hercules, CA)(Online Table I), a magnetic bead-based flow cytometric platform built on Luminex® xMAP™ technology (Luminex Corporation, Austin, TX) that simultaneously quantifies numerous proteins in samples. Our immunoassay protocol adhered to manufacturer instructions (online supplement p.3-4). Median fluorescence intensity (MFI) was detected for each protein with a Luminex 200™ instrument. We did not derive absolute protein concentration from this signal, as MFI does not require detection limit censoring, better quantifies analytes with low abundance, and has greater statistical power in downstream analysis.19 Data pre-processing involved background fluorescence subtraction and robust quantile normalization. We adjusted for plate and batch effects by empirical Bayes methodology (online supplement p.4),20 and visualized adjustments with principal component analysis (Online Figure I). All data were pre-processed and analyzed with R software version 3.3.5.
Dow
nloaded from http://ahajournals.org by on January 22, 2019

DOI: 10.1161/CIRCRESAHA.118.313911 5
Immune cluster identification: Unsupervised machine learning. We utilized unsupervised consensus clustering to sort PAH patients into clusters based on proteomic immune profiles (online supplement p.4-5). This resampling-based analysis framework guides any clustering algorithm to achieve more robust data partitioning.21, 22 Across runs of a specified clustering algorithm on numerous dataset subsamples, cluster assignment stability is objectively assessed to determine the number of clusters without a priori knowledge. We implemented consensus clustering with 1,000 resampling iterations (95% of patients/subsample) over a cluster number (k) range of k=2-20. The k optimizing clustering stability was ascertained by analyzing consensus matrix heatmaps (Online Figure IIA), consensus cumulative distribution functions (Online Figure IIB), and the proportion of ambiguously clustered pairs (Online Table II).21, 23 To ‘tune’ discovery cohort consensus clustering, we independently applied three algorithms (k-means, k-medoids, hierarchical) with five different distance metrics (15 total combinations) and determined which input parameters returned clusters with the best internal validity statistics (Online Table III). Based on this tuning, consensus clustering was ultimately applied with the k-medoids algorithm and Euclidean distance in both cohorts. To evaluate the face validity of final clusters (confirm between-cluster proteomic variance) and compare profiles between discovery and validation clusters, patient-level data was visualized with principal component analysis and standardized heatmaps. Proteomic network analysis by cluster. A weighted protein-protein partial correlation network was constructed as a force-directed graph for each discovery cohort cluster, to examine multivariable proteomic relationships, map out multicollinearity, and identify central network cytokines (Gaussian graphical modeling)(online supplement p.5-8). Partial correlations were calculated for each of the 1,128 protein-protein pairs, controlling for interactions with all other proteomic covariates. The Fruchterman-Reingold modeling algorithm was used to graph force-directed networks,24, 25 where each measured protein was a network node, and partial correlations were represented by weighted edges that connected node pairs. Nodes behaved like atomic particles and naturally repulsed each other, while edges attracted node pairs with spring-like forces that reflected partial correlations. The algorithm found the network configuration with minimal energy closest to equilibrium. Saturated networks were initially constructed, with all edges retained regardless of partial correlation weights. To limit false positive edges and draw interpretable ‘sparse core networks’, graphical LASSO regularization was applied with model selection by the extended Bayesian information criterion.26 Network node centrality indices (strength, closeness, and betweenness) were calculated to identify central proteins in each cluster network.27 Clinical comparison of clusters. Clinical characteristics at blood sampling were compared across clusters by applying the one-way ANOVA or Kruskal-Wallis test for continuous variables and the chi-square or Fisher’s exact test for categorical data. When across-cluster differences were statistically significant (p<0.05), we performed pairwise cluster comparisons (Dunn’s test or independent two-cluster tests as applicable) and adjusted p-values for multiple testing (Benjamini-Hochberg method). In the discovery cohort, the outcome of time to death or lung transplantation from blood sampling was assessed. Patients without events were right-censored at their last encounter preceding data lock (August 2016). Kaplan-Meier estimates of transplant-free survival were compared across PAH clusters by log-rank test. In sensitivity analysis, we repeated Kaplan-Meier estimates among treatment naïve patients. In the validation cohort, the outcome of time to death was assessed during the five-year period that followed blood sampling. Validation Kaplan-Meier survival analysis did not require censoring, as death data was captured from the NHS Digital for all subjects including those lost to follow-up at University of Sheffield. In pooled analysis across discovery and validation cohorts, we performed multivariable Cox proportional hazards modeling to assess the five-year risk of death associated with each immune cluster adjusted for age, sex, PAH etiology, and other clinical covariates with significance in univariate analysis (examined variables included treatment status, functional class, and hemodynamic parameters).
Dow
nloaded from http://ahajournals.org by on January 22, 2019
DOI: 10.1161/CIRCRESAHA.118.313911 6
Sample size estimation and bias minimization. Given the exploratory nature of this study and our methodology, it was not possible to estimate cohort size a priori. No pre-existing data was available to indicate the number or relative size of immune clusters to expect, and there is no accepted guideline for determining needed sample size in unsupervised clustering. However, care was taken to minimize sources of bias across several facets of the study. The overall approach was inherently unbiased, as we (a) classified patients by molecular data alone without guidance from clinical features, and (b) analyzed cytokines as an interrelated system without focus on any particular mediator or pathway. To eliminate potential cohort selection bias, we included consecutively biobanked patients regardless of PAH subtype. The proteomic panel was broad by design, including mediators implicated in PAH pathogenesis and others not previously linked to the disease. To minimize measurement bias plasma collection and processing were carefully protocolized, samples were assayed within three years of storage, freeze-thaw cycling was avoided, single lot numbers were used for reagents, and we plate/batch-adjusted proteomic data to eliminate non-biological variation. Samples were balanced across assay plates by age, sex, and PAH etiology to ensure this adjustment did not mask any clustering relationships with these variables. Many aspects of our clustering methodology were also intended eliminate bias including the resampling-based framework, normalization of proteomic measurements to ensure all cytokines had equal weight, data-driven determination of cluster number, and use of objective criteria to select the specific clustering algorithm and distance metric applied. RESULTS Discovery cohort Cohort characteristics at blood sampling.
PAH patients (n=281) had a median age of 52 years (25-75% interquartile range [IQR] 41-63 years), and most were female (n=206, 73.3%)(Table 1). Median time from diagnosis to proteomic sampling was 1.0 years (0.0-4.7). Underlying PAH etiologies included connective tissue disease (n=87, 31.0%), idiopathic (n=84, 29.9%), drugs and toxins (n=49, 17.4%), congenital heart disease (n=38, 13.5%), and portal hypertension (n=19, 6.8%). Most patients were functional class III-IV (n=175, 62.3%), with median six-minute walk distance of 400 meters (306-491). PAH was hemodynamically severe with mPAP 47 mmHg (36-59), PVR 720 dynes·sec/cm5 (424-1104), and cardiac index 2.1 mL/min/m2 (1.7-2.4). Subjects were most often treatment naïve (n=123, 43.8%) or on PAH monotherapy (n=73, 26.0%). PAH patients partition into four proteomic immune clusters.
Unsupervised machine learning identified four patient clusters that each expressed a distinct blood proteomic immune profile (Figure 2A). Of 281 discovery cohort patients, 172 (61.2%) stratified into the three clusters that had evidence of circulating inflammation (clusters 1, 3, and 4), while the remaining 109 subjects (38.8%) in cluster 2 had low cytokine and factor levels that were similar to healthy controls. Cluster 4 was the smallest subgroup (n=37, 13.2%) and had the highest levels of several immune mediators (nearly half of measured proteins were >1.5 standard deviations above the overall PAH mean). Similar proteins were upregulated in cluster 3 (n=77, 27.4%), but at a lower magnitude (~0.5 standard deviations above PAH mean). Among cluster 1 patients (n=58, 20.6%), an entirely different set of cytokines and factors was upregulated. Principal component analysis confirmed proteomic variance between the machine learned clusters (Figure 2B), where clusters 2, 3, and 4 partitioned along the first principal component, cluster 1 was distinguished by the second principal component, and healthy controls overlapped cluster 2. PAH
Dow
nloaded from http://ahajournals.org by on January 22, 2019

DOI: 10.1161/CIRCRESAHA.118.313911 7
cluster assignments also demonstrated stability across 1,000 machine learning algorithm iterations, as intra-cluster consensus rates were 92.5, 95.5, 95.0, and 98.2%, respectively, in clusters 1–4 (Online Figure IIC). Network analysis identifies central cytokine signatures in immune clusters.
When we examined multivariable protein-protein relationships by PAH cluster with partial correlation networks, each cluster displayed a characteristic proteomic network structure (Figure 3A). Clusters were also differentiated by a unique central network signature (Figure 3B), which was defined by upregulated proteins that had high measures of network centrality (strength, closeness, and betweenness centralities exceeded the mean of all network nodes, as shown in Online Figure IV)– cluster 1 (9 proteins), cluster 3 (13 proteins), and cluster 4 (15 proteins). Of upregulated proteins in cluster 1, TRAIL had the highest quantified network centrality, followed by CCL5, CCL7, CCL4, MIF, and TNF-. In cluster 3, upregulated analytes with the top centrality measures were IL-12, IL-17, IL-10, IL-7, VEGF, and IL-15. For cluster 4, these proteins were IL-8, IL-4, PDGF-, IL-6, CCL11, and IL-9. A central network signature was not identified in cluster 2, as no measured analytes were upregulated. A few proteins were part of the central network signature in two different clusters (cluster 1 and 3 had CCL7 in common, and cluster 3 and 4 shared IL-12, IL-7, IL-15, and IL-1), though no single cytokine was central in three or more clusters. The overall strength of protein-protein relationships also differed across clusters (Online Figure V shows partial correlation heatmaps). Pairwise partial correlations were the strongest in cluster 1 (coefficient 75-90th percentile range 0.402-0.542) and cluster 4 (0.389-0.526). These network graphs reflected stronger relationships, as nodes were densely spaced and embedded subnetworks were present. In contrast, partial correlations were weaker in cluster 2 (0.173-0.245) and cluster 3 (0.229-0.328), translating to networks with wider node spacing. Table 1. Discovery cohort: characteristics at the time of blood sampling (n=281).
Demographics and PAH etiology
Age*, years, median (25-75% IQR) 52 (41-63) Female sex*, n (%) 206 (73.3) Race, n (%) Caucasian 155 (55.2) Asian 49 (17.4) Hispanic 43 (15.3) Black 19 (6.8) PAH etiology, n (%) Connective tissue disease-APAH 87 (31.0) Idiopathic PAH 84 (29.9) Drugs and toxins-APAH 49 (17.4) Congenital heart disease-APAH 38 (13.5) Portopulmonary hypertension 19 (6.8) Hereditary PAH 4 (1.4)
Sample timing relative to PAH clinical presentation
Time interval, years, median (IQR) PAH diagnosis to plasma collection 1.0 (0.0-4.7) PAH symptom onset to plasma collection
3.0 (1.1-5.8)
Dow
nloaded from http://ahajournals.org by on January 22, 2019

DOI: 10.1161/CIRCRESAHA.118.313911 8
Non-invasive disease metrics
NYHA functional class, n (%) Class I 17 (6.0) Class II 89 (31.7) Class III 141 (50.2) Class IV 34 (12.1) Six-minute walk distance†, m, median (IQR)
400 (306-491)
NT-proBNP, pg/mL, median (IQR) 312 (93-1422) DLCO †, % predicted, median (IQR) 69 (50-84) GFR, ml/min/1.73 m3, median (IQR) 57 (53-87)
Hemodynamics and PAH-guided therapy
Invasive hemodynamics, median (IQR) Mean pulmonary arterial pressure, mmHg
47 (36-59)
Pulmonary vascular resistance†, dynes·sec/cm5 720 (424-1104)
Cardiac index†, L/min/m2 2.1 (1.7-2.4) Mean right atrial pressure†, mmHg 8 (5-12) Pulmonary arterial wedge pressure, mmHg
10 (8-14)
Extent of PAH therapy, n (%) Treatment naïve 123 (43.8) Monotherapy 73 (26.0) Dual therapy 63 (22.4) Triple therapy 22 (7.8)
* Healthy controls (n=88): median age 58 yrs (IQR 44-69), female n=46 (52.3%) † Missing data: six-minute walk distance (n=15), DLCO (n=19), pulmonary vascular resistance by Fick (n=2), cardiac index by Fick (n=4), right atrial pressure (n=2) Abbreviations: APAH= associated pulmonary arterial hypertension, DLCO= diffusion capacity of lung, GFR= glomerular filtration rate, IQR= 25-75% interquartile range, NYHA= New York Heart Association, NT-proBNP= N-terminal pro b-type natriuretic peptide
Immune clusters are not differentiated by circulating cell subsets.
No significant differences were found across clusters for circulating total white blood cell count and the percent or absolute count of neutrophils, lymphocytes, monocytes, basophils, and eosinophils (Online Figure VI).
Dow
nloaded from http://ahajournals.org by on January 22, 2019

DOI: 10.1161/CIRCRESAHA.118.313911 9
Immune clusters are independent of PAH subtypes and duration of illness.
The overall distribution of PAH etiologies was similar across clusters (p=0.110)(Figure 4A, Online Table IV). While idiopathic PAH was overrepresented in cluster 3 (40.2% vs other clusters 17.2–29.7%) and congenital heart disease-associated PAH was more common in cluster 2 (21.1% vs other clusters 7.8–10.3%), differences were relatively small in magnitude. Moreover, none of the Group 1 PAH subtypes appeared to have a distinct immune profile (Online Figure VII). Median times from PAH diagnosis and patient-reported symptom onset to plasma collection did not differ significantly across clusters (Table 2, Online Table V and Figure VIII). Immune clusters are not associated with patient demographics, comorbidities, or background therapies.
Proteomic-based PAH clusters were similar with respect to age, sex, race, and several relevant comorbidities (Table 2). Furthermore, neither the extent nor class of background PAH-specific therapy differed significantly between clusters (Online Figure IX). While prostanoid therapy was less common in cluster 4 (10.8%) versus other clusters (26.0-34.5%), the finding did not reach statistical significance (p=0.061). Similar proportions in each cluster were on adjunctive PAH treatments, immune modulators, non-steroidal anti-inflammatory drugs, and allergy agents. In a subgroup analysis where clustering was restricted to subjects without background immune modulators (n=219)(Online Figure X), all patients retained their original cluster assignment and cluster proteomic profiles were similar to those observed in total cohort analysis. Immune clusters have different clinical risk profiles.
For multiple established surrogates of PAH clinical risk, cluster 1 was the highest-risk group, cluster 3 was the lowest-risk, and clusters 2 and 4 were intermediate-risk (Figure 4B, Online Table VI). Compared to cluster 3, cluster 1 had a greater patient proportion with functional class IV symptoms (22.4 vs 5.4%, p=0.022), NT-proBNP >1500 pg/mL (39.7 vs 14.3%, p=0.007), and high-risk composite REVEAL score (36.2 vs 13.0%, p=0.012). Conversely, more patients in cluster 3 had six-minute walk distance >440 meters (51.4 vs 26.3%, p=0.039), NT-proBNP <300 pg/mL (61.0 vs 37.9%, p=0.046), and low or average-risk REVEAL score (79.2 vs 55.2%, p=0.027). Echocardiographic right ventricular function was the most impaired in cluster 1 (Online Table VII), where fractional area change was significantly lower than cluster 3 (median 24% [21-28] vs 29% [25-34], p=0.028), and a greater percentage of patients had TAPSE 1.6 cm (53.8%) than in cluster 2 (32.2%, p=0.04) and cluster 3 (30.0%, p=0.04). Hemodynamic comparison (Online Table VIII and Figure XI) revealed that mPAP was more elevated in cluster 1 (52 mmHg [45-60]) than cluster 2 (46 mmHg [34-60], p=0.045) and cluster 3 (45 mmHg [35-54], p=0.005). Right atrial pressure was also higher in cluster 1 (11 mmHg [5-14]) than cluster 2 (8 mmHg [5-11], p=0.041), cluster 3 (7 mmHg [5-10], p=0.030), and cluster 4 (6 mmHg [4-6], p=0.002). However, no significant cluster differences existed for PVR, cardiac index, or wedge pressure. Long-term outcomes differ across immune clusters.
Discovery cohort patients were followed for a median of 3.0 years (IQR 1.4-4.8) from plasma sampling. In total, 62 subjects died and 17 underwent transplantation (8.7 events/100-patient-years). Events occurred in 50.0% of cluster 1 patients (n=29/58, 22 deaths, 7 transplants), 29.7% of cluster 4 (n=11/37, 10 deaths, 1 transplant), 27.5% of cluster 2 (n=30/109, 24 deaths, 6 transplants), and only 11.6% of cluster 3 (n=9/77, 6 deaths, 3 transplants). At five years, the Kaplan-Meier estimated transplant-free survival rate was highest in cluster 3 (82.4%, confidence interval 72.0-94.3%), lowest in cluster 1 (47.6%, CI 35.4-64.1%), and intermediate for cluster 2 (66.6%, CI 56.7-78.3%) and cluster 4 (66.0%, CI 51.3-84.7%)(across-cluster p<0.001) (Figure 4C). Similar cluster survival differences were observed when analysis was limited to patients who were treatment naïve at plasma sampling (Online Figure XII).
Dow
nloaded from http://ahajournals.org by on January 22, 2019

DOI: 10.1161/CIRCRESAHA.118.313911 10
Table 2. Discovery cohort: Comparison of demographics, duration of illness, comorbid conditions, and background medications across PAH immune clusters.
Cluster 1
(n=58) Cluster 2 (n=109)
Cluster 3 (n=77)
Cluster 4 (n=37)
p-value *
Age, years, mean SD 49 14 54 16 51 15 49 14 0.109
Female sex, n (%) 40 (69.0) 80 (73.4) 62 (80.5) 24 (64.9) 0.266
Race, n (%)
Caucasian 28 (48.3) 59 (54.1) 45 (58.4) 23 (62.2) 0.527
Black 1 (1.7) 10 (9.1) 7 (9.1) 1 (2.7) 0.124
Hispanic 13 (22.4) 15 (13.8) 15 (19.5) 7 (18.9) 0.353
Asian 10 (17.2) 17 (15.6) 15 (19.5) 7 (18.9) 0.911
BMI, kg/m2, median (IQR) 27 (24-34) 28 (24-32) 27 (23-32) 28 (23-33) 0.975
Time from PAH diagnosis, years, median (IQR)
1.1 (0.0-5.4) 1.3 (0.0-5.3) 0.9 (0.0-3.5) 0.0 (0.0-4.6) 0.193
Comorbid conditions †, n (%)
Mild COPD/emphysema 1 (1.7) 9 (8.3) 7 (9.1) 1 (2.7) 0.221
Mild radiographic ILD 7 (12.1) 15 (13.8) 8 (10.4) 6 (16.2) 0.824
Asthma 5 (10.3) 16 (14.7) 11 (14.2) 6 (16.2) 0.663
OSA (on PAP therapy) 20 (20.7) 36 (33.0) 22 (28.6) 10 (27.0) 0.411
CAD or ischemic stroke 2 (3.4) 12 (11.0) 7 (9.1) 1 (2.7) 0.237
Essential hypertension 12 (20.7) 35 (32.1) 19 (24.7) 11 (29.7) 0.405
Chronic kidney disease 22 (37.9) 42 (38.5) 27 (35.1) 10 (27.0) 0.632
Diabetes mellitus 8 (13.8) 20 (18.3) 10 (13.0) 3 (8.1) 0.446
Hyperlipidemia 8 (13.8) 28 (25.7) 22 (28.6) 5 (13.5) 0.089
Thyroiditis 5 (8.6) 11 (10.1) 5 (6.5) 1 (2.7) 0.563
PAH-specific therapies, n (%)
Treatment naïve 22 (37.9) 44 (40.4) 37 (48.1) 20 (54.1) 0.323
Monotherapy 18 (31.0) 26 (23.9) 21 (27.3) 8 (21.6) 0.692
Dual or triple therapy 18 (31.0) 39 (35.8) 19 (24.7) 9 (24.3) 0.341
Phosphodiesterase-5 inhibitor
25 (43.1) 52 (47.7) 30 (39.0) 14 (37.9) 0.594
Endothelin receptor antagonist
15 (25.9) 31 (28.4) 13 (16.9) 9 (24.3) 0.334
Prostanoid 20 (34.5) 34 (31.2) 20 (26.0) 4 (10.8) 0.061
Other background agents, n (%)
Calcium channel blocker ‡ 11 (19.0) 25 (22.9) 15 (19.5) 7 (18.9) 0.901
Loop diuretic 38 (65.5) 64 (58.7) 45 (58.4) 18 (48.6) 0.448
Aldosterone antagonist 21 (36.2) 28 (25.7) 21 (27.3) 9 (24.3) 0.478
Dow
nloaded from http://ahajournals.org by on January 22, 2019

DOI: 10.1161/CIRCRESAHA.118.313911 11
Anticoagulation 21 (36.2) 39 (35.8) 20 (26.0) 9 (24.3) 0.324
Any immune modulator § 17 (29.3) 22 (20.2) 17 (22.2) 6 (16.2) 0.435
Aspirin or other NSAID 15 (25.9) 36 (33.0) 25 (32.5) 8 (21.6) 0.491
Anti-histamine/leukotriene 7 (12.1) 16 (14.7) 15 (19.5) 5 (13.5) 0.653
* Across-cluster comparisons: Continuous data compared by one-way ANOVA test (variables with normal distribution) or Kruskal-Wallis test (non-symmetric distribution). Categorical variables compared by chi-square or Fisher’s exact test, as appropriate. † Pulmonary comorbidities were not the primary etiology of pulmonary hypertension. See online supplemental methods for definitions. ‡ CCB indications: Raynaud’s phenomenon (n=28), vasoreactive PAH (n=22), essential hypertension (n=8) § Immune modulating agents: prednisone, mycophenolate mofetil, hydroxychloroquine, leflunomide, azathioprine, tacrolimus, bortezomib, anakinra, rituximab, or cyclophosphamide. All but two patients were on multi-agent immune modulator regimens. Abbreviations: BMI= body mass index, CAD= coronary artery disease, COPD= chronic obstructive pulmonary disease, CTD= connective tissue disease, ILD= interstitial lung disease, IQR= interquartile range 25-75%, NSAID= non-steroidal anti-inflammatory drug, OSA= obstructive sleep apnea, PAP= positive airway pressure, SD= standard deviation
Validation cohort. Cohort characteristics at blood sampling.
Validation cohort patients had median age of 60 years (IQR 51-66), most were female (n=65)(62.5%), and nearly all subjects were white (n=98)(94.2%) (Online Table X shows comparison with discovery cohort). Idiopathic PAH (n=53)(51.0%) was the most prevalent etiology, followed by connective tissue disease (n=37)(35.6%), congenital heart disease (n=7)(6.7%), and portal hypertension (n=7)(6.7%). The majority of patients were functional class III-IV (n=79)(76.0%), and PAH was severe with median mPAP 50 mmHg (40-60), PVR 688 dynes·sec/cm5 (376-872), and right atrial pressure 10 mmHg (7-15). All subjects were treatment naïve. External validation of proteomic immune clusters.
Unsupervised machine learning also identified four proteomic immune clusters in the validation cohort (see Online Figure XIII), and their molecular profiles appeared to be similar to those found in the discovery stage (Figure 5A). Cluster 2 patients (n=33) again had low levels of most cytokines, while subjects in cluster 1 (n=26), cluster 3 (n=36), and cluster 4 (n=9) had upregulation of similar proteins that characterized corresponding clusters in the discovery cohort. The percentage of patients assigned to analogous discovery and validation clusters was also comparable– cluster 1 (20.6 vs 25.0%), cluster 2 (38.7 vs 31.7%), cluster 3 (27.4 vs 34.6%), cluster 4 (13.2 vs 8.7%). In principal component analysis, validation clusters separated in a manner akin to what was observed in the discovery cohort (Figure 5B), as clusters 2, 3, and 4 partitioned along the first principal component and cluster 1 was distinguished by the second principal component.
Dow
nloaded from http://ahajournals.org by on January 22, 2019

DOI: 10.1161/CIRCRESAHA.118.313911 12
External validation of immune cluster clinical features.
Median age and the sex distribution did not differ significantly across validation cohort clusters (Online Table XI). Consistent with findings in the discovery cohort, validation clusters each included a similar mixed distribution of Group 1 PAH etiologies. For available clinical markers of PAH risk, cluster 1 again appeared to be a high-risk subgroup. At blood sampling, cluster 1 patients had the worst functional class profile, shortest incremental shuttle walk distance, and most elevated right atrial pressure. The validation cohort was followed for a median of 5.0 years (1.9-5.0) from plasma collection, and 52 total deaths occurred (14.4 events/100-patient-years). Validation cluster survival differences paralleled those observed in the discovery cohort, as the Kaplan-Meier estimated five-year survival rate was best in cluster 3 (63.9%, CI 50.0-81.7%), worst in cluster 1 (30.8%, CI 17.3-54.8%), and intermediate in cluster 2 (54.5%, CI 39.9-74.5) and cluster 4 (44.4%, 21.4-82.3%)(across-cluster p=0.0289) (Figure 5C). Pooled cohort survival analyses.
In combined discovery and validation cohorts (n=385), the estimated five-year survival rate was 39.5% (CI 29.5-52.8%) for the high-risk cluster 1 compared to 79.4% (66.8-88.2%) for the low-risk cluster 3, 62.3% (53.6-72.4%) in cluster 2, and 60.9% (47.5-78.1%) in cluster 4 (across-cluster p<0.0001)(Online Figure XIV). Even after adjustment for age, sex, PAH etiology, treatment naïve status, functional class and right atrial pressure, cluster 1 was associated with increased five-year risk of death (HR 2.19, CI 1.51-3.18, p<0.0001) and cluster 3 portended reduced risk (HR 0.39, CI 0.25-0.63, p=0.0001) (Online Table XIIA-C). DISCUSSION
In this first unsupervised molecular phenotyping study of PAH, we performed an agnostic machine learning approach to discover and validate four immune phenotypes based on multivariable blood cytokine profiling. We used inflammation as a mechanistically-relevant platform for testing the hypothesis that unsupervised molecular phenotyping can uncover sources of heterogeneity in PAH. We found that PAH cohorts can be re-organized into four clusters with distinct circulating cytokine profiles. Not all clusters appear to demonstrate a vigorous inflammatory profile, but they are differentiated by their relative inflammatory signatures. While these immune clusters do not stratify by underlying PAH etiology, there are significant cluster-specific differences in clinical risk parameters and long-term prognosis. Finally, we analyzed proteomic interaction networks and ascertained a unique central cytokine signature for each immune phenotype. Our work provides evidence that immunity is a workable platform for precision phenotyping in PAH, an approach that warrants particular attention as therapies targeting inflammation emerge.
Blood cytokine profiling offers a possible adjunct framework for patient classification in PAH, as the immune clusters identified were independent of PAH etiologies. Within each Group 1 subtype, we observed immune profile heterogeneity and all four clusters were represented. Multiple non-competing hypotheses could be proposed to explain this interesting finding. Predisposing conditions defining these clinical subtypes may produce heterogeneous inflammation due to patient-level variation in genetic factors,28 metabolism,29 sex hormones,30 or endogenous anti-inflammatory responses.31 Alternatively, all PAH predisposing conditions might elicit similar programmatic inflammation and vascular remodeling. If true, the heterogeneity we observed either (a) captured patient variability in the stage or rate of PAH pathogenesis, or (b) reflected confounding modulators like medications or comorbidities. However, our findings do not support the notion that the immune clusters reflect different stages of PAH, as median duration of illness was similar across discovery cohort clusters, and the validation cohort only included
Dow
nloaded from http://ahajournals.org by on January 22, 2019

DOI: 10.1161/CIRCRESAHA.118.313911 13
newly diagnosed treatment naïve patients. Moreover, clusters were not associated with any demographic features, comorbid conditions, or background therapies. Finally, it is plausible that PAH is a syndrome rather than disease, where different pathogenic mechanisms predominate across patients and inflammation is only relevant in certain cases.
The majority of the patients studied had significant evidence of inflammation in circulation (immune clusters 1, 3, and 4), though we also identified a PAH subset with low cytokine and chemokine levels similar to healthy controls (cluster 2). This relatively sizable cluster (36.9%, n=142/385 of combined cohorts) would have been easily overlooked if we had not analyzed the cytokine data as a multivariable profile. Single-protein analysis would have suggested widespread inflammation, where median levels of 42 of 48 analytes were upregulated versus controls (Online Figure XV). This observation highlights the potential to achieve precision with an approach that couples broad molecular profiling and unsupervised cohort ‘splitting’, which contrasts a more reductionist strategy to molecular analysis and generalized ‘lumping’ of patients with a disease.32 The cluster 2 molecular profile provides evidence that PAH is not always associated with inflammation. However, it remains unknown whether this lack of immune signal persists over time. Inflammation may have existed transiently before blood sampling when PAH developed, or it could have arisen post-sampling during disease progression.
While our molecular-based PAH classification approach was not primarily intended to prognosticate, it ultimately stratified patient subgroups with differing clinical risk and outcomes. The relationship between immune profiles and prognosis was consistent across two dissimilar PAH cohorts and persisted after adjustment for other established predictors, providing evidence that clinically-significant immune phenotypes may exist. Previous research has suggested a link between blood levels of various proinflammatory cytokines and survival.11, 12 Perivascular immune cell burden was also shown to correlate with vessel thickness and hemodynamics in a lung histopathology study of idiopathic PAH.33 Indirectly, that work implied a possible relationship between inflammation and disease progression. However, higher cytokine levels did not necessarily equate to worse prognosis in the context of our PAH immune clusters– cluster 3 (moderate immune signal) had the most favorable outcomes, while cluster 2 (lowest signal) and cluster 4 (highest signal) had similar intermediate prognosis, and cluster 1 (high signal) had the worst outcomes. These relationships suggest that inflammation is not well characterized by single markers, and may help explain why individual cytokines have had inconsistent prognostic value across studies.11, 12 Based on our findings, we also speculate that inflammation might play a differential role in PAH pathobiology across clusters– it may be deleterious and drive vascular remodeling in cluster 1 (high-risk clinical phenotype) but contribute less to pathogenesis in clusters 3 and 4 (low and intermediate-risk). Inflammation in these lower-risk clusters could in part reflect reparative immune processes that have protective effects, or it may merely be a consequence of vascular injury and not play a significant role in disease progression.
Inflammation has a multi-faceted and incompletely understood role in PAH vascular injury and remodeling that involves various signaling pathways, pleiotropic cytokines from multiple cellular sources that have canonical and non-canonical effects, complex local and distant cell-cell interactions, and impaired regulatory immune responses, which appear to perpetuate endothelial cell (EC) and smooth muscle cell (SMC) proliferation and cell phenotype shifts.10, 31 As an initial step toward disentangling cluster-specific pathobiology, we detected unique central cytokine signatures in each immune cluster using partial correlation network analysis. This approach has inferred biological relationships in several ‘omics’ domains.34-36 These central network signatures may offer mechanistic clues and candidate drug targets by cluster,32 as each included several mediators that have been implicated in PAH pathogenesis. For example, TRAIL was the most central network protein in high-risk cluster 1. TRAIL upregulation induces migration and proliferation of SMCs in idiopathic PAH, and anti-TRAIL antibodies prevent and reverse vascular remodeling in various rodent models of PAH.37, 38 MIF, CCL5, and IL-18 also had central network roles in cluster 1. These mediators recruit mononuclear cells to the endothelium and perpetuate a proinflammatory milieu that appears to contribute to PAH vasculopathy.39-41 MIF antagonism partially reverses experimental
Dow
nloaded from http://ahajournals.org by on January 22, 2019

DOI: 10.1161/CIRCRESAHA.118.313911 14
PAH and reduces inflammatory infiltrate.39 Intriguing paradoxes have been reported in PAH studies for TNF-, IL-1, and VEGF, which deserve mention given the low-risk clinical profile of cluster 3. TNF- appears to suppress endogenous prostacyclin, increase vascular reactivity, and promote SMC apoptosis resistance in PAH, however TNF- antagonism has not consistently ameliorated disease across preclinical studies.42-44 While IL-1 and are highly expressed in PAH patients and IL-1 receptor blockade prevents development of disease in the monocrotaline rat model, antagonism has no effect in the chronic hypoxia model.45 IL-1 also interestingly enhances prostacyclin expression in SMCs, which may represent a compensatory response to inflammatory injury.44 Human and experimental data suggests that VEGF is upregulated and may be linked to EC growth in PAH. However, VEGF blockade in the Sugen-hypoxia model surprisingly triggers severe angio-obliterative PAH.46 Within the cluster 4 network, central proteins with established links to PAH pathogenesis are IL-6, PDGF-, and CCL2. Mice overexpressing IL-6 spontaneously develop PAH with obliterative arteriolar remodeling.8 IL-6 perpetuates inflammation, induces EC apoptosis resistance, promotes SMC proliferation via FGF- (also central in cluster 4 network), and contributes to the BMPR2 pathway dysregulation that underlies PAH.10 PDGF- and CCL2 are also overproduced and exert mitogenic effects that propagate the proliferative vascular phenotype of PAH, and PDGF receptor antagonism reverses disease in animal models.47, 48
On a more general level, immune clusters also appeared to have differential network signal for various molecular functions and pathways (see Figure 6). TH1 pathway mediators were upregulated and had high network centrality measures in cluster 1. TH1 skew likewise existed in cluster 3, though there was also network signal for the TH17 pathway, mediators of adaptive immunity, and anti-inflammatory/regulatory proteins (including IL-10). This latter finding is interesting given the favorable cluster 3 outcomes and prior report that IL-10 injection inhibits experimental pulmonary hypertension.49 In the cluster 4 network, proteins that propagate the Th2 pathway, angiogenesis, and cellular proliferation were central and upregulated.
If further validated beyond a single time point during disease progression, our findings could have implications for clinical trial design as therapies that target inflammation are under development. Various cytokine and growth factor antagonists have successfully reversed experimental pulmonary hypertension and are under active clinical investigation.10 Immune phenotyping may provide the crucial first step toward identifying specific patients who are more likely to respond to these emerging agents. Given that different degrees and forms of inflammation occur across patients, immune phenotyping could offer a guiding framework as therapies are translated to the clinical setting. It is possible that therapeutically targeting immunity might be futile when patients lack inflammation (cluster 2) or have endogenous anti-inflammatory signaling and a favorable clinical risk profile (cluster 3). Clinical trials may ultimately benefit from cohort enrichment or stratification with therapeutically-relevant immune phenotypes. To achieve such clinical application, further research is needed to evaluate whether certain therapies alter proteomic profiles and determine if immune phenotypes have differential clinical responses. In the short-term, post-hoc analysis of existing clinical trials could offer insights.
There are several limitations to our study. Non-biological variation can be an issue for multiplex cytokine measurements. Several measures were taken to minimize technical bias, as described in the methods section. We encountered batch effects nonetheless that required adjustment, but biological variation was retained post-adjustment and batches were evenly distributed across clusters (Online Table IX). Our proteomic panel did not include all known cytokines and chemokines, though was more complete than sets measured in prior studies of PAH inflammation.11, 12 We recognize blood profiling may not reflect the immune milieu in lung vasculature or right ventricle, but target organ sampling lacks feasibility. Substudies from the PVDOMICS initiative may be able to clarify whether gradients of metabolites and cytokines exist across the pulmonary and systemic vasculature.50 Another study limitation was the lack of proteomic comparison between clusters and non-PAH cardiopulmonary diseases that display inflammatory
Dow
nloaded from http://ahajournals.org by on January 22, 2019

DOI: 10.1161/CIRCRESAHA.118.313911 15
signal. Most importantly, our analysis was limited to blood sampling at one time point, thus it is unknown whether immune phenotypes have temporal stability or can change dynamically with therapeutic interventions. Cluster proteomic profiles do not provide specific information about causal signaling pathways or immune cell biology, as cytokines are inherently pleotropic and could have multiple simultaneous source and effector cells.
Our findings provide proof-of-concept for the application of unsupervised molecular phenotyping in PAH. As high-throughput technologies advance and collaborations focused on deep PAH phenotyping emerge,5, 50 opportunities to leverage ‘omics’ data are ever-increasing. The capacity to exploit this data and deconstruct PAH heterogeneity will depend on unbiased study design and innovative implementation of informatics tools. Our general study approach is congruent with emerging precision phenotyping methods described for other cardiovascular diseases,32 as we avoided reductionist research strategies that assume a common pathophenotype across patients, focus on a specific molecular pathway/interaction, or anchor molecular analysis to certain clinical subgroups. We also implemented informatics methods with intent to sidestep bias. We rigorously applied a resampling-based machine learning approach for clustering, where objective criteria alone determined algorithm input parameters and the number of discovered clusters. Rather than merely find differentially expressed cytokines across phenotypes, we used partial correlation networks to analyze and identify central cytokines within the context of an interrelated system.
Additional research is warranted to elucidate if discovered immune clusters represent endotypes with mechanistically-distinct and therapeutically-targetable forms of inflammation. In future study, we will reassess immune profiles longitudinally to evaluate if there is temporal stability or evolution with interventions and clinical disease progression. Forthcoming analyses should incorporate diseased controls without PAH, and capture the relationship between immune clusters and heart failure-related hospitalizations. To deepen our molecular phenotyping approach we intend to: expand the cytokine and chemokine panel, broadly assess the circulating immune cell landscape to identify activated subsets that characterize clusters and warrant in vitro study, examine transcriptomic profiles (of peripheral blood monocytes and pulmonary artery ECs sampled during catheterization) to ascertain differentially expressed transcripts and enriched biological pathways, and analyze histopathology in explanted lungs from transplant recipients across clusters. This multimodal phenotyping strategy could elucidate cluster-specific pathobiology and comprehensively establish PAH immune endotypes. We ultimately envision the development a of point-of-care test that feasibly stratifies immune endotypes and guides the selection of precision immune-targeting therapies. AUTHOR CONTRIBUTIONS All authors contributed to study design, data collection, and interpretation. AJS and RTZ wrote and prepared the manuscript with critical input and revisions provided by HKH, VJB, LKB, AL, MRN, MR, and PK. RTZ directs pulmonary hypertension biobank and clinical database from which discovery cohort disease samples and clinical data were obtained. FH contributed healthy control samples for the study. AL, PMH, and RAC provided validation cohort disease samples and clinical data. WHR provided the equipment, facility, and support necessary for proteomic measurements. AH had an important role in clinical data extraction. AJS conducted data analyses with guidance provided by PK, HKH, VJB, and RTZ. SOURCES OF FUNDING This manuscript reports independent research that was supported by the Vera Moulton Wall Center for Pulmonary Vascular Disease at Stanford University, funds from NIH grants 5K12HL12001-05 (AJS) and N01-HV-00242 (MR, RTZ, and WHR), and the Blue Lips Foundation (RTZ and AJS). AJS is supported by the NIH/NHLBI Career Development Program in Omics of Lung Diseases, a program directed by MR and MRN. The Sheffield Pulmonary Hypertension Biobank (source of validation cohort samples) has been
Dow
nloaded from http://ahajournals.org by on January 22, 2019

DOI: 10.1161/CIRCRESAHA.118.313911 16
supported by the National Institute for Health Research Sheffield Cardiovascular Biomedical Research Unit, the Sheffield Clinical Research Facility, and a British Heart Foundation project grant (PG/11/116/29288). PMH is a Donald Heath Clinical Research Training Fellow, and AL is a British Heart Foundation Senior Basic Science Research Fellow (FS/13/48/30453). The views expressed are those of the authors, and not necessarily those of the funding sources. Funding sources were not involved in study design, data collection, analysis, interpretation of results, or manuscript writing. Authors had full access to the data and ultimate responsibility for the decision to submit for publication. DISCLOSURES All authors declare no competing financial interests relevant to the submitted work. REFERENCES 1. Simonneau G, Gatzoulis MA, Adatia I, Celermajer D, Denton C, Ghofrani A, Gomez Sanchez MA,
Krishna Kumar R, Landzberg M, Machado RF, Olschewski H, Robbins IM and Souza R. Updated clinical classification of pulmonary hypertension. J Am Coll Cardiol. 2013;62:D34-41.
2. Barnes JW and Dweik RA. Pulmonary Hypertension and Precision Medicine through the "Omics"
Looking Glass. Am J Respir Crit Care Med. 2017;195:1558-1560. 3. Dweik RA, Rounds S, Erzurum SC et al. and Phenotypes ATSCoPH. An official American Thoracic
Society Statement: pulmonary hypertension phenotypes. Am J Respir Crit Care Med. 2014;189:345-55.
4. Robbins IM, Moore TM, Blaisdell CJ and Abman SH. National Heart, Lung, and Blood Institute
Workshop: improving outcomes for pulmonary vascular disease. Circulation. 2012;125:2165-70. 5. Newman JH, Rich S, Abman SH et al. Enhancing Insights into Pulmonary Vascular Disease through a
Precision Medicine Approach. A Joint NHLBI- Cardiovascular Medical Research and Education Fund Workshop Report. Am J Respir Crit Care Med. 2017;195:1661-1670.
6. Tamosiuniene R, Tian W, Dhillon G, Wang L, Sung YK, Gera L, Patterson AJ, Agrawal R, Rabinovitch
M, Ambler K, Long CS, Voelkel NF and Nicolls MR. Regulatory T cells limit vascular endothelial injury and prevent pulmonary hypertension. Circ Res. 2011;109:867-79.
7. Ormiston ML, Chang C, Long LL, Soon E, Jones D, Machado R, Treacy C, Toshner MR, Campbell K,
Riding A, Southwood M, Pepke-Zaba J, Exley A, Trembath RC, Colucci F, Wills M, Trowsdale J and Morrell NW. Impaired natural killer cell phenotype and function in idiopathic and heritable pulmonary arterial hypertension. Circulation. 2012;126:1099-109.
8. Steiner MK, Syrkina OL, Kolliputi N, Mark EJ, Hales CA and Waxman AB. Interleukin-6
overexpression induces pulmonary hypertension. Circ Res. 2009;104:236-44, 28p following 244. 9. Savai R, Pullamsetti SS, Kolbe J et al. Immune and inflammatory cell involvement in the pathology of
idiopathic pulmonary arterial hypertension. Am J Respir Crit Care Med. 2012;186:897-908. 10. Rabinovitch M, Guignabert C, Humbert M and Nicolls MR. Inflammation and immunity in the
pathogenesis of pulmonary arterial hypertension. Circ Res. 2014;115:165-75.
Dow
nloaded from http://ahajournals.org by on January 22, 2019

DOI: 10.1161/CIRCRESAHA.118.313911 17
11. Soon E, Holmes AM, Treacy CM, Doughty NJ, Southgate L, Machado RD, Trembath RC, Jennings S, Barker L, Nicklin P, Walker C, Budd DC, Pepke-Zaba J and Morrell NW. Elevated levels of inflammatory cytokines predict survival in idiopathic and familial pulmonary arterial hypertension. Circulation. 2010;122:920-7.
12. Cracowski JL, Chabot F, Labarere J, Faure P, Degano B, Schwebel C, Chaouat A, Reynaud-Gaubert
M, Cracowski C, Sitbon O, Yaici A, Simonneau G and Humbert M. Proinflammatory cytokine levels are linked to death in pulmonary arterial hypertension. Eur Respir J. 2014;43:915-7.
13. Benza RL, Gomberg-Maitland M, Demarco T, Frost AE, Torbicki A, Langleben D, Pulido T, Correa-
Jaque P, Passineau MJ, Wiener HW, Tamari M, Hirota T, Kubo M and Tiwari HK. Endothelin-1 Pathway Polymorphisms and Outcomes in Pulmonary Arterial Hypertension. Am J Respir Crit Care Med. 2015;192:1345-54.
14. Hemnes AR, Trammell AW, Archer SL, Rich S, Yu C, Nian H, Penner N, Funke M, Wheeler L,
Robbins IM, Austin ED, Newman JH and West J. Peripheral blood signature of vasodilator-responsive pulmonary arterial hypertension. Circulation. 2015;131:401-9;409.
15. Hemnes AR, Zhao M, West J et al. Critical Genomic Networks and Vasoreactive Variants in Idiopathic Pulmonary Arterial Hypertension. Am J Respir Crit Care Med. 2016;194:464-75.
16. Rhodes CJ, Ghataorhe P, Wharton J et al. Plasma Metabolomics Implicates Modified Transfer RNAs
and Altered Bioenergetics in the Outcomes of Pulmonary Arterial Hypertension. Circulation. 2017;135:460-475.
17. Rhodes CJ, Wharton J, Ghataorhe P et al. Plasma proteome analysis in patients with pulmonary arterial
hypertension: an observational cohort study. Lancet Respir Med. 2017;5:717-726. 18. Schulze TG and McMahon FJ. Defining the phenotype in human genetic studies: forward genetics and
reverse phenotyping. Hum Hered. 2004;58:131-8. 19. Breen EJ, Tan W and Khan A. The Statistical Value of Raw Fluorescence Signal in Luminex xMAP
Based Multiplex Immunoassays. Sci Rep. 2016;6:26996. 20. Johnson WE, Li C and Rabinovic A. Adjusting batch effects in microarray expression data using
empirical Bayes methods. Biostatistics. 2007;8:118-27. 21. Monti S, Tamayo P, Mesirov J and Golub T. Consensus Clustering: A Resampling-Based Method for
Class Discovery and Visualization of Gene Expression Microarray Data. Machine Learning. 2003;52:91-118.
22. Wilkerson MD and Hayes DN. ConsensusClusterPlus: a class discovery tool with confidence
assessments and item tracking. Bioinformatics. 2010;26:1572-3. 23. Senbabaoglu Y, Michailidis G and Li JZ. Critical limitations of consensus clustering in class discovery.
Sci Rep. 2014;4:6207. 24. Fruchterman TMJ and Reingold EM. Graph drawing by force-directed placement. Software: Practice
and Experience. 1991;21:1129-1164. 25. Epskamp S, Cramer AOJ, Waldorp LJ, Schmittmann VD and Borsboom D. qgraph: Network
Visualizations of Relationships in Psychometric Data. 2012. 2012;48:18.
Dow
nloaded from http://ahajournals.org by on January 22, 2019

DOI: 10.1161/CIRCRESAHA.118.313911 18
26. Friedman J, Hastie T and Tibshirani R. Sparse inverse covariance estimation with the graphical lasso.
Biostatistics. 2008;9:432-41. 27. Opsahl T, Agneessens F and Skvoretz J. Node centrality in weighted networks: Generalizing degree
and shortest paths. Social Networks. 2010;32:245-251.
28. Soon E, Crosby A, Southwood M, Yang P, Tajsic T, Toshner M, Appleby S, Shanahan CM, Bloch KD, Pepke-Zaba J, Upton P and Morrell NW. Bone morphogenetic protein receptor type II deficiency and increased inflammatory cytokine production. A gateway to pulmonary arterial hypertension. Am J Respir Crit Care Med. 2015;192:859-72.
29. Huertas A, Tu L, Gambaryan N, Girerd B, Perros F, Montani D, Fabre D, Fadel E, Eddahibi S, Cohen-
Kaminsky S, Guignabert C and Humbert M. Leptin and regulatory T-lymphocytes in idiopathic pulmonary arterial hypertension. Eur Respir J. 2012;40:895-904.
30. Umar S, Rabinovitch M and Eghbali M. Estrogen paradox in pulmonary hypertension: current
controversies and future perspectives. Am J Respir Crit Care Med. 2012;186:125-31. 31. Nicolls MR and Voelkel NF. The Roles of Immunity in the Prevention and Evolution of Pulmonary
Arterial Hypertension. Am J Respir Crit Care Med. 2017;195:1292-1299. 32. Leopold JA and Loscalzo J. Emerging Role of Precision Medicine in Cardiovascular Disease. Circ Res.
2018;122:1302-1315. 33. Stacher E, Graham BB, Hunt JM, Gandjeva A, Groshong SD, McLaughlin VV, Jessup M, Grizzle WE,
Aldred MA, Cool CD and Tuder RM. Modern age pathology of pulmonary arterial hypertension. Am J Respir Crit Care Med. 2012;186:261-72.
34. Krumsiek J, Suhre K, Illig T, Adamski J and Theis FJ. Gaussian graphical modeling reconstructs
pathway reactions from high-throughput metabolomics data. BMC Syst Biol. 2011;5:21. 35. de la Fuente A, Bing N, Hoeschele I and Mendes P. Discovery of meaningful associations in genomic
data using partial correlation coefficients. Bioinformatics. 2004;20:3565-74. 36. Telesca D, Muller P, Kornblau SM, Suchard MA and Ji Y. Modeling Protein Expression and Protein
Signaling Pathways. J Am Stat Assoc. 2011;107:1372-1384. 37. Lawrie A, Waterman E, Southwood M, Evans D, Suntharalingam J, Francis S, Crossman D, Croucher
P, Morrell N and Newman C. Evidence of a role for osteoprotegerin in the pathogenesis of pulmonary arterial hypertension. Am J Pathol. 2008;172:256-64.
38. Hameed AG, Arnold ND, Chamberlain J et al. Inhibition of tumor necrosis factor–related apoptosis-
inducing ligand (TRAIL) reverses experimental pulmonary hypertension. The Journal of Experimental Medicine. 2012;209:1919-1935.
39. Le Hiress M, Tu L, Ricard N, Phan C, Thuillet R, Fadel E, Dorfmuller P, Montani D, de Man F,
Humbert M, Huertas A and Guignabert C. Proinflammatory Signature of the Dysfunctional Endothelium in Pulmonary Hypertension. Role of the Macrophage Migration Inhibitory Factor/CD74 Complex. Am J Respir Crit Care Med. 2015;192:983-97.
Dow
nloaded from http://ahajournals.org by on January 22, 2019

DOI: 10.1161/CIRCRESAHA.118.313911 19
40. Dorfmuller P, Zarka V, Durand-Gasselin I, Monti G, Balabanian K, Garcia G, Capron F, Coulomb-Lhermine A, Marfaing-Koka A, Simonneau G, Emilie D and Humbert M. Chemokine RANTES in severe pulmonary arterial hypertension. Am J Respir Crit Care Med. 2002;165:534-9.
41. Ross DJ, Strieter RM, Fishbein MC, Ardehali A and Belperio JA. Type I immune response cytokine-
chemokine cascade is associated with pulmonary arterial hypertension. J Heart Lung Transplant. 2012;31:865-73.
42. Wang Q, Zuo XR, Wang YY, Xie WP, Wang H and Zhang M. Monocrotaline-induced pulmonary arterial hypertension is attenuated by TNF-alpha antagonists via the suppression of TNF-alpha expression and NF-kappaB pathway in rats. Vascul Pharmacol. 2013;58:71-7.
43. Sutendra G, Dromparis P, Bonnet S, Haromy A, McMurtry MS, Bleackley RC and Michelakis ED.
Pyruvate dehydrogenase inhibition by the inflammatory cytokine TNFalpha contributes to the pathogenesis of pulmonary arterial hypertension. J Mol Med (Berl). 2011;89:771-83.
44. Itoh A, Nishihira J, Makita H, Miyamoto K, Yamaguchi E and Nishimura M. Effects of IL-1beta, TNF-
alpha, and macrophage migration inhibitory factor on prostacyclin synthesis in rat pulmonary artery smooth muscle cells. Respirology. 2003;8:467-72.
45. Voelkel NF, Tuder RM, Bridges J and Arend WP. Interleukin-1 receptor antagonist treatment reduces
pulmonary hypertension generated in rats by monocrotaline. Am J Respir Cell Mol Biol. 1994;11:664-75.
46. Voelkel NF and Gomez-Arroyo J. The role of vascular endothelial growth factor in pulmonary arterial
hypertension. The angiogenesis paradox. Am J Respir Cell Mol Biol. 2014;51:474-84. 47. Schermuly RT, Dony E, Ghofrani HA, Pullamsetti S, Savai R, Roth M, Sydykov A, Lai YJ, Weissmann
N, Seeger W and Grimminger F. Reversal of experimental pulmonary hypertension by PDGF inhibition. J Clin Invest. 2005;115:2811-21.
48. Sanchez O, Marcos E, Perros F, Fadel E, Tu L, Humbert M, Dartevelle P, Simonneau G, Adnot S and
Eddahibi S. Role of endothelium-derived CC chemokine ligand 2 in idiopathic pulmonary arterial hypertension. Am J Respir Crit Care Med. 2007;176:1041-7.
49. Ito T, Okada T, Miyashita H, Nomoto T et al. Interleukin-10 expression mediated by an adeno-
associated virus vector prevents monocrotaline-induced pulmonary arterial hypertension in rats. Circ Res. 2007;101:734-41.
50. Hemnes AR, Beck GJ, Newman JH et al. PVDOMICS. Circulation Research. 2017;121:1136-1139
Dow
nloaded from http://ahajournals.org by on January 22, 2019

DOI: 10.1161/CIRCRESAHA.118.313911 20
FIGURE LEGENDS Figure 1. Immune phenotyping overview. [A] Discovery cohort. A plasma panel of immune-relevant proteins was measured using multiplex immunoassay in a Stanford University cohort of PAH patients (n=281) and healthy controls (n=88). Unsupervised machine learning (consensus clustering) was applied to classify PAH clusters with distinct proteomic immune profiles. For each PAH cluster, a partial correlation network was then constructed and analyzed (Gaussian graphical modeling) to examine proteomic relationships and identify central proteins. Clinical features and outcomes were thereafter compared across clusters. [B] Validation cohort. The proteomic panel was also measured in a University of Sheffield PAH cohort (n=104). The same unsupervised consensus clustering method was reapplied, to determine if the approach identified immune clusters with proteomic and clinical features similar to those revealed during the discovery stage. Figure 2. Discovery cohort: [A] Heatmap of standardized patient-level proteomic measurements by PAH cluster. Heatmap columns represent individual patients (grouped according to the clusters discovered by unsupervised consensus clustering), and each row is an assayed protein. Measured protein median fluorescence intensity (MFI) is displayed as a color-coded z-score (standard deviations above or below cohort mean). Healthy control proteomic measurements are shown in the far-right panel. Heatmap rows are ordered based on hierarchal clustering of proteins (dendogram not shown), solely for the purpose of visualization. [B] Principal component analysis of cluster proteomic profiles relative to controls. In a scatter plot of the first two principal components (PC1 vs PC2), the multivariable proteomic profile of each PAH patient is reduced to a single dot and colored according to consensus cluster assignment. Healthy controls are also shown as a reference. Figure 3. Discovery cohort: protein-protein network analysis by cluster. [A] Sparse core networks. For each cluster, an undirected weighted partial correlation network is constructed as a force-directed graph. Network nodes represent individual proteins, and node size reflects the detected plasma level in respective clusters. Edges connect node pairs, and edge weights are proportional to protein-protein partial correlations (red=positive, blue=negative). These sparse core networks reflect graphical LASSO regularization (less significant edges removed from saturated networks displayed in Online Figure III). [B] Central proteins in cluster networks. A Venn diagram highlights proteins with centrality in each cluster network. In quantitative network analysis, these proteins were upregulated (mean cluster plasma level greater than overall PAH cohort) and had network centrality (at least two of three centrality indices [strength, closeness, and betweenness] exceeded mean of all network nodes) (data shown in Online Figure IV). Figure 4. Discovery cohort: clinical comparison of clusters. [A] PAH etiology. Stacked bars display the distribution of underlying PAH etiologies within each machine learned proteomic patient cluster. [B] Non-invasive clinical risk surrogates. For multiple well-established risk markers, bar plots indicate the percentage of patients in each cluster with high-risk status (top panel) and low-risk status (bottom panel) at the time of proteomic sampling. [C] Transplant-free survival analysis. Kaplan-Meier estimates of transplant-free survival from the time of plasma sampling are displayed for each cluster and compared by log-rank test. Survival curve cross-tags indicate censoring, and the number of patients remaining at risk over time is shown. Figure 5. Validation cohort: [A]. Heatmap of patient-level proteomic measurements by cluster. Individual patients (columns) are grouped by immune cluster, and measured proteins (rows) are in the same order as that displayed for the discovery cohort (see Figure 2A). The heatmap shows standardized protein MFI measurements as color-coded z-scores. [B]. Principal component analysis of proteomic profiles by cluster. In a scatter plot of the first two principal components (PC1 vs PC2), the multivariable proteomic data for each patient is represented by a single point and colored by immune cluster assignment. [C]. Survival analysis. Kaplan-Meier estimates of cluster survival are shown from the time of proteomic
Dow
nloaded from http://ahajournals.org by on January 22, 2019

DOI: 10.1161/CIRCRESAHA.118.313911 21
sampling and compared by log-rank test. No censoring occurred, as five-year survival data was available for all patients. Figure 6. Proteomic network signal for molecular functions and pathways by PAH cluster. For protein sets that relate to certain biological functions and pathways, plasma expression levels and network centrality measures are compared graphically across PAH clusters (centrality measures derive from the network analysis executed in Online Figures III-IV). Each figure panel denotes a set of functionally-related proteins, where rows correspond to the PAH clusters. For each protein, displayed circle size is proportional to the mean plasma expression level in a given cluster (z-score relative to overall cohort mean). Circle color represents quantified network centrality for the protein node (mean z-score of strength, closeness, and betweenness relative to other network nodes in the cluster).
Dow
nloaded from http://ahajournals.org by on January 22, 2019

DOI: 10.1161/CIRCRESAHA.118.313911 22
NOVELTY AND SIGNIFICANCE What Is Known? Aberrant immunity is a recognized feature of PAH, as it has been shown that (a) elevated levels of
circulating cytokines portend worse prognosis; and (b) the burden of immune cells around remodeled lung vasculature correlates with vessel thickness and hemodynamic disease severity in idiopathic PAH.
Therapies targeting immunity ameliorate experimental pulmonary hypertension and are the focus of clinical trials; however, it is not known whether subsets of PAH patients have differing degrees and forms of inflammation.
PAH consensus statements have called for informatics-based molecular phenotyping studies to identify
endophenotypes that reveal sources of biological and clinical heterogeneity, yield classification schemes relevant to underlying pathobiology, and translate to precision medicine.
What New Information Does This Article Contribute? Unbiased machine learning approach to classify PAH patients solely on the basis of blood cytokine
profiles, reveals four immune phenotypes with distinct inflammatory signatures.
While these immune phenotypes do not associate with underlying PAH etiologies, demographics, comorbidities or background medications, their clinical disease severity and outcomes differ significantly.
Analysis of protein-protein interaction networks implicated in PAH identifies a unique set of central cytokines for each phenotype.
In unsupervised molecular phenotyping study and systems-based analysis of the circulating immune milieu across all Group 1 PAH subtypes, we assessed inflammation as a mechanistically-relevant platform for patient classification. Applying an unbiased machine learning approach to deconstruct blood proteomic profiles without guidance from clinical features, we uncovered four immune phenotypes with distinct circulating inflammatory profiles that are independent from clinical subtypes. While this proteomic-based classification strategy was not specifically intended to prognosticate, it stratified subgroups with differing clinical risk metrics and long-term survival. To elucidate phenotype-specific pathobiology and candidate drug targets, we analyzed the proteomic profiles as interrelated networks and identified a unique set of central cytokines for each phenotype. These findings provides evidence that inflammation is a viable platform for PAH precision endotyping. Further research is warranted to examine the temporal evolution of proteomic profiles during disease progression. Ultimately, these phenotypes might inform mechanistic studies of disease pathogenesis, identify patients more likely to respond to certain therapies, and guide the selection of enriched clinical trial cohorts.
Dow
nloaded from http://ahajournals.org by on January 22, 2019
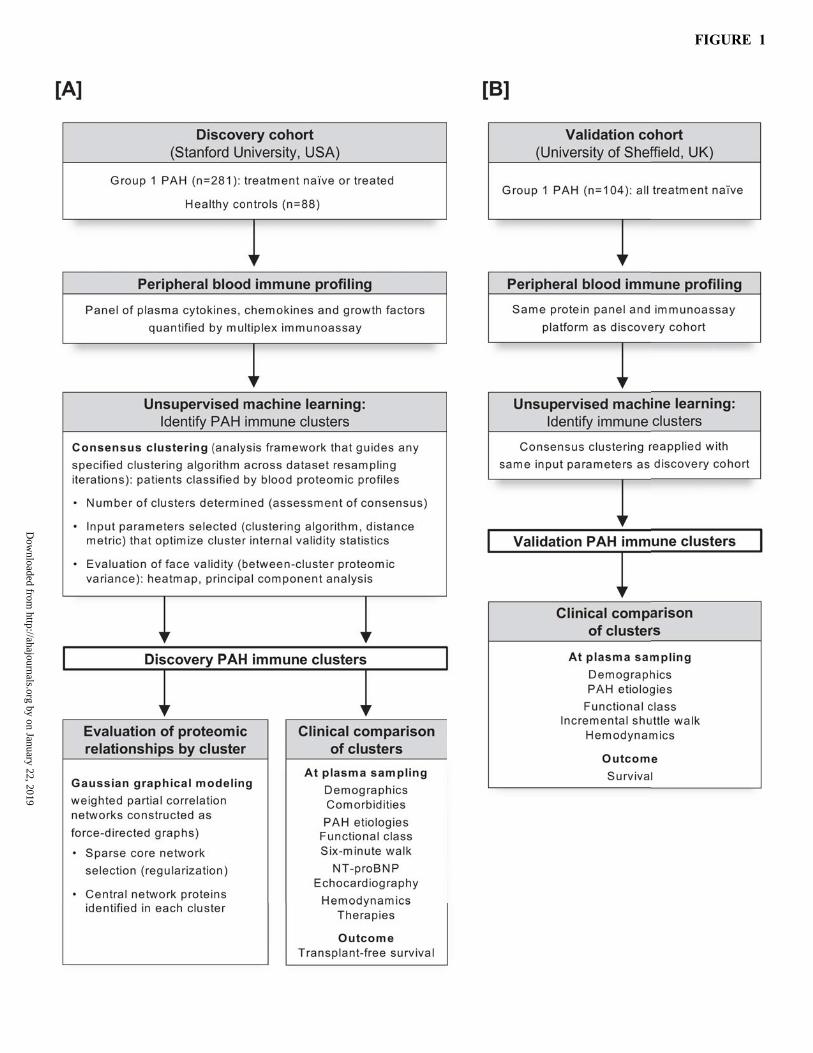
FIGURE 1
Dow
nloaded from http://ahajournals.org by on January 22, 2019

FIGURE 2
Dow
nloaded from http://ahajournals.org by on January 22, 2019

FIGURE 3
Dow
nloaded from http://ahajournals.org by on January 22, 2019

FIGURE 4
Dow
nloaded from http://ahajournals.org by on January 22, 2019

FIGURE 5
Dow
nloaded from http://ahajournals.org by on January 22, 2019

FIGURE 6
Dow
nloaded from http://ahajournals.org by on January 22, 2019