discovery of a big void in khufu's pyramid by … · discovery of a big void in khufu’s...
TRANSCRIPT

HAL Id: hal-01630260https://hal.inria.fr/hal-01630260v2
Submitted on 22 Nov 2017
HAL is a multi-disciplinary open accessarchive for the deposit and dissemination of sci-entific research documents, whether they are pub-lished or not. The documents may come fromteaching and research institutions in France orabroad, or from public or private research centers.
L’archive ouverte pluridisciplinaire HAL, estdestinée au dépôt et à la diffusion de documentsscientifiques de niveau recherche, publiés ou non,émanant des établissements d’enseignement et derecherche français ou étrangers, des laboratoirespublics ou privés.
Discovery of a big void in Khufu’s Pyramid byobservation of cosmic-ray muons
Kunihiro Morishima, Mitsuaki Kuno, Akira Nishio, Nobuko Kitagawa, YutaManabe, Masaki Moto, Fumihiko Takasaki, Hirofumi Fujii, Kotaro Satoh,
Hideyo Kodama, et al.
To cite this version:Kunihiro Morishima, Mitsuaki Kuno, Akira Nishio, Nobuko Kitagawa, Yuta Manabe, et al.. Discoveryof a big void in Khufu’s Pyramid by observation of cosmic-ray muons. Nature, Nature PublishingGroup, 2017, pp.1-13. <10.1038/nature24647>. <hal-01630260v2>

This manuscript is the pre-submission manuscript provided by the authors.For the final, post-review version, please see:http://www.nature.com/nature/journal/vaap/ncurrent/full/nature24647.html
Discovery of a big void in Khufu’s Pyramid byobservation of cosmic-ray muonsKunihiro Morishima1, Mitsuaki Kuno1, Akira Nishio1, Nobuko Kitagawa1, Yuta Manabe1, Masaki Moto1 — Fumihiko Takasaki2,Hirofumi Fujii2, Kotaro Satoh2, Hideyo Kodama2, Kohei Hayashi2, Shigeru Odaka2 — Sébastien Procureur3, David Attié3, SimonBouteille3, Denis Calvet3, Christopher Filosa3, Patrick Magnier3, Irakli Mandjavidze3, Marc Riallot3 — Benoit Marini5, Pierre Gable7,Yoshikatsu Date8, Makiko Sugiura9, Yasser Elshayeb4, Tamer Elnady10, Mustapha Ezzy4, Emmanuel Guerriero7, Vincent Steiger5, Nico-las Serikoff5, Jean-Baptiste Mouret11, Bernard Charlès6, Hany Helal4,5, Mehdi Tayoubi5,6
Corresponding Authors: Kunihiro Morishima ([email protected]) and Mehdi Tayoubi ([email protected])
1F-lab, Nagoya University. Furo-cho, Chikusa-ku, Nagoya, 464-8602, Japan — 2KEK,1-1 oho, Tsukuba, Ibaraki 305-0801 Japan — 3 IRFU, CEA,Université Paris Saclay, 91191 Gif-sur-Yvette, France — 4Cairo University, 9 Al Gameya, Oula, Giza Governorate, Egypt — 5HIP Institute, 50rue de Rome 75008 Paris, France — 6Dassault Systèmes, 10 Rue Marcel Dassault, 78140 Vélizy-Villacoublay, France — 7 Emissive, 71 ruede Provence 75009 Paris, France — 8 NEP, 4-14 Kamiyama-cho, Shibuya-ku,Tokyo 150-0047, Japan — 9Suave images, N-2 Maison de Shino,3-30-8 Kamineguro, Meguro-Ku, Tokyo, 153-0051, Japan — 10Ain Shams University, Kasr el-Zaafaran, Abbasiya, Cairo, Egypt — 11Inria Nancy- Grand Est, 615 rue du Jardin Botanique, Villers-lès-Nancy, 54600, France
The Great Pyramid or Khufu’s Pyramid was built on the GizaPlateau (Egypt) during the IVth dynasty by the pharaoh Khufu(Cheops), who reigned from 2509 to 2483 BC1. Despite being oneof the oldest and largest monuments on Earth, there is no con-sensus about how it was built2,3. To better understand its inter-nal structure, we imaged the pyramid using muons, which areby-products of cosmic rays that are only partially absorbed bystone4,5,6. The resulting cosmic-ray muon radiography allows usto visualize the known and potentially unknown voids in the pyra-mid in a non-invasive way. Here we report the discovery of alarge void (with a cross section similar to the Grand Gallery anda length of 30 m minimum) above the Grand Gallery, which con-stitutes the first major inner structure found in the Great Pyramidsince the 19th century1. This void, named ScanPyramids Big Void,was first observed with nuclear emulsion films7,8,9 installed in theQueen’s chamber (Nagoya University), then confirmed with scin-tillator hodoscopes10,11 set up in the same chamber (KEK) and re-confirmed with gas detectors12 outside of the pyramid (CEA). Thislarge void has therefore been detected with a high confidence bythree different muon detection technologies and three independentanalyses. These results constitute a breakthrough for the under-standing of Khufu’s Pyramid and its internal structure. While thereis currently no information about the role of this void, these findingsshow how modern particle physics can shed new light on the world’sarchaeological heritage.
The pyramid of Khufu is 139 m high and 230 m wide1,13. Thereare three known chambers (Fig. 1), at different heights of the pyramid,which all lie in the north-south vertical plane1: the subterranean cham-ber, the Queen’s chamber, and the King’s chamber. These chambers areconnected by several corridors, the most notable one being the GrandGallery (8.6 m high × 46.7 m long × 2.1 to 1.0 m wide). The Queen’schamber and the King’s chamber possess two “air shafts” each, whichwere mapped by a series of robots14,15 between 1990 and 2010. Theoriginal entrance is believed to be the “descending corridor”, whichstarts from the North face, but today tourists enter the pyramid via atunnel attributed to Caliph al-Ma’mun’s (around AD 820)1.
Most of the current understanding of Khufu’s Pyramid comes fromarchitectural surveys and comparative studies with other pyramids1,2,13.In Histories, Herodotus described the construction of Khufu’s Pyramid,but this account was written about 2,000 years later (in 440 BC). Theonly known documents written during Khufu’s reign were discovered in201316, but these papyri describe only the logistics of the construction,such as how the stones were transported, and not the construction itself.
In 1986, a team surveyed the pyramid using microgravimetry17, that is,the measurement of slight variations in gravity due to large variationsin the amount of matter18. Based on these data, the team drilled 3 holesin the corridor to the Queen’s chamber in the hope of finding a “hiddenchamber”; the team only observed sand17. A more recent analysis ofthe same data dismissed the theory of a “hidden chamber” where theholes had been drilled17.In 1988, a Ground-Penetrating Radar survey19
suggested that an unknown corridor could be parallel to the Queen’schamber corridor. To our knowledge, this theory has been neither con-firmed nor refuted.
Here we follow in the footsteps of Alvarez et al.5 who used sparkchambers as muon detectors in Khafre’s pyramid (Kephren) and con-cluded that there is no unknown structure with a volume similar to theKing’s chamber above the Belzoni chamber5. Muon particles originatefrom the interactions of cosmic rays with the atoms of the upper at-mosphere, and they continuously reach the Earth with a speed near tothat of light and a flux of around 10,000 per m2per minute4. Similar toX-rays which can penetrate the body and allow bone imaging, these ele-mentary particles can keep a quasi-linear trajectory while going throughhundreds of meters of stone before decaying or being absorbed. Byrecording the position and the direction of each muon that traverses theirdetection surface, muon detectors can distinguish cavities from stones:while muons cross cavities with practically no interactions, they canbe absorbed or deflected by stones. Put differently, muons traversinga region with lower-than-expected density will result in a higher-than-expected flux in the direction of the region. In the recent years, muondetectors have been successfully deployed in particle accelerators, involcanology6, to visualize the inner structure of the Fukushima’s nu-clear reactor11,20, and for homeland security21. In heritage buildings,detectors have been recently set up in archaeological sites near Rome22
and Naples23 (Italy), where they were able to detect some known struc-tures from underground, and in the Teotihuacan Pyramid of the Sun(Mexico)24. However, since the muons generated by cosmic rays comefrom the sky, the detectors can only detect density variations in somesolid angle above them (the exact acceptance depends on the detectiontechnology). In addition, the muon imaging technique measures the av-erage density of the structure in a given direction: while a void resultsin a lower density, its impact on the muon radiography is determined bythe ratio between the void and the length of material that is traversed.For this reason, small cavities like air shafts cannot be detected by thistechnique within a reasonable exposure time. Lastly, in large and densebuildings like Khufu’s Pyramid where only about 1% of muons reachthe detectors, the data need to be accumulated over several months.
1

Queen's chamber
King's chamber
Grand Gallery
1.0 m5.5 m 4.0 m
Nagoya
NE1 NE2
KEK
H1 H2
Grand gallery axis
1.0 m
CEA G2 (Brahic)
CEA G1 (Alhazen)
23 m
17 mGrand Gallery axis
Pyramid central axis
7 m
Sou
th
North
Nagoya and KEK detectors
CEA detectors
South North
Queen's chamber
King's chamber
Subterranean chamber
Grand Gallery
Nagoya and KEK detectors
CEA detectors
g
a b c d
f eh i
Figure 1 | Muon detectors installed for Khufu’s Pyramid. a, Side view of the pyramid, with sensor positions and indicative field of view. b, Top view. c, Closeview of the position of the gas detectors (CEA). d, Orthographic view of Queen’s chamber with nuclear emulsion films (Nagoya University, red positions NE1 andNE2) and scintillator hodoscopes (KEK, green positions H1 and H2). e, Orthographic view of the main known internal structures f, Nuclear emulsion plates inposition NE1 (Nagoya University). g, Nuclear emulsion plates in position NE2 (Nagoya University). h, Scintillator hodoscopes setup for position H1 (KEK). i, Gasdetectors (muon telescopes, CEA).
We first installed nuclear emulsion films (Fig. 1f-g), developed byNagoya University, because they are compact and do not require elec-tric power, which makes them well suited for installation in the pyramid(Extended Data Table 1). A nuclear emulsion film is a special photo-graphic film that can detect muon trajectories in three-dimensional im-ages with sub-micrometric accuracy7,8,9. In these experiments, we usedunit films of 30 × 25 cm2and covered a maximum 8 m2 at a time. Eachfilm has a 70 microns thick emulsion coating on both sides of a 175 mi-crons thick transparent plastic base (Methods). The muon measurementaccuracy is around 1 micron in position and around 1.8 mrad (~0.1de-gree) for vertical track by using the information obtained with one film(Extended Data Table 1).
The films were installed near the south-west corner of the Queen’schamber (position NE2, Fig. 1d) and in the adjacent narrow hand-excavated corridor called “Niche” (position NE1, Fig 1d) on the eastside of the Queen’s chamber. The distance between the centres of thesetwo detectors is about 10 m on average, which allows us to perform astereo analysis of the detected structures. The exposure started in De-cember 2015. During the exposure, we modified the film configurationseveral times when we changed the films (every two months on aver-age); only a subset of the full dataset was used for this analysis to mit-igate the effect of the parallax on the resolution (Extended Data Table1 and Methods). After each exposure, the nuclear emulsion films wereprocessed by photographic development in the dark room of the GrandEgyptian Museum Conservation Center. After the development, theywere transported to Nagoya University and read-out by an automatednuclear emulsion scanning system25,26,27.
We compared the resulting muon radiographs (Fig. 2a,b) with theexpected results computed using Monte Carlo simulation that includeknown structures inside the observation region (Fig. 2c,d). These com-parisons clearly show that the large known structures (the Grand Galleryand the King’s chamber) are observed by the measurements and the re-sults match the expectation (Fig. 2a-d). However, from the two posi-tions, we also detected an unexpected and significant excess of muonsin a region almost parallel to the image of the Grand Gallery. Statis-tical significance of the excess is higher than 10 sigma at the highestdifference direction (Fig. 2c). The muon excess is similar to the onegenerated by the Grand Gallery, which means that the volume of thetwo voids is of the same order (Fig. 2e,f and Extended Data Fig. 2). We
then performed a triangulation using the data from the two positionsand four points along the new void (Methods). The results show thatthe new void has an estimated length of more than 30 m and is locatedbetween 40 m and 50 m away from the detector positions, 21 m abovethe ground level.
The second detection technology, designed by KEK, is composed offour layers of scintillator hodoscopes arranged in two units of doubleorthogonal layers10,11 (Fig. 1h). Each layer is composed of 120 plasticscintillator bars measuring 1×1 cm2 in cross section to cover an area of120 × 120 cm2. Two units are vertically separated to allow the mea-surement of the two-dimensional incoming direction of the muons. Weplaced the detectors near the South-East corner (position H1, Fig 1d) ofthe Queen’s chamber in August 2016. The separation between two unitswas set to 1.5 m. Unfortunately, the newly detected void was overlap-ping with the Grand Gallery, which made it difficult to identify. After astable operation for five months, we moved the detector to another posi-tion near the south-west corner of the chamber in January 2017 (positionH2, 2.9 m from position H1, Fig. 1d) and reduced the unit separation to1.0 m to enlarge the angular coverage of the measurement. The detectoroperation has been very stable for more than one year and is still beingcontinued (Methods).
When we normalize the results by the simulation of the solid pyra-mid without the known structures, we see them clearly (Fig. 3a,b). Bynormalizing with a simulation that includes the known structures, weobserve a muon excess that is consistent with Nagoya’s result (Meth-ods, Fig. 3c-f).
The third kind of instrument, designed by the CEA, is made of micro-pattern gaseous detectors (Micromegas) based on an argon mixture12
(Methods). They are robust enough to be installed outside and can runfor unlimited time, but they have a larger footprint than the emulsionplates (Fig. 1i, Extended Data Table 1). Each “telescope” is built fromfour identical detectors with an active area of 50 × 50 cm2, and a signalon at least three of them is required to trigger the acquisition. An onlineanalysis is performed to extract the muon track parameters which arethen transferred at CEA, in France, with a 3G connection (Methods).
In order to confirm Nagoya’s discovery and to provide an additionalpoint of view, we placed two such telescopes in front of the North faceof the pyramid (Fig. 1a-c), looking in the direction of the Grand Gallery(Methods), and close enough to each other so that their data can be com-
2

a
b
c
d
e
f
g h
NE
2
(n
ucle
ar
em
uls
ion
s,
po
sitio
n 2
)
A
B
B
A
New void
New void
B
A
A
B
3-d
imensio
nal analy
sis
i
South North [m] East West [m] South North [m]
Ea
st
W
est
[m]
Heig
ht
fro
m th
e f
loor
of Q
ueen
’s c
ha
mb
er
[m]
NE
1
(n
ucle
ar
em
uls
ion
s,
po
sitio
n 1
)
B
A
C,D
B
A
CD
BA
C
D
B
New void
New void
B
Heig
ht
fro
m th
e f
loor
of Q
ueen
’s c
ha
mb
er
[m]
Figure 2 | Results of the analysis of the nuclear emulsion films. (A: King’s chamber, B: Grand Gallery, C: Queen’s chamber (position NE2), D: Niche (positionNE1), New Void: the unexpected muon excess region; these are common in all plots) a,b, Two-dimensional histograms of the detected muon flux (/cm2/day/sr) atpositions NE1 and NE2. The resolution of this histogram is 0.025 × 0.025 (Methods). In this figure, right is west, top is north. The four edges of the pyramid areclearly seen as a cross pattern. c,d, Results of simulation with the known inner structures using the Geant4 software28 from positions NE1 and NE2. e,f, Histogramof typical angular region as shown by the white square (0.4 ≤ tan θy < 0.7). The red line shows the data; the black solid line shows the simulation with the innerstructures; the gray dashed line shows the simulation without the inner structures. Error bars indicate 1 sigma of statistical error (standard deviation). More slicesare available on the Extended Data Fig. 2. g-i, Results of the triangulation analysis (three sectional views). Each figure shows the inner structures (gray line) and theresults. For each position, we divided the region of interest (0 ≤ tan θy < 1) into four slices and extracted the center of the muon excess for each of them, resultingin 4 pairs of direction (Methods). Each of the four points represents the result of the triangulation for a pair of slices and the associated statistical error (Methods).The detector positions are shown as a black box for position NE1 and a white box for position NE2; g shows a vertical section (right is north); h shows a verticalsection (right is west); i shows a horizontal section (up is west, right is north).
bined (Fig. 1c). A previous 3-month measurement campaign with onetelescope on the north side already revealed an anomaly in this region,above 3 sigma, but the telescope was shifted from the main verticalaxis, and so not optimally positioned. After two months of acquisitionfrom the new position, the data analysis reveals two statistically sig-nificant excesses of muons in the core of the pyramid (Fig. 4): onecorresponding to the Grand Gallery and one corresponding to the un-expected void (Methods). The 3D model confirms that the telescopes’observation converges to the same region as the one obtained from theQueen’s chamber with emulsion plates (Fig. 4h). The overall combinedexcesses yield 8.4 (resp. 5.8) sigma for the Grand Gallery (resp. the newvoid) (Methods). To our knowledge, this is the first time an instrumenthas detected a deep void from outside a pyramid.
Three techniques of cosmic-ray muon imaging were applied to in-vestigate the inner structure of the pyramid. The known voids (King’schamber and Grand Gallery) are observed as well as an unexpected bigvoid, which fully demonstrates the ability of cosmic-ray muon radiogra-phy to image structures. The centre of the void is located between 40 mand 50 m from the floor of the Queen’s chamber. Its length is more than30 m and its cross section is comparable to that of the Grand Gallery.There are still many architectural hypotheses to consider; in particular,the big void could be made of one or several adjacent structures, and itcould be inclined or horizontal. The detailed structure of the void shouldbe further studied. Overall, this discovery shows how the methods de-veloped in particle physics can shed light on one of the most importantheritage buildings, and it calls for more interdisciplinary collaborationsto help understanding the pyramid and its construction process.
1. Lehner, M., The complete pyramids: Solving the Ancient Mysteries(Thames and Hudson, 2008).
2. Hawass, Z., Pyramid Construction: New Evidence Discovered inGiza. Stationen: Beiträge zur Kulturgeschichte, 1998.
3. Smith, C. B., Hawass, Z. & Lehner, M., How the great pyramid wasbuilt (Harper Collins, 2006).
4. Particle Data Group, Review of particle physics. Chinese PhysicsC40 (10), 100001 (2016).
5. Alvarez, L. W. et al., Search for hidden chambers in the pyramids.Science 167 (3919), 832-839 (1970).
6. Tanaka, H. K. M., Nakano, T., Takahashi, S., Yoshida, J. & Niwa, K.,Development of an emulsion imaging system for cosmic-ray muonradiography to explore the internal structure of a volcano, , Mt.Asama. Nucl. Instrum. Methods Phys. Res. A575, 489-497 (2007).
7. Morishima, K., Nishio, A., Moto, M., Nakano, T. & Nakamura, M.,Development of nuclear emulsion for muography. Annals of Geo-physics 60 (1), 0112 (2017).
8. Nakamura, T. A. et al., The OPERA film: New nuclear emulsion forlarge-scale, high-precision experiments." . Nuclear Instruments andMethods in Physics Research Section A: Accelerators, Spectrome-ters, Detectors and Associated Equipment 556 (1), 80-86 (2006).
9. Nishio, A., Morishima, K., Kuwabara, K. & Nakamura, M., Develop-ment of nuclear emulsion detector for muon radiography. PhysicsProcedia 80, 74-77 (2015).
10. Fujii, H. et al., Detection of on-surface objects with an undergroundradiography detector system using cosmic-ray muons. PTEP (5),053C01 (2017).
11. Fujii, H. et al., Performance of a remotely located muon radiographysystem to identify the inner structure of a nuclear plant. PTEP 7,073C01 (2013).
3

Figure 3 | Results of the analysis of the scintillation hodoscopes. a-b, Two-dimensional histograms of the detected angle of muons after normalization by thesimulation without inner structures at positions H1 and H2 (Methods). The images present a top view and the north is the upward. ∆x and ∆y correspond tothe channel number difference between the upper and lower layers along x and y coordinates (Methods). The bin number hence ranges from -120 to 120 andprovides the tangent of the incident angle when divided by 150 (resp. 100) for position H1 (resp. H2). The detector introduces a dark cross-shaped artefact visibleon the two-dimensional histograms, which adds a small systematic error of 3% to the analysis (Methods). c-d, Two-dimensional histograms of detected angle ofmuons after a normalization by the simulation with inner structures (which are therefore removed). The images present the top view and the north is the upward.The unexpected structure is visible. e-f, Histograms of typical angular region (-25 < ∆x < 75, 25 < ∆y < 47) corresponding to a slice of panels c and d (yellowrectangle). More slices are available in Extended Data Fig. 4. Black points with error bars show the relative excess after dividing the data by the model with theknown structures (the King’s chamber and the Grand Gallery): a perfect agreement between the data and the model would correspond to a horizontal line; a peakcorresponds to an unexpected excess of muons in the data.
12. Bouteille, S. et al., A Micromegas-based telescope for muon tomog-raphy: The WatTo experiment (and references therein). NuclearInstruments and Methods in Physics Research Section A: Accel-erators, Spectrometers, Detectors and Associated Equipment 834,223-228 (2016).
13. Dash, G., The Great Pyramid’s Footprint: Results from our 2015Survey. Aeragram 16 (2), 8-14 (2015).
14. Hawass, Z. et al., First report: Video survey of the southern shaft ofthe queen’s chamber in the great pyramid. Annales du Service desAntiquités de l’Egypte 84, 203-216 (2010).
15. Richardson, R. et al., The "Djedi" Robot Exploration of the South-ern Shaft of the Queen’s Chamber in the Great Pyramid of Giza,Egypt. Journal of Fields Robotics 30 (3), 323-348 (2013).
16. Tallet, P., Les papyrus de la Mer Rouge 1: Le "journal de Merer"(Institut Français d’Archéologie Orientale, 2017).
17. Bui, H. D., Imaging the Cheops pyramid (Springer Science & Busi-ness Media, 2011).
18. Butler, D. K., Microgravimetric and gravity gradient techniques fordetection of subsurface cavities. Geophysics 49 (7), 1084-1096(1984).
19. Yoshimura, S., Nakagawa, T., Tonouchi, S. & Seki, K., Non destruc-tive Pyramids investigation, Part 1 and 2. Studies in Egyptian Cul-ture 6 (1987).
20. Morishima, K. et al., First demonstration of cosmic ray muon radiog-raphy of reactor cores with nuclear emulsion based on an automatedhigh-speed scanning technology. Proc. of the 26th Workshop onRadiation Detectors and Their Uses (2012).
21. Borozdin, K. N. et al., Surveillance: Radiographic imaging withcosmic-ray muons. Nature 422 (6929), 277 (2003).
22. Menichelli, M. et al., A scintillating fibres tracker detector for archae-ological applications. Nuclear Instruments and Methods in PhysicsResearch Section A: Accelerators, Spectrometers, Detectors andAssociated Equipment 572 (1), 262–265 (2007).
23. Saracino, G. et al., Imaging of underground cavities with cosmic-raymuons from observations at Mt. Echia (Naples). Scientific Reports7 (1), 1181 (2017).
24. Menchaca-Rocha, A., Searching for cavities in the TeotihuacanPyramid of the Sun using cosmic muons experiments and instru-mentation. International Cosmic Ray Conference 4, 325 (2011).
25. Yoshimoto, M., Nakano, T., Komatani, R. & Kawahara, H., Nuclearemulsion readout system HTS aiming at scanning an area of onethousand square meters. e-Print: arXiv, 1704.06814 (2017).
26. Morishima, K., Hamada, K., Komatani, R., Nakano, T. & Kodama, K.,Development of an automated nuclear emulsion analyzing system.Radiation Measurements 50, 237-240 (2013).
27. Hamada, K. et al., Comprehensive track reconstruction tool"NETSCAN 2.0" for the analysis of the OPERA Emulsion CloudChamber. Journal of Instrumentation 7 (7), P07001 (2012).
28. Agostinelli, S. et al., GEANT4—a simulation toolkit. Nuclear instru-ments and methods in physics research section A: Accelerators,Spectrometers, Detectors and Associated Equipment 506 (3), 250-303 (2003).
Author contributions K. M., M. K., A. N., N. K., Y. M. and M. M. per-formed the experiments and analysed the results for the nuclear emulsionfilms; F. T., H. F., K. S., H. K., K. H. and S. O. performed the experimentsand analysed the results for the scintillator hodoscopes. S. P., D. A., S.B., D. C., C. F., P. M., I. M. and M. R. performed the experiment and anal-ysed the results for telescopes gas detectors. B. M., P. G., E. G., N. S., Y.D. and M. S. created the 3D models used for muography simulations andRTMS. B. M. designed and implemented the Real Time Muography Sim-ulator (RTMS) and contributed to the analyses; Y. E., T. E., M. E. and V. S.coordinated the different experiments operations on the field (muography,3D scans); the paper was mainly written by K. M., S. P., F. T., M. T., B. M.and J.-B. M., with contributions of all the other authors; H. H., M. T., B. C.,B. M. and Y. E. designed and coordinated the project (ScanPyramids);
Author information Correspondence and requests for materials shouldbe addressed both to K. M. ([email protected]) andM. T. ([email protected]).
Acknowledgements This experiment is part of the ScanPyramidsproject, which is supported by NHK, La Fondation Dassault Systèmes,Suez, IceWatch, le Groupe Dassault, Batscop, Itekube, Parrot, ILP,Kurtzdev, Gen-G, Schneider Electric. The measurement with nuclear
4
0 0.1 0.2 0.3 0.4 0.5 0.6 0.7 0.8 0.9 10
200
400
600
800
1000
1200
1400
1600
)θtan(
28.3±141.3
0 0.1 0.2 0.3 0.4 0.5 0.6 0.7 0.8 0.9 10
200
400
600
800
1000
)θtan(
24.7±141.8
0 0.1 0.2 0.3 0.4 0.5 0.6 0.7 0.8 0.9 10
200
400
600
800
1000
1200
)θtan(
26.5±163.0
0 0.1 0.2 0.3 0.4 0.5 0.6 0.7 0.8 0.9 10
200
400
600
800
1000
1200
1400
1600
1800
2000
2200
)θtan(
44.6±167.1
G2 (Brahic)G1 (Alhazen)
G1 (Alhazen)
G2 (Brahic)
Triangulation positions
from Nagoya University
a b
c
d e
f
g h
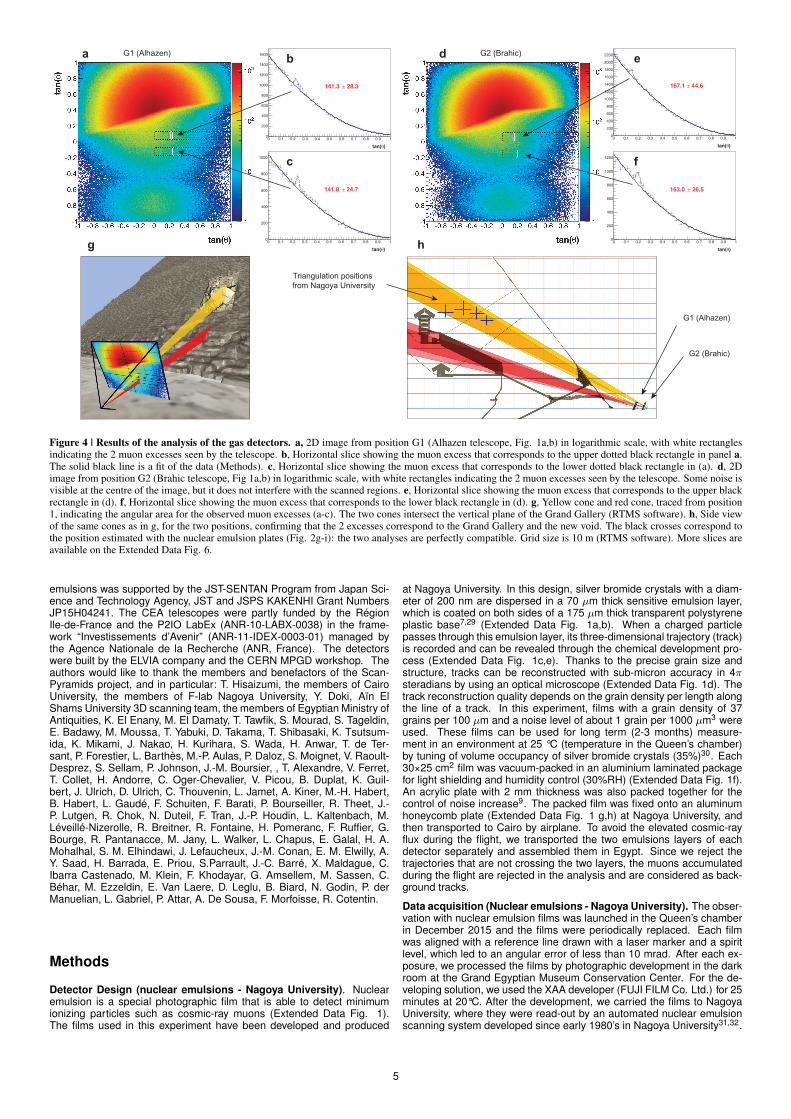
Figure 4 | Results of the analysis of the gas detectors. a, 2D image from position G1 (Alhazen telescope, Fig. 1a,b) in logarithmic scale, with white rectanglesindicating the 2 muon excesses seen by the telescope. b, Horizontal slice showing the muon excess that corresponds to the upper dotted black rectangle in panel a.The solid black line is a fit of the data (Methods). c, Horizontal slice showing the muon excess that corresponds to the lower dotted black rectangle in (a). d, 2Dimage from position G2 (Brahic telescope, Fig 1a,b) in logarithmic scale, with white rectangles indicating the 2 muon excesses seen by the telescope. Some noise isvisible at the centre of the image, but it does not interfere with the scanned regions. e, Horizontal slice showing the muon excess that corresponds to the upper blackrectangle in (d). f, Horizontal slice showing the muon excess that corresponds to the lower black rectangle in (d). g, Yellow cone and red cone, traced from position1, indicating the angular area for the observed muon excesses (a-c). The two cones intersect the vertical plane of the Grand Gallery (RTMS software). h, Side viewof the same cones as in g, for the two positions, confirming that the 2 excesses correspond to the Grand Gallery and the new void. The black crosses correspond tothe position estimated with the nuclear emulsion plates (Fig. 2g-i): the two analyses are perfectly compatible. Grid size is 10 m (RTMS software). More slices areavailable on the Extended Data Fig. 6.
emulsions was supported by the JST-SENTAN Program from Japan Sci-ence and Technology Agency, JST and JSPS KAKENHI Grant NumbersJP15H04241. The CEA telescopes were partly funded by the RégionIle-de-France and the P2IO LabEx (ANR-10-LABX-0038) in the frame-work “Investissements d’Avenir” (ANR-11-IDEX-0003-01) managed bythe Agence Nationale de la Recherche (ANR, France). The detectorswere built by the ELVIA company and the CERN MPGD workshop. Theauthors would like to thank the members and benefactors of the Scan-Pyramids project, and in particular: T. Hisaizumi, the members of CairoUniversity, the members of F-lab Nagoya University, Y. Doki, Aïn ElShams University 3D scanning team, the members of Egyptian Ministry ofAntiquities, K. El Enany, M. El Damaty, T. Tawfik, S. Mourad, S. Tageldin,E. Badawy, M. Moussa, T. Yabuki, D. Takama, T. Shibasaki, K. Tsutsum-ida, K. Mikami, J. Nakao, H. Kurihara, S. Wada, H. Anwar, T. de Ter-sant, P. Forestier, L. Barthès, M.-P. Aulas, P. Daloz, S. Moignet, V. Raoult-Desprez, S. Sellam, P. Johnson, J.-M. Boursier, , T. Alexandre, V. Ferret,T. Collet, H. Andorre, C. Oger-Chevalier, V. Picou, B. Duplat, K. Guil-bert, J. Ulrich, D. Ulrich, C. Thouvenin, L. Jamet, A. Kiner, M.-H. Habert,B. Habert, L. Gaudé, F. Schuiten, F. Barati, P. Bourseiller, R. Theet, J.-P. Lutgen, R. Chok, N. Duteil, F. Tran, J.-P. Houdin, L. Kaltenbach, M.Léveillé-Nizerolle, R. Breitner, R. Fontaine, H. Pomeranc, F. Ruffier, G.Bourge, R. Pantanacce, M. Jany, L. Walker, L. Chapus, E. Galal, H. A.Mohalhal, S. M. Elhindawi, J. Lefaucheux, J.-M. Conan, E. M. Elwilly, A.Y. Saad, H. Barrada, E. Priou, S.Parrault, J.-C. Barré, X. Maldague, C.Ibarra Castenado, M. Klein, F. Khodayar, G. Amsellem, M. Sassen, C.Béhar, M. Ezzeldin, E. Van Laere, D. Leglu, B. Biard, N. Godin, P. derManuelian, L. Gabriel, P. Attar, A. De Sousa, F. Morfoisse, R. Cotentin.
Methods
Detector Design (nuclear emulsions - Nagoya University). Nuclearemulsion is a special photographic film that is able to detect minimumionizing particles such as cosmic-ray muons (Extended Data Fig. 1).The films used in this experiment have been developed and produced
at Nagoya University. In this design, silver bromide crystals with a diam-eter of 200 nm are dispersed in a 70 µm thick sensitive emulsion layer,which is coated on both sides of a 175 µm thick transparent polystyreneplastic base7,29 (Extended Data Fig. 1a,b). When a charged particlepasses through this emulsion layer, its three-dimensional trajectory (track)is recorded and can be revealed through the chemical development pro-cess (Extended Data Fig. 1c,e). Thanks to the precise grain size andstructure, tracks can be reconstructed with sub-micron accuracy in 4πsteradians by using an optical microscope (Extended Data Fig. 1d). Thetrack reconstruction quality depends on the grain density per length alongthe line of a track. In this experiment, films with a grain density of 37grains per 100 µm and a noise level of about 1 grain per 1000 µm3 wereused. These films can be used for long term (2-3 months) measure-ment in an environment at 25 °C (temperature in the Queen’s chamber)by tuning of volume occupancy of silver bromide crystals (35%)30. Each30×25 cm2 film was vacuum-packed in an aluminium laminated packagefor light shielding and humidity control (30%RH) (Extended Data Fig. 1f).An acrylic plate with 2 mm thickness was also packed together for thecontrol of noise increase9. The packed film was fixed onto an aluminumhoneycomb plate (Extended Data Fig. 1 g,h) at Nagoya University, andthen transported to Cairo by airplane. To avoid the elevated cosmic-rayflux during the flight, we transported the two emulsions layers of eachdetector separately and assembled them in Egypt. Since we reject thetrajectories that are not crossing the two layers, the muons accumulatedduring the flight are rejected in the analysis and are considered as back-ground tracks.
Data acquisition (Nuclear emulsions - Nagoya University). The obser-vation with nuclear emulsion films was launched in the Queen’s chamberin December 2015 and the films were periodically replaced. Each filmwas aligned with a reference line drawn with a laser marker and a spiritlevel, which led to an angular error of less than 10 mrad. After each ex-posure, we processed the films by photographic development in the darkroom at the Grand Egyptian Museum Conservation Center. For the de-veloping solution, we used the XAA developer (FUJI FILM Co. Ltd.) for 25minutes at 20°C. After the development, we carried the films to NagoyaUniversity, where they were read-out by an automated nuclear emulsionscanning system developed since early 1980’s in Nagoya University31,32.
5

In this experiment, tracks recorded in films were scanned by a HyperTrack Selector25 which can read-out tracks at a speed of 4700 cm2/h withangular accuracy of 1.8 mrad for vertical tracks, and saved in a computerstorage device as digital data (position, angle, pulse height). The angu-lar acceptance is approximately |tanθ| ≤ 1.3 where θ is the zenith anglerelative to the perpendicular of the emulsion surface.
Data analysis and statistics (nuclear emulsions - Nagoya University).The muon tracks are reconstructed by the coincidence between the twostacked films within criteria of signal selection and then counted as de-tected muons26. In this analysis, a subset of the full data set was usedto avoid decreasing the resolution because of imaging parallax: 4.4 mil-lion tracks were accumulated for 98 days at position NE1 and 6.2 milliontracks for 140 days at position NE2, with an effective area of 0.45 m2.Subsequently, detected muons were integrated into two-dimensional an-gular space (tanθx-tanθy) with the bin size of a specified size (e.g., 0.025× 0.025) and the angular acceptance of |tanθ|≤ 1.0, and converted tomuon flux (/cm2/day/sr) in each bin (Fig. 2).
We used the Monte Carlo simulator Geant4 Version 10.228 to computethe expected muon flux at detector position. In these simulations, thephysical process of electromagnetic interactions and decays of muonswere included, Miyake’s formula of integrated intensity of cosmic-raymuons was utilized as a flux model, and only muons were generatedas primary particles in this simulator33. In order to reduce the process-ing time, only muons were propagated and the range of incident muonenergy was limited to be 20 to 1000 GeV in the zenith angular range0 to 70 degree (-2.75 < tanθ < 2.75). For the pyramid simulation, wemodeled the shape and the location of the known structures (the GrandGallery, the King’s chamber, the corridor that connects them, and theQueen’s chamber) using the survey of Dormion34. We defined that anyempty void would be filled with air and that the stones are limestone (2.2g/cm3) except around the King’s chamber, where they are granite (2.75g/cm3). The exposure period in the simulation is compatible with 1000days, which is approximately 10 times longer than that of analyzed data.We estimated the rock thickness distribution in 2D from the detector po-sition: the minimum thickness is 65 m and the maximum thickness is 115m. If we assume the fluctuation of surface structure is 1 m scale (stonesize), the effect of the relative fluctuation is less than 2%.
Normalization was performed to compare real and simulated data inthe region without the analyzing target (the Grand Gallery, the King’schamber, and the anomaly region). The excess region of muon flux wasclearly apparent in the images (Figure 2a-d). Two histograms (Figure 2e,f)show muon flux extracting from the slice in 0.4 ≤ tanθy < 0.7. From thecomparison between data and the simulation, the significances of eachanomaly region were evaluated at 13.7 sigma (statistical) for position NE1and 12.7 sigma for position NE2.
In order to locate the newly discovered structure, we performed a tri-angulation from the two positions. The centre of detector position NE1was located at 5.8 m east from the axis of the Grand Gallery and at 4.5m west for position NE2. The distance between position NE1 and NE2is 1.1 m in north-south (Figure 1d). In order to determine the directiontoward the anomaly region, we performed the fitting of the excess regionto a Gaussian function by dividing the region (0 ≤ tanθy < 1) into four re-gions with a segment of 0.25 in tanθy, because the new structure seemsto align along the tanθy axis direction (Extended Data Fig. 2). The fittedcenter value was used for triangulation and the errors of the estimatedpositions were defined from the errors on the sight lines coming from ahalf of the bin width, i.e. 0.0125 in tanθx and 0.125 in tanθy (Fig. 2g-i).
Detector design (scintillator hodoscopes - KEK). The detector con-sists of two units of double layers, i.e., x and y layers, of plastic scintil-lator arrays (Extended Data Fig. 3a-c). A single scintillator element is10 ×10 mm2 in cross section and 1200 mm long. Each layer has 120elements tightly packed, and hence its active area is 1200 × 1200 mm²(Extended Data Fig. 3d). The element has a central hole along its length,through which a wave-shifter optical fiber is inserted to efficiently trans-fer the scintillation light to a Multi-Pixel Photon Counter Sensor (MPPC,Hamamatsu). The bias voltage of the MPPC was selected according tothe temperature of the Queen’s Chamber, which is constant regardlessof the weather outside. Each layer has its own DAQ box, which digitizesthe information of sensor signals and sends them to a common PC insidethe detector frame. The total power consumption of the detector systemis 300 W. The vertical distance between the two units is 1500 mm at po-sition H1 and 1000 mm at position H2, and gives an angular resolutionaround 7 and 10 mrad respectively. The tangent acceptance ranges from0 (vertical) to 0.8 and 1.2 rad respectively.
The detector introduces a dark cross-shaped artefact visible on thetwo-dimensional histograms (Fig. 3a-d), which adds a small systematicerror of 3 % to the analysis. According to our analyses, the error is likelyto be caused by the very narrow gap between neighboring scintillator el-ements, but this effect has not been fully understood yet. This systematicerror is not relevant in the present analysis, which only examines the ex-istence of the new void.
Data acquisition (scintillator hodoscopes - KEK). Raw data - time andposition of all hit channels - are first stored in a PC and regularly retrievedwith USB memory to be sent to KEK through the Internet. In the off-lineanalysis, a muon event is defined by the coincidence of the 4 layers, withat most 2 neighboring hits in each of them. Events are accumulated intwo-dimensional bins (∆x, ∆y) given by the channel number differencesbetween the upper and lower layers along x and y coordinates. The binnumber hence ranges from -120 to 120 and provides the tangent of theincident angle when divided by 150 (resp. 100) for position H1 (resp. H2).We installed the detector at position H1 in August 2016, and continuedthe data taking for five months until January in 2017. During this period,we accumulated 4.8 M events. We then moved the detector by 2.9 mwest in order to better investigate the newly observed void. The datataking is still continuing for more than eight months and 12.9 M eventswere accumulated at position H2 at the end of September 2017, with anoverall smooth acquisition for more than a year.
Data analysis and statistics (scintillator hodoscopes - KEK). The firststep of the analysis is the normalization of the data by a Monte Carlosimulation that takes into account the cosmic ray muon flux and muoninteractions35,36 (energy loss and multiple scattering) in the Pyramid. Weassume a constant energy loss of 1.7 MeV per g/cm2 (ref. 4), a mean den-sity of 2.2 g/cm3, and a radiation length of 26.5 g/cm2 for the stones.Muons are propagated in steps of 0.1 m. Because the known structuresof the Pyramid are simulated, their effects are removed after the normal-ization of the data and the remaining muon excess shows the existenceof an unknown corridor-like new structure. The successful elimination ofthe known structures suggests the reliability of our simulation. Slices ofthe images along ∆x are presented in Extended Data Fig. 4a,b. The ver-tical scale is the relative yield to the simulation result. The new structureis clearly seen in each slice. The significance of the muon excess wasobtained by a Gaussian fit: at position H1 the excess heights in the slicesranges from 5.2% to 8.9% and more than 10 sigma except for the mostouter slice, in which the height is still more than 5 sigma. At position H2the height ranges from 8.9% to 11% and are again above 10 sigma ex-cept for the most outer slice, in which the excess is above 7 sigma. Fromthese slices, we found that the structure starts almost at the centre of thePyramid and ends at an angle whose tangent is 0.8 to the North. As aresult, the length of the main part of the new structure is approximately30 m. Results from both position H1 and H2 show that the new void isabove the Grand Gallery, which is consistent with Nagoya’s result.
Detector design (gas detectors - CEA). A telescope (Extended DataFig. 5a) is composed of 4 Micromegas (Extended Data Fig. 5b), a Micro-Pattern Gaseous Detector (MPGD) invented at CEA-Saclay37 (ExtendedData Fig. 5c). All the detectors are identical, with an active area of 50 ×50 cm² (ref. 12). They are built from the bulk technology38 with a screen-printing resistive film on top of the readout strips to allow for stable op-eration and higher gain39. Each detector provides X and Y coordinatesthrough a 2D readout inserted onto the printed circuit board (ExtendedData Fig. 5d). The 1037 readout strips (482 micron pitch) of each co-ordinate are multiplexed according to a patented scheme40. An Argon-iC4H10-CF4, non-flammable gas mixture (95-2-3) is flushed in series inall the detectors of a telescope, with a flow below 0.5 L/h, thanks to a tightseal (measured gas leak below 5 mL/h per detector).
Each telescope is operated with a Hummingboard nano-PC runningGNU/Linux, which controls all the electronics41: a dedicated high voltagepower supply (HVPS) card with 5 miniaturized CAEN modules, whichprovide up to 2 kV with 12V inputs, and the Front End Unit (FEU) readoutelectronics based on the DREAM ASIC42. A particularly important featureof DREAM is its self-triggering option to generate the trigger from thedetectors themselves. A dedicated software package was developed tointerface all these electronic components to the Hummingboard whichperforms the data acquisition with the FEU. It also monitors and sets thehigh voltages through the HVPS and a patented amplitude feedback tokeep the gain constant in spite of the extreme environmental conditionsof the Giza plateau (Extended Data Fig. 5 e-g). The overall consumptionof a telescope is only 35 W.
A trigger is formed by the FEU when at least 5 coordinates out of 8observe a signal above a programmable threshold. The sampled signals(50 samples at a frequency of 100/6 MHz, Extended Data Fig. 5h) of allthe electronic channels (64 × 8) are then directly converted to a ROOTfile43, a format commonly used in particle physics. The nano-PC per-forms the online reconstruction of muon trajectories, and the muon trackparameters are sent to France with some environmental data (tempera-ture, pressure, humidity in the gas) through a 3G connection.
Data acquisition (gas detectors - CEA). The data were collected fromMay 4th to July 3rd, 2017 with a stable data taking. Two telescopes wereinstalled in front of the chevrons (North face), at a distance of 17 and 23m, respectively (Fig. 1b,c). The axis of both telescopes deviated slightlyfrom the north-south axis, toward the east, to prevent the Grand Galleryfrom being at the centre of the image, where some correlated noise canshow up. During the acquisition time the two telescopes (called Alhazen
6

and Brahic, at positions G1 and G2, see Fig. 1b,c) recorded 15.0 and14.5 million triggers, respectively, from which 10.6 and 10.4 million oftrack candidates were identified. After the chi² quality cut, 6.9 and 6.0million good tracks were reconstructed, and form the images shown inFigure 4 (a) and (d).Data analysis and statistics (gas detectors - CEA). From the acquiredtracks, we searched for anomalies by extracting slices in tan(phi), i.e. hor-izontal slices. To get more statistics, the thickness of the slices is largerthan the binning shown in the 2D images. We chose a slice thickness of0.10 for the Alhazen telescope, and we increased to 0.11 for the Brahictelescope to keep roughly the same statistics. The Extended Data Fig. 6illustrates all the slices made with Alhazen from 0.21 to -0.19. From onehistogram to another, the slice position is shifted by 0.02, which meansthe data of consecutive histograms largely overlap. The goal is to scanthe pyramid and detect any deviation from statistics, being fluctuations ornot.
As can be seen on Extended Data Fig. 6, the slices show smooth dis-tributions, except around histograms 5-6 and 15. The histograms 6 and15 correspond to Fig. 4b and 4c respectively. These distributions werefitted with different functions, in particular polynomials. Though such func-tions are essentially empirical, a CRY/Geant4 simulation was performedto further validate this choice, leading to a good agreement using a 2nd
order polynomial with a reduced χ² of 1.4. The same function reproducesdata distributions fairly well - with a reduced χ² value of 1.6 and 2.0 re-spectively for histograms 6 and 15 - except in a region where an excessis clearly observed on both slices, with single bin excess of 4.2 and 5.3sigma respectively. Re-fitting with a 2nd order polynomial and a Gaus-sian significantly reduces the χ² to 1.2 and 1.4, with a Gaussian integralof 141.3 ± 28.3 (5.0 sigma, histogram 6) and 141.8 ± 24.7 (5.7 sigma,histogram 15). Similarly, Brahic data show 2 significant excesses, cor-responding to Fig. 4e and 4f. A 2nd order polynomial alone results inreduced χ² value of 1.8 and 2.4 respectively, while adding a Gaussianreduces them to 1.5 and 1.6. The Gaussian integral is 167.1 ± 44.6 (3.7sigma, Fig. 4e) and 163 ± 26.5 (6.1 sigma, Fig. 4f).
The 3D model confirms that the (well compatible) excesses from Fig.4c (Alhazen) and 4f (Brahic) point to the same region of the pyramid andoverlap very well with the Grand Gallery (Fig. 4h). The quasi-full overlapof the cones (due to the purposeful proximity of the telescopes) justifiesadding the 2 excesses, leading to 304.8 ± 36.2 (i.e., 8.4 sigma). Thisfully validates the ability of the telescopes to unambiguously detect largestructures in the core of the pyramid.
The 3D model also confirms that the excesses from Fig. 4b and 4epoint to the same region. Like before, the quasi-full overlap of the conesjustifies adding the 2 excesses, leading to 308.4 ± 52.8 (5.8 sigma). A3D comparison with the triangulation made by Nagoya University furtherconfirms a large overlap of these regions. The other slices show no otheranomaly exceeding 5 sigma.
It is worth mentioning that this analysis relies directly on raw data with-out model subtraction, which means the systematics are much smaller,and can only originate from the fitting function. As an exercise, a 3rd poly-nomial fit was used for the histograms showing the new void, resulting inexcesses of 5.2 and 3.6 sigma for Alhazen and Brahic, and a combinedexcess of 303.5 ± 52.1 (5.8 sigma).3-dimensional model of the pyramid. We designed an accurate 3-dimensional model of the pyramid by combining existing architecturaldrawings34,44 photogrammetry45, and laser scanner measurements45,both inside and outside of the pyramid. After merging these data, themodel contains about 500,000 triangles (Extended Data Fig. 7 b-d). Thismodel was mainly used in the RTMS simulator (see below) and as ref-erence for the simplified models used in the other simulators. The fullmodel has a precision of approximately 30 cm for the internal structuresand approximately 1 m for the external casing.Real Time Muography Simulator. The Real Time Muography Simulator(RTMS, Extended Data Figure 7a) is a fast, interactive simulator that wasmainly used for preliminary analyses, to aid positioning the gas sensors(telescopes), and for confirming the results obtained from the others sim-ulators. It allows the user to place a sensor in the detailed 3D model ofthe pyramid and to simulate the observed muon rate in real time. Muonscattering is not simulated. For each pixel of the sensor, which representsa direction relative to the sensor, the simulator computes the opacity (in-tegral of the density along the path) from the sensor to the outside ofthe pyramid, along this direction. We used a density of 2.2 g/cm3 for thelimestone, and 2.6 g/cm3 for the granite. We consider that muons loseenergy at a constant rate of 1.69 MeV per g/cm2 (ref 4) which allows usto compute the minimal energy Emin to cross the pyramid given the valueof the opacity. Finally, we use Miyake’s formula33 to calculate the distri-bution of muons that have greater energy than Emin coming at a zenithangle θ. This value is computed for each pixel of the image, leading to a2-dimensional histogram similar to those obtained with the detectors.Data availability. The data that support the findings in this study areavailable from the corresponding authors on reasonable request.
29. Morishima, K., Latest Developments in Nuclear Emulsion Technol-ogy. Physics Procedia 80, 19-24 (2015).
30. Nishio, A. et al., Long Term Property of Nuclear Emulsion. Programand Proceedings of The 1st International Conference on AdvancedImaging (ICAI2015), 668-671 (2015).
31. Aoki, S. et al., The Fully Automated Emulsion Analysis System.Nuclear Instruments and Methods in Physics Research Section B:Beam Interactions with Materials and Atoms 51, 466-472 (1990).
32. Morishima, K. & Nakano, T., Development of a new automatic nu-clear emulsion scanning system, S-UTS, with continuous 3D tomo-graphic image read-out. Journal of Instrumentation 5 (4), P04011(2010).
33. Miyake, S., Rapporteur paper on muons and neutrinos. 13th Inter-national cosmic ray conference (1973).
34. Dormion, G., La chambre de Cheops: analyse architecturale (Fa-yard, 2004).
35. Reyna, D., A simple parameterization of the cosmic-ray muon mo-mentum spectra at the surface as a function of zenith angle. arXivpreprint, hep-ph/0604145 (2006).
36. Jokisch, H., Carstensen, K., Dau, W., Meyer, H. & Allkofer, O.,Cosmic-ray muon spectrum up to 1 TeV at 75 zenith angle. Physicalreview D 19 (5), 1368 (1979).
37. Giomataris, I. Y., Rebourgeard, P., Robert, J. P. & Charpak, G., MI-CROMEGAS: a high-granularity position-sensitive gaseous detectorfor high particle-flux environments. Nuclear Instruments and Meth-ods in Physics Research Section A: Accelerators, Spectrometers,Detectors and Associated Equipment 376 (1), 29-35 (1996).
38. Giomataris, I. Y. et al., Micromegas in a bulk. Nuclear Instrumentsand Methods in Physics Research Section A: Accelerators, Spec-trometers, Detectors and Associated Equipment 560 (2), 405-408(2006).
39. Alexopoulos, T. et al., A spark-resistant bulk-micromegas cham-ber for high-rate applications. Nuclear Instruments and Methods inPhysics Research Section A: Accelerators, Spectrometers, Detec-tors and Associated Equipment 640, 110-118 (2011).
40. Procureur, S., Dupré, R. & Aune, S., Genetic multiplexing and firstresults with a 50x50cm2 Micromegas. Nuclear Instruments andMethods in Physics Research Section A: Accelerators, Spectrom-eters, Detectors and Associated Equipment 729, 888-894 (2013).
41. Bouteille, S. et al., A Micromegas-based telescope for muon tomog-raphy: The WatTo experiment. Nuclear Instruments and Methods inPhysics Research Section A: Accelerators, Spectrometers, Detec-tors and Associated Equipment 834, 223-228 (2016).
42. Flouzat, C. et al., Dream: a 64-channel Front-end Chip with Ana-logue Trigger Latency Buffer for the Micromégas Tracker of theCLAS12 Experiment. Proc. of TWEPP conference (2014).
43. Brun, R. & Rademakers, F., ROOT—an object oriented data analysisframework. Nuclear Instruments and Methods in Physics ResearchSection A: Accelerators, Spectrometers, Detectors and AssociatedEquipment 389 (1-2), 81-86 (1997).
44. Maragioglio, V. & Rinaldi, C., L’architettura delle piramidi Menfite.Parte IV, La Grande piramide di Cheope (Rapallo, 1965).
45. Kraus, K., Photogrammetry: geometry from images and laser scans(Walter de Gruyter, 2007).
Extended Data Table 1 | Comparison of the three muon detectiontechnologies.
Nuclear emulsion Hodoscopes Gas detectors
Nagoya University KEK CEA
Angular Resolution 2-14 mrad 7-10 mrad 0.8 - 4 mrad
Angular Acceptance 45 degrees 34 - 45 degrees 45 degrees
Active area
(for this analysis)
30 cm x 25 cm / unit:
0.75 m x 0.6 m (NE1)
0.9 m x 0.5 m (NE2)
1.2 m x 1.2 m 50 cm x 50 cm
Position Resolution 1 μm 10 mm 400 μm
Height 0.2 mm 1-1.5 m 60 cm
Power requirement No Yes (300W) Yes (35W)
Data taking Need development Real time Real time
7

100 μm
Silber bromide crystals (diameter 200 nm)
70 μm
175 μm
70 μm
Emulsion layer
Emulsion layer
Track
Photographic development process
Transparency plastic base plate
a b c
d
e
f
Aluminum honeycomb plate : 17 mm
Rubber plate (5 mm)
Aluminum honeycomb plate : 17 mm
hg
Nuclear emusion (0.3 mm)
Extended Data Figure 1 | Overview of the nuclear emulsion films (Nagoya University). a, A cross sectional schematic view of nuclear emulsion. b, Enlargedschematic view of the emulsion layer. Silver bromide crystals are dispersed in gelatin. The red dashed arrow shows the trajectory of the charged particle. c, After thephotographic development process, silver grains are aligned along the lines with the trajectory (or, track) of charged particle. d, An optical microscopic photographof a track of minimum ionized particle recorded in a nuclear emulsion. e, A nuclear emulsion after development. f, A vacuum packed nuclear emulsion. g, Schematicview of the detector configuration: six packed nuclear emulsion films with a detection area of 30 × 25 cm2 each (yellow) are fixed between aluminum supportingplates (honeycomb plate, in grey). Two films stacked on top of each other are pressed with a rubber sheet (black) by four short screws. Three additional long screwsare used as legs to correct the inclination of the detector. h, Cross sectional schematic view of the nuclear emulsion detector as shown in g. Two packed films arestacked between two honeycomb plates and rubber sheet.
8
NE1 (nuclear emulsions, position 1) NE2 (nuclear emulsions, position 2)
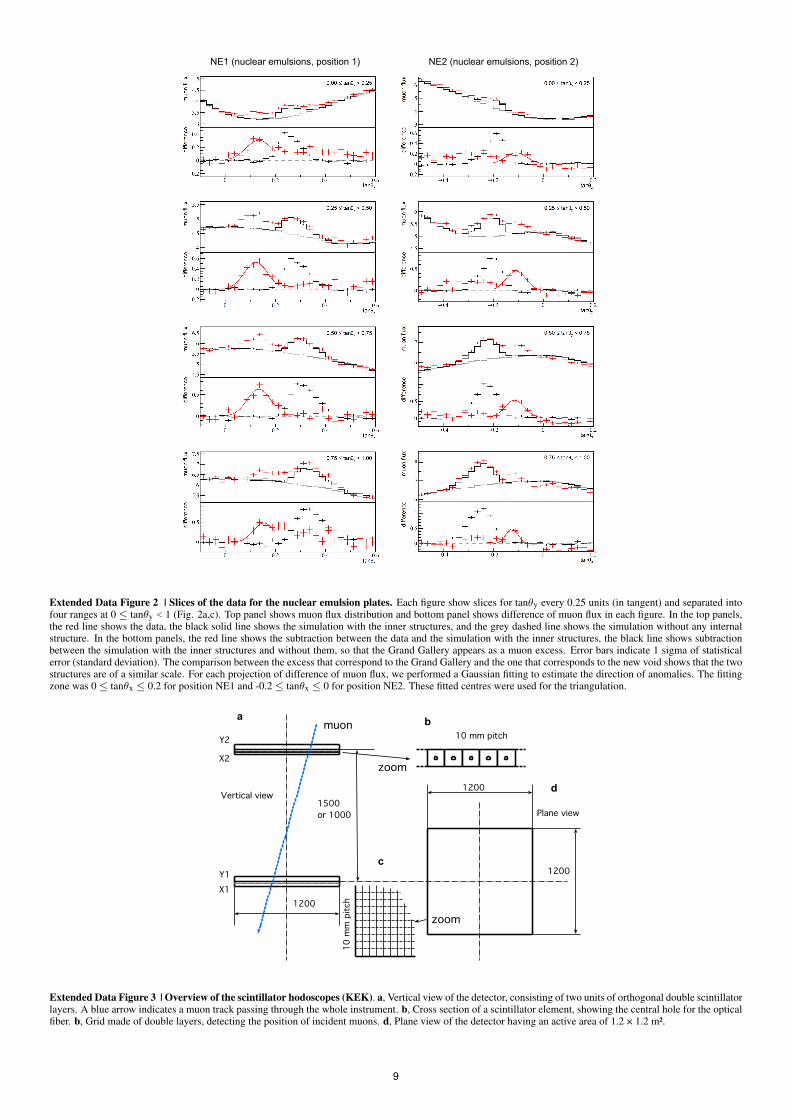
Extended Data Figure 2 | Slices of the data for the nuclear emulsion plates. Each figure show slices for tanθy every 0.25 units (in tangent) and separated intofour ranges at 0 ≤ tanθy < 1 (Fig. 2a,c). Top panel shows muon flux distribution and bottom panel shows difference of muon flux in each figure. In the top panels,the red line shows the data, the black solid line shows the simulation with the inner structures, and the grey dashed line shows the simulation without any internalstructure. In the bottom panels, the red line shows the subtraction between the data and the simulation with the inner structures, the black line shows subtractionbetween the simulation with the inner structures and without them, so that the Grand Gallery appears as a muon excess. Error bars indicate 1 sigma of statisticalerror (standard deviation). The comparison between the excess that correspond to the Grand Gallery and the one that corresponds to the new void shows that the twostructures are of a similar scale. For each projection of difference of muon flux, we performed a Gaussian fitting to estimate the direction of anomalies. The fittingzone was 0 ≤ tanθx ≤ 0.2 for position NE1 and -0.2 ≤ tanθx ≤ 0 for position NE2. These fitted centres were used for the triangulation.
ab
c
d
Extended Data Figure 3 | Overview of the scintillator hodoscopes (KEK). a, Vertical view of the detector, consisting of two units of orthogonal double scintillatorlayers. A blue arrow indicates a muon track passing through the whole instrument. b, Cross section of a scintillator element, showing the central hole for the opticalfiber. b, Grid made of double layers, detecting the position of incident muons. d, Plane view of the detector having an active area of 1.2 × 1.2 m².
9
H2H1
ΔxΔx
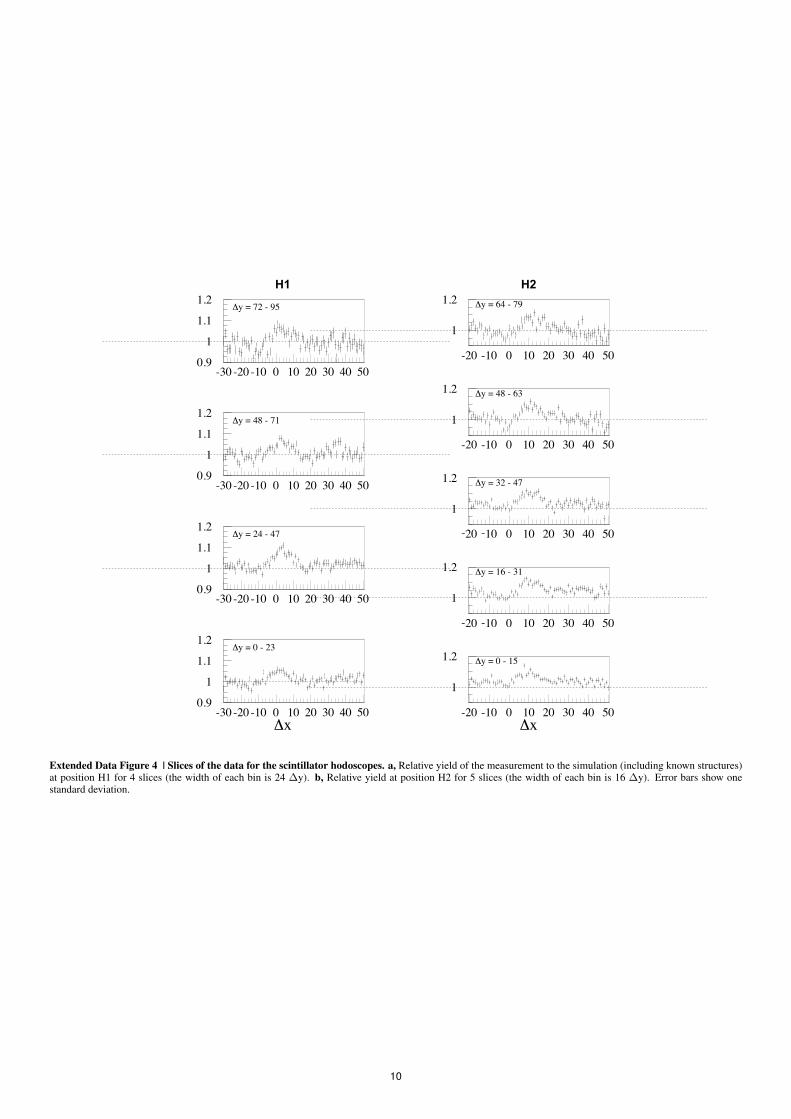
Extended Data Figure 4 | Slices of the data for the scintillator hodoscopes. a, Relative yield of the measurement to the simulation (including known structures)at position H1 for 4 slices (the width of each bin is 24 ∆y). b, Relative yield at position H2 for 5 slices (the width of each bin is 16 ∆y). Error bars show onestandard deviation.
10

0 10 20 30 40 50 600
500
1000
1500
2000
2500
3000
days
Sig
nal am
plitu
de [
AD
C] Mission 3
0 10 20 30 40 50 60 70 80 900
500
1000
1500
2000
2500
3000
days
Sig
nal am
plitu
de [
AD
C] Mission 1
0 5 10 15 20 25 30 35 40 450
500
1000
1500
2000
2500
3000
days
Sig
nal am
plitu
de [
AD
C] Mission 2
0 5 10 15 20 25 30-200
-100
0
100
200
300
400
500
600
Sample number
Am
pli
tud
e [
AD
C]
a b c
d h
e f g
Extended Data Figure 5 | Overview of the gas detectors (CEA). a, Design of a telescope (without its cover) showing the 4 detectors, the electronics box, thebattery and the gas bottles. b, Design of the multiplexed Micromegas detector; c, Principle of a Micromegas detector showing the ionization and amplification ofthe signal initiated from a charged particle (dotted array). d, layout of the detector with the micro-mesh in red, the resistive strip film in blue, and the Y, X Copperreadout strips in yellow; e-g, amplitude variation of a detector in Alhazen as a function of time for 2 previous campaigns (missions 1 and 2) and the one reportedhere (g), showing the effect of the patented feedback. Large variations observed in (e,f) can lead to inefficiency or degraded resolution, and are totally absent for thedata of this paper. The only step observed in (g) corresponds to a manual change of the target amplitude. h, typical signal recorded in a detector, where each linecorresponds to an electronic channel.
11

0 0.1 0.2 0.3 0.4 0.5 0.6 0.7 0.8 0.9 10
200
400
600
800
1000
1200
1400
1600
1800
2000
)θtan(
) < 0.21φ0.11 < tan(
1
0 0.1 0.2 0.3 0.4 0.5 0.6 0.7 0.8 0.9 10
200
400
600
800
1000
1200
1400
1600
1800
2000
)θtan(
) < 0.19φ0.09 < tan(
2
0 0.1 0.2 0.3 0.4 0.5 0.6 0.7 0.8 0.9 10
200
400
600
800
1000
1200
1400
1600
1800
)θtan(
) < 0.17φ0.07 < tan(
3
0 0.1 0.2 0.3 0.4 0.5 0.6 0.7 0.8 0.9 10
200
400
600
800
1000
1200
1400
1600
1800
)θtan(
) < 0.15φ0.05 < tan(
4
0 0.1 0.2 0.3 0.4 0.5 0.6 0.7 0.8 0.9 10
200
400
600
800
1000
1200
1400
1600
)θtan(
) < 0.13φ0.03 < tan(
5
0 0.1 0.2 0.3 0.4 0.5 0.6 0.7 0.8 0.9 10
200
400
600
800
1000
1200
1400
1600
)θtan(
) < 0.11φ0.01 < tan(
6
0 0.1 0.2 0.3 0.4 0.5 0.6 0.7 0.8 0.9 10
200
400
600
800
1000
1200
1400
1600
)θtan(
) < 0.09φ-0.01 < tan(
7
0 0.1 0.2 0.3 0.4 0.5 0.6 0.7 0.8 0.9 10
200
400
600
800
1000
1200
1400
)θtan(
) < 0.07φ-0.03 < tan(
8
0 0.1 0.2 0.3 0.4 0.5 0.6 0.7 0.8 0.9 10
200
400
600
800
1000
1200
1400
)θtan(
) < 0.05φ-0.05 < tan(
9
0 0.1 0.2 0.3 0.4 0.5 0.6 0.7 0.8 0.9 10
200
400
600
800
1000
1200
1400
)θtan(
) < 0.03φ-0.07 < tan(
10
0 0.1 0.2 0.3 0.4 0.5 0.6 0.7 0.8 0.9 10
200
400
600
800
1000
1200
)θtan(
) < 0.01φ-0.09 < tan(
11
0 0.1 0.2 0.3 0.4 0.5 0.6 0.7 0.8 0.9 10
200
400
600
800
1000
1200
)θtan(
) < -0.01φ-0.11 < tan(
12
0 0.1 0.2 0.3 0.4 0.5 0.6 0.7 0.8 0.9 10
200
400
600
800
1000
1200
)θtan(
) < -0.03φ-0.13 < tan(
13
0 0.1 0.2 0.3 0.4 0.5 0.6 0.7 0.8 0.9 10
200
400
600
800
1000
)θtan(
) < -0.05φ-0.15 < tan(
14
0 0.1 0.2 0.3 0.4 0.5 0.6 0.7 0.8 0.9 10
200
400
600
800
1000
)θtan(
) < -0.07φ-0.17 < tan(
15
0 0.1 0.2 0.3 0.4 0.5 0.6 0.7 0.8 0.9 10
100
200
300
400
500
600
700
800
900
)θtan(
) < -0.09φ-0.19 < tan(
16
Extended Data Figure 6 | tan(phi), horizontal slices on the Alhazen muography. The slices are 0.10 (in tangent) thick, and each slice is shifted by 0.02 withrespect to the previous one, which means they overlap. Distributions are generally smooth, with 2 significant muon excesses on histograms 5-6 and 15 (see Methodsfor details). Error bars show one standard deviation.
12

Extended Data Figure 7 | RTMS simulator and 3D models. a, RTMS with CEA position G2 (Alhazen) sensor with a 6-view layout. Interactive view with displayof sensor field of view and cone projections. Real time simulation with internal structure overlaid in wireframe. Result with sensor point of view superposition b,Zoom on chevron area (shaded wireframe) c, Large view of optimized 3D model (shaded wireframe). d, Detail of optimized 3D model.
13