discovering the archaeologists of europe 2012-14: transnational … · 7 nature of the work. 78% of...
TRANSCRIPT

1
Discovering the Archaeologists of
Europe 2012-14: Transnational Report
Kenneth Aitchison, Efthymia Alphas, Vera Ameels, Martin Bentz, Corina Borș, Elisa Cella, Kerri Cleary, Cláudia Costa, Paul Damian, Mariana Diniz, Cidália Duarte, Jan Frolík, Carolina Grilo, Initiative for Heritage Conservancy, Nele Kangert, Raimund Karl, Anette Kjærulf Andersen, Viire Kobrusepp, Tina Kompare, Eduard Krekovič, Miguel Lago da Silva, Andrew Lawler, Irena Lazar, Katheriin Liibert, Alexandra Lima, Gavin MacGregor, Niamh McCullagh, Michaela Mácalová, Ain Mäesalu, Magdalena Malińska, Arkadiusz Marciniak, Mārtiņš Mintaurs, Katharina Möller, Ulla Odgaard, Eva Parga-Dans, Doris Pavlov, Vesna Pintarič Kocuvan, Doug Rocks-Macqueen, Jette Rostock, João Pedro Tereso, Alessandro Pintucci, Elena S. Prokopiou, Jorge Raposo, Karin Scharringhausen, Tine Schenck, Marjo Schlaman, Jeanette Skaarup, Andris Šnē, Danica Staššíková-Štukovská, Ingrid Ulst, Monique van den Dries, Heleen van Londen, Rocío Varela-Pousa, Catarina Viegas, Armands Vijups, Nathalie Vossen, Tobias Wachter & Ludwika Wachowicz.
York Archaeological Trust
Published by York Archaeological Trust 2014
All contents copyright © 2014 the authors listed above.

2

3
This work is licensed under the Creative Commons Attribution 3.0 Unported License. To view a copy of this license, visit http://creativecommons.org/licenses/by/3.0/ or send a letter to Creative
Commons, 444 Castro Street, Suite 900, Mountain View, California, 94041, USA.
Under the terms of this licence, you are free:
to Share - to copy, distribute and transmit the work to Remix – to adapt the work to make commercial use of the work
Under the following conditions:
Attribution — You must attribute the work in the manner specified by the author or licensor (but not in any way that suggests that they endorse you or your use of the work).
With the understanding that:
Waiver — Any of the above conditions can be waived if you get permission from the copyright holders.
Public Domain — Where the work or any of its elements is in the public domain under applicable law, that status is in no way affected by the licence.
Other Rights — In no way are any of the following rights affected by the licence: Your fair dealing or fair use rights, or other applicable copyright exceptions
and limitations; The authors’ moral rights; Rights other persons may have either in the work itself or in how the work is
used, such as publicity or privacy rights.
Notice — For any reuse or distribution, you must make clear to others the licence terms of this work.
The publisher has used its best efforts in preparing this book, and the information provided herein is provided "as is." York Archaeological Trust makes no representation or warranties with respect to the accuracy or completeness of the contents of this book and specifically disclaims any implied
warranties of merchantability or fitness for any particular purpose and shall in no event be liable for any loss of profit or any other commercial damage, including but not limited to special, incidental,
consequential, or other damages.
ISBN 978-1-874454-70-0
The transnational Discovering the Archaeologists of Europe 2014 project was administered by York Archaeological Trust with financial support from the Lifelong Learning Programme of the European Commission. This report reflects the views only of the authors, and the Commission cannot be held responsible for any use which may be made of the information contained therein.

4
Contents
Contents
Contents 4 Tables 5 Figures 5 Executive Summary 6 Introduction 8
Rationale and Background to the Work 9 Context 10
Global Economic Context 10 European Policy Context 10 Archaeological Policy Context 11
Aims and Objectives 14 Lifelong Learning Programme Priority and Objectives 15
Archaeologists in Europe, 2012-14 17 Total Numbers of Archaeologists 17
Total Numbers of Archaeologists – Change over Time 20 Past Numbers of Archaeologists 22
Past Numbers of Archaeologists – Change Over Time 23 Future Numbers of Archaeologists 24
Future Numbers of Archaeologists – Change Over Time 25 Archaeologists’ Ages and Genders 26
Archaeologists’ Age and Gender – Change Over Time 29 The Disability Statuses of Archaeologists 31
The Disability Statuses of Archaeologists – Change Over Time 32 Archaeologists’ Countries of Origin 33
Archaeologists’ Countries of Origin – Change Over Time 34 Qualifications 36
Qualifications – Change Over Time 38 Salaries 39
Salaries – Change Over Time 42 Contracts 44
Contracts – Change Over Time 45 Working Hours 46
Working Hours – Change Over Time 47 Archaeological Employers (Organisations) 48
Archaeological Employers (Organisations) – Change Over Time 49 Vocational Education and Training 50
Vocational Education and Training – change over time 50 Conclusions 51
Multilateral Network 52 External Data and Global Context 53
Recommendations 55 Acknowledgements 56
Bibliography 57

5
Tables
Table 1: Total Numbers of Professional Archaeologists, 2012-14 18 Table 2: Estimated Archaeologists as Percentage of Populations 19 Table 3: Total Estimated Numbers of Archaeologists and Gross Domestic Product 20 Table 4: Total Estimated Numbers of Archaeologists - change over time 21 Table 5: Past Sizes of Organisations 22 Table 6: Past Numbers of Archaeologists - change over time 23 Table 7: Future Sizes of Organisations 24 Table 8: Future Sizes of Organisations – change over time 25 Table 9: Archaeologists’ Ages and Genders 26 Table 10: Archaeologists’ Ages – changes over time 29 Table 11: Archaeologists’ Genders – change over time 30 Table 12: Disability Statuses of Archaeologists 31 Table 13: Disability Status of Archaeologists – change over time 32 Table 14: Countries of Origin 33 Table 15: Countries of Origin – change over time 34 Table 16: Highest Qualifications Held 36 Table 17: Where Highest Qualifications Obtained 37 Table 18: Qualifications – change over time 38 Table 19: Average Salaries in Archaeology and National Averages for all Occupations 39 Table 20: Aggregate Salaries and Total Expenditure 42 Table 21: Salaries - change over time 43 Table 22: Archaeologists' Contract Lengths 44 Table 23: Full-time / Part-time Work 46 Table 24: Full-time / Part-time Work - change over time 47
Figures
Figure 1: Archaeologists’ Age Distributions 27 Figure 2: Archaeologists’ Genders 28 Figure 3: Archaeologists’ Ages – changes over time 29 Figure 4: Highest Qualifications Held 37 Figure 5: Comparison of Average Archaeological Salaries with National Averages 41

6
Executive Summary
Between 2012 and 2014 representatives from 23 organisations in 21 European countries worked together in the Discovering the Archaeologists of Europe 2014 project to gain insight into the profile of the archaeological profession and labour market in those countries. The results can be compared with those of a predecessor Discovering the Archaeologists of Europe project, undertaken in 2006-08,
Employment. Across the 21 participating states, it is calculated that a total of over €1 billion is spent on professional archaeology every year, with the majority of that expenditure being on the salary costs of the estimated 24,740 people who work as archaeologists in these countries. This group of professionals represents 0.006% of the combined total workforces of those states. In many states, the absolute numbers employed in archaeology has fallen significantly over the previous six years. It is estimated that approximately 33,000 archaeologists now work across Europe as a whole.
Growth of the sector. Across Europe, organisations employing archaeologists have typically become smaller over the five years prior to this project, and employers are very cautious about predicting future growth.
Nature of the workforce. A slight majority (50.3% to 49.7%) of archaeologists are women. The proportion of women in the workforce has increased over the six years since 2006-08 from 45.9%. On average, European archaeologists are 40 years old. Very few European archaeologists are disabled – 1.1% of the total number of workers for whom data were available, a reduction from 1.5% in 2006-08.
Countries of Origin. 94% of archaeologists work in their own countries of origin, 5% are from other EU states and 1% from elsewhere in the world. Overall, this shows a slight decline in sectoral transnational mobility, as in 2006-08 more archaeologists were working away from their countries of origin.
Qualifications. In every participating state, it is normal for people working in archaeology to hold a degree – on aggregate, 94% of European archaeologists are graduates and the majority (69%) are postgraduates. 90% of archaeologists gained their highest qualifications in the countries in which they now work, with 9% obtaining those qualifications elsewhere in Europe (and 1% elsewhere in the world). When compared with the figures from 2006-08, this shows that archaeologists are increasingly educationally mobile.
Salaries. In twelve of the 21 participating states, archaeologists were paid less than the national average for all workers. An average figure of €24,901 was calculated as the mean salary earned by an archaeologist, but this is relatively meaningless as average salaries vary enormously between counties, with Danish archaeologists earning on average nine times the amount earned by their peers in Bosnia and Herzegovina.

7
Nature of the work. 78% of the archaeologists for whom data were available worked full-time and 22% part-time. This is a marked change from 2006-08, when the percentages were 86% full-time and 14% part-time. 63% of archaeologists held permanent contracts at the time of the research, while the remaining 37% of workers had time-limited contracts.
Structures. As was identified in the predecessor project in 2006-08, archaeological practice in the participating states is organised on different models, with varying levels of commercial activity balanced against state agency engagement. This is often linked to the funding basis of archaeological practice (variation both on the basis of funding from the state or from private sector industries, and on whether delivery is achieved by the state or by the private sector). Different states define who can be considered to be an archaeologist in different ways. Vocational education and training (VET) in the sector is almost universally delivered by universities through academic degree programmes.
Skills and Training Needs. Issues relating to specific training needs were assessed in each participating country, but, as in 2006-08, because of the variety of ways in which these questions were asked by the project partners (in order to accommodate the differing structures and approaches to archaeological work in each participating state), the information obtained cannot be usefully compared transnationally.
Trends and developments. In comparison with the predecessor work undertaken in 2006-08, the main ways that the sector has changed are that the number of jobs has decreased and the proportion of women working in the sector has increased. Furthermore, jobs are more likely to be part-time and for shorter contractual periods; archaeologists are more highly qualified, but are less well-paid in comparison with other sectors.

8
Introduction
The Lifelong Learning Programme of the European Commission has supported a project to investigate the labour market and skills issues in European archaeology. Discovering the Archaeologists of Europe 2014, the successor to an earlier project undertaken six years previously, involved 21 partner organisations and two associate partners from a total of 21 European states.
The project was launched when it was recognised that professional archaeological practice in Europe was coming under economic pressure following the effects of the global financial crisis and this was particularly affecting employers’ abilities to invest in vocational education and training for their staff.
Partners collected data from sectoral employers in their own states, identifying labour market intelligence together with vocational education and training priorities, and have presented recommendations using this evidence to training providers.
This Transnational Report presents selected data from the 21 national reports to identify comparisons and issues across European states and changes and trends over time.

9
Rationale and Background to the Work
This project was grounded on the basis that
“Archaeological material, sites and landscapes are non-renewable [environmental and cultural] resources so professional education (understanding the roles of this material in the past and its importance in the present or future) cannot treat practical skills as an optional add-on to academic, theoretical study. Vocational education and training is critical for all archaeologists working in Europe, whether at the entry-stage of their career or as on-going continuing professional development” (YAT 2012, 40).
and
“The specific needs of contemporary professional archaeology as a sector in Europe are –
that archaeological practice is under economic pressure following the effects of the global financial crisis, and this is particularly affecting employers’ abilities to invest in VET
there is still a level of difficulty for individuals to move from country to country because qualifications are not universally recognised“ (ibid.).
This has led the project to aim to support closer links between vocational education and training (VET) and working life in archaeology in order to make VET more responsive to labour market needs (of both individuals and employers).
The project was delivered on the basis that gathering and exchanging information and experience (providing an evidence base for the sector), as well as supporting the dissemination and implementation of common approaches, methods and tools linked to the New Skills for New Jobs initiative (EC 2008), would improve sectoral identification and anticipation of skill and competence needs and their integration in VET provision. Its outcomes promote the integration of learning with working.
Because of the global economic transformation since 2008, the project has been particularly focussed on identifying and addressing changes and impacts caused by the economic changes:
identifying labour market information and trends, including training investment, recruitment and career progression difficulties
identifying training needs and skills shortages
establishing the number and profile of professional archaeologists
identifying the range of archaeological employers
providing employers with information to aid business planning and improve organisational performance
providing individuals with information to help develop their careers
supporting VET providers with information on employers’ needs.

10
Context
This project was undertaken in the context of archaeology’s ongoing transformation from an academic discipline to an applied, environmental practice with novel demands for vocational education and training, set against the backdrop of the global economic changes of the first decade of the 21st century and their effects on this profession.
Global Economic Context
Immediately following the conclusion of the predecessor Discovering the Archaeologists of Europe project, the effects of the global financial crisis that was triggered in 2008 by subprime mortgage losses in the United States began to impact on archaeological practice in terms of both employment and training investment. The immediate effects of the economic situation on the sector were reviewed at a conference in 2009 and subsequent publication (Archaeology and the Global Economic Crisis – Schlanger & Aitchison [2010]). Most of the papers presented were opinion pieces, but some were based on new (limited) data which clearly identified the need for more up-to-date figures to try to support recovery plans. Several of the project partners contributed to that volume.
The effects of the global economic crisis upon archaeology were identified at European and global levels (Aitchison 2009b, 2009c), and the subsequent Eurozone and sovereign debt financial crises compounded the problems in many countries over the years that immediately followed.
European Policy Context
At the highest level, the European Union seeks to improve the capabilities and skills of workers. In the context of this project, which has aimed to present the benefits of and need for European cooperation (as opposed to national, regional or local approaches), this has also been linked to the development of opportunities for transnational mobility and for the preservation and promotion of a shared European heritage, within a framework of policies that operate at a European level.
The Treaty on European Union Improving the capabilities and skills of workers who are protecting or curating archaeological heritage can be justified as the principle that the European Union can act in support of cultural heritage is enshrined in the Treaty on European Union, as the European Union seeks to “ensure that Europe’s cultural heritage is safeguarded and enhanced” (EU 1992, article 3.3) and that it will do this by “encouraging cooperation between Member States and, if necessary, supporting and supplementing their action” in the field of culture (EU 2008, article 167).

11
Europe 2020 Europe 2020 is the European Union’s ten-year growth and jobs strategy which was launched in 2010 (EC 2010). It is primarily about addressing the outcomes of the global economic crisis that began in 2007-08, and seeks to achieve this by addressing the shortcomings of the previous growth model and creating the conditions for a smart, sustainable and inclusive growth.
The objectives of the strategy are supported by seven ‘flagship initiatives’, one of which is being directly addressed by this project, ‘An Agenda for New Skills for New Jobs”.
New Skills for New Jobs The project has followed the direction of the EC’s Employment, Social Affairs and Inclusion initiative, New Skills for New Jobs (EC 2008) (which became a flagship initiative of Europe 2020), by working to “promote better anticipation of future skills needs, develop better matching between skills and labour market needs and [to] bridge the gap between the worlds of education and work”.
ET 2020 The project has demonstrated complementarity with ET 2020, the Education and Training 2020 Work Programme, which is the strategic framework for European cooperation in education and training, by specifically contributing to the strategic objectives of improving the quality and efficiency of education and training and of making lifelong learning and mobility a reality.
In doing this, the project has provided workers and employers with reliable statistical information that they require in order to assess and take advantage of opportunities to train and work in states other than their own.
Archaeological Policy Context
The European Union takes a less direct role in influencing archaeological (cultural heritage) policy when compared with natural heritage policy. However, it has been significant at the crossover between cultural and natural heritage, when both can be perceived as being environmental resources to be protected within the process of sustainable development.
This has meant that in terms of archaeological employment, European legislation is important because it stimulates the need for archaeological work through the planning and environmental assessment processes and it regulates the quality of work (through the application of the Valletta Convention, below).
Environmental Impact Assessment The most significant European policy to affect archaeological practice was Council Directive 85/337/EEC, published in 1985 and then updated in 1992 and 2014 (EEC, 2014), which established the requirement for the environmental impact of any significant land use change to be assessed, and for subsequent mitigation to take place where required – and in

12
terms of archaeological practice, this was very important because cultural heritage, including archaeological remains, was identified as an environmental component to be considered. All member states of the Union are obliged to incorporate EU Directives into national law, and it was following this Directive that all member states have made arrangements for the assessment of the impact of development on environmental resources, including archaeological remains. The actual ways in which this Directive is implemented vary from state to state (and even regionally within decentralised member states), which has contributed to the particular national characteristics of applied practice in each European country.
Valletta Convention Council of Europe (CoE) policy, specifically the (Valletta) Convention on the Protection of Archaeological Heritage (revised) (CoE, 1992) has had more visible, popular significance in European applied archaeology than the policies of the European Union, as it emphasises the need for quality control, but in terms of its impact upon archaeological employment and practice has had much less effect than the Environmental Impact Assessment regulations, which opened up and developed a whole new, significant area of archaeological work.
Discovering the Archaeologists of Europe (2006-08) Previously, the only significant piece of work in this area was the predecessor project, Discovering the Archaeologists of Europe (2006-08), which profiled archaeologists working in twelve EU member states.
The only European countries where any comparable work before that project had been undertaken were the United Kingdom and Ireland. Following the 2006-08 project, comparable data were collected in Bosnia and Herzegovina and in Spain in 2009.
The primary focus of the 2006-08 project, which was part-funded by the European Commission through the Leonardo da Vinci II fund, was on transnational mobility and identifying ways to overcome any barriers facing workers in this sector. The project produced national reports and oversight through a transnational report (Aitchison 2009a).
That project reported just before the global economic changes of 2008, and so provides valuable benchmark data from the pre-crash economic peak which allowed changes that had taken place to be properly evaluated in this, Discovering the Archaeologists of Europe 2014 project.
Archaeological Practice and VET In all of the countries participating in this project, universities are the leading providers of VET for the archaeological sector. Six of the project partners are university Departments of Archaeology.
Two of the partnership bodies are professional associations, promoting standards and competence within their own states. By participating in this project they have been able to work together in order to seek to endorse individual members for their work across Europe.

13
The European Association of Archaeologists (a partner in this project) has a standing Committee on Professional Associations in Archaeology, which is currently co-chaired by Kenneth Aitchison, the project coordinator for this project. That Committee is charged with advising the Association on issues relating to professionalism, training and employment within European archaeology, and so the active involvement of project staff with that Committee will enhance the quality of the disseminated results to individual archaeologists and employers across Europe.
By improving understanding of the requirements for, and capacity to provide VET for archaeologists across Europe, the benefits of the project should be relevant for archaeologists and the broader cultural heritage sector, as well as to their clients, educators and the wider public.
Most of the partner states do not have specifically archaeological bodies overseeing and advising on VET, and so the national results will help governments, agencies, SMEs and individual archaeologists structure their enterprises to promote and facilitate work in archaeology with suitably skilled staff.

14
Aims and Objectives
The specific objective of the predecessor project (Discovering the Archaeologists of Europe) was to form a Transnational Network of organisations with common interests and aims, and for the members of that Network to collect, assess and share data on employment and vocational education and training (VET). In that project, twelve partners produced estimates of the numbers of archaeologists working in each country, with data on age and gender, disability status, country of origin, full- and part-time employment, past and future trend data, highest qualifications and where these were obtained, information on training needs and skills shortages, and salaries or wages paid for archaeological work.
This project – Discovering the Archaeologists of Europe 2014 - has expanded the Network (now a Multilateral Network) in order to carry out updated research and to re-evaluate the state of archaeological employment across Europe in the light of the previous five years’ economic changes.
The concrete Aims of the project have been:
1. To promote better anticipation of future skills needs in the sector of professional archaeology
2. To develop better matching between skills and labour market needs in this sector
3. To bridge the gap between the worlds of education and work for this sector
The Objectives (all of which were outcome based and assessable, not task-based) were:
a) to identify labour market information and trends, including training investment, recruitment and career progression difficulties, from both the supply (individuals’) and demand (employers’) perspectives
b) to identify training needs and skills shortages c) to establish the number and profile of archaeologists working in each state d) to identify the range of archaeological employers involved in providing
archaeological services, expertise and training e) to identify the range of providers of archaeological vocational education and training f) to provide employers with information to aid business planning and improve
organisational performance g) to provide individuals with information to help plan their own training and thus to
develop their careers h) to provide vocational education and training providers with information on demand
from individuals and employers in order to allow them to calibrate their provision to meet the needs of the world of work
The Intentions were that the situation would be changed: i. Employers would be better informed, enabling them to better plan for future
recruitment needs and training development issues ii. Individual archaeological workers and aspirant archaeological workers would be able
to plan their vocational education and training and thus to develop their own careers

15
iii. VET providers would be able to better match the courses and learning opportunities that they provide to the demonstrated needs of the world of work.
Lifelong Learning Programme Priority and Objectives
The project addressed a specific Priority of the European Commission’s Lifelong Learning Programme and also had a series of objectives that were specific to the objectives of the Programme.
Lifelong Learning Programme Priority 1 Cooperation between VET and world of work
Since 2007-08 the global economic crisis has seriously impacted on employment in archaeological practice across Europe. There is a clear demand for enhanced VET to help sectoral workers and employers navigate changes in working practices, and so better information has to be made available to VET providers. This project has identified where employers recognise skills issues, and has made recommendations to VET providers on transnational and national approaches to alleviate these problems.
LLP-Obj-a To contribute to the development of quality lifelong learning and to promote high performance, innovation and a European dimension in systems and practices in the field
Lifelong learning in professional archaeology has been subject to underinvestment. This is a relatively modern profession, only emerging from its academic origins to become an applied profession in the last 20-25 years, without strategic consideration having been given to professional development.
LLP-Obj-k To encourage the best use of results, innovative products and processes and to exchange good practice in the fields covered by the Lifelong Learning Programme, in order to improve the quality of education and training
The project has actively shared results across Europe on the issues of professional archaeologists' current qualifications and the areas of where skills development needs are identified by employers. These data are being actively provided to VET providers to develop new and best practice in delivering education and training for professionals (and aspirant professionals) in this field and in doing so is also seeking to enhance transnational applicability of qualifications.
LEO-SpObj-a To support participants in training and further training activities in the acquisition and the use of knowledge, skills and qualifications to facilitate personal development, employability and participation in the European labour market
The project has identified the VET issues that sectoral employers prioritise and is using these to make recommendations to VET providers who can then better match the training they

16
provide to the needs of the current and future workforce. This will lead to improved support for participants' skills-based training, including access to vocational qualifications, thus enhancing their individual employability and their opportunities to access and participate in a sectoral European labour market.
LEO-SpObj-b To support improvements in quality and innovation in vocational education and training systems, institutions and practices
The outcomes of the project are ensuring that VET is aiming to be delivered against defined and quantified needs, rather than on ad-hoc or anecdotal accounts of demand. This will allow training institutions to demonstrate that they will deliver skills that will maximise training participant's employability. Where vocational qualifications for the sector exist that can be mapped against the European Qualifications Framework, the transnational application of these is being encouraged and endorsed.
LEO-OpObj-2 To improve the quality and to increase the volume of co-operation between institutions or organisations providing learning opportunities, enterprises, social partners and other relevant bodies throughout Europe
The project has brought together 23 organisations from 21 European states all of which have worked to improve opportunities for people to work and learn in archaeology. The partners who have cooperated represent a wide range of types of organisations involved in providing training and learning opportunities (professional associations, small or medium enterprises, social partners [a trade union, social enterprises], universities, museums, regional government and national government departments).
LEO-OpObj-4 To improve the transparency and recognition of qualifications and competences, including those acquired through non-formal and informal learning
The predecessor project which initially formed the Network that this project has supported particularly focussed on transparency and recognition of academic qualifications. This project has particularly focused on the VET needs of workers, and is making recommendations to VET providers on national and transnational approaches to improving delivery and to ensuring that the skills gained and any qualifications awarded can be recognised transnationally.

17
Archaeologists in Europe, 2012-14
The project focussed on the identification of practitioners within professional archaeology and so through doing this has aimed to identify and support any needs they have to improve or maintain necessary skills. Gathering data from 21 countries has shown that while there is not a significant diversity of practice when it comes to obtaining primary evidence about human activities in the past, there is a great deal of variation in the approaches taken to curating or managing that evidence, which lead to significantly different skills needs in different parts of Europe.
Total Numbers of Archaeologists
Project partners produced estimated totals for the numbers of archaeologists in paid employment in each country. It is important to note that these are estimated totals, not the specific numbers that were directly identified in surveys.
While the overall approach used was a form of probability sampling, using closed populations, as slightly different methodologies were applied by each partner to gathering data and to defining who could be considered to be a professional archaeologist, there is potential for some coverage errors and non-response errors to have been introduced. These terms are explained by Aitchison & Edwards (2008, 25) in the introduction to the methodology used in the predecessor project’s UK component.
”…as the mailing list was not likely to be perfect, there will have been some coverage error (omission, duplication or wrongful inclusion of population elements) but minimal sampling error (where only a subset of the total population is sampled). The levels of non-response may have introduced some non-response error (all error definitions after Groves, 1989) if the non-respondents had differed significantly from the respondents, but the authors and project board are confident that the non-responding organisations would not have provided data that would have been significantly different in qualitative terms”.
The profession of ‘Archaeologist’ is not legally Regulated in many countries (see Archaeologists’ Countries of Origin below), and so for the purpose of this project, ‘Archaeologist’ was defined and justified as appropriate in each country. Definitions aimed to be as broad as possible, and educational achievements were not automatically regarded as being of primary importance in determining whether an individual can be regarded as an archaeologist or not.
18
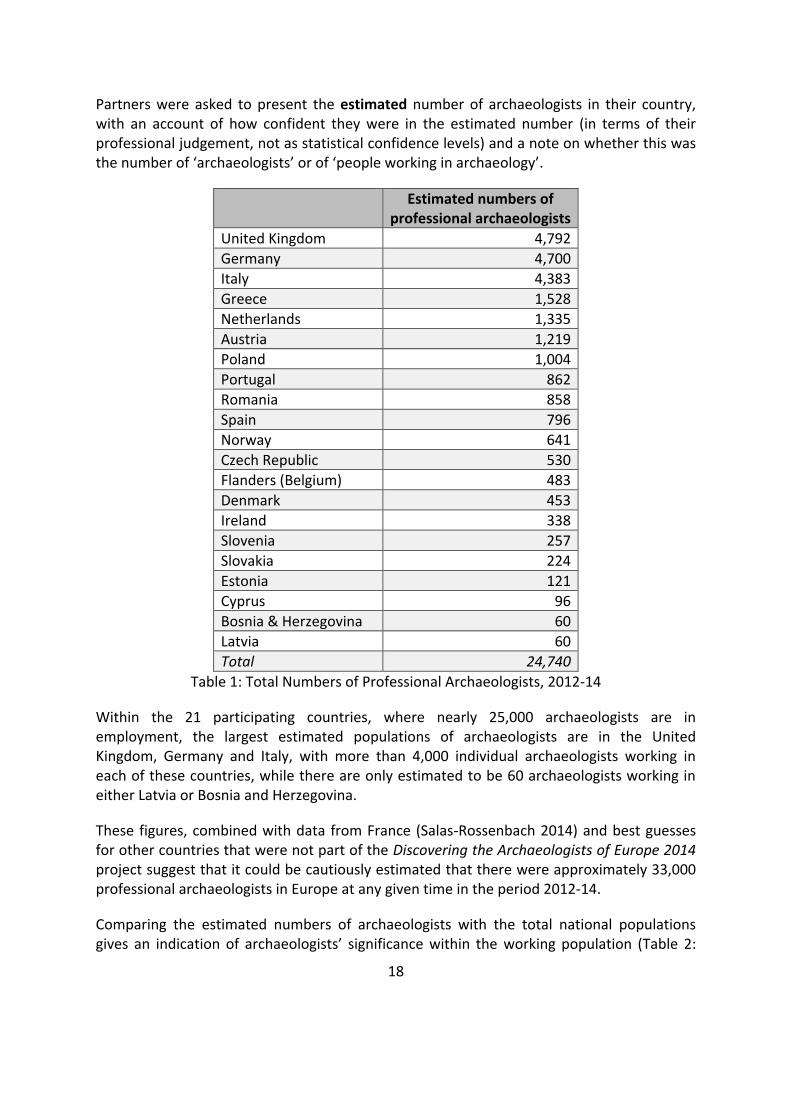
Partners were asked to present the estimated number of archaeologists in their country, with an account of how confident they were in the estimated number (in terms of their professional judgement, not as statistical confidence levels) and a note on whether this was the number of ‘archaeologists’ or of ‘people working in archaeology’.
Estimated numbers of professional archaeologists
United Kingdom 4,792
Germany 4,700
Italy 4,383
Greece 1,528
Netherlands 1,335
Austria 1,219
Poland 1,004
Portugal 862
Romania 858
Spain 796
Norway 641
Czech Republic 530
Flanders (Belgium) 483
Denmark 453
Ireland 338
Slovenia 257
Slovakia 224
Estonia 121
Cyprus 96
Bosnia & Herzegovina 60
Latvia 60
Total 24,740
Table 1: Total Numbers of Professional Archaeologists, 2012-14
Within the 21 participating countries, where nearly 25,000 archaeologists are in employment, the largest estimated populations of archaeologists are in the United Kingdom, Germany and Italy, with more than 4,000 individual archaeologists working in each of these countries, while there are only estimated to be 60 archaeologists working in either Latvia or Bosnia and Herzegovina.
These figures, combined with data from France (Salas-Rossenbach 2014) and best guesses for other countries that were not part of the Discovering the Archaeologists of Europe 2014 project suggest that it could be cautiously estimated that there were approximately 33,000 professional archaeologists in Europe at any given time in the period 2012-14.
Comparing the estimated numbers of archaeologists with the total national populations gives an indication of archaeologists’ significance within the working population (Table 2:

19
Estimated Archaeologists as Percentage of Population, below. Relatively, the highest ‘density’ of archaeologists within a national population is in Austria, but even in that country only one in every 6,750 people is an archaeologist.
Estimated Professional
Archaeologists
Total Population1
% of Total Population
United Kingdom 4,792 63,700,000 0.008%
Germany 4,700 81,000,000 0.006%
Italy 4,383 61,700,000 0.007%
Greece 1,528 10,800,000 0.014%
Netherlands 1,335 16,900,000 0.008%
Austria 1,219 8,200,000 0.015%
Poland 1,004 38,300,000 0.003%
Portugal 862 10,800,000 0.008%
Romania 858 21,700,000 0.004%
Spain 796 47,700,000 0.002%
Norway 641 5,100,000 0.013%
Czech Republic 530 10,600,000 0.005%
Flanders (Belgium) 483 6,400,0002 0.008%
Denmark 453 5,600,000 0.008%
Ireland 338 4,800,000 0.007%
Slovenia 257 2,000,000 0.013%
Slovakia 224 5,400,000 0.004%
Estonia 121 1,300,000 0.009%
Cyprus 96 1,200,000 0.008%
Bosnia & Herzegovina 60 3,900,000 0.002%
Latvia 60 2,200,000 0.003%
Total 24,740 409,300,000 0.006%
Table 2: Estimated Archaeologists as Percentage of Populations
An alternative approach used to obtain an indication of the importance of archaeologists within countries has been to compare the relative numbers of archaeologists with the Gross Domestic Product for each country gives an indication of whether more economically active countries need to have more archaeologists. Table 3: Total Estimated Numbers of Archaeologists and Gross Domestic Product, below, shows that there is a level of correlation – more archaeologists work in richer countries – but it is not an absolute equation, as other factors will also influence this (eg Greece, the 11th richest country by GDP of the 21 examined, but with the 4th largest estimated population of professional archaeologists.
1 Population data from CIA World Factbook, https://www.cia.gov/library/publications/the-world-factbook/ 2 Flanders population calculated from in Belgium CIA World Factbook population; http://statbel.fgov.be/nl/modules/publications/statistiques/bevolking/bevolking_-_cijfers_bevolking_2010_-_2012.jsp states Flanders is 6.4m, 57.5% of Belgian population

20
Estimated professional
archaeologists
Gross Domestic Product ($US)3
Estimated archaeologists
population rank / GDP rank
United Kingdom 4,792 $2.49 tri l l ion 1 / 2
Germany 4,700 $3.59 tri l l ion 2 / 1
Italy 4,383 $2.07 tri l l ion 3 / 3
Greece 1,528 $243.3 bi l l ion 4 / 11
Netherlands 1,335 $722.3 bi l l ion 5 / 5
Austria 1,219 $417.9 bi l l ion 6 / 8
Poland 1,004 $513.9 bi l l ion 7 / 7
Portugal 862 $219.3 bi l l ion 8 / 13
Romania 858 $188.9 bi l l ion 9 / 15
Spain 796 $1.356 tri l l ion 10 / 4
Norway 641 $515.8 bi l l ion 11 / 6
Czech Republic 530 $194.8 bi l l ion 12 / 14
Flanders (Belgium) 483 $291.7 bi l l ion4 13 / 10
Denmark 453 $324.3 bi l l ion 14 / 9
Ireland 338 $220.9 bi l l ion 15 / 12
Slovenia 257 $46.82 bi l l ion 16 / 17
Slovakia 224 $96.96 bi l l ion 17 / 16
Estonia 121 $24.28 bi l l ion 18 / 19
Cyprus 96 $21.78 bi l l ion 19 / 20
Latvia 60 $30.38 bi l l ion =20 / 18
Bosnia & Herzegovina 60 $18.87 bi l l ion =20 / 21
Total 24,740
Table 3: Total Estimated Numbers of Archaeologists and Gross Domestic Product
Total Numbers of Archaeologists – Change over Time
Previous estimated figures for the total numbers of working archaeologists are available for 13 countries (Table 4: Total Estimated Numbers of Archaeologists - change over time), although in 2006-08, data were collected for the whole of Belgium, rather than for Flanders alone as in 2012-14, and the Bosnia & Herzegovinian and Spanish data were collected in 2009. The major difference in the German figures is considered to relate more to changes of
3 GDP data Official Exchange Rates, 2013 (est) from CIA World Factbook https://www.cia.gov/library/publications/the-world-factbook/ 4 Flanders GDP is CIA Belgium figure; recalculated at 57.5% of CIA figure

21
methodology than an actual change at this scale in the total numbers of individual professional archaeologists.
Across the thirteen countries for which comparable data exist, the total number of archaeologists in work has fallen by 11%, with major falls in Ireland, Spain and the United Kingdom, all of which can be directly attributed to the effects of the economic changes of the previous five or six years.
2006-08 2012-14 change
Austria 743 1,219 +476 +64%
Flanders (Belgium) 765 483 -282 -37%
Bosnia & Herzegovina5 30 60 +30 +100%
Cyprus 52 96 +44 +85%
Czech Republic 425 530 +105 +25%
Germany 2,500 4,700 +2,200 +88%
Greece 1,856 1,528 -328 -18%
Spain6 2,358 796 -1,562 -66%
Ireland 1,709 338 -1,371 -80%
Netherlands 761 1,335 +574 +75%
Slovenia 175 257 +82 +47%
Slovakia 186 224 +38 +20%
United Kingdom 6,865 4,792 -2,073 -30%
Total 18,425 16,358 -2,067 -11%
Table 4: Total Estimated Numbers of Archaeologists - change over time
5 Bosnia & Herzegovina 2009 figure (Lawler 2010, 8) 6 Spain 2009 figure (Parga-Dans & Varela-Pousa 2014, 8)

22
Past Numbers of Archaeologists
Partners sought data that answered whether “Were more or fewer people employed in archaeology one year ago, three years ago and five years ago?”
Most partners gathered these data by asking employers whether more or fewer people had been employed by them at these points in the past. The figures presented in Table 5: Past Sizes of Organisations, below are calculated from the number of organisations in each country reporting that they had more employees five, three or one year previously minus the number that had less employees, as a percentage of all responses received. Positive figures equate to growth over time, so a figure of 100% would mean that 100% of organisations in that country had grown since the period that the data refer to.
5 years before 3 years before 1 year before
Austria 16% 16% 21%
Bosnia & Herzegovina no data
Flanders (Belgium) -31% -23% 21%
Cyprus 6% -22% -67%
Czech Republic 15% 6% 0%
Germany 18% 10% 11%
Denmark -20% -20% -60%
Estonia no data
Greece -25% -25% 0%
Spain -63% -61% -40%
Ireland 18% 6% 0%
Italy no data
Latvia
Netherlands 18% no data -1%
Norway 56% 44% 24%
Poland no data
Portugal
Romania -19% -24% 0%
Slovenia 11% 14% 0%
Slovakia -6% -6% -8%
United Kingdom -23% -6% -3%
Total -13% -14% -9%
n= 746 680 777
Table 5: Past Sizes of Organisations
Across Europe, organisations have become smaller; the aggregate figures show that organisations were typically smaller when they were polled than they had been one, three or five years before.

23
The figures from Spain are the most negative, although Denmark has also reported significant proportions of organisations becoming smaller over this period. By contrast, the figures from Norway show that archaeological organisations have grown over that period.
It is also noticeable that in Ireland, where there has been a serious reduction in the total population of individual archaeologists (see Table 4: Total Estimated Numbers of Archaeologists - change over time), and where many businesses were forced to cease trading, those that are still operating tend to report that they are now seeing growth over the previous few years.
Past Numbers of Archaeologists – Change Over Time
In almost all participating states, archaeology had recently expanded in 2006-08, with exceptions being Austria and Germany, and to a lesser extent Slovenia, where significant growth had been seen over five years although this had slowed in the year prior to the study, and in Greece.
As shown in Table 6: Past Numbers of Archaeologists - change over time, below, the changed economic situation is very clear as the retrospective picture is much more negative (figures below zero mean that a net number of organisations have become smaller over the time period being examined) from the viewpoint of 2012-14 than it was in 2006-08.
2006-08 2012-14
5 years before
3 years before
1 year before
5 years before
3 years before
1 year before
Austria -18% -22% -14% 16% 16% 21%
Flanders (Belgium) +24% +16% +5% -31% -23% 21%
Cyprus +23% +29% +29% 6% -22% -67%
Czech Republic +30% +23% +6% 15% 6% 0%
Germany +8% 0% -2% 18% 10% 11%
Greece +11% +2% -10% -25% -25% 0%
Ireland +39% +32% +21% 18% 6% 0%
Netherlands +61% +54% +36% 18% no data -1%
Slovenia +45% +4% -4% 11% 14% 0%
Slovakia +20% +11% +2% -6% -6% -8%
United Kingdom +18% +17% +10% -23% -6% -3%
Table 6: Past Numbers of Archaeologists - change over time

24
Future Numbers of Archaeologists
Employers’ future outlooks were examined by asking “Is it expected that more or fewer people will be employed in archaeology next year and in three years’ time?”
The figures presented in Table 7: Future Sizes of Organisations, below are calculated from the number of organisations in each country reporting whether they anticipate having more employees one or three years in the future, minus the number that expect less employees, as a percentage of all responses received. Positive figures equate to growth over time, so a figure of 100% would mean that 100% of organisations in that country expect to grow over the period that the data refer to.
1 year in the future
3 years in the future
Austria -11% 11%
Bosnia & Herzegovina 40% 75%
Flanders (Belgium) 0% 23%
Cyprus -33% -6%
Czech Republic 14% 10%
Germany -19% -27%
Denmark 20% 20%
Estonia no data
Greece -8% -17%
Spain -18% 9%
Ireland 13% 13%
Italy no data
Latvia no data
Netherlands -4% 1%
Norway 21% 6%
Poland no data
Portugal no data
Romania 0% 8%
Slovenia -14% 2%
Slovakia 17% 15%
United Kingdom 4% 9%
Total -2% 7%
n= 750 741
Table 7: Future Sizes of Organisations
Overall, slightly more (net 2%) employing organisations expect to become smaller in the year after they were surveyed than expect to grow, although organisations are more optimistic for three years in the future. The responses from Bosnia & Herzegovina are

25
particularly positive, although this was a small sample, while the responses from Germany are the least optimistic.
Future Numbers of Archaeologists – Change Over Time
Opinions formed in 2007-08 (the typical dates of returns to the predecessor project) were formed by the ongoing positive nature of the global and European economies; the economic transformation that would begin in 2008 had not yet begun to affect respondents.
Employers had much less positive expectations for future growth in 2012-14 than they held in 2006-08, reflecting the change in sentiment from what was still an ongoing period of growth and expansion for the sector, before the global economic transformation of 2008 and subsequent economic crises. The more circumspect expectations reported in 2012-14 will have been shaped by the experience of the economic changes that took place in the previous six years (and that continue to take place in some countries).
2006-08 2012-14
1 year in the future
3 years in the future
1 year in the future
3 years in the future
Austria +4% -3% -11% +11%
Flanders (Belgium) +3% +12% 0% +23%
Cyprus +33% +33% -33% -6%
Czech Republic +11% +21% 14% 10%
Germany -2% -12% -19% -27%
Greece +2% +39% -8% -17%
Ireland +26% +42% +13% +13%
Netherlands +27% +38% -4% +1%
Slovenia +13% +32% -14% +2%
Slovakia +9% +3% +17% +15%
United Kingdom +14% +26% 4% 9%
Table 8: Future Sizes of Organisations – change over time

26
Archaeologists’ Ages and Genders
Partners collected data on the age and gender of individuals working in archaeology, identifying ages in ten-year bands, <20 years old, 20–29, 30–39 etc, then ‘60 and over’. These are actual, reported rather than estimated figures.
<20 20-29 30-39 40-49 50-59 >=60
f m f m f m f m f m f m
Austria 0 0 30 20 34 37 48 58 25 41 5 10
Bosnia & Herzegovina 0 0 47 55 76 96 22 44 17 59 2 6
Flanders (Belgium) 0 0 1 5 6 0 2 2 2 0 0 2
Cyprus 0 0 17 4 28 13 8 8 9 3 4 2
Czech Republic 0 0 62 58 83 151 58 69 53 61 38 39
Germany 2 1 59 42 68 74 81 110 64 113 13 34
Denmark 0 0 0 0 9 9 13 5 8 9 2 4
Estonia 0 0 22 9 12 11 8 3 0 4 0 2
Greece 0 0 24 12 190 46 178 58 45 17 4 4
Spain 3 7 51 36 151 248 75 83 15 17 1 1
Ireland 0 2 9 2 35 38 15 24 10 7 4 3
Italy 0 0 114 42 273 96 58 41 33 17 14 7
Latvia 0 0 6 1 2 2 1 5 3 3 2 4
Netherlands 0 0 37 22 94 44 26 22 7 8 7 6
Norway 0 0 21 14 76 107 67 78 35 86 33 85
Poland 0 0 26 12 43 21 22 5 5 4 0 1
Portugal 0 0 11 10 19 39 10 21 4 5 0 4
Romania 0 0 4 2 16 7 12 7 5 5 1 1
Slovenia 0 0 21 9 36 65 9 17 14 17 6 23
Slovakia 0 1 27 23 93 83 52 88 49 91 15 38
UK 0 0 74 20 149 130 97 155 61 109 19 35
Total 5 11 589 378 1344 1187 765 748 403 567 151 276
Table 9: Archaeologists’ Ages and Genders
As Figure 1: Archaeologists’ Age Distributions (below) shows, when examined by 10-year age bands, the largest group of archaeologists are those aged in their 30s, followed by those aged in their 40s. There are almost exactly the same numbers of working archaeologists aged in their 20s as in their 50s.

27
Figure 1: Archaeologists’ Age Distributions
On average, professional archaeologists in Europe at the time of the survey were aged 40.3 years; female archaeologists were 38.9 years old (on average), and male archaeologists 41.8.
A slight majority of archaeologists, across the whole set of 21 survey populations, were women. 50.7% of European professional archaeologists are women and 49.3% men. Distributions vary by country (Figure 2: Archaeologists’ Genders, below) – the highest proportions of women were in Greece – 76.3%, Italy - 70.8%, Portugal – 69.1% and Cyprus – 68.8%, while the countries with the highest proportions of men in the archaeological workforce were Romania – 64.2%, Poland – 61.5%, Bosnia & Herzegovina – 61.3% and Slovakia – 60.4%.

28
Figure 2: Archaeologists’ Genders

29
Archaeologists’ Ages and Genders – Change Over Time
The 2006-08 data presented results in terms of age separately from gender.
2006-08 2012-14
<20 89 1.1% 16 0.3%
20-29 2,053 24.8% 967 15.1%
30-39 2,522 30.4% 2,531 39.4%
40-49 1,899 22.9% 1,513 23.5%
50-59 1,285 15.5% 970 15.1%
>=60 442 5.3% 427 6.7%
n= 8,290 6,424
Table 10: Archaeologists’ Ages – changes over time
Figure 3: Archaeologists’ Ages – changes over time
The average age of all working archaeologists in Europe in 2012-14 was 40.3 years; six years earlier, the equivalent figure was 38.7 years. So the archaeological population as a whole has aged, with decreases in the proportion of the population aged under 30, a marked increase in the population aged in their 30s, and an increase in the proportion aged 40-49. The relative proportion aged in their 50s has fallen slightly, and those aged in their 60s has risen slightly, but the biggest transformation has been in which two age bands are the largest; in 2006-08, it was archaeologists aged in their 20s and 30s – in 2012-14, it is those aged in their 30s and 40s.

30
In light of the loss of significant numbers of posts over this period, these data can be interpreted to suggest that less young people have entered the profession, and those individuals that were working in it six years earlier are likely to still be there – so the profession as a whole has aged, as the individual archaeologists have aged in their jobs. As well as a reduction in the number of posts, there has been a reduction of ‘churn’ – of new people coming in as more senior people leave.
2006-08 2012-14 Female 4,183 45.9% 3,257 50.7%
Male 4,926 54.1% 3,167 49.3%
n= 9,109 6,424
Table 11: Archaeologists’ Genders – change over time
In 2006-08, the majority of archaeologists were men, and this was the case in most of the participating countries. In 2012-14, there was a small majority of female archaeologists. Women now make up the majority of the archaeological working population in most of the countries surveyed, and, by age profile, this is a trend that is likely to continue, as much larger majorities of archaeologists aged in their 20s and 30s are women.

31
The Disability Statuses of Archaeologists
Data were obtained for the actual number of disabled individuals reported to the survey, the total number of people for whom this information was provided, and the total number of people covered by each national survey - eg ‘the survey gave information about 1000 archaeologists, but the disability question was only answered for 800 archaeologists, of whom 20 were disabled’.
Partners were also asked to provide any relevant information about employment of disabled people in their country, or the way that disability is defined in their country. Data were not available in all countries.
Disabled Able Disabled % Able %
Austria 3 737 0.4% 99.6%
Bosnia & Herzegovina 0 24 0.0% 100.0%
Flanders (Belgium) No data available
Cyprus 1 95 1.0% 99.0%
Czech Republic7 1 372 0.3% 99.7%
Germany No data available
Denmark 0 61 0.0% 100.0%
Estonia No data available
Greece 0 274 0.0% 100.0%
Spain 3 704 0.4% 99.6%
Ireland 3 127 2.3% 97.7%
Italy 7 688 1.0% 99.0%
Latvia 0 29 0.0% 100.0%
Norway 1 124 0.8% 99.2%
Poland 3 907 0.3% 99.7%
Portugal No data available
Romania 3 121 2.4% 97.6%
Slovenia 0 60 0.0% 100.0%
Slovakia 1 223 0.4% 99.6%
Netherlands 26 493 5.0% 95.0%
United Kingdom 14 785 1.8% 98.2%
Total 66 5,824 1.1% 98.9%
Table 12: Disability Statuses of Archaeologists
Across Europe, very few archaeologists are disabled; in total, data were gathered for 5,890 individuals, of whom 1.1% were disabled. Different countries use different criteria for identifying whether a worked is disabled, which may have contributed to the range of responses (5.0% of Dutch archaeologists were considered to be disabled, but no Danish, Greek, Latvian or Slovenian archaeologists were). Overall, this suggests that disabled people may be excluded from working in the archaeological sector in many countries.
7 Czech Republic data for people with “altered working abilities”

32
The Disability Statuses of Archaeologists – Change Over Time
2012-14 2006-08
Disabled Able Disabled % Disabled Able Disabled %
Austria 3 737 0.4% 3 479 0.6%
Cyprus 1 95 1.0% 2 475 0.4%
Czech Republic 1 372 0.3% 11 663 1.7%
Greece 0 274 0.0% 5 735 0.7%
Ireland 3 127 2.3% 3 796 0.3%
Netherlands 26 493 5.0% 0 499 0.0%
Slovenia 0 60 0.0% 5 292 1.7%
Slovakia 1 223 0.4% 0 126 0.0%
United Kingdom 14 785 1.8% 38 2,635 1.6%
Total 66 5,824 1.1% 122 7,946 1.5%
Table 13: Disability Status of Archaeologists – change over time
Over the six years between the two Discovering the Archaeologists of Europe projects, the relative proportions of disabled members of the archaeological workforce has decreased further from an extremely low base (1.5% in 2006-08 to 1.1% in 2012-14). Overall it can be seen that disabled people are still under-represented in the archaeological workforce.

33
Archaeologists’ Countries of Origin
As shown in Table 14: Countries of Origin, below, movement between countries is relatively low in professional archaeology; across all 21 participating countries, 93.6% of archaeologists are nationals of the country that they are working in, and in only three countries are more than 10% of professional archaeologists not from that country. Of those three, there are relatively high numbers of Germans working in Austria and of Greeks working in Cyprus. The very high number of individuals identified as being non-national in Bosnia & Herzegovina can be largely explained by the questionnaire asking about individuals’ to self-identify their country of birth – and as most (if not all) respondents were born before the foundation of Bosnia & Herzegovina as an independent country, this has affected the results considerably.
National EU non-EU Europe / other
Austria 285 74.8% 89 23.4% 7 1.8%
Bosnia & Herzegovina 12 42.9% 5 17.9% 11 39.3%
Flanders 292 92.7% 19 6.0% 4 1.3%
Cyprus 74 77.1% 21 21.9% 1 1.0%
Czech Republic 361 96.8% 8 2.1% 4 1.1%
Germany 771 90.4% 77 9.0% 5 0.6%
Denmark 56 94.9% 3 5.1% 0 0.0%
Estonia 69 95.8% 0 0.0% 3 4.2%
Greece 241 99.6% 1 0.4% 0 0.0%
Spain 679 96.4% 9 1.3% 16 2.3%
Ireland 121 83.4% 22 15.2% 2 1.4%
Latvia 689 99.1% 4 0.6% 2 0.3%
Italy 29 100.0% 0 0.0% 0 0.0%
Netherlands 479 92.3% 33 6.4% 7 1.3%
Norway 255 90.7% 21 7.5% 5 1.8%
Poland 904 99.2% 4 0.4% 3 0.3%
Portugal 545 95.3% 17 3.0% 10 1.7%
Romania 114 93.4% 8 6.6% 0 0.0%
Slovenia 57 95.0% 3 5.0% 0 0.0%
Slovakia 292 99.3% 2 0.7% 0 0.0%
UK 803 92.5% 30 3.5% 35 4.0%
Total 7,128 93.6% 376 4.9% 115 1.5%
Table 14: Countries of Origin
Article 45 of the Consolidated Version of the Treaty on the Functioning of the European Union (European Union, 2012) establishes the rights of individual workers to freely move and work within the member states of the European Union. Two of the participating countries in Discovering the Archaeologists of Europe 2014 are outside the EU (Norway and Bosnia & Herzegovina), but in theory there should be no legal barriers preventing individuals that are citizens of member states from moving transnationally within the Union.

34
Archaeology is not a “Regulated Profession” in most European states, being listed on the European Commission’s Regulated Professions Database8 as being regulated in only the Czech Republic, Greece, Ireland, Poland and Slovakia, where there might be legal barriers to practice (although these would have to be based on professional qualifications and/or language skills rather than nationality).
Archaeologists’ Countries of Origin – Change Over Time
Over the six years since the previous project, the proportion of archaeologists who are not working in their own national country has fallen – transnational mobility has decreased.
In 2006-08, 8% of archaeologists were either nationals of other EU states or of other countries; this had fallen to 6% by 2012-14 (Table 15: Countries of Origin – change over time).
2006-08 2012-14
national EU other national EU other
Austria 433 90% 37 8% 9 2% 285 75% 89 23% 7 2%
Flanders (Belgium) 121 98% 3 2% 0 0% 292 93% 19 6% 4 1%
Cyprus 41 79% 9 15% 2 4% 74 77% 21 22% 1 1%
Czech Republic 306 98% 7 2% 0 0% 361 97% 8 2% 4 1%
Germany 1773 95% 56 3% 29 2% 771 90% 77 9.% 5 1%
Greece 1560 99% 8 1% 2 <1% 241 97% 1 <1% 0 0%
Ireland 269 55% 202 42% 14 3% 121 83% 22 15% 2 1%
Netherlands 476 95% 16 3% 7 1% 479 93% 33 6% 7 1%
Slovenia 120 95% 6 5% 0 0% 57 95% 3 5% 0 0%
Slovakia 171 98% 2 1% 1 1% 292 99% 2 1% 0 0%
UK 2342 93% 130 5% 49 2% 803 93% 30 3% 35 4%
Total 8085 92% 501 6% 123 1% 7128 94% 376 5% 115 2%
Table 15: Countries of Origin – change over time
The countries that had previously had the highest proportions of non-national workers (Ireland – 45% and Cyprus – 21%) still had relatively high proportions of archaeologists from other countries working there (Ireland – 17%, Cyprus – 23%), but the country with the highest proportion of archaeologists from other countries was now Austria (25%). The Austrian figure can be largely explained by the cultural and linguistic ease of movement from neighbouring Germany (and adjacent German-speaking South Tyrol, in Italy). The remarkable decline of the Irish figure is strongly linked to the economic changes; where previously, there had been so many well-paid fieldwork jobs that people had actively moved there to take them up, those jobs had largely disappeared, and with that much of the mobile workforce.
8 http://ec.europa.eu/internal_market/qualifications/regprof/

35
The three countries with the lowest levels of inward mobility in 2006-08 (Greece – 1%, Slovakia – 2%, Czech Republic – 2%) continued to be in that position in 2012-14, with some slight variations in the overall percentages. Notably, in 2006-08 Belgium also only reported 2% non-national workers; in 2012-14, 7% of archaeologists in Flanders were from not Belgian.

36
Qualifications
Partners identified the highest qualification obtained by individuals, to include post-doctoral level Habilitation or equivalent, identifying whether this qualification was obtained a) in the partner country, b) in another European country, or c) elsewhere.
Overall, archaeology has a very highly qualified workforce, with 94% of archaeologists being graduates.
School U/g Degree Masters PhD Post-Doc
Austria 7.0% 3.0% 32.7% 37.6% 19.7%
Bosnia & Herzegovina 6.9% 27.6% 55.2% 6.9% 3.4%
Flanders 17.4% 7.0% 61.4% 14.2% 0.0%
Cyprus 0.0% 16.8% 43.2% 32.6% 7.4%
Czech Republic 2.9% 3.4% 62.6% 22.6% 8.6%
Germany 27.2% 11.8% 36.4% 22.1% 2.5%
Denmark 0.0% 0.0% 63.2% 36.8% 0.0%
Estonia 12.3% 30.1% 41.1% 16.4% 0.0%
Greece 0.0% 49.0% 30.4% 20.5% 0.1%
Spain9 17.3% 66.0% 0.0% 16.6% 0.0%
Ireland 1.4% 38.9% 43.1% 9.7% 6.9%
Latvia 0.0% 3.4% 58.6% 37.9% 0.0%
Italy 0.0% 6.4% 71.3% 16.0% 6.4%
Netherlands 3.3% 12.6% 73.2% 10.9% 0.0%
Norway 0.0% 6.6% 85.1% 8.3% 0.0%
Poland 0.1% 0.2% 53.6% 28.4% 17.6%
Portugal 0.0% 47.1% 40.6% 12.3% 0.0%
Romania 0.0% 2.4% 36.3% 60.5% 0.8%
Slovenia 10.0% 45.0% 20.0% 25.0% 0.0%
Slovakia 0.0% 0.5% 58.6% 32.3% 8.6%
UK 5.8% 48.6% 26.5% 18.6% 0.5%
Total 6.0% 25.0% 43.2% 20.9% 4.9%
Table 16: Highest Qualifications Held
9 Spain data for "university qualification" - no distinction between undergraduate and masters degrees

37
Figure 4: Highest Qualifications Held
Data were also sought on where highest qualifications were obtained (as an alternative indicator of mobility, and to identify where training was being sought outside the countries involved, and so to potentially stimulate VET providers in those countries. Not all partners were able to provide these data.
national EU other
Austria 401 86.6% 61 13.2% 1 0.2% 463
Bosnia & Herzegovina 10 38.5% 9 34.6% 7 26.9% 26
Cyprus 18 18.8% 74 77.1% 4 4.2% 96
Czech Republic 367 98.4% 5 1.3% 1 0.3% 373
Germany 221 96.9% 5 2.2% 2 0.9% 228
Denmark 54.5 92.4% 4.5 7.6% 0 0.0% 59
Ireland 105 73.9% 28 19.7% 9 6.3% 142
Latvia 27 93.1% 2 6.9% 0 0.0% 29
Poland 724 98.8% 8 1.1% 1 0.1% 733
Romania 110 93.2% 5 4.2% 3 2.5% 118
total 2037.5 89.9% 201.5 8.9% 28 1.2% 2267
Table 17: Where Highest Qualifications Obtained
In total, 90% of archaeologists gained their highest qualifications in their home country, 9% elsewhere in the EU and 1% in another country. The only countries where a minority of practitioners had qualified in that country were Bosnia & Herzegovina and Cyprus; in both of these countries, the establishment (or re-establishment) of higher education has happened relatively recently, and so some archaeologists would not have had the opportunity to complete their education in their own country at that time.

38
Overall, a higher proportion of archaeologists gained their highest qualification outside their own country than are working in other countries, suggesting educational mobility is more common in this sector than mobility of labour.
Qualifications – Change Over Time
By comparing the data reported in the predecessor report (Aitchison 2009) with the data captured in this project, the relative percentages of individual archaeologists who have attained particular levels of qualifications can be calculated for the eleven countries where both datasets exist (and comparing the total figures presented in the two reports).
School U/g Degree Masters PhD Post-Doc
Austria -41% 2% 10% 16% 14%
Flanders (Belgium) 17% 7% -26% 1% 0%
Cyprus 0% 9% -1% -15% 7%
Czech Republic 1% -1% -7% 7% 1%
Germany -18% 7% 11% 2% -3%
Greece 0% -4% 1% 4% -1%
Ireland -19% 0% 6% 7% 6%
Netherlands -3% 12% 23% -32% 0%
Slovenia -2% -9% 6% 7% -2%
Slovakia 0% -1% -3% 10% -6%
United Kingdom 2% -6% -3% 8% -1%
Total -7% -7% 6% 5% 3%
Table 18: Qualifications – change over time
In total, it can be seen that archaeologists have typically become more highly qualified over the six years since the predecessor project. More archaeologists are graduates, and there is an overall increase in the percentage that hold post-graduate qualifications as their highest levels of achievement. This change is most marked in Austria (where previously a high percentage of archaeologists were not graduates) and in Ireland, while in only Flanders (comparing with all of Belgium in 2006-08) and Cyprus are there relatively less postgraduates.

39
Salaries
Data on gross (tax included) annual salaries were collected for full-time archaeologists.
The range of average salaries, when ranked by countries, is remarkable – on average, an archaeologist in Denmark earns more than nine times as much as an archaeologist working in Bosnia & Herzegovina does. Overall, the average salary earned by an archaeologist across the 21 countries is €24,901; this figure is higher than the average earned in 12 of the participating countries.
Overall, average archaeological salaries are highest in the participating Scandinavian countries and in north-western Europe (plus Cyprus); they are lowest in central, south-eastern and Baltic countries.
Average archaeological salary
National average (all occupations)
Archaeological as % of national avg. salary
Denmark € 56,916.00 € 51,029.30 111.5%
Norway € 53,478.31 € 59,369.77 90.1%
Cyprus € 39,593.00 € 29,796.00 132.9%
Netherlands € 38,941.00 € 35,800.00 108.8%
Ireland € 36,450.00 € 35,970.00 101.3%
UK € 34,182.57 € 40,187.32 85.1%
Flanders (Belgium) £ 30,804.00 € 37,596.00 81.9%
Germany € 30,669.60 € 35,233.00 87.0%
Austria € 27,092.00 € 24,843.00 109.1%
average of all € 24,901.30
Greece € 22,389.96 £ 19,807.00 113.0%
Slovenia £ 19,284.96 € 18,313.32 105.3%
Spain € 15,483.33 € 22,726.00 68.1%
Portugal € 12,500.00 € 15,900.00 78.6%
Estonia € 11,065.00 € 11,376.00 97.3%
Czech Republic € 10,819.26 € 12,045.38 89.8%
Italy € 10,687.00 € 18,000.00 59.4%
Slovakia € 9,262.00 € 11,196.00 82.7%
Romania € 7,012.44 € 6,196.80 113.2%
Poland € 6,972.00 € 10,770.00 64.7%
Latvia € 6,402.92 € 8,580.00 74.6%
Bosnia & Herzegovina € 6,289.00 € 5,074.00 123.9%
Table 19: Average Salaries in Archaeology and National Averages for all Occupations10
In general, the geographical distribution of salary averages matches reasonably closely to national average salary figures for all occupations; the highest paid archaeologists (in Denmark and Norway) are working in the two participating countries with the highest
10 Ordered by average archaeological salary

40
national average salaries for all occupations, and the lowest-paid archaeologists (in Bosnia & Herzegovina) are working in the country with the lowest overall average salary figure.
As shown in Table 19 and
Figure 5, archaeologists are typically paid less than national averages for all occupations; in only nine countries are archaeologists more generously rewarded than the national average. The most striking outliers are in Cyprus, where archaeologists are paid considerably more than the national average, and in Italy, Poland and Spain where they are paid considerably less. Notably, in Bosnia and Herzegovina where archaeologists are more poorly paid than in any other country (in absolute terms), in comparison with the national average, they are more highly paid than in any country except Cyprus.
€ -
€ 10,000.00
€ 20,000.00
€ 30,000.00
€ 40,000.00
€ 50,000.00
€ 60,000.00
€ 70,000.00
IT PL ES LV PT BE SK UK DE CZ NO EE IE SI NL AT DK EL RO BA CY
archaeological
national

41
Figure 5: Comparison of Average Archaeological Salaries with National Averages
Salaries should be considered in terms of the nature of archaeological practice and the number of jobs in each participating country – in countries where there is a significant private sector element, there are many jobs (eg United Kingdom, Italy, Spain), but salaries are typically below the national norm (although this is not the case in the Netherlands or Ireland). The reverse is also true – in countries where the state plays a very significant role, with Cyprus as the clear example – there are few jobs, but they are very well rewarded.
The total amounts spent in each participating country on salaries can be easily calculated, by multiplying the average salary in each by the estimated total number of archaeologists working there. Using a tested rule-of-thumb that considers salary expenditure to typically represent 60% of the costs of running an archaeological organisation (Hinton & Jennings 2007) – therefore the total costs can be calculated as salaries multiplied by 1.67, these figures can then be used to calculate the total cost of operating these organisations – thus the total amount spent (by whoever the funders of archaeological practice might be) on archaeology in each participating country is presented in Table 20 – with the total figure of spent on archaeology in the 21 Discovering the Archaeologists of Europe 2014 countries being estimated at slightly more than one billion Euro per annum.
Estimated individuals
Avg. salary Aggregate salary cost
Expenditure (= salaries*1.67)
United Kingdom 4,792 € 34,183 € 163,802,875 € 273,004,792
Germany 4,700 € 30,670 € 144,147,120 € 240,245,200
Netherlands 1,335 € 38,941 € 51,986,235 € 86,643,725
Italy 4,383 € 10,687 € 46,841,121 € 78,068,535
Norway 641 € 53,478 € 34,279,597 € 57,132,661
€ -
€ 10,000.00
€ 20,000.00
€ 30,000.00
€ 40,000.00
€ 50,000.00
€ 60,000.00
€ 70,000.00
IT PL ES LV PT BE SK UK DE CZ NO EE IE SI NL AT DK EL RO BA CY
archaeological
national

42
Greece 1,528 € 22,390 € 34,211,859 € 57,019,765
Austria 1,219 € 27,092 € 33,025,148 € 55,041,913
Denmark 453 € 56,916 € 25,782,948 € 42,971,580
Flanders (Belgium) 483 € 30,804 € 14,878,332 € 24,797,220
Spain 796 € 15,483 € 12,324,731 € 20,541,218
Ireland 338 € 36,450 € 12,320,100 € 20,533,500
Portugal 862 € 12,500 € 10,775,000 € 17,958,333
Poland 1,004 € 6,972 € 6,999,888 € 11,666,480
Romania 858 € 7,012 € 6,016,674 € 10,027,789
Czech Republic 530 € 10,819 € 5,734,208 € 9,557,013
Slovenia 257 € 19,285 € 4,956,235 € 8,260,391
Cyprus 96 € 39,593 € 3,800,928 € 6,334,880
Slovakia 224 € 9,262 € 2,074,688 € 3,457,813
Estonia 121 € 11,065 € 1,338,865 € 2,231,442
Latvia 60 € 6,403 € 384,175 € 640,292
Bosnia & Herzegovina 60 € 6,289 € 377,340 € 628,900
total 24,740 € 616,058,066 € 1,026,763,443
Table 20: Aggregate Salaries and Total Expenditure
Salaries – Change Over Time
In absolute terms, archaeological salaries in Europe across all sample countries (21 in 2012-14, 11 in 2006-08) have fallen; this is primarily explained by archaeologists in the majority of the countries that were newly surveyed in 2012-14 that had not been part of the 2006-08 project (eight of the ten ‘new’ countries - Bosnia & Herzegovina, Latvia, Estonia, Romania, Spain, Portugal, Italy, Poland) being relatively poorly paid in comparison with their peers in other states.

43
Country Avg salary for archaeologists (2006-08)
Avg salary for archaeologists (2012-14)
change Avg archaeological salary % of national avg (2006-08)
Avg archaeological salary % of national avg (2012-14)
change
Austria € 31,518 € 27,092 -14% 122% 109% -13%
Flanders (Belgium)
€ 28,819 £ 30,804 7% 104% 82% -22%
Cyprus € 40,656 € 39,593 -3% 175% 130% -45%
Czech Republic
€ 10,145 € 10,819 7% 108% 90% -18%
Germany € 31,071 € 30,670 -1% 108% 87% -21%
Greece € 28,925 € 22,390 -23% 108% 113% +5%
Ireland € 37,680 € 36,450 -3% 97% 101% +4%
Slovakia € 6,030 € 9,262 54% 83% 83% 0%
Slovenia € 16,827 £ 19,285 15% 111% 105% -6%
United Kingdom
€ 34,392 € 34,183 -1% 78% 85% +7%
Avg. of all participating states
€ 31,134 € 24,901 -20%
Table 21: Salaries - change over time
In the countries where comparable data exist, salaries have typically fallen, although they have risen very notably in Slovakia and also in Slovenia, the Czech Republic and in Flanders.
In only three of the countries where comparable data are available have average archaeological salaries risen when compared with national averages for all workers (UK, Ireland and Greece); in Slovakia they have risen at the same rate, but in the other six countries (Austria, Flanders, Cyprus, Czech Republic, Germany and Slovenia), archaeologists are relatively poorer within their own countries than they were in 2006-08.

44
Contracts
Information was gathered about the kinds of contracts held by employed archaeologists; this particularly related to whether people are on short-term, temporary (time-limited) contracts or on permanent contracts.
This caused confusion for some partners between the issue of the length of contract and the nature of the number of contracted hours (part-time or full-time).
Permanent Limited Permanent% Limited%
Austria 60 84 41.7% 58.3%
Bosnia & Herzegovina 18 6 75.0% 25.0%
Flanders (Belgium) 193 89 68.4% 31.6%
Cyprus 69 25 73.4% 26.6%
Czech Republic 124 190 39.5% 60.5%
Germany 535 240 69.0% 31.0%
Denmark 47 10 82.5% 17.5%
Estonia 57 15 79.0% 21.0%
Greece 877 412 68.0% 32.0%
Spain 252 267 48.6% 51.4%
Ireland 65 41 61.3% 38.7%
Italy11 101 346 22.6% 77.4%
Latvia 25 2 92.6% 7.4%
Netherlands 326 71 82.1% 17.9%
Norway 274 847 24.4% 75.6%
Poland 873 19 97.9% 2.1%
Portugal 161 46 77.8% 22.2%
Romania 89 32 73.6% 26.4%
Slovenia 50 74 40.0% 60.0%
Slovakia 167 21 88.8% 11.2%
UK 676 150 81.9% 18.1%
Total 5,038 2,987 62.8% 37.2%
Table 22: Archaeologists' Contract Lengths
Across Europe, approximately two-thirds of archaeologists work on permanent (or “open-ended) contracts; the other third work on temporary or time-limited contracts.
Permanent contracts are almost universal in Poland (97.9%) and Latvia (92.6%); in contrast, the majority of archaeologists in Austria, Czech Republic, Spain, Italy, Norway and Slovenia are employed on time-limited contracts; Italian and Norwegian archaeologists have particularly limited job security, as in both of those countries over 75% of archaeologists work under such contracts.
11 Italian limited contract total includes “freelancers”

45
Contracts – Change Over Time
These data were not universally collected in 2006-08, and so there are no time-series datasets to illustrate change over time in this area.

46
Working Hours
Data were gathered on whether individuals were employed part-time or full-time, so identifying whether archaeological work was the only source of income for individual workers.
Full-time Part-time FT % PT%
Austria 141 12 92.2% 7.8%
Bosnia & Herzegovina 77 2 97.5% 2.5%
Flanders 193 89 68.4% 31.6%
Cyprus 95 1 99.0% 1.0%
Czech Republic 243 130 65.1% 34.9%
Germany 625 454 57.9% 42.1%
Denmark 49 7 87.5% 12.5%
Estonia 53 19 73.6% 26.4%
Greece 253 21 92.3% 7.7%
Spain 434 85 83.6% 16.3%
Ireland 47 36 56.6% 43.4%
Italy 315 134 70.2% 29.8%
Latvia 28 1 96.6% 3.4%
Netherlands 184 189 49.3% 50.7%
Norway 386 35 91.7% 8.3%
Poland12 847 24 97.2% 2.8%
Portugal 183 1 99.5% 0.5%
Romania13 89 32 73.6% 26.4%
Slovenia 48 5 90.6% 9.4%
Slovakia14 167 21 88.8% 11.2%
UK 691 145.6 82.6% 17.4%
Total 5,148 1,443.6 78.1% 21.9%
Table 23: Full-time / Part-time Work
Three-quarters of professional archaeologists across the 21 countries studied work as full-time archaeologists, but there is significant national variation. At one extreme, 99% of Cypriot archaeologists work full-time, while at the other less than half of Dutch archaeologists do so.
The effects of the financial crises have affected the working patterns in many sectors, in many countries. It could be reasonable to interpret the relative decrease in full-time work in archaeology as a response to the changing economic situation. It is also noticeable that this has coincided with a trend towards women making up a larger part of the workforce, but it
12 Polish data for permanent positions only 13 In Romania, "Temporary contract (part-time)" 14 In Slovakia – respondents could identify describing posts as permanent, temporary (FT), temporary (PT)

47
cannot be demonstrated that a more female workforce is a causal factor in the increase in part-time positions not can the increase in part-time positions be demonstrated to be a causal factor in the gender balance shift in the sector.
Working Hours – Change Over Time
FT 2006-08 FT 2012-14 PT increase / FT decrease
PT 2006-08 PT 2012-14
Austria 76% 92% -16% 24% 8%
Flanders (Belgium) 90% 68% +22% 10% 32%
Cyprus 95% 99% -4% 5% 1%
Czech Republic 75% 65% +10% 25% 35%
Germany 75% 58% +17% 25% 42%
Greece 98% 92% +6% 2% 8%
Ireland 97% 57% +40% 3% 43%
Netherlands 73% 49% +24% 27% 51%
Slovakia 87% 89% -2% 13% 11%
Slovenia 98% 91% +7% 2% 9%
United Kingdom 89% 83% +6% 11% 17%
Total 86% 78% +8% 14% 22%
Table 24: Full-time / Part-time Work - change over time
Over the six years since the predecessor project, it has become more common for archaeologists across the eleven countries for which we have data from both this and the predecessor study to work in part-time positions. Only in Austria, the Czech Republic and Slovakia has the percentage of archaeologists in full-time (rather than part-time) employment increased (it is perhaps significant to note that in all three of these countries, the total number of archaeologists in work has increased over this period - see Table 4).
These data may be closely related to broader, societal economic changes, as the nature of work has changed in the post- and ongoing-economic crisis period. It is also possible that there is a correlation between the increase in the number of women working in archaeology and the increase in part-time work, but this cannot be demonstrated statistically and certainly cannot be considered to be causal.

48
Archaeological Employers (Organisations)
Partners provided “Data about the types of organisation operating in archaeology in country by activity and organisational basis”.
Specifically, these were data about how organisations are constituted (eg – part of national government, part of local / municipal government, universities, private companies etc) and what kind of work they do – broken down into the categories of doing fieldwork, giving advice, providing education, providing museum services.
These data cannot be presented in a transnational, tabulated form
It is clear that the sector is organised on different models, which manifest in variable employment patterns exist within the sector across Europe.
However, these models are all fundamentally underpinned by structures that recognise archaeological work as being something of public benefit, as seen by the stimulation of archaeological work through the Environmental Impact Assessment process (above) (which is then variably extended to other land-use change development), and by the requirements of the Valletta Convention, above).
It is clear that across Europe, the majority of archaeologists undertake work that relates to protecting archaeological heritage in the land-use development process. These people may be undertaking fieldwork, and so recording archaeological deposits and materials, or they may be involved in managing the process, interacting with the organisations that are directly causing the land-use change (whether those organisations are public sector or private bodies). What varies by country to country is how the organisations that the archaeologists work for – whether these are private sector organisations, working to requirements set by state or local government agencies, or whether they too are state or local government agencies. In some countries third sector, or NGO, bodies also play a role – but they essentially act as though they are commercialised, private-sector bodies.
The variation between countries (and in some case, between regions) is the degree to which commercialisation is encouraged. The commercialised model is not one which is entirely without state influence – in terms of environmental economics, this is about requiring the developers (those that are affecting the archaeological resource) to comply with legal requirements. To do so, the developers have to pay (in some form) to mitigate for the damage they are causing, and this will be accomplished either by redesign (minimising damage) or by record (engaging archaeologists to undertake investigations and to curate the results of those investigations). Whether the work is paid for directly by the developers or whether it is paid for from the public purse, the fundamental nature of the work is unchanged.
Models of archaeological delivery cannot be simplified into two ‘socialist’ and ‘capitalist’ models as Kristiansen (2009) suggests; the different models used can be imagined as being

49
plotted two dimensionally, with one axis representing funding source – public to private – and the other representing the constitution of the delivery bodies – again, public to private. There are no countries where the only funders are private; the state is always ultimately a ‘client’ in every European country. Sometimes this is through the state commissioning private enterprises to undertake work, and sometimes it is through the state engaging other organisational arms of the state, or elements of local or regional government. In Denmark, archaeological investigations are provided by public services (regional museums), funded by the public purse – a state service, whether the ultimate beneficiaries (the developers) are public or private entities.
In countries where private enterprises undertake the majority of development, and so are the principal funders, the archaeological work can then be either delivered by state agencies (funded through hypothecated taxation on the developers, or from general taxation – thereby breaking the link between the ‘polluter’ and payment for their actions) or by private enterprises through being directly commissioned. In the United Kingdom, most archaeological activities are delivered by organisations that compete with each other commercially (whether those organisations are constituted as profit-making private companies, or more commonly as not-for-profit, ‘charitable’ enterprises), and they are funded on the basis of fees for work done, whether the clients are private or public sector organisations.
Details of the models applied in each participating country within the Discovering the Archaeologists of Europe 2014 project are presented in the national reports.
Archaeological Employers (Organisations) – Change Over Time
These data were not collected in a consistent way in 2006-08, and so there are no time-series datasets to illustrate change over time in this area.

50
Vocational Education and Training
Data were collected on training needs and skills shortages from the perspectives of employers (VET demand). While this was a core data area, owing to variations of national practice there was no specific, shared methodological framework (eg skills lists) provided to the Partners.
Data have been collected from employers (and in some cases from individual workers) on training needs, skills gaps and shortages within archaeology on a nation-by-nation basis, and for each participating state, particular skills issues (gaps or shortages) were identified, both in skills areas that are vocationally specific to archaeology and in areas of generic non-archaeological skills. These data were gathered by using differently framed questions by the project partners in each state, taking in to account the differing approaches to delivery of practice in the participating countries, and this then means that while this information is presented in the national reports at www.discovering-archaeologists.eu, direct transnational comparisons are not possible.
In terms of VET delivery, throughout Europe, the principal deliverers of vocational education and training in archaeology are university schools or departments of archaeology. This has meant, and continues to mean, that vocational education and training is delivered in the context of being a complementary component of academic training, which is delivering knowledge about the physical traces of past human lives and environments. There are few alternative VET providers.
Vocational Education and Training – change over time
Comparisons of national data from 2006-08 and 2012-14 are made where available in national reports, all of which are available at www.discovering-archaeologists.eu.

51
Conclusions
Discovering the Archaeologists of Europe 2014 has achieved significant results, in terms of gathering information on the working practices and skills needs of approximately 25,000 working archaeologists, the overwhelming majority of a total estimated European population of 33,000. It has identified that this is an economic sector worth over €1bn per year, and it has recognised a changing working population, which is becoming more female, with changing working practices – particularly more part-time working.
The project has provided information and recommendations to employers, individual archaeologists and policy makers in the 21 participating countries and beyond, both within Europe and globally (in large part due to the contributions of the European Association of Archaeologists).The Multilateral Network of participating organisations has expanded and become stronger.
As is discussed below, there are few other sources of comparable data in Europe or elsewhere in the world, and so the project as a whole is having a global international impact.

52
Multilateral Network
Specific evaluation comments from the European Commission on the completion of the predecessor project (Discovering the Archaeologists of Europe, in 2006-08) stated that the Commission had been impressed by the content and materials produced, and the specific point that two countries had joined the project midway through and had contributed without receiving Commission funding was impressive, and “encouraging for the future widening of the network across Europe”.
The Network was initially formed of 21 co-beneficiary Partners (including two from non-EU member states, emphasising the breadth of the Network), but the Hungarian Partner had to withdraw before contractualisation, and their place was taken by an Estonia Partner. Two associate Partners, from the Netherlands and Denmark, joined the project after work had commenced (and funded their contributions entirely from national, not European Commission, sources). In total the 23 Partners and associate Partners were based in 21 separate European states, 19 of which were within the European Union.
The network of partners has been maintained through the annual meetings of the European Association of Archaeologists; partners met and updated each other at EAA Annual Meetings in Plzen and in Istanbul, which have been formal valorisation opportunities (with conference sessions organised). These have coincided with formal partner meetings, which took place privately before the conferences.
The partners have discussed the possibility of a further iteration of a project similar to this one, updating and disseminating information about employment and skills needs in archaeology after a further period of five years. This could also involve new partners and European states which are not part of the currently proposed partnership.
As all of the information used about the methodology and results are freely and publicly available through the project website at www.discovering-archaeologists.eu, other organisations are encouraged to undertake their own, similar projects, as happened following the 2006-08 predecessor project, when separate research was carried out in Bosnia and Herzegovina. The results of that were then promoted via the project website, www.discovering-archaeologists.eu and this led directly to the involvement of a partner in this project representing Bosnia and Herzegovina.
The Partnership is strong, and the Partners are actively seeking bilateral and multilateral opportunities to continue to work together. At the final project meeting, all reiterated their support for the idea of a further repetition of the project in five years’ time, in order to ensure that archaeology continues to address VET issues and to expand and enhance the time-series datasets that have been collected.

53
External Data and Global Context
Few comparable external data are available from other European states; the Archaeology in Contemporary Europe project, supported by the European Commission the Culture Programme 2007-13 aimed to identify the archaeologists of Europe through quantitative aspects. “Comparable data is sought across Europe on who counts as an archaeologist in each country (institution), with what diplomas, specialisations and employments, as well as the numbers of archaeologists per surface, GDP, sites, and volume of infrastructure activities” (ACE, no date), but at the time of writing, these results had not been made publicly available. An estimated figure for the total numbers of archaeologists working in France - 4,050 - has been published (Depaepe, 2013).
The Discovering the Archaeologists of Europe projects have been global exemplars for the sector, as there are few comparable datasets collected anywhere else.
In Australia a series of comparable studies have been undertaken, directly influenced by the previous UK component of the first Discovering the Archaeologists of Europe project (Ulm et al 2013, 32), with the most up-to-date figures presented in Ulm et al (2012), which estimated that in 2010 there were between 500 and 600 professional archaeologists working in Australia.
Data have also been collected for what may be the two largest global sectoral workforces, Altschul & Patterson (2010) presented an estimate of 11,350 people working as professional archaeologists working in all sectors across the USA; the number of people working in the sector in Japan declined from a peak in 2000 of 7,111 individuals to 6,255 in 2008 (Agency for Cultural Affairs 2009).
It has been recognised that the approach used by the Discovering the Archaeologists of Europe projects has value beyond simply estimating total populations of archaeologists, as it is in fact a key tool for measuring capacity and thus can be part of a capacity building process.
ICOMOS (2013) sees the development of people as a tool that enhances protection of the historic environment: “Capacity Building through education and training refers to strengthening the knowledge, abilities, skills, and attitudes of people with direct or indirect responsibilities for heritage conservation and management.”, while to the United Nations’ agencies, skills, experience and knowledge are the building blocks of individual performance, which can be acquired formally through education and training, and informally through doing and observing and which lead to social and economic change.
The United Nations Development Programme (UNDP 2009, 2010) sees this process as best carried out through a five stage capacity development process, which includes measurement both before and after capacity development programs are implemented. The predecessor Discovering the Archaeologists of Europe project collected data in twelve countries in 2008, just before the onset of the global financial crisis, and the cycle has now

54
recorded what the crisis has done – giving individual archaeologists, employers, educators and policy-makers data to work with as they plan for the future.
The value of this model has led to discussion of a potential Discovering the Archaeologists of the Americas project, collecting and sharing information for professional archaeology in every country in South, Central, Caribbean and North America (Majewski 2014), and this could all combine with further cycles of national or regional projects to be part of an ongoing macro-project, a Discovering the Archaeologists of the World that can identify and support professional archaeological practice and education globally.

55
Recommendations
The project presents recommendations to individuals (both professional archaeologists and aspirants), to employers, to vocational education and training providers, to policy makers and to the co-beneficiary members of the project’s Multilateral Network partnership.
To individuals
Use the data provided to consider your own career trajectories (including the potential for working in countries other than your own) and the skills that you will need to achieve their goals.
To employers
Use the data provided to have a better anticipation of future skills needs for each business unit.
Explore opportunities to share knowledge and expertise with vocational education providers.
To vocational education and training providers
Use the data provided to recognise where employers have identified their skills demands, and to design and deliver training that matches those labour market needs in order to enhance the employability of trainees.
To Policy Makers
Seek to ensure that an ongoing cycle of projects is supported that continues to gather data on a five-yearly basis so that up-to-date information to individual archaeologists, archaeological employers, policy makers and other interested bodies can be made constantly available.
To members of the Multilateral Network partnership
Continue to seek opportunities to work together, bilaterally or multilaterally in order to maintain the Multilateral Network that this project has established.
Strongly consider expanding the Multilateral Network in any future iteration of this project in order to bring in participants from states that did not contribute to this project in 2012-14, particularly (but not exclusively) France, Scandinavian and west Balkan states in order to further enhance the quality and applicability of the project’s results.

56
Acknowledgements
The project wishes to gratefully acknowledge the financial support partners received from the following national funding agencies or organisations.
The Government of the Republic of Cyprus
Deutscher Archäologen-Verband
University of Tartu
University of Kent
Department of Arts, Heritage and the Gaeltacht
Coopfond – Fondo mutualistico Legacoop Associazione Nazionale Cooperative di Produzione e Lavoro Cooperativa Archeologia Matrix 96 s. c. a r. l. Topografia Archeologica s. c. a r. l.
Ministerul Culturii Romania
Nederlandse Vereniging van Archeologen, NVvA Rijksdienst voor het Cultureel Erfgoed (RCE, Cultural Heritage Agency)
English Heritage Historic Scotland Cadw Northern Ireland Environment Agency
The project also wants to acknowledge the contributions provided by the following individuals
Anna Stewart, York Archaeological Trust project administrator Jon Brownridge, York Archaeological Trust project administration and IT support David Jennings, York Archaeological Trust Chief Executive Michael Davies, project logo designer Conor McDermott, designer and maintainer of the project map Rachel Edwards, Arboretum Archaeological Consultancy, external evaluator
and John Walker, the former York Archaeological Trust Chief Executive who had faith in the idea of the project
We also want to thank the supportive staff of the Education, Audiovisual and Culture Executive Agency of the European Commission.
And all of the authors of the report want to thank all of the respondents who provided us with the data we needed to present this transnational picture of your profession.

57
Bibliography
ACE (Archaeology in Contemporary Europe). No date. The Archaeological Profession [accessed 15th October 2014].
Aitchison, K. 2009a. Discovering the Archaeologists of Europe: Transnational Report. [accessed 15th October 2014].
Aitchison, K., 2009b, ‘Archaeology and the global financial crisis’, Antiquity 83, issue 319. [accessed 15th October 2014].
Aitchison, K., 2009c. ‘After the “gold rush”: global archaeology in 2009’, World Archaeology 41(4), 659-671.
Aitchison, K. & Edwards, R. 2008. Archaeology Labour Market Intelligence: Profiling the Profession 2007-08, Reading: Institute for Archaeologists [accessed 22 October 2014].
Aitchison, K. & Rocks-Macqueen, D. 2014. Discovering the Archaeologists of the United Kingdom 2012-14. Landward Research Ltd. [accessed 15th October 2014].
Altschul, J.H. & Patterson, T.C. 2010. ‘Trends and employment in American archaeology’, in W. Ashmore, D. Lippert & B.J. Mills (eds) Voices in American Archaeology, 29-101. Washington DC: SAA.
Ameels, V. 2014. Discovering the Archaeologists in Flanders 2012-2014. Flemish Heritage Agency. [accessed 15th October 2014].
Bentz, M. & Wachter, T. 2014. Discovering the Archaeologists of Germany 2012-14. Universität Bonn – Institut für Archäologie und Kulturanthropolgie, Abteilung für Klassische Archäologie. [accessed 15th October 2014].
Borș, C. & Damian, P. 2014. Discovering the Archaeologists of Romania 2012-14. Muzeul Național de Istorie a României. [accessed 15th October 2014].
Cleary, K. & McCullagh, N. 2014. Discovering the Archaeologists of Ireland. Institute of Archaeologists of Ireland. [accessed 15th October 2014].
CoE (Council of Europe). 1992. European Convention on the Protection of the European Heritage (revised). [accessed 15th October 2014].
Costa, C., Duarte, C., Pedro Tereso, J., Viegas, C., Lago da Silva, M., Grilo, C., Raposo, J., Diniz, M. & Lima, A. 2014. Discovering the Archaeologists of Portugal 2012-14. Associação Profissional de Arqueólogos. [accessed 15th October 2014].

58
Depaepe, P. 2013. Archaeological Heritage Policies in Europe: the French experiment. Paper presented to Stanford Archaeology Lunch Club, Stanford, 3rd June 2013.
EC (European Commission). 2008. New Skills for New Jobs: anticipating and matching labour market and skills needs. [accessed 20thAugust 2014]
EC. 2010. European Council 25/26 March 2010 Conclusions. [accessed 10th October 2014].
EC. 2014. Assessment of the effects of certain public and private projects upon the environment. [accessed 13th October 2014].
EU (European Union). 1992. Treaty on European Union. [accessed 20th August 2014].
EU. 2012. Consolidated Versions of the Treaty on European Union and the Treaty on the Functioning of the European Union. [accessed 15th October 2014]
Frolik, J. & Mácalová, M. 2014. Discovering the Archaeologists of Czech Republic 2012-14. Institute of Archaeology AS CR, Prague, v.v.i. [accessed 15th October 2014].
Groves, R. 1989. Survey Errors and Survey Costs. Hoboken: Wiley & Sons.
Hinton, P. & Jennings, D. (2007) 'Quality management of archaeology in Great Britain: present practice and future challenges', in W.J.H. Willems, & M. Van den Dries (eds) Quality Management in Archaeology, 100-112. Oxford: Oxbow Books.
ICOMOS (International Council on Monuments and Sites). 2013. Principles for Capacity Building through Education and Training in Safeguarding and Integrated Conservation of Cultural Heritage. [accessed 19th October 2014].
Initiative for Heritage Conservancy. 2014. Discovering the Archaeologists of Greece 2012-14. Initiative for Heritage Conservancy. [accessed 15th October 2014].
Karl, R. & Möller, K. 2014. Discovering the Archaeologists of Austria 2012-14. Historic Verlag. [accessed 15th October 2014].
Kjærulf Andersen, A., Skaarup, J., Odgaard, U. & Rostock, J. Discovering the Archaeologists of Denmark 2012-14. FaF – Foreningen af Fagarkæologer. [accessed 15th October 2014].
Kompare, T., Lazar, I. & Pintarič Kocuvan, V. 2014. Discovering the Archaeologists of Slovenia 2012-14. University of Primorska. [accessed 15th October 2014].
Krekovič, E. & Staššíková – Štukovská, D. 2014. Discovering the Archaeologists of Slovakia 2012-14. Comenius University Bratislava. [accessed 15th October 2014].
Kristiansen, K. 2009. ‘Contract archaeology in Europe: an experiment in diversity’, World Archaeology 41:4, 641-8.

59
Lawler, A. 2010. Discovering the Archaeologists of Europe: Bosnia - Herzegovina [accessed 22nd October 2010].
Lawler, A. 2014. Discovering the Archaeologists of Bosnia & Herzegovina 2012-14. Cultural Heritage without Borders. [accessed 15th October 2014].
Liibert, K., Malińska, M., Wachowicz, L. & Marciniak, A. 2014. Discovering the Archaeologists of Poland 2012-14. Adam Mickiewicz University in Poznań. [accessed 15th October 2014].
Majewski, T. 2014. The Discovering the Archaeologists of the Americas Initiative. Paper presented at European Association of Archaeologists Annual Meeting, Istanbul, 11th September 2014.
Parga-Dans, E. & Varela-Pousa, R. 2014. Discovering the Archaeologists of Spain 2012-14. Incipit-CSIC. [accessed 15th October 2014].
Pintucci, A. & Cella, E. (eds). 2014. Discovering the Archaeologists of Italy 2012-14. Confederazione Italiana Archeologi. [accessed 15th October 2014].
Prokopiou, E.S. & Alphas, E. 2014. Discovering the Archaeologists of Cyprus 2012-14. The Department of Antiquities, Cyprus. [accessed 15th October 2014].
Schenck, T. 2014. Discovering the Archaeologists of Norway 2012-14. Forskerforbundet (Norwegian Association of Researchers). [accessed 15th October 2014].
Schlanger, N. & Aitchison, K. (eds). 2010. Archaeology and the Global Economic Crisis: multiple impacts, possible solutions. Culture Lab Éditions.
Šnē, A., Vijups, A. & Mintaurs, M. 2014. Discovering the Archaeologists of Latvia 2012-14. Faculty of History and Philosophy of the University of Latvia. [accessed 15th October 2014].
Ulm, S. Mate, G., Dalley, C. & Nichols, S. 2012. ‘A working profile: the changing face of professional archaeology in Australia’, Australian Archaeology 75.
Ulm, S., Nichols, S. & Dalley, C. 2013. ‘Australian archaeology in profile: a survey of working archaeologists’, in J.H. Jameson & J. Eogan (eds) Training and Practice for Modern Day Archaeologists 31-52. Springer: New York / Heidelberg / Dordrecht / London.
Ulst, I., Kobrusepp, V., Kangert, N., Pavlov, D. & Mäesalu, A. 2014. Discovering the Archaeologists of Estonia 2012-14. MTÜ Arheopolis. [accessed 15th October 2014].
UNDP (United Nations Development Programme). 2009. Capacity Development: a UNDP Primer [accessed 19th October 2014]
UNDP. 2010. Measuring Capacity [accessed 22nd October 2014]

60
van Londen, H., Vossen, N., Schlaman, M. & Scharringhausen, K. 2014. Discovering the Archaeologists of the Netherlands 2012-14. University of Amsterdam. [accessed 15th October 2014].
YAT (York Archaeological Trust). 2012. Detailed Description of the Project – Discovering the Archaeologists of Europe 2014 [accessed 15th October 2014].