discover growth the chiba bank, ltd. · rating and investment aa- ... c hiba prefecture, our...
TRANSCRIPT

08 Our Initiatives for Growth Potential
14 CSR Activity 16 Compliance17 Financial and
Corporate Information
02 Key Characteristics of Our Operating Area
CONTENTS
04 Message from the President
Discover Growth Annual Report 2012
Year ended March 31, 2012
The Chiba Bank, Ltd.

About Chiba Bank
At a glance
The Chiba Bank is a regional bank that operates primarily in Chiba Prefecture. Known affectionately
as “Chibagin,” the bank has grown continuously together with the prefecture and is now Japan’s
second-largest regional bank, with deposits of ¥9,677 billion and loans of ¥7,581 billion. Capital
ratios of 14.35% on a consolidated basis and 13.63% on a non-consolidated basis demonstrate the
Bank’s financial soundness.
FY ’06
11.63 12.20 11.7012.80 13.37
14.35%
’07 ’08 ’09 ’10 ’11
Capital Ratio*
14.35%
* Consolidated
FY ’08 ’09’07
8.5 8.6 8.9 9.3 ¥9.6trillion
’10 ’11
Deposits*
¥9.6 trillion
* Non-consolidated, including NCD
2nd among Regional BanksFY ’08’07 ’09
7,1 7,3 7,3 7,3 ¥7,5trillion
’10 ’11FY ’08’07 ’09
6.6 6.9 7.1 7.3 ¥7.5trillion
’10 ’11
Loans and Bills Discounted*
¥7.5 trillion
* Non-consolidated
2nd among Regional Banks
FY
45.9
12.3
37.5 40.6 ¥40.7billion
’08’07 ’09 ’10 ’11
Net Income*
¥40.7billion
* Consolidated
2nd among Regional Banks
Credit Ratings:
Standard & Poor’s A A-1
Moody’s A1 P-1
Rating and Investment AA- —Information
Long-term Short-term

Chiba 1
Chiba Prefecture
Population 6.2 million 6th
Gross Prefectural Product ¥ 19.2 trillion 6th
Balance of Deposits ¥ 24.1 trillion 6th
Balance of Loans ¥ 12.0 trillion 7th
Sources:Population: Natural Census (October 2010) Gross Prefectural Product: Economic and Social Research Institute, Cabinet Office (FY 2009)Balance of Deposits and Loans: The Bank of Japan (As of March 2012)
FiguresDomestic Ranking
among 47Japanese Prefectures
Ibaraki Pref.
Saitama Pref.
Tokyo
Kanagawa Pref.
TsukubaExpress Narita Sky Access Line
Narita International Airport
Tokyo BayAqua-Line
Tokyo Disney Resort
Ken-O Expressway
TOKYO SKYTREE®
Chiba CityHanedaAirport
Neighboring area 6 million residents 2.5 million households
Chiba Prefecture 6 million residents 2.5 million households
● Narita International Airport
●Tsukuba Express Opened in August 2005
● Narita Sky Access Line
Opened in July 2010
●Tokyo Bay Aqua-Line
●Ken-O Expressway
Key Characteristics of Our Operating Area
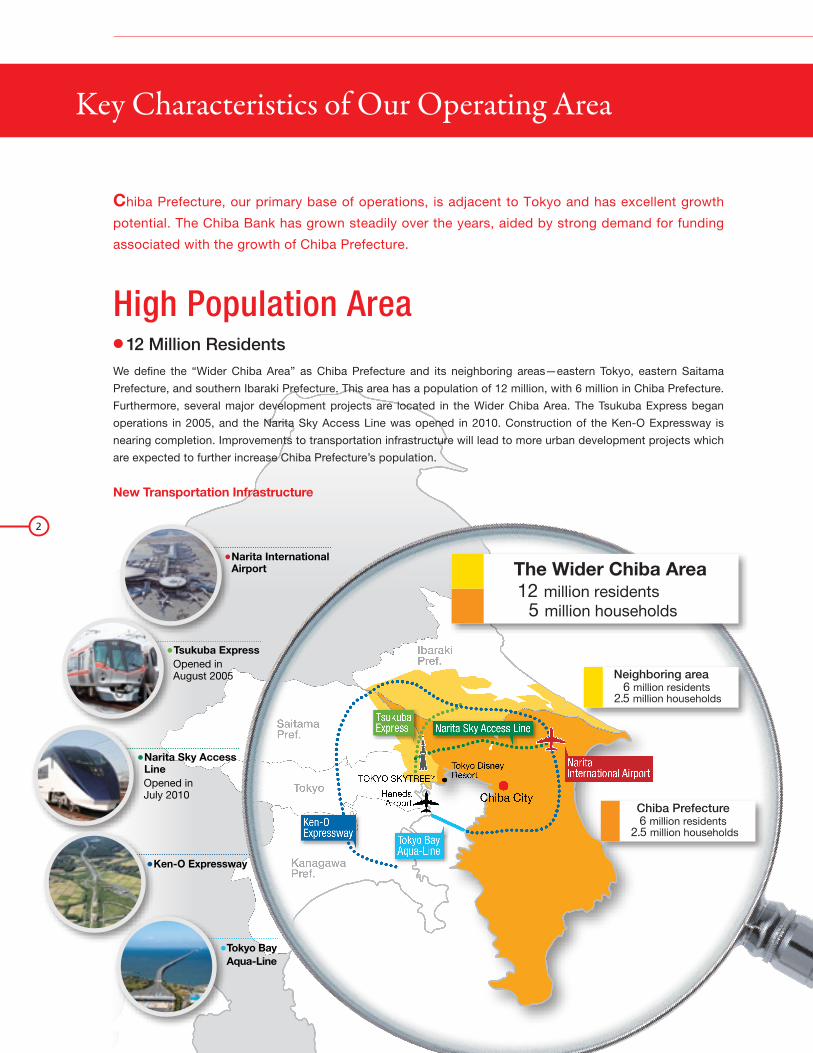
Chiba Prefecture, our primary base of operations, is adjacent to Tokyo and has excellent growth
potential. The Chiba Bank has grown steadily over the years, aided by strong demand for funding
associated with the growth of Chiba Prefecture.
2
High Population Area● 12 Million ResidentsWe define the “Wider Chiba Area” as Chiba Prefecture and its neighboring areas—eastern Tokyo, eastern Saitama
Prefecture, and southern Ibaraki Prefecture. This area has a population of 12 million, with 6 million in Chiba Prefecture.
Furthermore, several major development projects are located in the Wider Chiba Area. The Tsukuba Express began
operations in 2005, and the Narita Sky Access Line was opened in 2010. Construction of the Ken-O Expressway is
nearing completion. Improvements to transportation infrastructure will lead to more urban development projects which
are expected to further increase Chiba Prefecture’s population.
New Transportation Infrastructure
The Wider Chiba Area12 million residents 5 million households
Key Characteristics of Our Operating Area

233
237
230
228
238
Malaysia
Finland 34
Ranking
35
—
36
37
Chiba Prefecture
United ArabEmirates
Portugal
Ibaraki Pref.
Saitama Pref.
Tokyo
Kanagawa Pref.
TsukubaExpress Narita Sky Access Line
Narita International Airport
Tokyo BayAqua-Line
Tokyo Disney Resort
Ken-O Expressway
TOKYO SKYTREE®
Chiba CityHanedaAirport
Comparison of Chiba’s Gross Prefectural Product and Overseas GDP
Source: The World Bank Database (2010)
(US$ Billion)
Well-Balanced Industry● 19 Trillion Yen of Gross Prefectural ProductChiba Prefecture has a well-balanced industrial structure, comprising one of the most prominent industrial zones in Japan
with a high concentration of production bases along the coast of Tokyo Bay as well as rich agricultural, fishery, and tourism
resources. Chiba’s gross prefectural product is about 19 trillion yen, which ranks sixth among Japan’s prefectures and
globally would rank 36th among all countries of the world.
3
Narita International Airport● 7th Largest Globally in Volume of Imports and ExportsChiba Prefecture is home to Narita International Airport, which is the largest airport in Japan. It is a key transportation hub
for Asia and ranks seventh among international airports in the world in volume of imports and exports. Regional business
operations, logistics, sightseeing, and other activities benefit from the proximity of this expansive airport. In the fiscal year
ending March 31, 2015, the number of annual arrival and departure slots at Narita is scheduled to increase from the current
250,000 to 300,000. Raising capacity is expected to generate an economic benefit of approximately ¥1 trillion.
Source: Narita International Airport Corporation
1. Hong Kong 4,128
2. Seoul 2,634
3. Shanghai 2,344
4. Dubai 2,183
5. Frankfurt 2,149
6. Paris 2,142
7. NARITA 2,126
8. Singapore 1,814
9. Taipei 1,753
10. Anchorage 1,742
Top 10 Airports in Volume of Imports and Exports in 2010
Key Characteristics of Our Operating Area
(Thousands of tons)
7thamong international airports in the world
$233billion(¥19 trillion)

Message from the President
Business Performance
In the fiscal year ended March 31, 2012, consolidated ordinary profit increased ¥1.6 billion to
¥66.9 billion and consolidated net income increased ¥0.1 billion to ¥40.7 billion, which was
higher year-on-year for the third consecutive year after the financial crisis of 2008.
On a non-consolidated basis, core net business income was ¥71.0 billion, ¥1.0 billion higher
than our projection mainly due to an increase in net fees and commissions income. While this
demonstrated that earnings from business operations remain high, net interest income was
challenged mainly due to a decrease in the interest rate on loans.
Ordinary profit increased ¥1.9 billion to ¥61.7 billion as we took many actions to improve our
financial position. This included an ¥8.1 billion decrease in credit costs, which was the result of
our efforts to assist corporate clients in restoring financial soundness, as well as an ¥8.2 billion
loss related to securities, including losses on sales of stock, to reduce the influence of volatility
in financial markets on our performance.
While net income decreased ¥2.1 billion to ¥36.0 billion, the Chiba Bank secured a ¥1.0 billion
increase when considering the exclusion of the ¥3.2 billion effect of a change in the effective
income tax rate.
4
Message from the President
More than a year has elapsed since the occurrence
of the Great East Japan Earthquake of March 2011.
Despite the disruption of supply chains and other
problems that accompanied this disaster, manu-
facturing operations were expeditiously resumed
owing to the diligent efforts of companies in Japan.
In addition, the Japanese economy continues to
recover with the full-scale implementation of the
supplementary budget for earthquake reconstruction.
Amidst this environment, the Chiba Bank is commit-
ted to contributing to the economic growth of the
Wider Chiba Area, through fulfilling our role as a
regional bank by providing smooth financing. This
will increase the corporate value of the Chiba Bank.Hidetoshi Sakuma, President

Net Income●
(¥ Billion)
36.238.1
36.037.5
40.7
ConsolidatedNon-consolidated
’09FY ’10 ’11
40.6
Our financial soundness remained high with a consolidated capital ratio of 14.35% and a
consolidated Tier 1 capital ratio of 12.99%. As we have adequate equity in terms of quality and
volume, and our stable earnings allow us to increase retained earnings, we maintain a stance
of seeking to enhance shareholder returns. We are also implementing strategic treasury stock
acquisition programs in addition with stable dividends at ¥11 per share.
“Frontier 70” – the Medium-Term Management Plan
In April 2011, we started “Frontier 70,” our 11th medium-term management plan, which
covers the three-year period up to March 2014. The business environment for Japan’s
banking operations is significantly changing: customers’ needs are shifting along with Japan’s
rapidly aging population, competition among financial institutions is intensifying, and financial
regulations are becoming stricter. In this environment, our ability to anticipate upcoming change
and act on innovative ideas will become increasingly important.
“Frontier 70” is formulated to respond to these upcoming changes in the operating environment.
Our primary objective under the plan is to build stable bases for our operations and management
so that we can overcome challenges posed by shifts in future market conditions. The plan is
centered on four subjects: 1) Strengthening the business structure, 2) Assisting the regional
economy, 3) Enhancing the management system, and 4) Improving staff training. We will aim
for more growth and development at the Chiba Bank by swiftly implementing various initiatives
regarding these subjects.
Strategic Objectives
The Chiba Bank operates in Chiba Prefecture and the neighboring areas of eastern Tokyo,
eastern Saitama Prefecture and southern Ibaraki Prefecture, a region that we call the “Wider
Chiba Area.” It has a population of about 12 million, and many companies are gathered in our
attractive operating area. Our home region also has an extensive and growing transportation
infrastructure, including the Tsukuba Express, the Narita Sky Access Line, the Tokyo Bay
Aqua-Line, and Ken-O Expressway. Real estate developments along these lines are creating
new communities. Several other large-scale development projects are underway. Narita
International Airport will increase its annual arrival and departure slots, and a large outlet mall
was recently opened in our operating area. As indicated by these projects, the Wider Chiba
Area is a highly attractive market with excellent potential for more growth.
The Chiba Bank has added 15 branches in communities with particularly strong growth
prospects, and renovated 11 branches since 2005, when major development projects in the
Wider Chiba Area began. In 2013, we plan to open a branch in Tsukuba City, the largest
market in southern Ibaraki Prefecture. We will continue to expand our branch network along
with growth in our home region.
5
’09FY ’10 ’11
Deposits/Loans and Bills Discounted(Consolidated)
●
(¥ Billion)
DepositsLoans and Bills Discounted
8,9669,275
9,639
7,130 7,346 7,554
13.3712.80
11.7012.2011.63
14.35
9.6810.72 10.17
11.39 12.0512.99
Capital Ratio(Consolidated)
●
(%)
Capital RatioTier 1 Capital Ratio
’06 ’07FY ’08 ’09 ’10 ’11
Message from the President
The Chiba Bank has branches in Europe, the United States, and Asia that provide assistance
for our customers’ overseas operations. Recently, we have taken steps to strengthen our
framework for supporting customers, particularly in Asia. Adding to the Hong Kong Branch
and Shanghai Representative Office, we opened the Singapore Representative Office in March
2011. We also sent a staff member to the Japan Desk at Bangkok Bank PCL. This gives us
four locations in Asia, with regional operations centered at the Hong Kong Branch. Business
alliances are another way we are strengthening our overseas business operations. We have
formed alliances with Bangkok Bank PCL in Thailand and Bank of Communications in China.
More recently, we established alliances with Standard Chartered Bank in June 2011 and PT
Bank CIMB Niaga Tbk in Indonesia in April 2012. Our network and business alliances allow us
to provide total support for Japanese companies in Asia.
Improving Staff Training
The Chiba Bank provides highly effective training programs that match the skills and aptitude of
each employee. Refining the capabilities of our employees enables us to offer financial services
with consistently high quality.
In 2011, we started an assessment program for the business skills of all employees working
at branches. The program facilitates the clarification of the strengths and training needs of
each individual. This knowledge management makes possible effective, well-planned training
programs and the assignment of employees to the most suitable positions.
The Chiba Bank aims to create energetic workplaces where women and men can work together
to upgrade their capabilities. To that end, we are fostering an environment where capable,
motivated female employees can work effectively. In October 2011, the Female Support Team
was formed to reinforce programs that support the activities of the women in our workforce.
Assisting the Regional Economy
We believe that contributing to the sound growth of regional economies is the most important
role of a regional bank. The consistent performance of our corporate customers maintains
stable employment, which supports growth in household spending which, in turn, enables
companies to achieve greater performance. Sustaining this positive cycle leads to more growth
in our deposits and loans. Consequently, it is the key business strategy for the Chiba Bank to
realize the full potential of the Wider Chiba Area by contributing to the vitality of the regional
economy.
In November 2011, we signed an agreement with Chiba City for collaboration to increase
the vitality of the regional economy. We will actively participate in this collaboration to attract
companies and to foster growing companies, and ultimately to further vitalize the regional
economy.
Message from the President
6

Activities in Growth Business Sectors ・Growing Business Support Office ・International Business
Subject
To achieve sustainable growth, our entire organization must remain fully committed to our
customer first policy. As part of this commitment, we formed the Committee for Improving
Services for Customers in April 2012. The committee examines requests and other feedback
from customers and improves products and services by listening to the voice of the
customers.
The Chiba Bank will be celebrating its 70th anniversary at the end of March 2013. As we
approach this milestone, everyone at the Chiba Bank Group is dedicated, under our customer
first policy, to making the Chiba Bank “a first-rate retail bank” with boundless creativity that
meets the expectations of all customers.
Hidetoshi Sakuma, President
Message from the President
7
The 11th Medium-Term Management Plan “Frontier 70”—From April 2011 to March 2014 (3 years)—
Strengthening the business structure1
Enhancing the management system3
Assisting the regional economy2
Improving staff training4
“Frontier70”
Our Future
Development
>>> Page 10
Sales of Investment-type Financial Products ・Business Strategy for High-net-worth Clients ・Retail Business Strategy >>> Page 12
Regional Growth and Our Future Development・High Growth Potential of the Wider Chiba Area・Strategic Branch Network >>> Page 8
Our Initiatives for Growth Potential
8
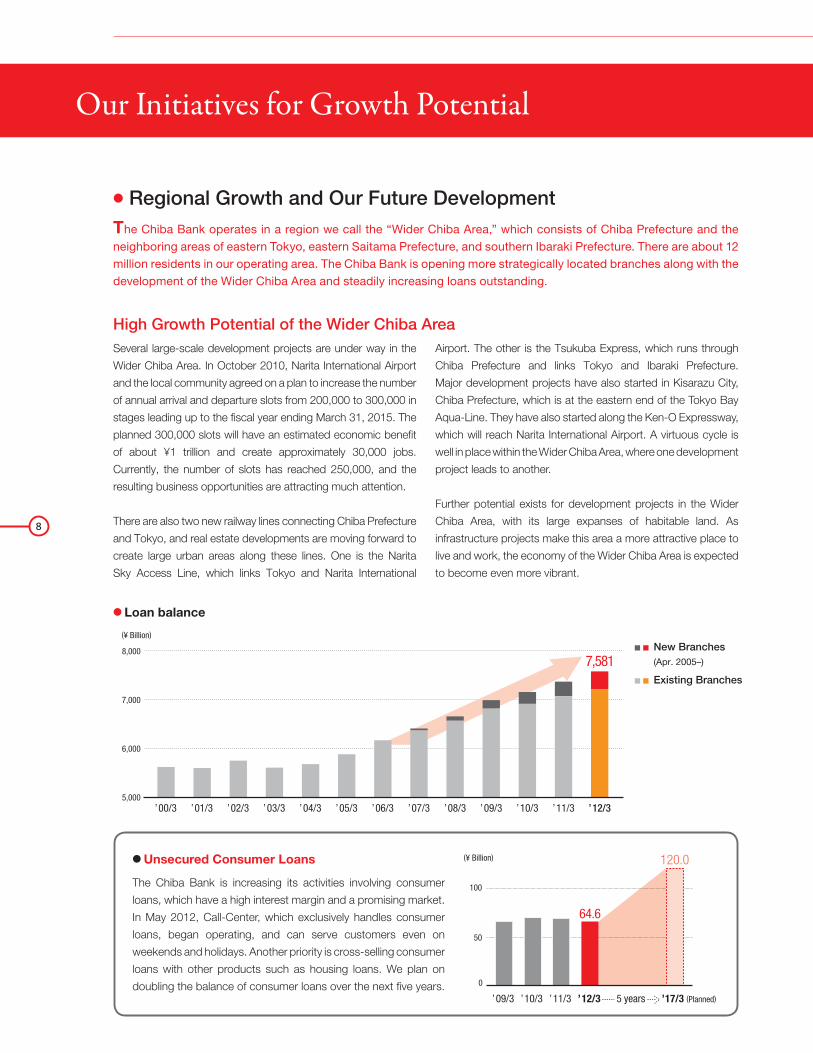
● Regional Growth and Our Future Development The Chiba Bank operates in a region we call the “Wider Chiba Area,” which consists of Chiba Prefecture and the neighboring areas of eastern Tokyo, eastern Saitama Prefecture, and southern Ibaraki Prefecture. There are about 12 million residents in our operating area. The Chiba Bank is opening more strategically located branches along with the development of the Wider Chiba Area and steadily increasing loans outstanding.
High Growth Potential of the Wider Chiba AreaSeveral large-scale development projects are under way in the
Wider Chiba Area. In October 2010, Narita International Airport
and the local community agreed on a plan to increase the number
of annual arrival and departure slots from 200,000 to 300,000 in
stages leading up to the fiscal year ending March 31, 2015. The
planned 300,000 slots will have an estimated economic benefit
of about ¥1 trillion and create approximately 30,000 jobs.
Currently, the number of slots has reached 250,000, and the
resulting business opportunities are attracting much attention.
There are also two new railway lines connecting Chiba Prefecture
and Tokyo, and real estate developments are moving forward to
create large urban areas along these lines. One is the Narita
Sky Access Line, which links Tokyo and Narita International
Airport. The other is the Tsukuba Express, which runs through
Chiba Prefecture and links Tokyo and Ibaraki Prefecture.
Major development projects have also started in Kisarazu City,
Chiba Prefecture, which is at the eastern end of the Tokyo Bay
Aqua-Line. They have also started along the Ken-O Expressway,
which will reach Narita International Airport. A virtuous cycle is
well in place within the Wider Chiba Area, where one development
project leads to another.
Further potential exists for development projects in the Wider
Chiba Area, with its large expanses of habitable land. As
infrastructure projects make this area a more attractive place to
live and work, the economy of the Wider Chiba Area is expected
to become even more vibrant.
Our Initiatives for Growth Potential
120.0
’09/3 ’10/3 ’11/3 ’12/3 5 years ’17/3 (Planned)
(¥ Billion)
0
50
100
64.6
● Unsecured Consumer Loans
The Chiba Bank is increasing its activities involving consumer
loans, which have a high interest margin and a promising market.
In May 2012, Call-Center, which exclusively handles consumer
loans, began operating, and can serve customers even on
weekends and holidays. Another priority is cross-selling consumer
loans with other products such as housing loans. We plan on
doubling the balance of consumer loans over the next five years.
’00/3 ’01/3 ’02/3 ’03/3 ’04/3 ’05/3 ’06/3 ’07/3 ’08/3 ’09/3 ’10/3 ’11/3 ’12/3
’00/3 ’01/3 ’02/3 ’03/3 ’04/3 ’05/3 ’06/3 ’07/3 ’08/3 ’09/3 ’10/3 ’11/3 ’12/3
■ ■ New Branches■ ■ Existing Branches7,554
7,581
5,000
6,000
7,000
8,000
(¥ Billion)
(¥ Billion)
5,000
6,000
7,000
8,000
● Loan balance
■ ■ New Branches (Apr. 2005–)
■ ■ Existing Branches

Kanagawa Pref.
Chiba Pref.
Tokyo
Saitama Pref.
Ibaraki Pref. Tsukuba Branch (Scheduled)
Inzai-makinoharaBranch (Dec. 2011)
Yotsukaido-minamiBranch (Feb. 2012)
KisarazuBranch (Feb. 2012)
Kisarazu-higashiBranch (Nov. 2011)
Koshigaya-laketownBranch (Jun. 2011)
TsukubaExpress
Narita Sky Access Line
Tokyo BayAqua-Line
Ken-O Expressway
Narita International Airport
9
Strategic Branch Network The Chiba Bank is opening branches serving the many new
communities that are under construction in the Wider Chiba
Area. Expansion of the branch network started in 2005 with
the beginning of several large-scale development projects.
Overall, we have newly established 15 branches since then. To
utilize our resources in the best manner, we have also relocated
branches in response to the movement of urban centers along
with the creation of new housing developments. In total, 11
branches have been moved and renovated since 2005.
We open or renovate branches with an emphasis on sales
activities. One of our objectives is to offer distinctive services
for high-net-worth clients, and for that purpose, the branch
design includes a private consulting room. Another example
of our innovative branch layouts is the creation of partitioned
private counters that can be used for offering proposals and
other services to our customers.
To extend our service area, we are preparing to open a new
branch in the Tsukuba area of Ibaraki Prefecture. Tsukuba
City is an academic city that is home to research institutes,
universities, and companies with highly advanced technologies.
Together with its neighboring municipalities, it has a population
of about 500,000, making this area the largest market in
southern Ibaraki Prefecture. Also, completion of the Tsukuba
Express has increased access between Tsukuba and Tokyo.
The resulting new real estate development projects are making
Tsukuba one of the fastest growing areas in Japan.
The Chiba Bank will retain its flexible branch network strategy,
and will continue to grow along with the Wider Chiba Area.
● Branch network strategy in growth area
Our Initiatives for Growth Potential
Inzai–makinoharaBranch
Yotsukaido–minamiBranch
Kisarazu–higashiBranch
Koshigaya–laketownBranch
Kisarazu Branch
New Branches (Apr. 2005–)
Renovated Branches (Apr. 2005–)

10
Our Initiatives for Growth Potential
Growing Business Support OfficeEstablished in October 2010, the Growing Business Support
Office is staffed by specialists with extensive knowledge
and works with branches in many growth business sectors,
including medical and nursing services, agriculture, tourism,
the environment, social infrastructure (PFI*), and international
business. To meet the diverse needs of our customers, support
also includes cooperation with specialists in business matching,
providing know-how regarding the usage of public sector
support, and other services.
● Activities in Growth Business SectorsThe Chiba Bank provides a broad range of support for businesses that can contribute to the growth of its operating area. Services are not limited to financial assistance—we work with our customers to devise solutions for many types of issues associated with their business operations.
● Business Matching
The Chiba Bank leverages its extensive service network to bring together companies to combine their resources and
create new businesses.
The Chibagin Marché
Sales fair of farm products of Chiba Prefecture
Regional Banks—Food Selection
A food exhibition and business conference held by regional banks in Japan
Shanghai Business Community Seminar
A seminar in Shanghai to discuss the Chinese economy and associated subjects
An increasing number of small and medium-sized enterprises are aware of environmental concerns in management. Needs involving capital expenditure in this sector are expected to increase.
Environment
Japanese companies are responding to economic globalization in such ways as establishing and enlarging overseas operations and increasing foreign trade.
International Business
Due to the increasing scale of agricultural operations and with companies in other industries entering the sector, prospects for growth in agriculture are favorable.
Agriculture
The Wider Chiba Area has many locations for tourists. The tourism market is expected to increase along with promotional activities for sightseeing in this area.
Tourism
Substantial demand is expected for capital expenditure in hospitals due to Japan’s rapidly aging population.
Medical /Nursing
The private sector will play a major role in meeting the demand for updating public infrastructure as well as for reconstruction projects.
Social Infrastructure
(PFI*)
* PFI: Private Finance Initiatives

11
Our Initiatives for Growth Potential
Head Of�ce
Hong Kong Branch
ShanghaiRepresentative Of�ce
SingaporeRepresentative Of�ce
New YorkBranchLondon
Branch
Alliance Partners
International BusinessWith branches in New York, Hong Kong, and London and
representative offices in Shanghai and Singapore, the Chiba
Bank is strengthening its base for assisting customers with
international business operations. In particular, as more
customers start operations in Asia, we have been enlarging our
network in this region.
The Hong Kong Branch began operations in 1989 and the
Shanghai Representative Office opened in 1995. As the rapid
growth of markets and economies in Asia continued, we
established the Singapore Representative Office in March
2011.
The Chiba Bank has formed relationships with financial
institutions in other countries. In 2008, business alliances were
established with Bangkok Bank PCL in Thailand and Bank of
Communications in China. Since February 2011, we have
assigned an employee to work at the Japan Desk of Bangkok
Bank PCL. Furthermore, we formed business alliances with
Standard Chartered Bank in June 2011 and PT Bank CIMB
Niaga Tbk in Indonesia in April 2012. With these alliances, we
now cover nearly all regions of Asia.
Overseas operations are also growing in terms of products and
services. We extend loans to our customers’ overseas
companies and provide other financial services. Furthermore,
we started handling the Chinese Yuan at all branches in Japan
and the Hong Kong Branch in 2011. We attentively meet
customers’ overseas needs for consultations on the local
investment situation and support for entering new sales areas.
We will continue to take steps to increase earnings of
international operations while supporting customers with our
branches in Japan and the overseas network.
● Worldwide Network

12
Our Initiatives for Growth Potential
Business Strategy for High-net-worth ClientsThe Chiba Bank’s customer base includes about 30,000 high-
net-worth clients with financial assets of ¥100 million or above,
which provides a positive business environment.
Over the years, we have enlarged our product lineup to meet
the needs of these clients with substantial financial assets. In
June 2006, we were the first regional bank in Japan to begin
the direct operation of a trust business. This business provides
estate planning services such as will trusts and inheritance
procedures. In 2010, we established an alliance with Lombard
Odier Trust (Japan) Ltd. This gives us an even larger selection
of financial products to serve this customer segment in such
ways as meeting the need to preserve the value of assets and
pass them on to the next generation.
To further strengthen services, the Chiba Bank is working even
more closely with Chibagin Securities, the Group’s securities
subsidiary. Combining the Bank’s customer base with Chibagin
Securities’ expertise in selling financial products enables us to
meet a diverse range of needs among high-net-worth clients
involving asset management and protecting assets.
●Sales of Investment-type Financial ProductsThe increasing amounts of personal financial assets in the Wider Chiba Area create a variety of asset management needs. The Chiba Bank has assertively taken advantage of deregulation to offer an increasingly broad financial product range. With many of our employees having highly specialized knowledge of asset management, taxes, and related fields, we are further improving our ability to promote and sell our financial products.
● Chibagin Securities
Kamagaya Branch
Tsudanuma Branch
Choshi Branch
Asahi Branch
Togane Branch
Head Of�ce
Mobara Branch
Ichihara Branch
Kisarazu Branch
Tateyama Branch
Yachiyo Branch
Narita Branch
Branches Outside Chiba Prefecture Tokyo BranchMinami-tsukuba Branch (Ibaraki Prefecture)Kuki Branch (Saitama Prefecture)Toshin Branch (Nagano Prefecture)
This company joined the Chiba Bank Group when the
Bank purchased Chuo Securities Co., Ltd., in March 1998.
Its name was changed to Chibagin Securities in January
2011. The company became a wholly owned subsidiary in
October 2011 to further strengthen ties between banking
and securities operations within the Group.
Chibagin Securities Network
History
Mar. 1998Chuo Securities joined the Chiba Bank Group.
Jan. 2011Changed name to Chibagin Securities
Oct. 2011 Turned into a wholly owned subsidiary
Oct. 1981 The two companies merged, forming Chuo Securities.
Jun. 1883 Kobuse Securities was founded.
Apr. 1923 Toriumi Securities was founded.

13
Retail Business StrategyThe Chiba Bank began selling investment trusts in 1998. Since
then, sales have increased steadily as the Nikkei Average
climbed, and have grown into a major source of earnings for the
Bank. However, these sales decreased along with the drop in
stock prices following the financial crisis of 2008. This was the
first major stock market downturn for the bank and customers
since we started selling investment trusts.
On the other hand, customers’ needs for asset management
services have grown. A major reason is the influx of money
among the baby-boomer generation as they receive retirement
payments and other funds while interest rates are at a historic
low. Swiftly taking advantage of deregulation, the Chiba Bank
has enlarged its product lineup to include investment-type
financial products such as insurance policies. With this diverse
lineup, the Chiba Bank has developed the ability to conduct
stable sales regardless of stock market conditions.
The partial deregulation for bank sales of insurance policies
made it possible to start offering indemnity-type insurance to
customers applying for housing loans starting in April 2012.
This revision also allows selling indemnity-type insurance to
the owners of businesses that use our loans. To capitalize
on opportunities created by deregulation, we have increased
the number of insurance specialists at our Consulting Plazas
(see column below). We plan to make sales of indemnity-type
insurance a new source of earnings.
The Chiba Bank and Chibagin Securities plan to increase total
assets under management for individuals from the current ¥1.6
trillion to ¥2 trillion.
Our Initiatives for Growth Potential
● Sales of investment-type financial products
1H 2H 1H 2H 1H 2H 1H 2H 1H 2H 1H 2H 1H 2H 1H 2H 1H 2H 1H 2H 1H 2H 1H 2H 1H 2H 0
50
100
150
200 193.8
52.8
169.0■ Nikkei Stock Average (Right scale)
0
5,000
10,000
15,000
20,000
’99 ’00 ’01 ’02 ’03 ’04 ’05 ’06 ’07 ’08 ’09 ’10 ’11
The highest in the past 4 years
(Yen)(¥ Billion)
● Consulting Plaza
The Chiba Bank operates three Consulting Plazas which are open even on weekends
and bank holidays. Consulting Plazas specialize in providing customers with proposals
involving a diverse range of financial products. Customers can receive information about
financial products and asset management, and consult with tax accountants and other
specialists. We are increasing the number of insurance specialists assigned to Consulting
Plazas from 10 to 15 by October 2012. The aim is to improve services for customers
while increasing fee income from the sale of indemnity-type insurance.

CSR Activity
CSR Activity
●Group CSR Activity PolicyTo help create a sustainable regional society, the Chiba Bank Group will have a strong commitment to the CSR Activity by
1) leveraging the Group’s financial intermediary functions and other core business operations, 2) conducting sincere and fair
business activities, and 3) resolving a broad range of social issues, including climate change and other environmental problems. All
directors and employees are aware that they play a central role and actively engage in the CSR activity.
Furthermore, by disclosing information about the Group’s CSR Activity, we deepen relationships with stakeholders and define a
common vision for a “new local community/regional society.”
Chibagin Himawari* Concerts The Chiba Bank has been holding Chibagin Himawari Concerts on
a regular basis since 1989. The concerts are open to customers
from throughout our region at no cost.
Financial Education Activities The Chiba Bank engages in activities to disseminate financial education.
Elementary, junior high and senior high school students are given the opportunity
to visit the Chiba Bank’s workplaces to learn about financial subjects. The
Chiba Bank also sends employees to schools to conduct finance classes.
Other activities include instructing a university course and conducting training
programs for school teachers about bank operations and customer services.
Support for Earthquake SufferersThe Chiba Bank distributed Christmas presents to children in
areas that were damaged by the Great East Japan Earthquake.
The presents included toys, such as stuffed animals and toy
cars, as well as items to keep warm, such as gloves and scarfs.
The Chibagin CupSince 1995, a pre-season soccer match called the Chibagin
Cup has been held to support local J League soccer teams and
promote local sports. Every year, about 300 people with disabilities
are invited to enjoy this event at no cost.
14
As a regional bank dedicated to growing along with the communities it serves, the Chiba Bank Group is engaged in
CSR activity in accordance with the Group CSR Activity Policy. Based on this policy, we use our business activities to
contribute to the creation of a sustainable regional society as we meet the expectations of all stakeholders.

CSR Activity
Environmental VehiclesThe Chiba Bank is replacing its corporate fleet with
hybrid vehicles, mainly at the head office, and uses
electric vehicles, which have no CO2 emissions.
Chibagin ForestSince March 2003, the Chiba Bank has been involved
in forestry activities (Chibagin Forest) in order to nurture
vegetation that absorbs CO2. Bank employees work
with volunteers from nearby communities to plant trees
and preserve the forest.
* “Himawari” is Japanese for “sunflower,” which is the symbol of the Chiba Bank.
Energizing Regional Economies In November 2011, the Chiba Bank formed an alliance with the Chiba City municipal
government to establish an alliance for increasing the vitality of regional economies.
Through this collaboration, we will contribute to the local community in such ways as
the promotion of international economic interaction, support for attracting companies
and establishing new businesses, and programs to increase tourism.
Environmentally Responsible Branches To respond to climate change, the Chiba Bank installs
solar power systems and rooftop vegetation primarily at
new and renovated branches.
Himawari* Venture Development Fund Himawari Venture Development Fund has been making
development grants to assist new business ventures in Chiba
Prefecture. As of February 2012, grants totaling ¥435 million had
been distributed to 145 ventures since the fund was established
in 1998.
15
International Business Activities In June 2012, the Chiba Bank formed an alliance with the Chiba prefectural
government for cooperation in international business activities. The Bank and the
prefecture support companies in Chiba with increasing overseas sales channels
and promoting the growth of the tourism industry. Through these activities, we
plan to contribute to the vitality of the prefecture’s economy and offer new services
to our customers.
Compliance
Compliance
16
● The Chiba Bank Code of Ethics
Earning Unwavering TrustRemaining constantly aware of the social responsibility and public mission of a bank, the Chiba Bank will strive to earn the unwavering trust of society through sound, appropriate business operations based on the principle of self-responsibility.
Thorough Compliance with Laws, Rules and Other Funda-mental PrinciplesComplying strictly with all laws and rules and never deviating from social standards, the Chiba Bank will conduct fair and honest business activities.
Opposition to Antisocial ForcesThe Chiba Bank will firmly oppose antisocial forces and groups that threaten the order and safety of society and undermine healthy economic and social development.
Transparent ManagementThe Chiba Bank will provide active and fair disclosure of management information and manage its operations in a transparent manner.
Compliance StructureThe Chiba Bank is constantly working on making compliance activities even more effective. We are determined to conduct all of our business activities fairly and in good faith, by complying with all laws and regulations relating to banking transactions, by observing all internal rules and regulatory requirements pertaining to our role in society and by avoiding actions that would fall short of normal social expectations.
Specific action plans and measures to ensure compliance are formulated at regular meetings of the Compliance Committee. This committee is chaired by the President and consists of directors, executive officers, and divisional general managers.
The Compliance Division is responsible for various compliance-related tasks, including the administration of compliance regulations and manuals, the preparation and monitoring of training programs and periodic checks on the compliance situation. They also monitor branch-level compliance and provide advice, including on-site guidance.
Consistent Implementation of Basic PoliciesWe have a clearly defined code of conduct for employees in the form of the Chiba Bank Code of Ethics. To ensure that these rules are understood and observed, all employees receive a copy of our Compliance Manual, which contains specific guidelines.
Compliance ProgramEvery year, the Board of Directors establishes a compliance program to provide a specific action plan for achieving further improvements in compliance activities. The execution of this program is checked on a regular basis by the Board of Directors and Compliance Committee.
Protecting Customers and Personal InformationTo protect customers and offer them greater convenience, employees of the Chiba Bank receive guidance and training designed to ensure that everyone conducts business with sincerity and fairness. We pay particular attention to complex financial products with risks that include the possible loss of principal and to derivative transactions. In these cases, we comply with the Financial Instruments and Exchange Law and always perform proper solicitation and sales activities in line with the Chiba Bank Solicitation Policy. Furthermore, we plan to upgrade follow-up activities for customers who use these types of financial products.
Prevention of Money Laundering and Financial CrimesThe Chiba Bank has established a Management Policy to Prevent Money Laundering and Terrorism Financing Activities and follows this policy in making thorough efforts aimed at preventing these problems. In addition, we are reinforcing measures to protect customers from a variety of financial crimes.
Opposition to Antisocial ForcesThe Chiba Bank has added organized crime disclaimers to all transaction documentation, particularly deposit account regulations, bank transaction agreements, and loan agreements, and is actively adding more measures to counteract antisocial forces.
● Management Policy to Prevent Money Laundering and Terrorism Financing Activities
The Chiba Bank recognizes the importance of preventing money laundering and terrorism financing activities (“money laundering, etc.,” hereinafter) and has established appropriate internal systems for the prevention of money
laundering, etc.
(1) Unified control The roles and responsibilities of managers and others who are responsible for preventing money laundering, etc., are clearly defined and control is centralized based on the suitable cooperation of all related departments.
(2) Appropriate administrative proceduresThe Chiba Bank has established and upgraded administrative procedures that are needed for the prevention of money laundering, etc., such as verification of customer identification, confirming of frozen assets and other measures, and reports about suspicious transactions.
(3) Employee training programs There are continuous employee training programs on the prevention of money laundering, etc., to ensure that all employees are aware of the related laws and regulations and administrative procedures.
(4) Verification of effectivenessThe Chiba Bank monitors its internal management system regarding the prevention of money laundering, etc., verifies the effectiveness of these systems, and takes additional steps to upgrade these systems based on the outcomes of monitoring.

C O N T E N T S
18 Five-Year Summary (Consolidated)
19 Management’s Discussion and Analysis
20 Asset Quality
22 Risk Management
26 Consolidated Balance Sheets
27 Consolidated Statements of Income
27 Consolidated Statements of Comprehensive Income
28 Consolidated Statements of Changes in Net Assets
29 Consolidated Statements of Cash Flows
30 Notes to Consolidated Financial Statements
52 Independent Auditor’s Report
53 Non-Consolidated Balance Sheets (Unaudited)
54 Non-Consolidated Statements of Income (Unaudited)
55 Supplementary Information (Unaudited)
57 Corporate Governance
58 Organization
59 Directors, Executive Officers and Corporate Auditors
60 Subsidiaries
60 International Directory
61 Corporate Data
Financial and Corporate Information
17

18
Millions of YenThousands ofU.S. Dollars
2012 2011 2010 2009 2008 2012
For the Year:
Total Income ¥ 225,435 ¥ 229,583 ¥ 241,443 ¥ 262,859 ¥ 274,252 $ 2,742,864
Total Expenses 155,950 159,417 178,087 248,118 192,792 1,897,443
Income Before Income Taxes and Minority Interests 69,485 70,166 63,356 14,741 81,460 845,421
Net Income before Minority Interests 41,487 41,458 38,246 12,789 46,625 504,779
Net Income 40,770 40,611 37,579 12,392 45,980 496,056
At Year-End:
Total Assets ¥10,916,760 ¥10,552,989 ¥10,261,464 ¥10,062,926 ¥9,835,939 $132,823,463
Loans and Bills Discounted 7,554,923 7,346,143 7,130,386 6,955,624 6,624,687 91,920,230
Securities 2,106,492 1,920,113 1,977,849 1,893,075 2,045,011 25,629,542
Deposits 9,639,615 9,275,235 8,966,015 8,654,989 8,504,095 117,284,528
Net Assets 664,076 625,990 605,598 537,671 580,168 8,079,769
Capital Ratio (BIS guidelines) 14.35% 13.37% 12.80% 11.70% 12.20%
PER (Times) 11.36 10.20 13.29 34.98 13.16
PBR (Times) 0.70 0.67 0.84 0.82 1.06
Yen U.S. Dollars
Per Share:
Net Income ¥ 46.47 ¥ 45.65 ¥ 42.04 ¥ 13.86 ¥ 51.43 $0.57
Net Assets 747.90 692.74 662.90 587.51 634.94 9.10
Note: Japanese yen amounts less than 1 million have been rounded down.
U.S. dollar amounts are shown solely for the convenience of the readers of this Annual Report and are translated at the rate of ¥82.19 to $1.00, the exchange rate prevailing
at March 31, 2012.
Five-Year Summary (Consolidated)The Chiba Bank, Ltd. and Consolidated SubsidiariesYears ended March 31
Financial and Corporate Information
19
F i n a n c i a l a n d C o r p o r a t e I n f o r m a t i o n
Financial and Economic Environment
The Japanese economy began to recover slowly after the Great
East Japan Earthquake and nuclear power plant incident. Early
in FY2011, the year ended March 31, 2012, manufacturing
rebounded along with the restoration of disrupted supply chains
and the growth in consumer spending, mainly for energy-saving
products. In the second half of the fiscal year, the Japanese
economy continued to recover due to the supplementary budget
for earthquake reconstruction and to healthy consumer spending.
On the other hand, economic uncertainty increased, including the
outlook for exports, due to the deepening European debt issue and
the persistently strong yen.
In financial markets, the unsecured overnight call rate remained
below 0.1% during the entire fiscal year. The interest rate of 10-year
government bonds remained at around 1.0% during the fiscal year,
briefly rising to the 1.3% level due to the effects of the earthquake.
The Nikkei Stock Market Index fell below ¥8,100 at one point
because of slowing global economic growth and other sources of
concern, then subsequently rallied to more than ¥10,000 late in the
fiscal year due to additional monetary easing by the Bank of Japan
and a decline in the yen from its record highs.
Business Performance
Deposits increased ¥364.3 billion from the end of the previous fiscal
year to ¥9,639.6 billion. We offered a diverse lineup of financial
products and services with the aim of serving as the main bank for
more households, such as for accounts used for receiving salaries
or pension payments.
Loans and bills discounted increased ¥208.7 billion to ¥7,554.9
billion due to our extensive measures to meet the funding demands
of corporate and individual customers. As a result, total assets
at March 31, 2012 increased ¥363.7 billion from the end of the
previous fiscal year to ¥10,916.7 billion.
Income and Expenses
Consolidated total income decreased ¥4,148 million to ¥225,435
million mainly because of a decline in interest income caused
by lower interest rates. Consolidated total expenses decreased
¥3,466 million to ¥155,950 million. The main reasons were an
improvement in disposal of non-performing loans and a decrease
in interest expenses including interest on deposits.
Consolidated net income increased ¥159 million to ¥40,770
million. Deferred income taxes increased because of a revision in
the statutory effective tax rate. Net income also reflects a gain from
negative goodwill resulting from the share exchange that made
consolidated subsidiary Chibagin Securities Co., Ltd., a wholly
owned subsidiary.
Cash Flows
Net cash provided by operating activities was a net inflow of ¥59.9
billion mainly due to a net increase in deposits, a decrease of ¥21.4
billion from a net inflow of ¥81.4 billion in the previous fiscal year.
Net cash used in investing activities was a net outflow of ¥188.0
billion mainly due to purchase of securities, a decrease of ¥220.7
billion from a net inflow of ¥32.6 billion in the previous fiscal year.
Net cash used in financing activities was a net outflow of ¥15.8
billion mainly due to cash dividends paid, a decrease of ¥0.7 billion
from a net outflow of ¥15.1 billion in the previous fiscal year.
As a result, cash and cash equivalents was ¥274.8 billion at the
end of FY2011, a decrease of ¥144.0 billion.
Dividend Policy
The basic policy is to use capital effectively for our growth and to
enhance shareholder returns through stable dividends and the
acquisition of our own shares, whilst maintaining the Chiba Bank’s
sound financial health and fulfilling our important public role. In line
with this policy, we make dividend payments twice each fiscal year:
an interim dividend paid with a September 30 date of record and a
year-end dividend paid with a March 31 date of record. The interim
dividend is approved by the Board of Directors and the year-end
dividend by the General Meeting of Shareholders. For FY2011,
shareholders approved a year-end dividend of ¥5.5 per share. With
the interim dividend, this results in a total FY2011 dividend of ¥11
per share.
Outlook for FY2012
In the fiscal year ending March 31, 2013, the Chiba Bank Group
projects ordinary profit of ¥69.0 billion and net income of ¥42.0
billion on a consolidated basis.
On a non-consolidated basis, the Chiba Bank projects ordinary
profit of ¥64.0 billion, and net income of ¥40.0 billion. The dividend
forecast for the fiscal year is ¥11 per share, the sum of interim and
year-end dividends of ¥5.5 each.
Management’s Discussion and Analysis

20
The Chiba Bank is constantly working on preserving and improving
the quality of its assets by using measures such as proper handling
of non-performing loans, prevention of new occurrences of non-
performing loans, and support to the financial rehabilitation of
borrowers.
Non-performing loans are loans and other claims for which
the collection of principal and interest are in doubt because of a
bankruptcy or poor business performance.
Interest income from loans and other assets is the primary source
of income for a bank. Consequently, difficulties in the collection of
loans may have a material impact on a bank’s financial condition.
To maintain the quality of assets, we have upgraded and enhanced
thorough credit screening and risk management systems.
Claims disclosed under the Financial Reconstruction Law were
¥160.1 billion as of March 31, 2012, and the non-performing loan
ratio was 2.08%.
The headquarters office and branch offices of the Chiba Bank
will continue to work together, while using the resources of Small
and Medium Enterprises Revitalization Support Councils and other
external organizations, to extend support that enables customers
to improve their business operations.
Self-Assessment and Debtor Classification
Self-assessment of assets is the process whereby financial
institutions individually review and analyze assets and classify them
on the basis of asset value impairment and the risk of default.
Loans and other assets are classified into five categories according
to debtor creditworthiness: Normal Debtors, Debtors Requiring
Caution, Potentially Bankrupt Debtors, Effectively Bankrupt
Debtors, and Bankrupt Debtors. In the Debtors Requiring Caution
category, borrowers for whom loan repayment terms have been
eased are classified as Substandard Debtors.
Disposal of Non-Performing Assets
The Chiba Bank has taken appropriate measures to dispose of
non-performing assets by implementing write-offs and providing
allowances at the end of each quarter on the basis of the results
of a rigorous self-assessment of assets. With respect to major
debtors, the Chiba Bank calculates the allowance for loan losses
using the Discounted Cash Flow (DCF) method for Substandard
Assets and Potentially Bankrupt Assets.
Moreover, the allowance for loan losses from Bankrupt Debtors
and Effectively Bankrupt Debtors makes up the full amount of the
Debtor Classification
Normal Debtors Debtors whose business situation is good and whose financial position gives no cause for concern.
Debtors Requiring CautionDebtors who are viewed with concern because of stagnant or unstable business performance, including losses.
Potentially Bankrupt Debtors Debtors who are not currently bankrupt but are seen as being at serious risk of bankruptcy.
Effectively Bankrupt DebtorsDebtors who are bankrupt in real terms, even though legal and formal bankruptcy proceedings have not been implemented.
Bankrupt DebtorsDebtors who have become bankrupt under various circumstances, including bankruptcy procedures, corporate liquidation, corporate rehabilitation and civil rehabilitation.
Risk-Monitored Loans (¥ Billion)
Non-Consolidated Consolidated
As of March 31, 2011 As of March 31, 2012 As of March 31, 2011 As of March 31, 2012
Loans to Bankrupt Borrowers 3.2 4.4 3.0 4.0
Delinquent Loans 83.8 97.2 84.5 96.7
Loans Past Due 3 Months or More 4.1 3.6 4.1 3.6
Restructured Loans 54.2 54.5 54.3 54.6
Total 145.5 159.9 146.0 159.1
Asset Quality
21
F i n a n c i a l a n d C o r p o r a t e I n f o r m a t i o n
claims not covered by collateral. The allowance for loan losses from
Potentially Bankrupt Debtors is equal to the amount of expected
losses calculated on the past loan loss ratio, as a rule.
The coverage ratio, calculated as the allowance for loan losses
added to collateral and guarantees stands at 72.1%, indicating a
high level of security on the basis of claims disclosed under the
Financial Reconstruction Law and limited cause for concern about
the occurrence of future losses.
Disclosure of Non-Performing Assets
Under banking regulations, disclosure of non-performing assets
includes reporting of 1) risk-monitored loans as defined in the
Banking Law (hereinafter Risk-monitored Loans) and 2) disclosed
claims under the Financial Reconstruction Law.
Disclosure of Risk-monitored Loans includes only the amount
of such loans, while disclosed claims under the Financial
Reconstruction Law include customer’s liabilities for acceptances
and guarantees other than loans, accrued interest, foreign
exchange, and other assets, with the exception of Substandard
Claims.
Risk-Monitored Loans
In the classification of Risk-monitored Loans, Loans to Bankrupt
Borrowers corresponds to Bankrupt Assets under self-assessment,
Delinquent Loans corresponds to Effectively Bankrupt Assets and
Potentially Bankrupt Assets under self-assessment, Loans Past Due
Three Months or More and Restructured Loans correspond to loans
delinquent three months or more and loans for which repayment
terms have been eased, respectively, in Assets Requiring Caution.
Disclosed Claims under the Financial Reconstruction Law
With regard to disclosure of claims under the Financial
Reconstruction Law, the Chiba Bank discloses Claims of Bankrupt
Debtors and Effectively Bankrupt Debtors under self-assessment as
Bankrupt and Substantially Bankrupt Claims, Claims of Potentially
Bankrupt Debtors under self-assessment as Doubtful Claims, and
loans delinquent by three months or more and loans for which
repayment terms have been eased in Claims of Debtors Requiring
Caution under self-assessment as Substandard Claims.
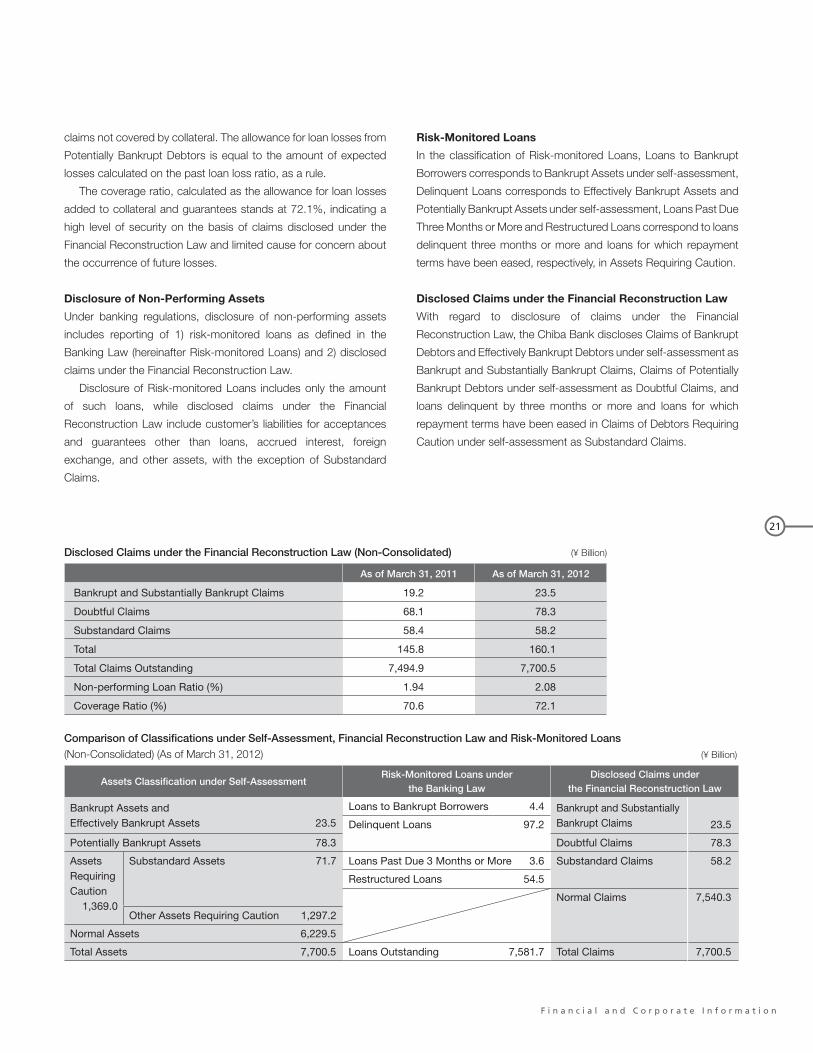
Disclosed Claims under the Financial Reconstruction Law (Non-Consolidated) (¥ Billion)
As of March 31, 2011 As of March 31, 2012
Bankrupt and Substantially Bankrupt Claims 19.2 23.5
Doubtful Claims 68.1 78.3
Substandard Claims 58.4 58.2
Total 145.8 160.1
Total Claims Outstanding 7,494.9 7,700.5
Non-performing Loan Ratio (%) 1.94 2.08
Coverage Ratio (%) 70.6 72.1
Comparison of Classifications under Self-Assessment, Financial Reconstruction Law and Risk-Monitored Loans (Non-Consolidated) (As of March 31, 2012) (¥ Billion)
Assets Classification under Self-AssessmentRisk-Monitored Loans under
the Banking LawDisclosed Claims under
the Financial Reconstruction Law
Bankrupt Assets andEffectively Bankrupt Assets 23.5
Loans to Bankrupt Borrowers 4.4 Bankrupt and SubstantiallyBankrupt ClaimsDelinquent Loans 97.2 23.5
Potentially Bankrupt Assets 78.3 Doubtful Claims 78.3
Assets RequiringCaution
1,369.0
Substandard Assets 71.7 Loans Past Due 3 Months or More 3.6 Substandard Claims 58.2
Restructured Loans 54.5
Normal Claims 7,540.3
Other Assets Requiring Caution 1,297.2
Normal Assets 6,229.5
Total Assets 7,700.5 Loans Outstanding 7,581.7 Total Claims 7,700.5

22
Risk Management
Integrated Risk Management System
The principal forms of risk to which banking operations are subject include
credit risk, market risk, and operational risk. In order to improve profitability and
ensure sound business operations, the Chiba Bank considers it necessary to
not only individually manage each of these forms of risk, but also to centrally
monitor those risks to control within acceptable overall limits.
Accordingly, in addition to assigning divisions to manage overall risk in the
Group for each form of risk, the Chiba Bank has an integrated risk management
system in which the Risk Management Division centrally monitors these risks.
The division engages in detailed management and discussions of risks at
meetings of the ALM Committee, Credit Risk Management Committee,
and Operational Risk Management Committee and reports to the Board of
Directors on risk-related matters. In addition, the division is developing an
integrated risk management system for considering and implementing risk
countermeasures.
To ensure an effective risk management system, the Audit and Inspection
Division periodically conducts audits to determine whether risk management
is appropriately implemented and reports the audit results to the Board of
Directors.
Integrated Risk Management
The basis of risk management at the Chiba Bank is the integrated
management of various risks using uniform measures to the extent possible.
The term Integrated risk refers to the sum of credit risk, market risk, and
operational risk measurement, forms of risk that can be managed by means
of risk quantification.
The Risk Management Department in the Risk Management Division, the
section responsible for integrated risk management, conducts a comparison
of quantified integrated risk and capital, verifies the sufficiency of capital with
respect to risk, and reports the results quarterly to the Board of Directors.
The division also conducts stress tests, a means of verification of capital
sufficiency in times of stress that involves the assumption of certain stress
scenarios, such as deterioration of the corporate environment in a period of
recession, or a decrease in land prices, and forecasting the increase in the
amount of risk based on the scenarios.
The Chiba Bank has introduced a risk capital allocation system as
a concrete framework for integrated risk measurement. A risk capital
allocation system is a mechanism for engaging in business operations
that duly recognizes risk and return, such as profitability improvement at
business sectors and the effective utilization of capital. The system ensures
management soundness by means of the pre-allocation of risk capital (the
amount of acceptable risk) to areas such as the domestic banking sector and
treasury sector within the scope of capital, an indicator of financial strength.
Credit Risk Management
Credit risk is the risk of incurring a loss because of a decline in, or total loss
of, the value of owned assets as a result of deterioration in the financial
soundness of debtors. Credit risk accounts for a major portion of risk in
banking operations.
The Chiba Bank has developed a rigorous credit risk management
system centered on an internal credit rating system and engages in
individual credit management and credit portfolio management. In the self-
assessment of assets, the Chiba Bank implements appropriate write-offs
and provisions and has introduced a rating and self-assessment system
linked to internal credit ratings to upgrade credit risk management.
Also the Chiba Bank has long ensured the independence of the sections
involved in credit risk. Specifically, the credit screening and administrative
sections manage credit risk for individual business transactions in the credit
executing section (banking offices and the sales promotion divisions). The
Credit Risk Management Department in the Risk Management Division,
whose organization and operation are independent from the credit screening
and administrative sections and the credit executing sections, is a credit
risk management section that engages in unified management of overall
credit risk. The Risk Management Department in the Risk Management
Division is a unified risk management section that engages in the integrated
management of all forms of risk, including credit risk. The Audit and
Inspection Division audits operations in the business units involved in credit
risk management.
The Credit Risk Management Committee meets regularly and considers
credit risk management policy, monitors the operation of the internal credit
rating system and the credit portfolio, and works to ensure the quality of
loan assets.
Internal Credit Rating System
The Chiba Bank uses an internal credit rating system to place borrowers
into 15 credit rating categories on the basis of financial data such as
financial condition and cash flow. We strive to enhance the identification
and examination of the financial circumstances at companies, the starting
point of credit risk management, by means of periodic annual reviews and
reviews at other times in accordance with the status of individual debtors.
The internal credit rating system is the core of credit risk management and
is extensively used in actual management, such as credit pricing standard
and approval authorization.
Individual Asset Credit Management
The banking branches or offices and the Credit and Supervisory
Department in the Credit Division take the lead with regard to examining
individual applications for credit, engaging in rigorous investigations in
accordance with screening criteria on the basis of the basic principles of
credit (safety, profitability, liquidity, growth potential and public good). The
Business Support Department in the Business Support Division provides
support for the financial soundness of borrowers who need to improve
their operations, and the Credit Administration Department in the Business
Support Division engages in resolution and collection activities with regard
23
F i n a n c i a l a n d C o r p o r a t e I n f o r m a t i o n
to Bankrupt Debtors and other borrowers. The Chiba Bank strives to
accumulate high-quality loan assets and minimize future losses through
this practice of advanced screening and supervision after credit has been
extended.
Credit Portfolio Management
Credit portfolio management is the management of the risk of incurring a
major loss at one time due to the concentration of individual loans in specific
countries or specific industries. The Credit Risk Management Department in
the Risk Management Division monitors the state of credit risk from various
perspectives, such as by country, by industry, and by customer credit rating.
In credit portfolio management, the Chiba Bank engages in the
quantification of credit risk. The quantification of credit risk is the forecasting
by statistical methods of the amount of future losses (the amount of risk)
forecasted to occur due to circumstances such as borrower bankruptcy
or worsening business performance. We measure value at risk (VaR: the
assumed maximum loss) as the amount of risk and strive to increase the
soundness of the credit portfolio by further elaborating and developing
quantification by accumulating and organizing default data and loan recovery
data from defaulted borrowers.
By importing the quantitative results into various systems, we utilize them
in loan pricing that reflects credit risk and other processes. In this way, we aim
to ensure more appropriate interest rate levels than were previously possible
and refine risk management.
Self-Assessment of Assets
Self-assessment of assets is the practice whereby financial institutions
review and analyze their own assets individually and classify them on the
basis of asset value impairment and the risk of default. Self-assessment
of assets is obligatory for financial institutions under the system of prompt
corrective action under the Banking Law. The system of prompt corrective
action is a system by which administrative measures are triggered in
accordance with the state of the capital ratio of financial institutions. A
prerequisite to the accurate calculation of capital is implementation of
appropriate write-offs and provisions and the preparation of financial
statements that to the extent possible objectively reflect the actual state
of asset quality.
At the Chiba Bank, branches and offices conduct self-assessments
of assets on the basis of Asset Self-Assessment Regulations, the credit
screening and administrative sections check details of self-assessments.
Next, the Audit and Credit Assessment Department in Audit and Inspection
Division conducts an audit to verify the accuracy of the self-assessment
results and process. According to the results of these assessments, the
Credit Risk Management Department in the Risk Management Division
calculates the amounts of provisions, and the Credit Administration
Department in the Business Support Division implements write-offs.
Finally, the Audit and Credit Assessment Department in Audit and
Inspection Division conducts an audit. Through this process, the Chiba
Bank rigorously maintains the soundness of its assets.
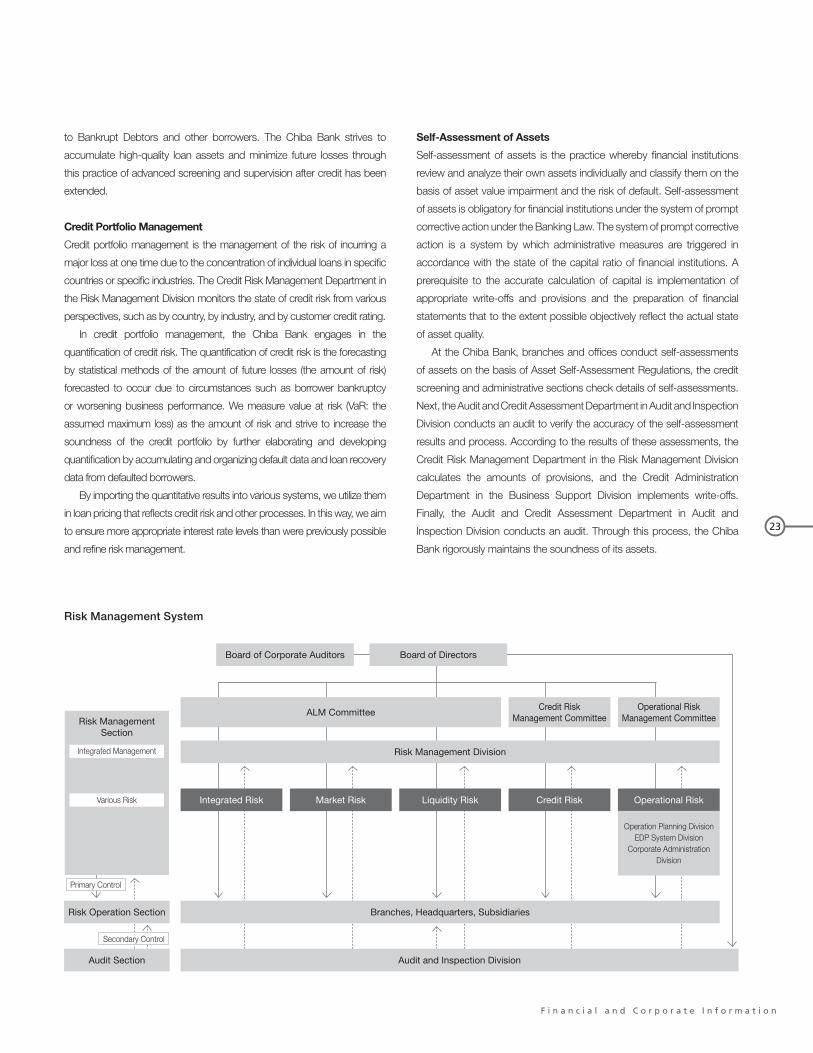
Risk Management System
Board of Corporate Auditors Board of Directors
ALM Committee
Risk Management Division
Credit RiskManagement Committee
Operational RiskManagement Committee
Operational Risk
Risk Operation Section
Audit Section
Operation Planning DivisionEDP System Division
Corporate AdministrationDivision
Primary Control
Risk Management Section
Integrated Management
Various Risk
Secondary Control
Branches, Headquarters, Subsidiaries
Audit and Inspection Division
Market RiskIntegrated Risk Credit RiskLiquidity Risk

24
Market Risk Management
Market risk is the risk of incurring a loss due to a change in the value
of owned assets as a result of fluctuations in interest rates, prices of
securities or other financial instruments, or exchange rates.
The Chiba Bank has introduced an ALM management system with
respect to market risk. The ALM Committee meets periodically to discuss
and decide detailed measures to counter interest rate risk, foreign
exchange risk and price fluctuation risk, and manage overall market risk.
Specifically, as part of the Risk Capital Allocation System, within the
scope of the risk capital allocated to the business sectors, the Chiba Bank
sets and manages upper guideline limits and alarm points for the amount
of market risk (value at risk or VaR: the assumed maximum loss) for each
product, such as securities investments and other market transactions
or loans and deposits. In this way, we strive to ensure management
soundness. In addition to VaR management of market transactions, the
Chiba Bank sets upper limits for market investments according to the
balance and alarm point of valuation differences and implements risk
control by reviewing investment policy each quarter.
With regard to market risk for market transactions for trading purposes
(trading with the aim of earning profit by means of short term fluctuations
in interest rates or prices), VaR is calculated on a daily basis, periodic
stress tests (the estimation and testing of losses in worst-case scenarios
that assume sudden market fluctuations) are conducted, and risk is
limited and the occurrence of major losses avoided through the setting of
maximum trading limits and the rigorous application of loss-cutting rules.
The allotment of market operations among the front office (the Treasury
Division and overseas branches), back office (Treasury Operation Division),
and middle office (the Market Risk Management Department in the Risk
Management Division) results in the mutual control of each section.
Liquidity Risk Management
Liquidity risk consists of cash flow risk and market liquidity risk. Cash
flow risk is the risk of incurring a loss due to failure to maintain cash flow
as a result of the inability to secure necessary funds or the necessity
of procuring funds at significantly higher interest rates than usual due
to the worsening of the financial institution’s financial position or other
circumstances. Market liquidity risk is the risk of incurring a loss due
to the inability to trade on markets or the necessity of trading at prices
significantly less favorable than usual due to market turmoil or other
circumstances.
At the Chiba Bank, the Treasury Division is the section that manages
cash flow. The division ascertains the market environment and analyzes
the state of investment and procurement of funds. With respect to cash
flow risk, the division engages in appropriate day-to-day cash flow
management through such means as the establishment of upper limits to
ensure that the amount of funds procured on the market is not excessive
and the maintenance of a certain minimum level of assets as a liquidity
reserve that can be converted to cash in a short time. The Chiba Bank
manages market liquidity risk by setting limits on daily positions taken in
market trading.
As the section that manages risk, the Market Risk Management
Department in the Risk Management Division strives to avoid increases in
liquidity risk by identifying and assessing various factors that affect liquidity
risk and monitoring the observance of limits. The ALM Committee meets
to discuss and decide matters related to liquidity risk, as it does with
market risk. The Chiba Bank also maintains a crisis management plan that
provides for a rapid, network-wide response in the event of unforeseen
circumstances that could affect the Chiba Bank’s cash flow.
Operational Risk Management
Operational risk is the risk of incurring losses due to the inappropriateness
of business processes, employee activities, or systems or external events.
The Chiba Bank classifies operational risk into clerical risk (described
below), system risk (described below), human risk, tangible asset risk,
and reputational risk. Human risk is the risk of a loss occurring due to
the workplace safety environment, discrimination, or the like. Tangible
asset risk is the risk of a loss occurring due to damage to buildings or
facilities or the like. Reputational risk is the risk of a loss occurring due to
loss of public confidence resulting from deterioration of the Chiba Bank’s
reputation.
In its risk management structure, the Chiba Bank decides the
corporate divisions having jurisdiction over the various forms of operational
risk (the Operation Planning Division for clerical risk, the EDP System
Division for system risk, the Human Resources Division for human risk,
and Corporate Administration Division for tangible asset risk), and the
divisions collaborate in risk management under the overall management
of the Risk Management Department in the Risk Management Division,
which is responsible for central oversight of risk. The Risk Management
Department in the Risk Management Division directly manages
reputational risk and, the Compliance Division jointly manages legal risk
and compliance-related risk included in the various risk categories with
the corporate divisions that have jurisdiction.
The Chiba Bank has an Operational Risk Management Committee. On
the basis of direct involvement in management, the committee receives
reports concerning the state of operational risk losses and develops a
management structure for improving and correcting problem areas by
means of a PDCA cycle involving the preparation of a risk management
plan, development of management regulations, and evaluation and
improvement. To ensure the effectiveness of management by means of
this PDCA cycle, the Chiba Bank has introduced Control Self-Assessment
(CSA), by which it formulates and implements measures to identify,
assess, monitor, and manage the details of risk, as well as to reduce
risk. Management by means of CSA entails responding to operational risk
loss events that have occurred at the Chiba Bank as well as preventing
25
F i n a n c i a l a n d C o r p o r a t e I n f o r m a t i o n
problems from occurring by evaluating the adequacy of the Chiba Bank’s
management system based on scenarios prepared by using loss events
that have occurred at other banks or in other industries and the devising
of countermeasures as necessary.
Clerical Risk Management
Clerical risk is the risk of incurring a loss due to the failure to perform
accurate clerical work, clerical accidents or fraud, or the failure to perform
official obligations or provide explanations to customers.
The Chiba Bank considers accurate clerical work to be essential to
obtaining the trust of customers, and the Operation Planning Division plays
a central role in the performance of exact clerical work in accordance with
basic procedures and in the effort to prevent clerical accidents.
Specifically, the division prepares clerical standards that indicate
detailed clerical procedures for each operation, ensures the correct
handling of cash, promissory notes, passbooks, and other important
items, provides guidance on clerical management systems at branches,
offices, and headquarters, and conducts training to raise the level of
clerical work.
The branches and offices periodically conduct self-assessments
and strive to ensure clerical accuracy and raise the level of clerical work
through monitoring and verification by the Operating Planning Division.
With regard to the auditing system, the Audit and Inspection Division
visits all branches, offices, and headquarters at least once a year and
conducts rigorous audits of all clerical work in accordance with auditing
standards. The division promptly notifies the branches, offices, and
headquarters of the audit results, periodically reports to the Board of
Directors, and implements a framework for reflecting audit results in
clerical improvements.
System Risk Management
System risk is the risk of incurring a loss resulting from a leak or falsification
of information owned by the Chiba Bank or the unauthorized use, failure,
or incorrect operation of computer systems. The Chiba Bank possesses
customer transaction data and various other types of information and has
developed systems to process that information. To ensure the provision
of various services to customers, the role of computer systems in banking
operations is increasing year by year, and the event of a system risk would
result in great inconvenience to customers. For this reason, we regard
system risk management as increasingly important.
The EDP System Division plays a central role in devising measures to
ensure the stable operation of computer systems. Specifically, the Chiba
Bank duplicates hardware and circuits for account systems, information
systems, and other backbone systems and maintains a framework for
rapidly switching to the backup system so that business can continue in
the event of failure. In addition, for all computer systems, including those
used individually at departments, the Chiba Bank takes every means
to prevent crime and guard against disaster, including rigorous data
management, barriers to prevent unauthorized access or the introduction
of viruses, and the preparation of a contingency plan to provide for
unforeseen circumstances such as large-scale disasters. The Audit and
Inspection Division conducts audits of computer systems throughout the
organization.
Business Continuity System
In addition to the risk management system described above, the
Chiba Bank maintains a business continuity system to allow essential
operations to continue for the preservation of the financial system during
an unexpected disaster such as an earthquake or pandemic influenza.
Centered in the Risk Management Department in the Risk Management
Division, this system focuses on the rapid restoration of operations that
the Chiba Bank was forced to suspend during an emergency.
After the Great East Japan Earthquake, the Chiba Bank has installed
emergency in-house power generators at more branches, upgraded
countermeasures against tsunami risk, expanded measures for persons
unable to return home due to a disaster, and taken other steps to continue
business operations following a disaster.
Basel II Compliance
Basel II (capital adequacy regulation applied in fiscal 2006) consists
of three pillars: Pillar 1 is a minimum capital ratio, which is the level of
capital required to cover a bank’s risk. Pillar 2 is the development of
capital strategies by banks and verification by regulatory authorities. Pillar
3 is assurance of market discipline through the increased disclosure
of information. Under the regulation, each bank selects a method of
calculating minimum required capital according to its risk profile and risk
management method.
The basic policy of the Chiba Bank is to expand its business by
upgrading internal management, and the Chiba Bank is proactively
complying with the regulation as part of its policy of building an integrated
risk management system. With regard to the calculation of minimum
required capital, we have been using the Foundation Internal Ratings-
Based (FIRB) Approach for credit risk and Standardized Approach for
operational risk (both approaches require the approval of the regulatory
authorities) since FY2006 and are more thoroughly reflecting risk in capital
ratio.
In response to the tighter restrictions on securitized products that
became effective at the end of December 2011, the Chiba Bank has
strengthened management system for these products, including the
use of more sophisticated monitoring methods. In addition, new capital
adequacy regulation (Basel III) is planned to become effective starting
with the fiscal year ending March 31, 2013. The Chiba Bank is currently
developing and strengthening management systems to comply with
these regulations.

26
Millions of Yen (Note 1)Thousands of
U.S. Dollars (Note 1)
2012 2011 2012Assets
Cash and Due from Banks (Note 27) ¥ 473,117 ¥ 569,455 $ 5,753,388Call Loans and Bills Bought 74,621 54,700 907,912 Receivables under Resale Agreements 29,992 9,996 364,914 Monetary Claims Bought 30,995 37,137 377,114 Trading Assets (Notes 6, 12 and 32) 327,044 284,635 3,979,131 Money Held in Trust (Note 34) 28,899 28,929 351,620 Securities (Notes 7, 12 and 32) 2,106,492 1,920,113 25,629,542 Loans and Bills Discounted (Notes 8 and 12) 7,554,923 7,346,143 91,920,230 Foreign Exchanges (Note 9) 2,205 3,034 26,830 Other Assets (Notes 10 and 12) 93,810 100,099 1,141,383 Tangible Fixed Assets (Note 11) 98,567 96,469 1,199,263 Intangible Fixed Assets 10,221 9,751 124,368 Deferred Tax Assets (Note 30) 34,506 49,839 419,836 Customers’ Liabilities for Acceptances and Guarantees 101,464 101,429 1,234,513 Allowance for Loan Losses (50,101) (58,747) (609,580)
Total Assets ¥10,916,760 ¥10,552,989 $132,823,463 Liabilities
Deposits (Notes 12 and 13) ¥ 9,639,615 ¥ 9,275,235 $117,284,528 Call Money and Bills Sold 34,095 23,797 414,836 Payables under Repurchase Agreements (Note 12) — 14,998 — Payables under Securities Lending Transactions (Note 12) 77,347 50,776 941,078 Trading Liabilities (Note 14) 29,403 26,674 357,744 Borrowed Money (Notes 12 and 15) 162,635 256,709 1,978,773 Foreign Exchanges (Note 16) 229 480 2,796 Bonds Payable (Note 17) 40,000 40,000 486,677 Other Liabilities (Note 18) 132,840 100,237 1,616,258 Provision for Retirement Benefits (Note 19) 19,531 19,238 237,642 Provision for Directors’ Retirement Benefits 228 229 2,783 Provision for Reimbursement of Deposits 1,522 950 18,530 Provision for Point Loyalty Programs 397 1,065 4,838 Reserve under the Special Laws 17 18 218 Deferred Tax Liabilities (Note 30) 113 — 1,386 Deferred Tax Liabilities for Land Revaluation (Note 20) 13,240 15,158 161,092 Acceptances and Guarantees 101,464 101,429 1,234,513
Total Liabilities ¥10,252,684 ¥ 9,926,998 $124,743,694 Net Assets
Capital Stock (Note 21) ¥ 145,069 ¥ 145,069 $ 1,765,046 Capital Surplus 123,591 123,380 1,503,732 Retained Earnings 376,039 344,884 4,575,250 Treasury Stock (8,480) (6,358) (103,177)
Total Shareholders’ Equity 636,220 606,975 7,740,851 Valuation Difference on Available-for-sale Securities (Note 35) 13,268 (1,115) 161,439 Deferred Gains or Losses on Hedges (1,549) (1,259) (18,855)Revaluation Reserve for Land (Note 20) 9,393 7,548 114,288
Total Accumulated Other Comprehensive Income 21,112 5,174 256,872 Subscription Rights to Shares 231 108 2,822 Minority Interests 6,511 13,732 79,225
Total Net Assets ¥ 664,076 ¥ 625,990 $ 8,079,769 Total Liabilities and Net Assets ¥10,916,760 ¥10,552,989 $132,823,463
See notes to consolidated financial statements.
Consolidated Balance SheetsThe Chiba Bank, Ltd. and Consolidated SubsidiariesAs of March 31, 2012

27
F i n a n c i a l a n d C o r p o r a t e I n f o r m a t i o n
Millions of Yen (Note 1)Thousands of
U.S. Dollars (Note 1)
2012 2011 2012
Income
Interest Income:
Interest on Loans and Discounts ¥126,320 ¥130,776 $1,536,933
Interest and Dividends on Securities 18,764 20,571 228,308
Other Interest Income 1,464 967 17,818
Trust Fees 1 2 15
Fees and Commissions 40,445 40,035 492,093
Trading Income (Note 22) 1,987 1,614 24,180
Other Ordinary Income (Note 23) 5,979 7,116 72,752
Other Income (Note 24) 30,473 28,498 370,764
Total Income ¥225,435 ¥229,583 $2,742,864
Expenses
Interest Expenses:
Interest on Deposits ¥ 5,952 ¥ 8,458 $ 72,429
Interest on Borrowings and Rediscounts 1,163 1,136 14,158
Other Interest Expenses 4,528 4,381 55,095
Fees and Commissions Payments 15,495 15,110 188,530
Other Ordinary Expenses (Note 25) 3,193 799 38,856
General and Administrative Expenses 88,381 88,017 1,075,338
Other Expenses (Note 26) 37,235 41,514 453,037
Total Expenses ¥155,950 ¥159,417 $1,897,443
Income before Income Taxes and Minority Interests 69,485 70,166 845,421
Income Taxes—Current 20,579 21,405 250,394
Income Taxes—Deferred 7,417 7,302 90,247
Net Income before Minority Interests 41,487 41,458 504,779
Minority Interests in Income 716 847 8,723
Net Income ¥ 40,770 ¥ 40,611 $ 496,056
See notes to consolidated financial statements.
Millions of Yen (Note 1)Thousands of
U.S. Dollars (Note 1)
2012 2011 2012
Income before Minority Interests ¥41,487 ¥41,458 $504,779
Other Comprehensive Income (Note 28)
Valuation Difference on Available-for-sale Securities 14,299 (6,927) 173,976
Deferred Gains or Losses on Hedges (290) 880 (3,535)
Revaluation Reserve for Land 1,883 — 22,915
Share of Other Comprehensive Income of Associates accounted for using Equity Method 0 (5) 10
Total Other Comprehensive Income 15,892 (6,052) 193,366
Comprehensive Income ¥57,380 ¥35,405 $698,146
(Breakdown)
Comprehensive Income Attributable to Owners of the Parent ¥56,748 ¥34,621 $690,449
Comprehensive Income Attributable to Minority Interests ¥ 632 ¥ 784 $ 7,696
See notes to consolidated financial statements.
Consolidated Statements of IncomeThe Chiba Bank, Ltd. and Consolidated SubsidiariesFor the year ended March 31, 2012
Consolidated Statements of Comprehensive IncomeThe Chiba Bank, Ltd. and Consolidated SubsidiariesFor the year ended March 31, 2012

28
Millions of Yen (Note 1)
Shareholders’ Equity Accumulated Other Comprehensive Income
CapitalStock
CapitalSurplus
RetainedEarnings
TreasuryStock
TotalShareholders’
Equity
ValuationDifference on
Available-for-saleSecurities
DeferredGains or
Losses onHedges
RevaluationReservefor Land
Total Accumulated
Other Comprehensive
Income
Subscription Rights
to SharesMinorityInterests
Total NetAssets
Balance at March 31, 2010 ¥145,069 ¥123,383 ¥313,990 ¥(1,257) ¥581,185 ¥ 5,754 ¥(2,139) ¥7,662 ¥11,277 ¥ — ¥13,135 ¥605,598
Net Income — — 40,611 — 40,611 — — — — — — 40,611
Cash Dividends — — (9,831) — (9,831) — — — — — — (9,831)
Purchase of Treasury Stock — — — (5,114) (5,114) — — — — — — (5,114)
Disposal of Treasury Stock — (2) — 14 11 — — — — — — 11
Reversal of Revaluation Reserve for Land — — 113 — 113 — — — — — — 113
Net Changes of Items other than Shareholders’ Equity — — — — — (6,869) 880 (113) (6,103) 108 596 (5,397)
Total of Items during FY2010 — (2) 30,893 (5,100) 25,790 (6,869) 880 (113) (6,103) 108 596 20,392
Balance at March 31, 2011 ¥145,069 ¥123,380 ¥344,884 ¥(6,358) ¥606,975 ¥ (1,115) ¥(1,259) ¥7,548 ¥ 5,174 ¥108 ¥13,732 ¥625,990
Net Income — — 40,770 — 40,770 — — — — — — 40,770
Cash Dividends — — (9,654) — (9,654) — — — — — — (9,654)
Purchase of Treasury Stock — — — (6,121) (6,121) — — — — — — (6,121)
Disposal of Treasury Stock — 211 — 3,999 4,211 — — — — — — 4,211
Reversal of Revaluation Reserve for Land — — 38 — 38 — — — — — — 38
Net Changes of Items other than Shareholders’ Equity — — — — — 14,384 (290) 1,844 15,938 122 (7,220) 8,840
Total of Items during FY2011 — 211 31,155 (2,122) 29,244 14,384 (290) 1,844 15,938 122 (7,220) 38,085
Balance at March 31, 2012 ¥145,069 ¥123,591 ¥376,039 ¥(8,480) ¥636,220 ¥13,268 ¥(1,549) ¥9,393 ¥21,112 ¥231 ¥ 6,511 ¥664,076
Thousands of U.S. Dollars (Note 1)
Shareholders’ Equity Accumulated Other Comprehensive Income
CapitalStock
CapitalSurplus
RetainedEarnings
TreasuryStock
TotalShareholders’
Equity
ValuationDifference on
Available-for-saleSecurities
DeferredGains or
Losses onHedges
RevaluationReservefor Land
Total Accumulated
Other Comprehensive
Income
Subscription Rights
to SharesMinorityInterests
Total NetAssets
Balance at March 31, 2011 $1,765,046 $1,501,158 $4,196,186 $ (77,358) $7,385,032 $ (13,573) $(15,321) $ 91,846 $ 62,952 $1,326 $167,079 $7,616,388
Net Income — — 496,056 — 496,056 — — — — — — 496,056
Cash Dividends — — (117,466) — (117,466) — — — — — — (117,466)
Purchase of Treasury Stock — — — (74,482) (74,482) — — — — — — (74,482)
Disposal of Treasury Stock — 2,574 — 48,664 51,238 — — — — — — 51,238
Reversal of Revaluation Reserve for Land — — 473 — 473 — — — — — — 473
Net Changes of Items other than Shareholders’ Equity — — — — — 175,013 (3,535) 22,442 193,920 1,496 (87,854) 107,563
Total of Items during FY2011 — 2,574 379,064 (25,819) 355,819 175,013 (3,535) 22,442 193,920 1,496 (87,854) 463,381
Balance at March 31, 2012 $1,765,046 $1,503,732 $4,575,250 $(103,177) $7,740,851 $161,439 $(18,855) $114,288 $256,872 $2,822 $ 79,225 $8,079,769
See notes to consolidated financial statements.
Consolidated Statements of Changes in Net AssetsThe Chiba Bank, Ltd. and Consolidated SubsidiariesFor the year ended March 31, 2012

29
F i n a n c i a l a n d C o r p o r a t e I n f o r m a t i o n
Millions of Yen (Note 1)Thousands of
U.S. Dollars (Note 1)
2012 2011 2012Cash Flows from Operating Activities:
Income before Income Taxes and Minority Interests ¥ 69,485 ¥ 70,166 $ 845,421 Depreciation and Amortization 7,340 6,538 89,311 Impairment Loss 139 317 1,699 Gain on Negative Goodwill (3,408) — (41,475)Equity in (Earnings) Losses of Affiliates (119) (146) (1,454)Increase (Decrease) in Allowance for Loan Losses (8,646) 342 (105,197)Increase (Decrease) in Provision for Directors’ Bonuses — (56) —Increase (Decrease) in Provision for Retirement Benefits 293 (44) 3,575 Increase (Decrease) in Provision for Point Loyalty Programs (667) (53) (8,125)Increase (Decrease) in Provision for Reimbursement of Deposits 572 (7) 6,970 Increase (Decrease) in Provision for Directors’ Retirement Benefits (0) (951) (11)Interest Income (146,549) (152,315) (1,783,059)Interest Expenses 11,644 13,975 141,682 Loss (Gain) Related to Securities 8,288 825 100,842 Loss (Gain) on Money Held in Trust 52 (340) 641 Loss (Gain) on Foreign Exchange Transactions 30 97 372 Loss (Gain) on Disposal of Fixed Assets 727 100 8,857 Net Decrease (Increase) in Trading Assets (42,409) 25,882 (515,996)Net Increase (Decrease) in Trading Liabilities 2,728 4,083 33,193 Net Decrease (Increase) in Loans and Bills Discounted (208,779) (215,757) (2,540,208)Net Increase (Decrease) in Deposits (excluding Negotiable Certificates of Deposit) 234,594 328,859 2,854,296 Net Increase (Decrease) in Negotiable Certificates of Deposit 129,785 (19,639) 1,579,086 Net Increase (Decrease) in Borrowed Money (excluding Subordinated Borrowings) (94,073) 150,683 (1,144,588)Net Decrease (Increase) in Due from Banks (excluding Due from BOJ) (47,688) (100,114) (580,226)Net Decrease (Increase) in Call Loans and Bills Bought and Others (33,774) 15,158 (410,927)Net Decrease (Increase) in Receivables under Securities Borrowing Transactions — 6,270 —Net Increase (Decrease) in Call Money and Bills Sold (4,700) (148,847) (57,190)Net Increase (Decrease) in Payables under Securities Lending Transactions 26,571 (60,129) 323,288 Net Decrease (Increase) in Foreign Exchanges—Assets 828 (223) 10,086 Net Increase (Decrease) in Foreign Exchanges—Liabilities (250) 265 (3,049)Interest and Dividends Received 148,600 155,537 1,808,015 Interest Paid (13,609) (15,990) (165,582)Other, net 47,223 33,647 574,562
Subtotal ¥ 84,228 ¥ 98,135 $ 1,024,807 Income Taxes Paid (24,259) (16,722) (295,161)
Net Cash Provided by (Used in) Operating Activities ¥ 59,969 ¥ 81,412 $ 729,646 Cash Flows from Investing Activities:
Purchase of Securities ¥(786,022) ¥(655,382) $(9,563,481)Proceeds from Sales of Securities 337,430 378,554 4,105,496 Proceeds from Redemption of Securities 274,630 320,565 3,341,413 Increase in Money Held in Trust (9,960) (1,588) (121,184)Decrease in Money Held in Trust 9,101 982 110,741 Purchase of Tangible Fixed Assets (9,704) (8,967) (118,071)Purchase of Intangible Fixed Assets (4,451) (3,958) (54,162)Proceeds from Sales of Tangible Fixed Assets 872 2,410 10,619 Proceeds from Sales of Intangible Fixed Assets 10 31 132
Net Cash Provided by (Used in) Investing Activities ¥(188,091) ¥ 32,647 $(2,288,498)Cash Flows from Financing Activities:
Increase in Subordinated Bonds ¥ 10,000 ¥ — $ 121,669 Redemption of Subordinated Bonds (10,000) — (121,669)Cash Dividends Paid (9,654) (9,831) (117,466)Cash Dividends Paid to Minority Shareholders (150) (187) (1,825)Purchase of Treasury Stock (6,121) (5,114) (74,482)Proceeds from Sales of Treasury Stock 52 11 636
Net Cash Provided by (Used in) Financing Activities ¥ (15,873) ¥ (15,121) $ (193,137)Effect of Exchange Rate Change on Cash and Cash Equivalents ¥ (30) ¥ (97) $ (372)Net Increase (Decrease) in Cash and Cash Equivalents ¥(144,026) ¥ 98,840 $(1,752,361)Cash and Cash Equivalents at Beginning of Period ¥ 418,865 ¥ 320,024 $ 5,096,304 Cash and Cash Equivalents at End of Period (Note 27) ¥ 274,838 ¥ 418,865 $ 3,343,943
See notes to consolidated financial statements.
Consolidated Statements of Cash FlowsThe Chiba Bank, Ltd. and Consolidated SubsidiariesFor the year ended March 31, 2012
30
1. Basis of Presentation
The Chiba Bank, Ltd. (the “Bank”) and its subsidiaries maintain their
books of accounts in accordance with the provisions set forth in the
Japanese Financial Instruments and Exchange Act and its related ac-
counting regulations and in conformity with accounting principles and
practices generally accepted in Japan, which are different in certain
respects as to the application and disclosure requirements of Inter-
national Financial Reporting Standards. The classification of accounts
is in conformity with the Ordinance for Enforcement of Banking Act
of Japan.
The accompanying consolidated financial statements have been
compiled from the consolidated financial statements issued domes-
tically in order to present them in a form which is more familiar to
readers outside Japan. Certain reclassifications and rearrangements
have been made to the financial statements for the previous year to
conform to the classification used in the financial statements for the
current year. In addition, the accompanying notes include information
that is not required under accounting principles generally accepted in
Japan, but is presented herein for the convenience of readers.
Japanese yen amounts are presented in millions of yen by round-
ing down figures below one million. As a result, the totals in Japanese
yen in the accompanying consolidated financial statements do not
necessarily agree with the sums of individual amounts.
U.S. dollar amounts are shown solely for the convenience of the
readers of this Annual Report and are translated at the rate of ¥82.19
to $1.00, the exchange rate prevailing at March 31, 2012.
2. Principles of Consolidation
The consolidated financial statements include the accounts of the
Bank and its subsidiaries, including Chibagin Guarantee Co., Ltd.,
Chibagin Leasing Co., Ltd., Chibagin Securities Co., Ltd. (Chibagin
Securities) and other subsidiaries. The number of consolidated sub-
sidiaries as of March 31, 2012 was 9 (9 as of March 31, 2011).
All significant inter-company accounts and transactions have been
eliminated. The consolidated financial statements do not include the
accounts of the Chibagin Computer Service Co., Ltd. and three other
subsidiaries, since the combined total assets, total revenue, net in-
come and retained earnings of these subsidiaries are not significant
and would not have a material impact on the consolidated financial
statements of the Bank. Nevertheless, the investments in these un-
consolidated subsidiaries are carried using the equity method and are
included in securities in the balance sheets. Also, the consolidated
financial statements do not include the accounts of five limited part-
nerships. The investments in these unconsolidated subsidiaries are
not accounted for by the equity method since net income and retained
earnings of these subsidiaries are not significant and would not have a
material impact on the consolidated financial statements of the Bank.
Two SPCs (Special Purpose Company) are not included since those
companies are not significant and would not have a material impact.
The difference between the cost and the underlying equity in the net
assets measured at their market value at dates of acquisition of con-
solidated subsidiaries is amortized in the year of acquisition.
Fiscal year-ends of all consolidated subsidiaries are at the end of
March.
3. Significant Accounting Policies
(1) Trading Account
The following criteria are applied in accounting for the Bank’s trading
assets and liabilities, and trading income and expenses:
Transactions that aim to gain a profit by arbitraging short term fluc-
tuations in interest rates, currency values and market prices, other
benchmarks in the traded securities’ market prices and by arbitraging
differentials between markets (hereafter “trading purposes”) are ac-
counted for under “Trading Assets” or “Trading Liabilities” on the bal-
ance sheets. Profit or loss from such transactions is recorded under
“Trading Income” or “Trading Expenses” on the consolidated state-
ments of income.
Trading securities and monetary claims, etc. held for trading pur-
poses are stated at market value at the end of the fiscal year. Trading-
related financial derivatives such as swaps, futures or options are valued
on the assumption that they were settled at the end of the fiscal year.
In the case of trading-related financial derivatives, “Trading In-
come/Expense” includes the interest received/paid during the fiscal
year and the difference between the amount of profit/loss based on
the assumption that transactions were settled at the end of the current
fiscal year and that at the end of the previous fiscal year.
(2) Securities
Held-to-maturity bonds are stated at amortized cost determined by
the moving average method. Investments in unconsolidated sub-
sidiaries not accounted for by the equity method are stated at cost
determined by the moving average method. Available-for-sale equity
shares and investment trusts listed on Japanese markets are stated at
the average market value during the last month of the fiscal year, and
other available-for-sale securities whose fair value can be estimated
are stated at fair value at the fiscal year end while their costs are cal-
culated mainly by the moving average method. Other non-marketable
securities whose fair value cannot be reliably estimated are stated at
cost determined by the moving average method or amortized cost.
Unrealized gains and losses on available-for-sale securities are in-
cluded in net assets, net of income taxes.
Moreover, the same way as above (1) and fair value method
based upon the market value at the fiscal year end are applied for the
valuation of securities that are held as trust assets in individually man-
aged money trusts with the principal objective of securities portfolio
management.
(3) Derivatives
Derivatives for purposes other than trading are also stated at fair
value.
Notes to Consolidated Financial StatementsThe Chiba Bank, Ltd. and Consolidated SubsidiariesFor the Year ended March 31, 2012

31
F i n a n c i a l a n d C o r p o r a t e I n f o r m a t i o n
(4) Tangible Fixed Assets
Depreciation for tangible fixed assets of the Bank is computed using
the declining-balance method. Principal useful lives are as follows:
Buildings ........................ 6 years to 50 years
Others ............................ 2 years to 20 years
Tangible fixed assets of the consolidated subsidiaries are depreciated
principally by the declining-balance method over the estimated useful
lives.
(5) Intangible Fixed Assets
Depreciation for intangible fixed assets is computed using the straight-
line method. Especially, depreciation for capitalized software for inter-
nal use is computed using the straight-line method based on useful life
determined by the Bank and its consolidated subsidiaries (5 years).
(6) Allowance for Loan Losses
Allowance made by the Bank was provided in accordance with the
internally established standards for write-offs and provisions.
For claims on borrowers that have entered into bankruptcy, special
liquidation proceedings or similar legal proceedings (“Bankrupt Bor-
rowers”), or borrowers that are not legally or formally insolvent but are
regarded as substantially in the same situation (“Effectively Bankrupt
Borrowers”), an allowance is provided based on the amount of claims,
after the write-off stated below, net of the expected amount of recov-
eries from collateral and guarantees.
For claims on borrowers that are not currently bankrupt but likely
to become bankrupt in the future (“Potentially Bankrupt Borrowers”),
an allowance is provided in the amount deemed necessary based on
an overall solvency assessment of the claims, net of the expected
amount of recoveries from collateral and guarantees.
For claims on Potentially Bankrupt Borrowers and on borrowers
whose loans are classified as “Loans past due 3 months or more” or
“Restructured Loans” over a certain amount, if future cash flows from
the collection of principal and interest are reasonably estimated, the
allowances for loan losses are calculated by “Discounted Cash Flow
Method,” by which the allowances for loan losses are calculated as
the difference between the booked amounts of the loans and the cash
flows discounted by the original contractual interest rates.
For other claims, an allowance is provided based on the historical
loan-loss ratio.
The operating divisions assess all claims in accordance with the
Bank’s policy and guidelines for the self-assessment of asset quality,
and the internal audit and inspection division, which is independent from
the operating divisions, audits these assessments. The allowance for
loan losses is provided based on the results of these assessments.
For collateralized or guaranteed claims on Bankrupt Borrowers
and Effectively Bankrupt Borrowers, the amount exceeding the es-
timated value of collateral and guarantees is deemed to be uncol-
lectible and written off against the total outstanding amount of the
claims. The amount of write-off as of March 31, 2012 was ¥47,135
million (¥46,493 million as of March 31, 2011). Allowance made by
consolidated subsidiaries for general claims is provided in the amount
deemed necessary based on the historical loan-loss ratio, and for
specific claims in the amount deemed uncollectible based on the re-
spective assessments.
(7) Provision for Retirement Benefits
The Bank has a provision for retirement benefits which is provided for
the payments of employees’ retirement benefits based on the esti-
mated amounts of the actuarial retirement benefit obligation and the
plan assets.
Net actuarial gain (loss) is amortized using the straight-line method
over 10 years commencing from the next fiscal year of incurrence.
(8) Provision for Directors’ Retirement Benefits
Provision for directors’ retirement benefits is provided for payment of
retirement benefits to directors and corporate auditors of consolidated
subsidiaries, in the amount deemed accrued until the fiscal year-end.
(9) Provision for Reimbursement of Deposits
Provision for reimbursement of deposits, which were derecognized
from liabilities, is based on the possible losses on the future claims of
withdrawal to prepare for depositor’s needs of withdrawal.
(10) Provision for Point Loyalty Programs
Provision for point loyalty programs which is provided for accumula-
tion of points granted to customers using the credit card of the Bank
or the consolidated subsidiaries based on the estimated amounts
equivalent to expected future usage of the points.
(11) Reserve under the Special Laws
Reserve under the special laws is a Reserve for Financial Products
Transaction Liabilities provided by Chibagin Securities. This reserve
is provided for losses from securities transactions pursuant to Article
46-5-1 of the Financial Instruments and Exchange Act and Article
175 of the Cabinet Office Ordinance on Financial Instrument Business
Operators, etc.
(12) Translation of Foreign Currencies
The Bank’s assets and liabilities denominated in foreign currencies
and overseas branches’ accounts are translated into Japanese yen
primarily at the exchange rate at the balance sheet date. Consolidated
subsidiaries’ assets and liabilities denominated in foreign currencies
are translated into Japanese yen at the exchange rate prevailing at the
fiscal year-end of each company.
(13) Lease Transactions
(As lessees)
The Bank and consolidated subsidiaries account for as operating
leases finance leases other than those that are deemed to transfer the

32
ownership of leased properties to the lessees, which commenced in
fiscal years beginning prior to April 1, 2008 (See Note 29).
(As lessors)
Finance leases other than those that are deemed to transfer the own-
ership of leased property to the lessees are accounted for as install-
ment sales.
(14) Hedge Accounting
i) Hedge of Interest Rate Risk
As for the hedge accounting method applied to hedging transac-
tions for interest rate risk arising from financial assets and liabili-
ties, the Bank applies the deferral hedge accounting stipulated in
the “Treatment for Accounting and Auditing of Application of Ac-
counting Standard for Financial Instruments in Banking Industry”
(JICPA Industry Audit Committee Report No. 24).
The Bank assesses the effectiveness of such hedges by
monitoring offsetting fluctuation of fair value by changes in inter-
est rates, of the hedged items (such as deposits and loans) and
hedging instruments (such as interest rate swaps) classified by
their maturity.
ii) Hedge of Foreign Currency Fluctuation Risk
As for the hedge accounting method applied to hedging transac-
tions for foreign currency fluctuation risk arising from foreign-cur-
rency-denominated financial assets and liabilities, the Bank ap-
plies the deferral hedge accounting stipulated in the “Treatment
for Accounting and Auditing concerning Accounting for Foreign
Currency Transactions in Banking Industry” (JICPA Industry Audit
Committee Report No. 25).
The Bank designates certain currency swaps and foreign
exchange swap transactions as hedges against fluctuation in
foreign currency exchange rates arising from foreign-currency
monetary claims and debts, and assesses the effectiveness of
such hedges by verifying that the Bank holds foreign currency
positions of the hedged items corresponding to the positions of
the hedging instruments.
In addition to the above accounting, the Bank applies for a
part of assets and liabilities the deferral hedge accounting method
or exceptional treatments permitted for interest rate swaps.
(15) Cash Flows
In preparing the consolidated statements of cash flows, cash and
due from the Bank of Japan are considered to be cash and cash
equivalents.
(16) Consumption Taxes
Consumption tax and municipal consumption tax of the Bank and its
domestic consolidated subsidiaries are accounted for using the tax-
excluded method.
(17) Appropriation of Retained Earnings
Dividends are recorded in the fiscal year in which the proposed ap-
propriation of retained earnings is approved by the Board of Directors
and by the general meeting of shareholders. There is a limit for divi-
dend by Article 18 of the Banking Act. An amount equal to 20% of the
aggregated amount of dividends shall be set aside as a legal reserve
or legal capital surplus, regardless of Article 445-4 of the Companies
Act of Japan.
4. Additional Information
From the beginning of the fiscal year ended March 31, 2012, the Bank
adopted ASBJ Statement No. 24 “Accounting Standard for Account-
ing Changes and Error Corrections” (December 4, 2009) and ASBJ
Guidance No. 24 “Guidance on Accounting Standard for Accounting
Changes and Error Corrections” (December 4, 2009) to make chang-
es in accounting principles and correction of errors. Accounting treat-
ment under this standard and guidance are as follows:
(1) Changes in Accounting Policies
When a new accounting policy is applied with revision of account-
ing standards, the new policy applied retrospectively unless the
revised accounting standards include specific transitional provi-
sions. When the revised accounting standards include specific
transitional provisions.
(2) Changes in Presentations
When the presentation of financial statements is changed, prior-
period financial statements are reclassified in accordance with the
new presentation.
(3) Changes in Accounting Estimates
A change in an accounting estimate is accounted for in the period
of the change if the change affects that period only, and is ac-
counted for prospectively if the change affects both the period of
the change and future periods.
(4) Corrections of Prior-Period Errors
When an error in prior-period financial statements is discovered,
those statements are restated.
(5) Changes in Expression of Figures
The revision of regulation on consolidated balance sheet (Septem-
ber 30, 2010) was applied from April 1, 2011 and applicable to fi-
nancial statements of the fiscal year 2011. Accordingly, the figures
of the fiscal year 2010 are shown as comparative information of the
fiscal year 2011.
5. Securities Borrowing Transactions
As for securities borrowed under repurchase agreement which the
Bank has the right to sell or pledge, ¥31,738 million was held in hand
on March 31, 2012 (¥10,948 million on March 31, 2011).

33
F i n a n c i a l a n d C o r p o r a t e I n f o r m a t i o n
6. Trading Assets
Millions of Yen (Note 1)Thousands of
U.S. Dollars (Note 1)
2012 2011 2012Trading Account Securities ¥ 10,223 ¥ 9,477 $ 124,383 Derivatives of Trading Securities 6 1 75 Trading-related Financial Derivatives 29,829 26,889 362,934 Other Trading Assets 286,985 248,266 3,491,738
Total ¥327,044 ¥284,635 $3,979,131
7. Securities
Millions of Yen (Note 1)Thousands of
U.S. Dollars (Note 1)
2012 2011 2012Japanese Government Bonds ¥1,064,937 ¥ 866,913 $12,957,019 Japanese Local Government Bonds 361,251 323,250 4,395,316 Japanese Corporate Bonds 224,898 264,965 2,736,320 Japanese Stocks 137,139 141,208 1,668,571 Other Securities 318,265 323,775 3,872,315
Total ¥2,106,492 ¥1,920,113 $25,629,542
Securities included investments in non-consolidated subsidiaries and
affiliates ¥3,314 million on March 31, 2012 (¥3,502 million on March
31, 2011).
Guarantee obligations for bonds in private placement (defined in
Article 2 (3) of Financial Instruments and Exchange Act) included in
Japanese Corporate Bonds was ¥33,680 million as of March 31,
2012 (¥40,800 million as of March 31, 2011).
8. Loans and Bills Discounted
(1) Loans and bills discounted:
Millions of Yen (Note 1)Thousands of
U.S. Dollars (Note 1)
2012 2011 2012Bills Discounted ¥ 24,531 ¥ 22,620 $ 298,478Loans on Bills 163,012 170,692 1,983,365 Loans on Deeds 6,826,284 6,547,478 83,054,925 Overdrafts 541,094 605,353 6,583,461
Total ¥7,554,923 ¥7,346,143 $91,920,230
Bills discounted are accounted for as financial transactions in accor-
dance with JICPA Industry Audit Committee Report No. 24. The Bank
has rights to sell or pledge bank acceptance bought, commercial bills
discounted, documentary bills and foreign exchanges bought without
restrictions.Their total face value as of March 31, 2012 was ¥25,111
million (¥22,808 million as of March 31, 2011).
Contracts of overdraft facilities and loan commitment limits are the
contracts that the Bank lends to customers up to the prescribed limits
in response to customers’ application of loan as long as there is no
violation of any condition in the contracts. The unused amount within
the limits was ¥2,044,681 million relating to these contracts, includ-
ing ¥1,958,444 million of which the term of contracts is less than one
year or revocable at any time as of March 31, 2012 (The respective
amounts were ¥1,855,235 million and ¥1,780,357 million as of March
31, 2011).
Since many of these commitments expire without being utilized,
the unused amount does not necessarily represent a future cash re-
quirement. Most of these contracts have conditions that the Bank can
refuse customers’ application of loan or decrease the contract limits
with proper reasons (e.g., changes in financial situation, deterioration
in customers’ creditworthiness). At the inception of contracts, the
Bank obtains real estate, securities, etc. as collateral if considered to
be necessary. Subsequently, the Bank performs periodic review of the
customers’ business results based on initial rules, and takes neces-
sary measures to reconsider conditions in contracts and/or require
additional collateral and guarantees.
Additionally, the unused amount within the limits of overdraft facili-
ties on General Accounts as of March 31, 2012 was ¥977,243 million
(¥989,717 million as of March 31, 2011). General Accounts are the
Ordinary Deposit Accounts that its depositors can overdraw up to the
amounts calculated by multiplying incidental Time Deposits and so on
by certain weight.
(2) Risk monitored loans:
Millions of Yen (Note 1)Thousands of
U.S. Dollars (Note 1)
2012 2011 2012Loans to Bankrupt Borrowers ¥ 4,095 ¥ 3,057 $ 49,826 Delinquent Loans 96,771 84,501 1,177,416 Loans Past Due 3 Months or More 3,686 4,180 44,854 Restructured Loans 54,604 54,325 664,371
Total ¥159,158 ¥146,064 $1,936,467
Loans to bankrupt borrowers represent non-accrual loans to borrow-
ers who are legally bankrupt as defined in Article 96 (1) (iii) and (iv) of
the Corporation Tax Act Enforcement Ordinance (Article 97 of 1965
Cabinet Order).
Delinquent loans represent non-accrual loans other than (i) loans
to bankrupt borrowers and (ii) loans of which payments of interest are
deferred in order to assist or facilitate the restructuring of borrowers in
financial difficulties.
Loans past due 3 months or more represent loans on which the
payment of principal and/or interest has not been received for 3
months or more from the due date, and which are not included in
Loans to bankrupt borrowers or Delinquent loans.
Restructured loans are loans which have been restructured to
support the rehabilitation of certain borrowers who are encountering
financial difficulties, with the intention of ensuring recovery of the loans
by providing easier repayment terms for the borrowers (such as by
reducing the rate of interest or by providing a grace period for the
payment of principal/interest, etc.) and are not classified in any of the
above categories.

34
9. Foreign Exchange Assets
Millions of Yen (Note 1)Thousands of
U.S. Dollars (Note 1)
2012 2011 2012Due from Foreign Banks (our accounts) ¥1,163 ¥2,156 $14,157 Foreign Bills Bought 585 190 7,125 Foreign Bills Receivable 456 686 5,548
Total ¥2,205 ¥3,034 $26,830
10. Other Assets
Millions of Yen (Note 1)Thousands of
U.S. Dollars (Note 1)
2012 2011 2012Domestic Exchange Settlement Account, debit ¥ 0 ¥ 814 $ 1 Accrued Income 12,248 12,692 149,026 Prepaid Expenses 412 392 5,017 Derivatives 10,014 16,115 121,844 Lease Investment Assets 34,475 34,526 419,464 Other 36,659 35,558 446,031
Total ¥93,810 ¥100,099 $1,141,383
11. Tangible Fixed Assets
Depreciation was computed using the declining-balance method.
Tangible fixed assets were shown at net of the following accumulated
depreciation:
Millions of Yen (Note 1)Thousands of
U.S. Dollars (Note 1)
2012 2011 2012¥89,965 ¥94,819 $1,094,607
Deferred gain on real estate deductible for tax purposes amounted
to ¥11,274 million on March 31, 2012 (¥11,232 million on March 31,
2011).
12. Assets Pledged
Millions of Yen (Note 1)Thousands of
U.S. Dollars (Note 1)
2012 2011 2012Securities ¥772,956 ¥678,540 $9,404,510 Trading Assets — 14,997 — Loans and Bills Discounted 82,288 99,234 1,001,195
Liabilities related to the above pledged assets were as follows:
Millions of Yen (Note 1)Thousands of
U.S. Dollars (Note 1)
2012 2011 2012Deposits ¥ 40,250 ¥ 30,397 $ 489,725 Payables under Repurchase Agreements — 14,998 — Payables under Securities Lending Transactions 77,347 50,776 941,078 Borrowed Money 129,135 223,109 1,571,181
In addition, the following was pledged as collateral for settlements of
exchange or margins for futures transactions.
Millions of Yen (Note 1)Thousands of
U.S. Dollars (Note 1)
2012 2011 2012Securities ¥167,771 ¥172,761 $2,041,265
Initial margins of futures markets of ¥84 million and guarantee depos-
its of ¥6,432 million were included in Other Assets as of March 31,
2012 (The respective amounts were ¥80 million and ¥6,078 million as
of March 31, 2011).
13. Deposits
Millions of Yen (Note 1)Thousands of
U.S. Dollars (Note 1)
2012 2011 2012Current Deposits ¥ 189,116 ¥ 173,921 $ 2,300,966 Ordinary Deposits 5,350,233 5,073,725 65,095,923 Savings Deposits 241,022 242,828 2,932,498 Deposits at Notice 6,465 6,330 78,666 Time Deposits 3,412,545 3,451,275 41,520,203 Other Deposits 138,860 155,567 1,689,509
Subtotal ¥9,338,244 ¥9,103,649 $113,617,765 Negotiable Certificates of Deposit 301,371 171,586 3,666,763
Total ¥9,639,615 ¥9,275,235 $117,284,528
14. Trading Liabilities
Millions of Yen (Note 1)Thousands of
U.S. Dollars (Note 1)
2012 2011 2012Derivatives of Trading Securities ¥ — ¥ 19 $ — Trading-related Financial Derivatives 29,403 26,654 357,744
Total ¥29,403 ¥26,674 $357,744
15. Borrowed Money
Millions of Yen (Note 1)Thousands of
U.S. Dollars (Note 1)
2012 2011 2012Borrowings from the Bank of Japan and Other Financial Institutions ¥162,635 ¥256,709 $1,978,773
Subordinated Borrowings of ¥33,000 million was included in Borrowed
Money as of March 31, 2012 (¥33,000 as of March 31, 2011).
16. Foreign Exchange Liabilities
Millions of Yen (Note 1)Thousands of
U.S. Dollars (Note 1)
2012 2011 2012Foreign Bills Sold ¥194 ¥435 $2,366 Foreign Bills Payable 35 44 430
Total ¥229 ¥480 $2,796

35
F i n a n c i a l a n d C o r p o r a t e I n f o r m a t i o n
17. Bonds Payable
Millions of Yen (Note 1)Thousands of
U.S. Dollars (Note 1)
2012 2011 2012Issuer: The Bank (Subordinated Bonds) ¥40,000 ¥40,000 $486,677
18. Other Liabilities
Millions of Yen (Note 1)Thousands of
U.S. Dollars (Note 1)
2012 2011 2012Domestic Exchange Settlement Account, credit ¥ 1,453 ¥ 6 $ 17,689 Accrued Expenses 10,511 12,791 127,898 Unearned Revenue 23,254 22,712 282,933 Income Taxes Payable 10,057 13,736 122,368Derivatives 13,205 17,862 160,667 Other 74,357 33,128 904,704
Total ¥132,840 ¥100,237 $1,616,258
19. Retirement Benefit Plans
The Bank and its consolidated subsidiaries have defined benefit plans,
i.e., lump-sum payment plans, welfare pension fund plans and tax-
qualified pension plans.
(1) The liabilities/assets for employees’ retirement benefit plans
were as follows:
Millions of Yen (Note 1)Thousands of
U.S. Dollars (Note 1)
2012 2011 2012Retirement Benefit Obligation ¥(68,906) ¥(66,623) $(838,384)Plan Assets at Fair Value 41,326 39,491 502,815 Unfunded Retirement Benefit Obligation (27,580) (27,131) (335,569)Unrecognized Actuarial Gain or Loss 10,908 9,888 132,722 Net Amount Accrued on the Balance Sheets (16,672) (17,242) (202,847)Prepaid Pension Cost 2,859 1,995 34,795 Provision for Retirement Benefits ¥(19,531) ¥(19,238) $(237,642)
(2) The components of retirement benefit cost were as follows:
Millions of Yen (Note 1)Thousands of
U.S. Dollars (Note 1)
2012 2011 2012Service Cost ¥ 1,910 ¥ 1,927 $ 23,248 Interest Cost 1,322 1,294 16,085 Expected Return on Plan Assets (1,381) (1,359) (16,804)Amortization of Actuarial Gain or Loss 1,847 1,863 22,484 Other (nonrecurring additional retirement allowance paid and other) 21 20 266 Net Periodic Retirement Benefit Cost ¥ 3,721 ¥ 3,746 $ 45,279
(3) Assumptions used in accounting for the above plans were as
follows:
2012 2011Discount Rate 2.0% 2.0%Expected Rate of Return on Plan Assets 3.5% 3.5%Amortization Period of Actuarial Gain or Loss 10 years 10 years
20. Revaluation Reserve for Land
Pursuant to the Law concerning Revaluation of Premises, premises
used for business operations have been revalued as of March 31,
1998. Premises revaluation gain was included in Net Assets, net of
income taxes.
Date of the revaluation: March 31, 1998
The method of the revaluation (set forth in Article 3 (3) of the Law):
Pursuant to Article 2 (4) of the Enforcement Ordinance for the Law
concerning Revaluation of Premises, the premises price for the revalu-
ation is determined based on the method established and published
by the Director General of National Tax Agency in order to calculate
the premises value for a basis of determining the taxable amount sub-
ject to premises value tax prescribed by Article 16 of the Premises
Value Tax Law, reflecting appropriate adjustments for land shape and
timing of the assessment.
The difference between the revalued carrying amount and the
fair value of premises revalued pursuant to Article 10 of the Law was
¥35,390 million as of March 31, 2012 (¥37,008 million as of March 31,
2011).
21. Capital Stock
The number of the Bank’s authorized shares was 2,500,000,000 as of
March 31, 2012 and 2011.
Number of Shares
2012 2011Shares in Issue 895,521,087 895,521,087
The number of treasury shares held by the Bank was 16,627 thou-
sand as of March 31, 2012 (11,859 thousand as of March 31, 2011).
22. Trading Income
Millions of Yen (Note 1)Thousands of
U.S. Dollars (Note 1)
2012 2011 2012Gains on Trading Account Securities Transactions ¥ 764 ¥ 491 $ 9,297 Income from Trading-related Financial Derivatives Transactions 804 554 9,790 Other Trading Income 418 568 5,093
Total ¥1,987 ¥1,614 $24,180
23. Other Ordinary Income
Millions of Yen (Note 1)Thousands of
U.S. Dollars (Note 1)
2012 2011 2012Gains on Foreign Exchange Transactions ¥1,483 ¥1,936 $18,044 Gains on Sales of Bonds 4,128 4,760 50,235 Income from Derivatives other than for Trading or Hedging 366 419 4,463 Other 0 0 10
Total ¥5,979 ¥7,116 $72,752

36
24. Other Income
Millions of Yen (Note 1)Thousands of
U.S. Dollars (Note 1)
2012 2011 2012Gains on Sale of Stocks and Other Securities ¥ 328 ¥ 534 $ 3,995 Gains on Money Held in Trust 379 658 4,619 Revenue on Lease 13,867 14,992 168,722 Recoveries of Written-off Claims 3,274 5,478 39,839 Reversal of Allowance for Loan Losses 2,161 — 26,304Gain on Negative Goodwill 3,408 — 41,475 Other 7,052 6,834 85,810
Total ¥30,473 ¥28,498 $370,764
25. Other Ordinary Expenses
Millions of Yen (Note 1)Thousands of
U.S. Dollars (Note 1)
2012 2011 2012Loss on Sales of Bonds ¥ 285 ¥731 $ 3,477 Loss on Redemption of Bonds 2,889 — 35,160 Loss on Devaluation of Bonds 17 67 219
Total ¥3,193 ¥799 $38,856
26. Other Expenses
Millions of Yen (Note 1)Thousands of
U.S. Dollars (Note 1)
2012 2011 2012Provision of Allowance for Loan Losses ¥ — ¥ 5,804 $ — Written-off of Loans 10,205 12,123 124,173 Losses on Sales of Stocks and Other Securities 8,673 1,414 105,527 Losses on Devaluation of Stocks and Other Securities 878 3,906 10,689 Loss on Money Held in Trust 432 317 5,260 Cost of Leased Assets 11,686 12,585 142,185 Provision for Reimbursement of Deposits 1,305 493 15,880 Loss on Disposal of Noncurrent Assets 740 547 9,004 Impairment Losses on Fixed Assets 139 317 1,699 Other 3,174 4,003 38,621
Total ¥37,235 ¥41,514 $453,037
27. Cash and Cash Equivalents
Millions of Yen (Note 1)Thousands of
U.S. Dollars (Note 1)
2012 2011 2012Cash and Due from Banks ¥ 473,117 ¥ 569,455 $ 5,756,388 Interest-bearing Deposits included in Due from Banks (excluding Due from BOJ) (198,278) (150,590) (2,412,445)Cash and Cash Equivalents ¥ 274,838 ¥ 418,865 $ 3,343,943
28. Other Comprehensive Income
Millions of Yen (Note 1)
Thousands of U.S. Dollars (Note 1)
2012 2012Valuation Difference on Available-for-sale Securities
Gains (Losses) Arising during the Fiscal Year ¥13,682 $166,475 Reclassification Adjustment to Profit or Loss 8,606 104,719
Amount Before Income Tax Effect 22,289 271,195 Income Tax Effect (7,990) (97,218)Total 14,299 173,976
Deferred gains or losses on hedgesGains (Losses) Arising during the Fiscal Year ¥ (3,759) $ (45,738)Reclassification Adjustment to Profit or Loss 3,473 42,256
Amount Before Income Tax Effect (286) (3,482)Income Tax Effect (4) (53)Total (290) (3,535)
Revaluation reserve for landGains (Losses) Arising during the Fiscal Year ¥ — $ — Reclassification Adjustment to Profit or Loss — —
Amount Before Income Tax Effect — — Income Tax Effect 1,883 22,915 Total 1,883 22,915
Share of other comprehensive income of associates accounted for using equity method
Gains (Losses) Arising during the Fiscal Year ¥ 0 $ 10 Reclassification Adjustment to Profit or Loss — —
Amount Before Income Tax Effect 0 10 Income Tax Effect — — Total 0 10
Total Other Comprehensive Income ¥15,892 $193,366
29. Lease Transactions
(1) Finance Lease Transactions
Millions of Yen (Note 1)Thousands of
U.S. Dollars (Note 1)
2012 2011 2012Lessee Side
Amount Corresponding to the Purchased Prices of the Leased Assets ¥306 ¥377 $3,729 Amount Corresponding to Accumulated Depreciation 88 143 1,078 Amount Corresponding to Balance at Fiscal Year-End ¥217 ¥233 $2,651
Millions of Yen (Note 1)Thousands of
U.S. Dollars (Note 1)
2012 2011 2012Amount Corresponding to Lease Payables (within 1 year) ¥ 14 ¥ 16 $ 180 Amount Corresponding to Lease Payables (over 1 year) 203 217 2,471
Total ¥217 ¥233 $2,651
Millions of Yen (Note 1)Thousands of
U.S. Dollars (Note 1)
2012 2011 2012Lease Fees Paid ¥16 ¥27 $195 Amount Corresponding to Depreciation 16 27 195
(Note i) The lease period is set at the useful life of the asset and the
straight-line method of depreciation is used to compute the
remaining value of the asset.
(Note ii) The amount corresponding to the Purchased Prices of the
Leased Assets presented above includes interest amounts
calculated under the interest method, as the balances of
Lease Payables are small as a percentage of the book value
of total tangible fixed assets.
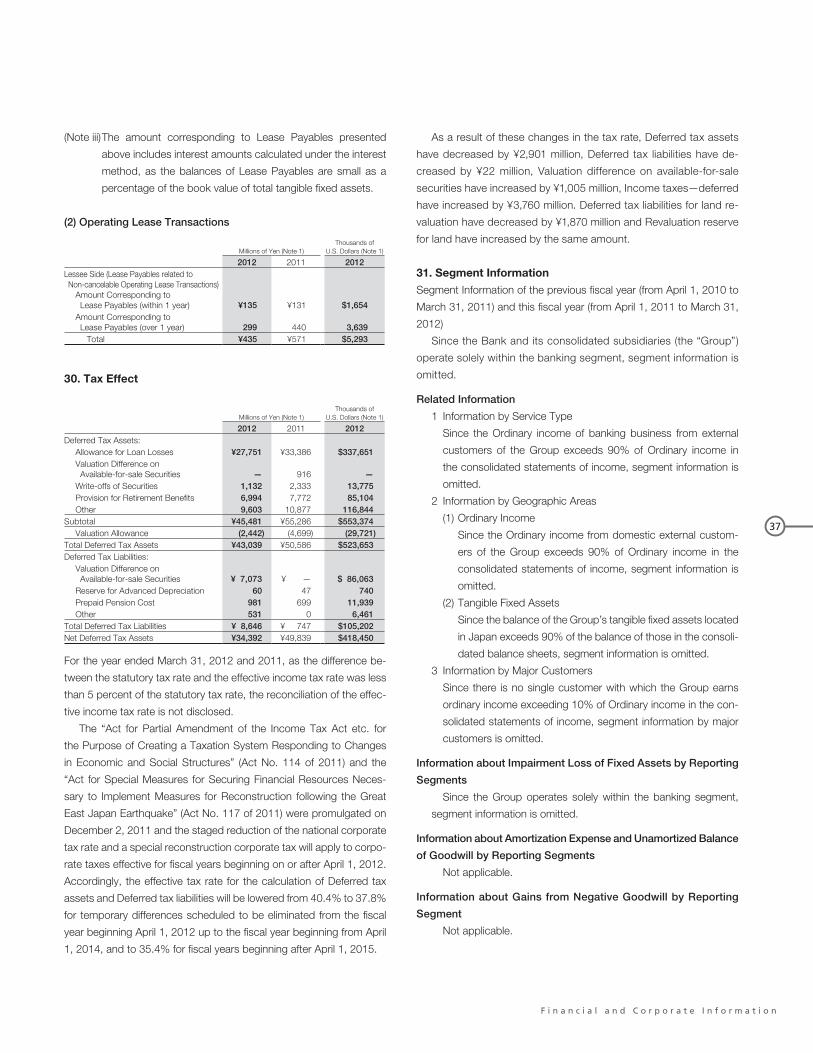
37
F i n a n c i a l a n d C o r p o r a t e I n f o r m a t i o n
(Note iii) The amount corresponding to Lease Payables presented
above includes interest amounts calculated under the interest
method, as the balances of Lease Payables are small as a
percentage of the book value of total tangible fixed assets.
(2) Operating Lease Transactions
Millions of Yen (Note 1)Thousands of
U.S. Dollars (Note 1)
2012 2011 2012Lessee Side (Lease Payables related to Non-cancelable Operating Lease Transactions)
Amount Corresponding to Lease Payables (within 1 year) ¥135 ¥131 $1,654 Amount Corresponding to Lease Payables (over 1 year) 299 440 3,639
Total ¥435 ¥571 $5,293
30. Tax Effect
Millions of Yen (Note 1)Thousands of
U.S. Dollars (Note 1)
2012 2011 2012Deferred Tax Assets:
Allowance for Loan Losses ¥27,751 ¥33,386 $337,651 Valuation Difference on Available-for-sale Securities — 916 — Write-offs of Securities 1,132 2,333 13,775 Provision for Retirement Benefits 6,994 7,772 85,104 Other 9,603 10,877 116,844
Subtotal ¥45,481 ¥55,286 $553,374 Valuation Allowance (2,442) (4,699) (29,721)
Total Deferred Tax Assets ¥43,039 ¥50,586 $523,653 Deferred Tax Liabilities:
Valuation Difference on Available-for-sale Securities ¥ 7,073 ¥ — $ 86,063 Reserve for Advanced Depreciation 60 47 740 Prepaid Pension Cost 981 699 11,939 Other 531 0 6,461
Total Deferred Tax Liabilities ¥ 8,646 ¥ 747 $105,202 Net Deferred Tax Assets ¥34,392 ¥49,839 $418,450
For the year ended March 31, 2012 and 2011, as the difference be-
tween the statutory tax rate and the effective income tax rate was less
than 5 percent of the statutory tax rate, the reconciliation of the effec-
tive income tax rate is not disclosed.
The “Act for Partial Amendment of the Income Tax Act etc. for
the Purpose of Creating a Taxation System Responding to Changes
in Economic and Social Structures” (Act No. 114 of 2011) and the
“Act for Special Measures for Securing Financial Resources Neces-
sary to Implement Measures for Reconstruction following the Great
East Japan Earthquake” (Act No. 117 of 2011) were promulgated on
December 2, 2011 and the staged reduction of the national corporate
tax rate and a special reconstruction corporate tax will apply to corpo-
rate taxes effective for fiscal years beginning on or after April 1, 2012.
Accordingly, the effective tax rate for the calculation of Deferred tax
assets and Deferred tax liabilities will be lowered from 40.4% to 37.8%
for temporary differences scheduled to be eliminated from the fiscal
year beginning April 1, 2012 up to the fiscal year beginning from April
1, 2014, and to 35.4% for fiscal years beginning after April 1, 2015.
As a result of these changes in the tax rate, Deferred tax assets
have decreased by ¥2,901 million, Deferred tax liabilities have de-
creased by ¥22 million, Valuation difference on available-for-sale
securities have increased by ¥1,005 million, Income taxes—deferred
have increased by ¥3,760 million. Deferred tax liabilities for land re-
valuation have decreased by ¥1,870 million and Revaluation reserve
for land have increased by the same amount.
31. Segment Information
Segment Information of the previous fiscal year (from April 1, 2010 to
March 31, 2011) and this fiscal year (from April 1, 2011 to March 31,
2012)
Since the Bank and its consolidated subsidiaries (the “Group”)
operate solely within the banking segment, segment information is
omitted.
Related Information
1 Information by Service Type
Since the Ordinary income of banking business from external
customers of the Group exceeds 90% of Ordinary income in
the consolidated statements of income, segment information is
omitted.
2 Information by Geographic Areas
(1) Ordinary Income
Since the Ordinary income from domestic external custom-
ers of the Group exceeds 90% of Ordinary income in the
consolidated statements of income, segment information is
omitted.
(2) Tangible Fixed Assets
Since the balance of the Group’s tangible fixed assets located
in Japan exceeds 90% of the balance of those in the consoli-
dated balance sheets, segment information is omitted.
3 Information by Major Customers
Since there is no single customer with which the Group earns
ordinary income exceeding 10% of Ordinary income in the con-
solidated statements of income, segment information by major
customers is omitted.
Information about Impairment Loss of Fixed Assets by Reporting
Segments
Since the Group operates solely within the banking segment,
segment information is omitted.
Information about Amortization Expense and Unamortized Balance
of Goodwill by Reporting Segments
Not applicable.
Information about Gains from Negative Goodwill by Reporting
Segment
Not applicable.

38
32. Financial Instruments
1. Disclosure on Financial Instruments
(1) Policy on Financial Instruments
The Group conducts market businesses such as deposit-taking,
lending and securities investments as a regional bank which is mainly
based on Chiba Prefecture.
The Group takes deposits, which are its main financing source,
and invests those deposits in corporate loans, personal housing
loans and securities. In order to manage these assets and liabilities
and also to make management plan in response to changes in mar-
ket environment, we have established ALM management system led
by ALM Committee.
(2) Types of and Risks Associated with Financial Instruments
Because of corporate and housing loans being our main financial as-
sets, we are exposed to credit risk which is the risk of losses on re-
ceivable such as those arising from nonperformance of borrowers.
We hold securities primarily comprising bonds, stocks and invest-
ment trusts for investment and operating purposes. These securities
have credit risk of the issuers and market risk arising from changes
in interest rates, prices and exchange rates.
The Group’s financial liabilities are mainly deposits from our indi-
vidual customers in Chiba Prefecture which consist of liquid deposits
and time deposits. These deposits have liquidity risk arising from
unexpected outflows of fund in certain situations.
The Group has interest rate risk caused by a mismatch in terms of
interest rates or time period between the assets (e.g., loans) and liabilities
(e.g., deposits). We in part hedge the risk using interest rate swaps.
We also have foreign exchange risk arising from a position mis-
match between the foreign currency denominated assets and liabili-
ties, which we in part hedge using currency swaps.
We utilize derivatives for purposes of: addressing customer's vari-
ous needs for investments and financing; managing risks from the
assets and liabilities, and; trading (i.e., for a gain from sales in a short
term). We enter into derivatives transactions to hedge interest rate
and exchange rate risks from the assets and liabilities as follows:
Hedged Item Hedging InstrumentInterest rate risk hedge Loans and bills discounted Interest rate swapsForeign exchange risk hedge Receivables and payables
denominated in foreign currencies
Currency swaps Forward foreign exchange
We apply hedge accounting to these transactions. Derivatives bear
market risk and credit risk like other transactions in markets.
Some of our subsidiaries have leasing credit and installment receiv-
ables which are subject to interest rate risk and credit risk.
(3) Risk Management Relating to Financial Instruments
i) Credit Risk Management
We have established the system of self-assessment of assets to
provide appropriate allowance and write-offs. We also perform
rigid credit risk management through individual credit manage-
ment and credit portfolio management based on internal rating
system. The Risk Management Division, which is responsible for
credit risk management, has been placed as a division indepen-
dent of the Credit Unit (including Credit Division) for a check-and-
balance effect. Further, the Credit Risk Management Committee
chaired by the President discusses plans and actions on credit
portfolios considering based on credit risk situations.
The details of credit risk management are follows:
(Individual Credit Management)
Branches and the Credit Division take the lead in credit review
in accordance with credit review standards under the basic prin-
ciples of credit (safety, profitability, liquidity, growth potential and
public good). The Business Support Division provides support for
customers who need to improve business operations while the
Credit Supervisory Division engages in resolution and collection
activities with regard to Bankrupt Borrowers and others. The Bank
strives to accumulate high-performing loan assets and minimize
future losses through these in-advance review and after-the-fact
administration.
(Credit Portfolio Management)
Credit portfolio management is to control risk of incurring a major
loss at a time due to concentration of individual loans in specific
countries or specific industries. The Risk Management Division
monitors the state of credit risk from various perspectives, such as
by country, by industry, and by customer credit rating. They also
establish policies and take actions such as setting credit limits to
control an increase in credit risk.
ii) Market Risk Management
We have established strict market risk management system in-
cluding risk limit monitoring. The Risk Management Division, which
is responsible for market risk management, has been placed as
a division independent of the Treasury Division and overseas
branches in business operation unit and the Treasury Operation
Division in business management unit, for a check-and-balance
effect. The ALM Committee chaired by the President discusses
plans and actions on overall management of the assets and liabili-
ties based on market risk situations. The following is how we set
and monitor the upper guideline limits:

39
F i n a n c i a l a n d C o r p o r a t e I n f o r m a t i o n
(Risk Limit Monitoring)
We set and monitor upper guideline limits to control market risk of
financial assets such as securities, loans and deposits. In order
to control an increase in market risk, we also set upper limits on
investment balances, average duration, 10BPV and unrealized
gains (losses) according to risk characteristics of transactions
and products, and utilize such limits as additional management
indicators. For trading, we set and monitor upper guideline limits
on positions and losses.
(Quantitative Information on Market Risk)
(a) Financial Instruments of Banking Account
We use VaR (the assumed maximum loss) for quantitative
analysis on market risk of financial instruments such as
available-for-sale securities, loans and deposits. For cal-
culating VaR, we have adopted the variance co-variance
model (holding period of 1 year; confidence interval of
99.9%; and observation period of 1 year), and the changes
of interest and stock price are considered. However, the
VaR based on holding period of 10 days is used for a part
of tradings such as market asset trading. Those VaR are
used for risk limit monitoring. Our VaR of banking business
is ¥85,965 million as of March 31, 2012 (¥117,327 million as
of March 31, 2011). In case of 99% confidence level, VaR
is ¥64,714 million as of March 31, 2012 (¥88,324 million as
of March 31, 2011).
(b) Financial Instruments of Trading Account
We use VaR for quantitative analysis on market risk of finan-
cial instruments such as securities for trading and derivatives.
For calculating VaR, we have adopted the variance co-vari-
ance model (holding period of 10 days; confidence interval
of 99.9%; and observation period of 1 year). Those VaR is
used for risk limit monitoring. Our VaR of trading business is
¥33 million as of March 31, 2012 (¥61 million as of March 31,
2011). In case of 99% confidence level, VaR is ¥25 million as
of March 31, 2012 (¥46 million as of March 31, 2011).
(c) Validity of VaR
We check the validity of the market risk measurement made
by VaR approach by the back-test which compares VaR cal-
culated using the model with actual profit and loss. Since
VaR estimates possible losses statistically under the certain
probability from the past market changes, risk might not be
complemented under anomaly market situations.
iii) Liquidity Risk Management
We have established strict liquidity risk management system in-
cluding limit monitoring. The Risk Management Division, which
is responsible for liquidity risk management, has been placed as
a division independent of Treasury Division in financing manage-
ment unit for a check-and-balance effect. The ALM Committee
chaired by the President discusses plans and actions on overall
management of the assets and liabilities based on liquidity risk
situations. Upon an event with a significant impact on the cash
flows, we would immediately have a conference chaired by the
President and discuss plans to address the event. The following is
how we set and monitor limits for liquidity management:
(Limit Management)
We set and monitor the minimum level of liquid assets such as
government bonds that can be converted to cash in a short time.
We also set upper limits on financing from inter-bank and other
markets in order to facilitate stable cash flows with our fund-rais-
ing capacity.
iv) Integrated Risk Management
We have established rigid integrated risk management system in-
cluding risk capital allocation framework. The Risk Management
Division is responsible for integrated risk management and is the
unit that monitors various risks including credit and market risks.
In order to ensure that we have capital sufficient for the risks we
bear, the Risk Management Division also conducts stress test,
the results of which the Board of Directors monitors on a regular
basis and discuss actions to take as necessary. The following is
the details of risk capital allocation framework:
(Risk Capital Allocation Framework)
Risk capital allocation framework is to distribute risk capital (toler-
able risk) within the capital representing our financial strength, to
divisions such as domestic business divisions and treasury divi-
sions in advance. Each division then controls risks within the allo-
cated risk capital. Through this framework, each division conducts
its operations focusing on risk-return spectrum (e.g., improves
profitability and/or utilize the capital in a more efficient manner)
while the entire Bank’s strength is maintained.
(4) Supplementary Explanation on Fair Value of Financial
Instruments
The fair value of financial instruments includes, in addition to values
determined based on market prices, those calculated on a reason-
able basis if no market price is available. Since certain assumptions
are used for the calculations, the result may vary if different assump-
tions are used.

40
2. Disclosure on Fair Value of Financial Instruments
The following table summarizes the amount stated in the consolidated balance sheets and the fair value of financial instruments as of March 31,
2012 with their difference. Note that the following table does not include non-listed equity securities and other securities for which fair value is
extremely difficult to determine (Note ii). Furthermore, some items are not shown since the consolidated balance sheet amounts are insignificant.
Millions of Yen (Note 1)
March 31, 2012 March 31, 2011Consolidated
Balance SheetAmount Fair Value Difference*1
ConsolidatedBalance Sheet
Amount Fair Value Difference*1
(1) SecuritiesAvailable-for-sale Securities ¥2,092,188 ¥2,092,188 ¥ — ¥1,904,992 ¥1,904,992 ¥ —
(2) Loans and Bills Discounted 7,554,923 7,346,143 Allowance for Loan Losses*2 (46,753) (55,168) 7,508,169 7,612,968 104,798 7,290,975 7,403,106 112,130
Total Assets ¥9,600,358 ¥9,705,157 ¥104,798 ¥9,195,967 ¥9,308,098 ¥112,130 (1) Deposits 9,338,244 9,339,448 (1,204) 9,103,649 9,105,542 (1,893)(2) Negotiable Certificates of Deposit 301,371 301,373 (2) 171,586 171,589 (3)Total Liabilities ¥9,639,615 ¥9,640,821 ¥ (1,206) ¥9,275,235 ¥9,277,132 ¥ (1,896)Derivative Transactions*3
Not Qualifying for Hedge Accounting 984 984 — 671 671 —Qualifying for Hedge Accounting [5,584] [5,584] — [3,531] [3,531] —
Total Derivative Transactions ¥ [4,600] ¥ [4,600] ¥ — ¥ [2,860] ¥ [2,860] ¥ —
*1 Unrealized gains (losses) are presented.*2 General and specific allowance for Loans and bills discounted is deducted here.*3 Presents derivative transactions included in Trading assets/liabilities as well as those in Other assets/liabilities. Also presents assets or liabilities arising from derivative transac-
tions on a net basis. Net liability positions are presented with brackets, [ ].
(Note i) Methods used for determining the estimated fair value of
financial instruments
Assets
(1) Securities
The fair value of stocks is determined based on price quoted by
the exchanges. The fair value of bonds is determined based on
the Trading Reference Statistical Data published by Japanese Se-
curities Dealers Association or prices provided by financial institu-
tions. The fair value of investment trusts is determined based on
the net asset value provided by financial institutions.
The fair value of privately placed bonds guaranteed by the
Bank is determined based on a market interest rate adjusted with
projected default rate. The fair value of domestic stocks and do-
mestic investment trusts is based on the average market price
during the month preceding the consolidated fiscal year end.
(2) Loans and bills discounted
Because a floating-rate loan reflects market interest rate within a
short time, its fair value approximates the carrying amount unless
the creditworthiness of the borrower has changed significantly
since the loan origination. As such the carrying amount is deemed
as the fair value. With respect to fixed rate loans, the fair value is
calculated as total of principal and interest discounted at market
interest rate adjusted with projected default rate for each category
of loans based on type, internal rating and maturity length.
As for short-term loans with maturity of one year or less, the
carrying amount is deemed as the fair value since the fair value
approximates such carrying amount.
For loans to Bankrupt, Effectively Bankrupt and Potentially
Bankrupt Borrowers, Allowance for loan losses is estimated
based on present value of expected future cash flows or ex-
pected amount to be collected from collaterals and guarantees.
Accordingly, the fair value approximates the consolidated bal-
ance sheet amount less the allowance, which is then deemed
and used as the fair value in the above table.
For loans without a fixed maturity due to loan characteristics
such as limiting loans to within the value of collateral, the carrying
amount is deemed as the fair value since the fair value is consid-
ered to approximate such carrying amount in terms of expected
duration and interest rate.
Liabilities
(1) Deposits and (2) Negotiable certificates of deposit
For demand deposits, the amount payable on demand as of the
consolidated balance sheet date is considered to be the fair value.
The fair value of time deposits and negotiable certificates of de-
posit are calculated as future cash flows discounted by time pe-
riod. The discount rate used in the calculation is the interest rate
that would be applied to newly accepted deposits. For short-term
deposits, the carrying amount is deemed as the fair value since
the fair value approximates such carrying amount because of the
short contract term of one year or less.
Derivative transactions
See “36. Derivative transactions.”

41
F i n a n c i a l a n d C o r p o r a t e I n f o r m a t i o n
(Note ii) The following table summarizes financial instruments whose whose fair value is extremely difficult to estimate. These securities are not
included in the amount presented under "Assets, (1) Available-for-sale Securities" in the above table.Millions of Yen (Note 1)
March 31, 2012 March 31, 2011Consolidated Balance
Sheet AmountConsolidated Balance
Sheet Amount
(1) Non-listed Stocks (*1)(*2) ¥ 8,142 ¥ 8,331(2) Investments in Limited Partnerships, etc. (*3) 2,845 3,287Total ¥10,988 ¥11,618
(*1) Non-listed stocks do not carry quoted market prices. Since it is extremely difficult to estimate the fair value of these securities, the fair value is not disclosed.(*2) An impairment loss of ¥76 million (¥14 million for the previous fiscal year) was recorded on these non-listed stocks in the current fiscal year.(*3) Fair value of investments in limited partnerships, etc. is not disclosed since such partnerships invest in assets, such as non-listed stocks, of which fair value is extremely dif-
ficult to estimate.
(Note iii) Redemption schedule of monetary claims and securities with maturities:Millions of Yen (Note 1)
March 31, 2012
Within 1 Year 1-3 Years 3-5 Years 5-7 Years 7-10 Years Over 10 Years
Securities ¥ 245,012 ¥ 577,306 ¥ 557,215 ¥179,391 ¥272,620 ¥ 79,331 Held-to-maturity Bonds — — — — — —Available-for-sale Securities with Maturities 245,012 577,306 557,215 179,391 272,620 79,331
Government Bonds 95,000 314,200 275,500 140,500 221,700 —Local Government Bonds 38,892 101,545 140,470 29,525 44,940 —Short-term Corporate Bonds — — — — — —Corporate Bonds 55,437 97,033 57,924 328 4,000 10,809
Loans (*) 1,266,526 1,459,985 951,643 570,810 638,912 2,024,549Total ¥1,511,539 ¥2,037,292 ¥1,508,858 ¥750,202 ¥911,532 ¥2,103,880
(*) These amounts do not include loans to Bankrupt, Effectively Bankrupt or Potentially Bankrupt Borrowers and other loans of which redemption amount cannot be projected and those which do not have specific maturities, amounting to ¥642,495 million in total.
Millions of Yen (Note 1)
March 31, 2011
Within 1 Year 1-3 Years 3-5 Years 5-7 Years 7-10 Years Over 10 Years
Securities ¥ 252,646 ¥ 477,955 ¥ 531,220 ¥135,941 ¥277,436 ¥ 57,221Held-to-maturity Bonds — — — — — —Available-for-sale Securities with Maturities 252,646 477,955 531,220 135,941 277,436 57,221
Government Bonds 82,000 228,000 259,000 90,500 202,200 —Local Government Bonds 24,480 53,549 137,737 32,495 69,190 —Short-term Corporate Bonds — — — — — —Corporate Bonds 82,556 100,818 65,471 395 4,000 9,838
Loans (*) 1,269,356 1,387,626 953,599 501,094 619,062 1,923,886Total ¥1,522,003 ¥1,865,582 ¥1,484,819 ¥637,035 ¥896,499 ¥1,981,108
(*) These amounts do not include loans to Bankrupt, Effectively Bankrupt or Potentially Bankrupt Borrowers and other loans of which redemption amount cannot be projected and those which do not have specific maturities, amounting to ¥691,517 million in total.
(Note iv) Repayment schedule of interest-bearing liabilities:Millions of Yen (Note 1)
March 31, 2012
Within 1 Year 1-3 Years 3-5 Years 5-7 Years 7-10 Years Over 10 Years
Deposits (*) ¥8,612,667 ¥656,705 ¥53,817 ¥4,365 ¥10,689 ¥—Negotiable Certificates of Deposit 301,232 138 — — — —Total ¥8,913,899 ¥656,844 ¥53,817 ¥4,365 ¥10,689 ¥—
(*) Demand deposits are included in “Within 1 year.”
Millions of Yen (Note 1)
March 31, 2011
Within 1 Year 1-3 Years 3-5 Years 5-7 Years 7-10 Years Over 10 Years
Deposits (*) ¥8,386,134 ¥651,480 ¥52,994 ¥3,719 ¥9,320 ¥—Negotiable Certificates of Deposit 171,247 200 138 — — —Total ¥8,557,381 ¥651,680 ¥53,133 ¥3,719 ¥9,320 ¥—
(*) Demand deposits are included in “Within 1 year.”

42
33. Market Value of Securities
(1) Trading SecuritiesMillions of Yen (Note 1)
March 31, 2012 March 31, 2011Unrealized Gains (Losses) Included in
the Consolidated Statements of Income
Unrealized Gains (Losses) Included in
the Consolidated Statements of Income
Trading Securities ¥88 ¥102
(2) Marketable Securities Held-to-MaturityMillions of Yen (Note 1)
March 31, 2012 March 31, 2011
ConsolidatedBalance Sheet
Amount Fair Value Difference
ConsolidatedBalance Sheet
Amount Fair Value Difference
(a) Securities for which Bonds:the fair value Japanese Government Bonds ¥ — ¥ — ¥ — ¥ — ¥ — ¥ —exceeds the Japanese Local Government Bonds — — — — — —consolidated balance Japanese Short-term Corporate Bonds — — — — — —sheet amount Japanese Corporate Bonds — — — — — —
Other 4,952 4,970 17 10,521 10,571 49 Foreign Bonds — — — — — —
Subtotal ¥ 4,952 ¥ 4,970 ¥ 17 ¥10,521 ¥10,571 ¥ 49
(b) Securities for which Bonds:the fair value does Japanese Government Bonds ¥ — ¥ — ¥ — ¥ — ¥ — ¥ —not exceed the Japanese Local Government Bonds — — — — — —consolidated balance Japanese Short-term Corporate Bonds — — — — — —sheet amount Japanese Corporate Bonds — — — — — —
Other 9,171 9,124 (46) 11,267 11,171 (96)Foreign Bonds — — — — — —
Subtotal ¥ 9,171 ¥ 9,124 ¥(46) ¥11,267 ¥11,171 ¥(96)Total ¥14,124 ¥14,095 ¥(28) ¥21,789 ¥21,742 ¥(47)
(3) Marketable Securities Available for SaleMillions of Yen (Note 1)
March 31, 2012 March 31, 2011
Consolidated Balance Sheet
Amount Acquisition Cost Difference
ConsolidatedBalance Sheet
Amount Acquisition Cost Difference
(a) Securities for which Stocks ¥ 82,546 ¥ 58,133 ¥ 24,413 ¥ 75,793 ¥ 53,913 ¥ 21,880 the fair value exceeds Bonds: 1,428,631 1,414,049 14,582 995,807 982,238 13,569 the amortized Japanese Government Bonds 895,640 888,056 7,584 576,683 570,914 5,769 acquisition cost Japanese Local Government Bonds 336,446 331,448 4,997 228,067 222,594 5,473
Japanese Short-term Corporate Bonds — — — — — —Japanese Corporate Bonds 196,545 194,544 2,000 191,056 188,729 2,326
Other 162,729 159,598 3,130 98,596 97,362 1,233 Foreign Bonds 147,400 145,078 2,322 94,978 93,866 1,111
Subtotal ¥1,673,907 ¥1,631,781 ¥ 42,126 ¥1,170,197 ¥1,133,514 ¥ 36,683
(a) Securities for which Stocks ¥ 44,131 ¥ 56,112 ¥(11,980) ¥ 54,752 ¥ 71,883 ¥(17,130)the fair value does Bonds: 222,454 224,067 (1,612) 459,321 465,551 (6,229)not exceed Japanese Government Bonds 169,297 170,672 (1,375) 290,229 295,293 (5,063)the amortized Japanese Local Government Bonds 24,804 24,843 (38) 95,182 95,845 (663)acquisition cost Japanese Short-term Corporate Bonds — — — — — —
Japanese Corporate Bonds 28,353 28,551 (198) 73,909 74,412 (502)Other 151,694 159,909 (8,215) 220,719 236,013 (15,293)
Foreign Bonds 117,675 119,098 (1,423) 173,338 176,450 (3,112)Subtotal ¥ 418,281 ¥ 440,089 ¥(21,808) ¥ 734,794 ¥ 773,448 ¥(38,654)Total ¥2,092,188 ¥2,071,870 ¥ 20,318 ¥1,904,992 ¥1,906,962 ¥ (1,970)
(4) Securities Held-to-Maturity Sold during the Fiscal Year
None.

43
F i n a n c i a l a n d C o r p o r a t e I n f o r m a t i o n
(5) Securities Available for Sale Sold during the Fiscal YearMillions of Yen (Note 1)
March 31, 2012 March 31, 2011
Proceeds fromSales Gain Loss
Proceeds fromSales Gain Loss
Stocks ¥ 10,147 ¥ 328 ¥6,804 ¥ 2,837 ¥ 534 ¥1,414 Bonds: 233,792 3,596 67 284,744 3,898 347
Japanese Government Bonds 167,259 1,079 54 222,795 2,982 347 Japanese Local Government Bonds 51,932 2,445 — 55,975 905 —Japanese Short-term Corporate Bonds — — — — — —Japanese Corporate Bonds 4,600 72 12 5,972 9 —
Other 78,636 531 2,087 70,251 862 383 Foreign Bonds 74,472 531 218 70,251 862 383
Total ¥312,576 ¥4,457 ¥8,959 ¥357,833 ¥5,294 ¥2,145
(6) Securities for which the Holding Purpose has been Altered
None.
(7) Impairment Losses on Securities
Marketable securities available for sale are subject to write-downs
when the market value or reasonably estimated value of these se-
curities (collectively, “fair value”) has declined considerably and it is
not probable that the value will recover to the acquisition cost. In
such case, any differences between fair value and acquisition cost
are recognized as losses for the period. For the current fiscal year,
impairment losses was ¥896 million (Stocks; ¥878 million, Corpo-
rate bonds; ¥17 million), and ¥3,974 million (Stocks; ¥3,906 million
Corporate bonds; ¥67 million) for the previous fiscal year.
“Considerable decline in fair value” is determined based on the
classification of issuers in accordance with the internal standards
for self-assessment of assets as follows:
Bankrupt, effective bankrupt and potentially bankrupt
Fair value is lower than acquisition cost.
Requiring caution
Fair value has declined by 30% or more from acquisition cost.
Normal
Fair value has declined by 50% or more from acquisition cost, or
fair value has declined by more than 30% but less than 50% from
acquisition cost and stayed below a certain level.
Bankrupt issuer means one who has entered into bankruptcy, spe-
cial liquidation proceedings, corporate rehabilitation, civil rehabilita-
tion or similar legal proceedings or whose notes have been dishon-
ored and suspended from processing through clearing houses.
Effective bankrupt issuer means one who is not legally or for-
mally bankrupt but regarded as substantially in a similar condition.
Potentially bankrupt issuer means one who is not legally bank-
rupt but deemed to have high possibility of becoming bankrupt.
Requiring caution issuer means one who is financially weak
and under close monitoring conducted by the Bank.
Normal issuer means one who does not belong to the others.
34. Money Held in Trust
(1) Money Held in Trust for Trading Purposes
Millions of Yen (Note 1)Thousands of
U.S. Dollars (Note 1)
2012 2011 2012
Consolidated Balance Sheet Amount ¥25,677 ¥25,355 $312,419
Unrealized Gains (Losses) Included in the Consolidated Statements of Income
1,056 661 12,852
(2) Money Held in Trust for Other Purposes
Millions of Yen (Note 1)Thousands of
U.S. Dollars (Note 1)
2012 2011 2012
Acquisition Cost ¥3,221 ¥3,574 $39,201
Consolidated Balance Sheet Amount 3,221 3,573 39,201
Valuation Differences — (0) —
Gains — — —
Losses — (0) —
35. Valuation Difference on Available-for-sale Securities
Millions of Yen (Note 1)Thousands of
U.S. Dollars (Note 1)
2012 2011 2012
Valuation Difference ¥20,318 ¥(1,971) $247,213
Securities Available for Sale 20,318 (1,970) 247,213
Other Money Held in Trust — (0) —
Deferred Tax Liabilities (Assets) 7,073 (916) 86,063
Valuation Difference, Net of Taxes ¥13,244 ¥(1,054) $161,151
Amount Attributable to Minority Interests 27 112 336
Net Unrealized Gains on Securities Available for Sale Owned by Subsidiaries, which is Attributable to the Parent 51 50 625
Valuation Difference on Available-for-sale Securities ¥13,268 ¥(1,115) $161,439
36. Derivative Transactions
(1) Derivative Transactions to which Hedge Accounting is not Applied
With respect to the derivative transactions, contract amount or
notional principal, fair value, unrealized gains (losses) and fair
value calculation by transaction type as of the consolidated bal-
ance sheet date are as follows. Contract amount or notional prin-
cipal does not necessarily represent market risk of the derivative
transaction.

44
(a) Interest rate derivatives
Millions of Yen (Note 1)
March 31, 2012
Notional Principal or Contract Amount
Total Over 1 Year Fair ValueUnrealized Gains
(Losses)
Listed: Futures: Sold ¥ — ¥ — ¥ — ¥ — Bought — — — — Options: Sold — — — — Bought — — — —Over-the-counter: FRAs: Sold — — — — Bought — — — — Swaps: Receive Fixed / Pay Float 1,840,601 1,486,515 28,274 28,274 Receive Float / Pay Fixed 1,822,530 1,453,615 (27,950) (27,950) Receive Float / Pay Float 118,410 81,340 60 60 Options: Sold — — — — Bought — — — — Other: Sold 23,778 17,014 (13) (13) Bought 10,000 3,000 21 21 Total ¥ — ¥ — ¥ 392 ¥ 392
1. The above transactions are valued at fair value and the unrealized gains (losses) are included in the consolidated statements of income.
2. The fair value of listed transactions is based on the final price issued by Tokyo Financial Exchange or other exchange. The fair value of OTC transactions is based on the discounted cash flow method or option pricing models.
Millions of Yen (Note 1)
March 31, 2011
Notional Principal or Contract Amount
Total Over 1 Year Fair ValueUnrealized Gains
(Losses)
Listed: Futures: Sold ¥ — ¥ — ¥ — ¥ — Bought — — — — Options: Sold — — — — Bought — — — —Over-the-counter: FRAs: Sold — — — — Bought — — — — Swaps: Receive Fixed / Pay Float 2,035,039 1,771,552 22,464 22,464 Receive Float / Pay Fixed 2,049,964 1,740,934 (22,558) (22,558) Receive Float / Pay Float 121,110 97,110 93 93 Options: Sold — — — — Bought — — — — Other: Sold 66,594 60,704 (63) (63) Bought 52,000 52,000 93 93 Total ¥ — ¥ — ¥ 30 ¥ 30
1. The above transactions are valued at fair value and the unrealized gains (losses) are included in the consolidated statements of income.
2. The fair value of listed transactions is based on the final price issued by Tokyo Financial Exchange or other exchange. The fair value of OTC transactions is based on the discounted cash flow method or option pricing models.
(b) Currency derivatives
Millions of Yen (Note 1)
March 31, 2012
Notional Principal or Contract Amount
Total Over 1 Year Fair ValueUnrealized Gains
(Losses)
Listed: Futures: Sold ¥ — ¥ — ¥ — ¥ — Bought — — — — Options: Sold — — — — Bought — — — —Over-the-counter: Currency Swaps 265,681 144,350 208 208 Forward Foreign Exchange: Sold 18,672 — 88 88 Bought 14,694 — 174 174 Currency Options: Sold 82,378 — (5,349) 900 Bought 82,378 — 5,349 832 Other: Sold 1,827 946 162 162 Bought 1,827 946 (70) (70) Total ¥ — ¥ — ¥ 564 ¥2,297
1. The above transactions are valued at fair value and the unrealized gains (losses) are included in the consolidated statements of income.
2. The fair value is based on the discounted cash flow method.
Millions of Yen (Note 1)
March 31, 2011
Notional Principal or Contract Amount
Total Over 1 Year Fair ValueUnrealized Gains
(Losses)
Listed: Futures: Sold ¥ — ¥ — ¥ — ¥ — Bought — — — — Options: Sold — — — — Bought — — — —Over-the-counter: Currency Swaps 359,862 274,394 359 359 Forward Foreign Exchange: Sold 17,801 — 92 92 Bought 10,675 — 34 34 Currency Options: Sold 125,114 — (11,280) (1,443) Bought 125,114 — 11,280 3,963 Other: Sold 2,835 1,898 265 265 Bought 2,835 1,898 (126) (126) Total ¥ — ¥ — ¥ 626 ¥ 3,145
1. The above transactions are valued at fair value and the unrealized gains (losses) are included in the consolidated statements of income.
2. The fair value is based on the discounted cash flow method.

45
F i n a n c i a l a n d C o r p o r a t e I n f o r m a t i o n
(c) Equity derivatives
Millions of Yen (Note 1)
March 31, 2012
Notional Principal or Contract Amount
Total Over 1 Year Fair ValueUnrealized Gains
(Losses)
Listed: Futures: Sold ¥— ¥— ¥— ¥— Bought — — — — Options: Sold — — — — Bought — — — —Over-the-counter: Securities: Sold — — — — Bought — — — — Swaps: Receive Index Rate / Pay Short-term Floating Rate of Interest — — — — Receive Short-term Float Rate of Interest / Pay Fixed Index Rate — — — — Other: Sold — — — — Bought — — — — Total ¥— ¥— ¥— ¥—
1. The above transactions are valued at fair value and the unrealized gains (losses) are included in the consolidated statements of income.
2. The fair value of listed transactions is based on the final price issued by Tokyo Stock Exchange or other exchange. The fair value of OTC transactions is based on the discounted cash flow method or option pricing models.
Millions of Yen (Note 1)
March 31, 2011
Notional Principal or Contract Amount
Total Over 1 Year Fair ValueUnrealized Gains
(Losses)
Listed: Futures: Sold ¥ — ¥— ¥— ¥— Bought — — — — Options: Sold 9,928 — (6) 39 Bought 123 — 1 (1)Over-the-counter: Securities: Sold — — — — Bought — — — — Swaps: Receive Index Rate / Pay — — — — Short-term Floating Rate — — — — of Interest — — — — Receive Short-term Float Rate of Interest / Pay — — — — Fixed Index Rate — — — — Other: Sold — — — — Bought — — — — Total ¥ — ¥— ¥(4) ¥38
1. The above transactions are valued at fair value and the unrealized gains (losses) are included in the consolidated statements of income.
2. The fair value of listed transactions is based on the final price issued by Tokyo Stock Exchange or other exchange. The fair value of OTC transactions is based on the discounted cash flow method or option pricing models.
(d) Bond derivatives
Millions of Yen (Note 1)
March 31, 2012
Notional Principal or Contract Amount
Total Over 1 Year Fair ValueUnrealized Gains
(Losses)
Listed: Futures: Sold ¥1,994 ¥— ¥ 6 ¥ 6 Bought — — — — Futures Options: Sold — Bought — — — —Over-the-counter: Options: Sold — — — — Bought — — — — Other: Sold — — — — Bought — — — — Total ¥ — ¥— ¥ 6 ¥ 6
1. The above transactions are valued at fair value and the unrealized gains (losses) are included in the consolidated statements of income.
2. The fair value of listed transactions is based on the final price issued by Tokyo Stock Exchange or other exchange. The fair value of OTC transactions is based on the discounted cash flow method or option pricing models.
Millions of Yen (Note 1)
March 31, 2011
Notional Principal or Contract Amount
Total Over 1 Year Fair ValueUnrealized Gains
(Losses)
Listed: Futures: Sold ¥2,358 ¥— ¥(13) ¥(13) Bought — — — — Futures Options: Sold — Bought — — — —Over-the-counter: Options: Sold — — — — Bought — — — — Other: Sold — — — — Bought — — — — Total ¥ — ¥— ¥(13) ¥(13)
1. The above transactions are valued at fair value and the unrealized gains (losses) are included in the consolidated statements of income.
2. The fair value of listed transactions is based on the final price issued by Tokyo Stock Exchange or other exchange. The fair value of OTC transactions is based on the discounted cash flow method or option pricing models.

46
(e) Commodity derivatives
Millions of Yen (Note 1)
March 31, 2012
Notional Principal or Contract Amount
Total Over 1 Year Fair ValueUnrealized Gains
(Losses)
Listed: Futures: Sold ¥ — ¥ — ¥ — ¥ — Bought — — — — Swaps: Receive Fixed / Pay Float — — — — Receive Float / Pay Fixed — — — —Over-the-counter: Commodity Forward: Sold — — — — Bought — — — — Swaps: Receive Fixed / Pay Float 184 172 (17) (17) Receive Float / Pay Fixed 184 172 38 38 Options: Sold — — — — Bought — — — — Total ¥ — ¥ — ¥ 21 ¥ 21
1. The above transactions are valued at fair value and the unrealized gains (losses) are included in the consolidated statements of income.
2. The fair value of OTC transactions is based on the price of the underlying asset, terms of contract and other factors which structure the contract.
3. Fuels were underlying assets of the above derivative transactions.
Millions of Yen (Note 1)
March 31, 2011
Notional Principal or Contract Amount
Total Over 1 Year Fair ValueUnrealized Gains
(Losses)
Listed: Futures: Sold ¥ — ¥ — ¥ — ¥ — Bought — — — — Swaps: Receive Fixed / Pay Float — — — — Receive Float / Pay Fixed — — — —Over-the-counter: Commodity Forward: Sold — — — — Bought — — — — Swaps: Receive Fixed / Pay Float 286 286 (35) (35) Receive Float / Pay Fixed 286 286 68 68 Options: Sold — — — — Bought — — — — Total ¥ — ¥ — ¥ 33 ¥ 33
1. The above transactions are valued at fair value and the unrealized gains (losses) are included in the consolidated statements of income.
2. The fair value of OTC transactions is based on the price of the underlying asset, terms of contract and other factors which structure the contract.
3. Fuels were underlying assets of the above derivative transactions.
(f ) Credit derivatives
None.
(2) Derivative Transactions to which Hedge Accounting is Applied
With respect to the derivative transactions, contract amount or
notional principal, fair value, unrealized gains (losses) and fair
value calculation by hedge accounting as of the consolidated
balance sheet date are as follows. Contract amount or notional
principal does not necessarily represent market risk of the deriva-
tive transaction.
(a) Interest rate derivatives
Millions of Yen (Note 1)
March 31, 2012
Notional Principal or Contract Amount
Hedged Item Total Over 1 Year Fair Value
Principle method Interest Swap
Interest-bearingfinancial assetsand liabilities
including loans,available-for-saledebt securities,deposits and
negotiablecertificates of
deposit
Receive Fixed / Pay Float ¥ — ¥ — ¥ — Receive Float / Pay Fixed 135,901 95,810 (3,600) Receive Float / Pay Float — — — Other 8,000 3,000 (174)Exceptional Accrual Method Interest Swap
Interest-bearingfinancial assetsand liabilities
including loans
Receive Fixed / Pay Float — — — Receive Float / Pay Fixed 1,643 1,643 *3 Receive Float / Pay Float — — — Total ¥ — ¥ — ¥(3,775)
1. Deferred hedge is primarily applied to the above transactions under the “Treat-ment for Accounting and Auditing of Application of Accounting Standard for Financial Instruments for Banking Industry” (JICPA Industry Audit Committee Report No. 24).
2. The fair value of the above transactions is based on the discounted cash flow method or option pricing models.
3. Since derivative transactions qualifying for the exceptional accrual method are treated as a unit of loans, hedged items, those fair values are included in fair values of such loans in “31. Financial Instruments.”
Millions of Yen (Note 1)
March 31, 2011
Notional Principal or Contract Amount
Hedged Item Total Over 1 Year Fair Value
Interest Swap Interest-bearingfinancial assetsand liabilities
including loans,available-for-saledebt securities,deposits and
negotiablecertificates of
deposit
Receive Fixed / Pay Float ¥ — ¥ — ¥ — Receive Float / Pay Fixed 129,838 117,571 (3,098) Receive Float / Pay Float — — — Other 8,000 8,000 (303) Total ¥ — ¥ — ¥(3,402)
1. Deferred hedge is primarily applied to the above transactions under the “Treat-ment for Accounting and Auditing of Application of Accounting Standard for Financial Instruments in Banking Industry” (JICPA Industry Audit Committee Report No. 24).
2. The fair value of the above transactions is based on the discounted cash flow method or option pricing models.

47
F i n a n c i a l a n d C o r p o r a t e I n f o r m a t i o n
(b) Currency derivatives
Method of hedge accounting ; Principle method
Millions of Yen (Note 1)
March 31, 2012
Notional Principal or Contract Amount
Hedged Item Total Over 1 Year Fair Value
Currency Swap Foreign currencydenominated
loans, securities,deposits and
foreign exchanges
¥168,294 ¥4,609 ¥(1,809)
Total ¥ — ¥ — ¥(1,809)
1. Deferred hedge is primarily applied to the above transactions under the “Treat-ment for Accounting and Auditing concerning Accounting for Foreign Cur-rency Transactions in Banking Industry” (JICPA Industry Audit Committee Report No. 25).
2. The fair value is based on the discounted cash flow method.
Millions of Yen (Note 1)
March 31, 2011
Notional Principal or Contract Amount
Hedged Item Total Over 1 Year Fair Value
Currency Swap Foreign currencydenominated
loans, securities,deposits and
foreign exchanges
¥29,801 ¥14,971 ¥(129)
Total ¥ — ¥ — ¥(129)
1. Deferred hedge is primarily applied to the above transactions under the “Treat-ment for Accounting and Auditing concerning Accounting for Foreign Cur-rency Transactions in Banking Industry” (JICPA Industry Audit Committee Report No. 25).
2. The fair value is based on the discounted cash flow method.
(c) Equity derivatives
None.
(d) Bond derivatives
None.
37. Per Share Data
Yen (Note 1) U.S. Dollars (Note 1)
2012 2011 2012
Net Assets per Share of Common Stock ¥747.90 ¥692.74 $9.10
Net Income per Share of Common Stock 46.47 45.65 0.57
Diluted Net Income per Share of Common Stock 46.44 45.64 0.57
1. Basis on calculating Net Assets per Share was as follows:
Millions of Yen (Note 1)Thousands of
U.S. Dollars (Note 1)
2012 2011 2012
Consolidated Net Assets ¥664,076 ¥625,990 $8,079,769
Less: Subscription Rights to Shares 231 108 2,822
Less: Minority Interest 6,511 13,732 79,225
Consolidated Net Assets Attributable to Common Stockholders 657,332 612,149 7,997,723
Number of Shares
2012 2011
Number of Shares of Common Stock Used for Calculating Net Assets per Share 878,893,482 883,661,185
2. Basis on calculating Net Income per Share was as follows:
Millions of Yen (Note 1)Thousands of
U.S. Dollars (Note 1)
2012 2011 2012
Consolidated Net Income ¥40,770 ¥40,611 $496,056
Consolidated Net Income not Attributable to Common Stockholders — — — Consolidated Net Income Attributable to Common Stockholders 40,770 40,611 496,056
Number of Shares
2012 2011
Average Number of Shares of Common Stock (excluding Treasury Stock) 877,319,233 889,536,436
The increased number of shares of common stock for stock options
is 523 thousand, which is used for calculating Diluted Net Income per
Share.
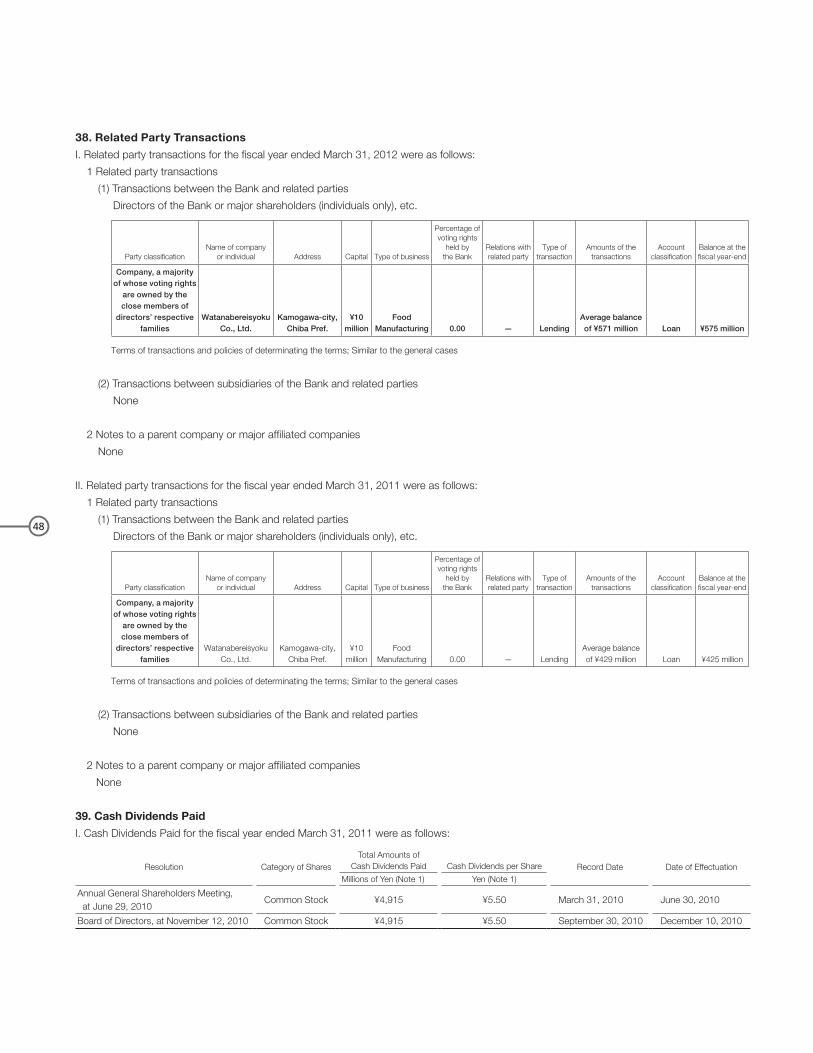
48
38. Related Party Transactions
I. Related party transactions for the fiscal year ended March 31, 2012 were as follows:
1 Related party transactions
(1) Transactions between the Bank and related parties
Directors of the Bank or major shareholders (individuals only), etc.
Party classificationName of company
or individual Address Capital Type of business
Percentage of voting rights
held by the Bank
Relations withrelated party
Type of transaction
Amounts of the transactions
Account classification
Balance at the fiscal year-end
Company, a majority of whose voting rights
are owned by the close members of
directors’ respective families
Watanabereisyoku Co., Ltd.
Kamogawa-city,Chiba Pref.
¥10 million
Food Manufacturing 0.00 — Lending
Average balance of ¥571 million Loan ¥575 million
Terms of transactions and policies of determinating the terms; Similar to the general cases
(2) Transactions between subsidiaries of the Bank and related parties
None
2 Notes to a parent company or major affiliated companies
None
II. Related party transactions for the fiscal year ended March 31, 2011 were as follows:
1 Related party transactions
(1) Transactions between the Bank and related parties
Directors of the Bank or major shareholders (individuals only), etc.
Party classificationName of company
or individual Address Capital Type of business
Percentage of voting rights
held by the Bank
Relations withrelated party
Type of transaction
Amounts of the transactions
Account classification
Balance at the fiscal year-end
Company, a majority of whose voting rights
are owned by the close members of
directors’ respective families
Watanabereisyoku Co., Ltd.
Kamogawa-city,Chiba Pref.
¥10 million
Food Manufacturing 0.00 — Lending
Average balance of ¥429 million Loan ¥425 million
Terms of transactions and policies of determinating the terms; Similar to the general cases
(2) Transactions between subsidiaries of the Bank and related parties
None
2 Notes to a parent company or major affiliated companies
None
39. Cash Dividends Paid
I. Cash Dividends Paid for the fiscal year ended March 31, 2011 were as follows:
Resolution Category of SharesTotal Amounts of
Cash Dividends Paid Cash Dividends per Share Record Date Date of EffectuationMillions of Yen (Note 1) Yen (Note 1)
Annual General Shareholders Meeting, at June 29, 2010
Common Stock ¥4,915 ¥5.50 March 31, 2010 June 30, 2010
Board of Directors, at November 12, 2010 Common Stock ¥4,915 ¥5.50 September 30, 2010 December 10, 2010

49
F i n a n c i a l a n d C o r p o r a t e I n f o r m a t i o n
II. Cash Dividends Paid for the fiscal year ended March 31, 2012 were as follows:
Resolution Category of SharesTotal Amounts of
Cash Dividends Paid Cash Dividends per Share Record Date Date of EffectuationMillions of Yen (Note 1) Yen (Note 1)
Annual General Shareholders Meeting, at June 29, 2011
Common Stock ¥4,860 ¥5.50 March 31, 2011 June 30, 2011
Board of Directors, at November 11, 2011 Common Stock ¥4,794 ¥5.50 September 30, 2011 December 9, 2011
III. Cash Dividends with the record date in the fiscal year ended March 31, 2012 and the effective date in the fiscal year ending March 31, 2013
were as follows:
Approval Category of SharesTotal Amounts of
Cash Dividends Paid Source of Dividends
Cash Dividends per Share Record Date Date of Effectuation
Millions of Yen (Note 1) Yen (Note 1)
Annual General Shareholders Meeting, at June 28, 2012
Common Stock ¥4,838 Retained earnings
¥5.50 March 31, 2012 June 29, 2012
40. Stock Options
1 Line Item where Stock Option Expense is Presented and the Amount
Millions of Yen (Note 1)Thousands of
U.S. Dollars (Note 1)
2012 2011 2012
General and Administrative Expenses ¥151 ¥108 $1,840
2 The Stock Option Activity
(1) Outline of the Stock OptionThe first subscription rights The second subscription rights
Number of Grantees Directors 9 9
Executive officers 9 9
Number of Stock Options Common stock 311,100 343,600
Date of Grant July 20, 2010 July 20, 2011
Requirement for Determination of Rights Not fixed Not fixed
Target Period Not fixed Not fixed
Exercise Period From July 21, 2010 to July 20, 2040 From July 21, 2011 to July 20, 2041
(2) Size and Situation of the Stock Option
(a) The number of the stock optionNumber of Shares
The first subscription rights The second subscription rights
Non-vested
As of March 31, 2011 — —
Granted — 343,600
Forfeited — —
Vested — 343,600
Outstanding — —
Vested
As of March 31, 2011 311,100 —
Vested — 343,600
Exercised 60,600 —
Forfeited — —
Outstanding 250,500 343,600

50
(b) Price InformationYen (Note 1)
The first subscription rights The second subscription rights
Exercise Price 1 1
Average Price at Exercise 515 —
Fair Value at Grant Date 467 446
3 The Estimations Used to Measure Fair Value of Stock Option
(1) Valuation Method
The Black-Scholes option pricing model
(2) Main Figures and the Way of EstimationThe second subscription rights
Volatility of Stock Price (*1) 39.441%
Estimated Remaining Outstanding Period (*2) 5 years
Estimated Dividend (*3) ¥11 per share
Risk-Free Interest Rate (*4) 0.370%
*1. Volatility of Stock Price is calculated based on the actual stock prices of Estimated Remaining Outstanding Period.*2. Estimated Remaining Outstanding Period is estimated based on the average administration period of the directors from the past decade.*3. Estimated Dividend is based on the actual results of the fiscal year 2010.*4. Risk-free Interest Rate is based on bonds’ yields of the Estimated Remaining Outstanding Period.
4 Estimated Number of Stock Options to be Vested
The actual number of forfeited stock options alone is reflected because the number of stock options that will be forfeited in the future can-
not be readily estimated.
41. Business Combination
The Bank and Chibagin Securities, one of the consolidated subsidiaries of the Bank, implemented a share exchange, which became effective
October 1, 2011, in order to make Chibagin Securities a wholly-owned subsidiary. The share exchange is a business combination under com-
mon control. A summary of the share exchange is as follows:
1. Summary of the Share Exchange
(1) Name and Business of the Subsidiary Name: Chibagin Securities Co., Ltd.
Business: Securities business
(2) Date of the Business Combination October 1, 2011
(3) Legal Form of the Combination A share exchange making Chiba Bank a wholly-owning parent company and Chibagin
Securities a wholly-owned subsidiary of the Bank.
(4) Name of the Subsidiary After the Combination No change.
(5) Other The business combination is aimed at enabling the group to address in a timely and ap-
propriate manner the greater sophistication of financial products and diversification of
customers’ needs, and to ensure prompt decision-making processes.
2. Summary of the Accounting Treatment Implemented
The combination was implemented as a business combination under common control, based on the “Accounting Standard for Business
Combinations” (ASBJ Statement No. 21, December 26, 2008) and “Accounting Standard for Business Combinations and Accounting Stan-
dard for Business Divestitures” (ASBJ Guidance No. 10, December 26, 2008).
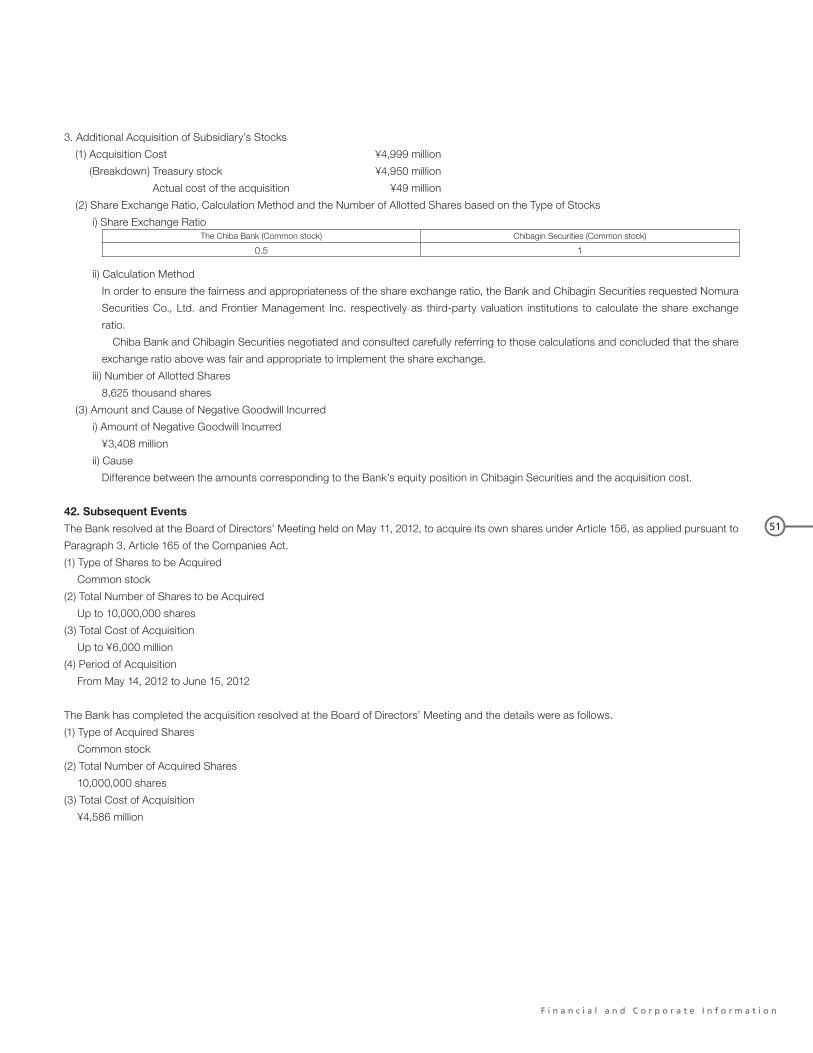
51
F i n a n c i a l a n d C o r p o r a t e I n f o r m a t i o n
3. Additional Acquisition of Subsidiary’s Stocks
(1) Acquisition Cost ¥4,999 million
(Breakdown) Treasury stock ¥4,950 million
Actual cost of the acquisition ¥49 million
(2) Share Exchange Ratio, Calculation Method and the Number of Allotted Shares based on the Type of Stocks
i) Share Exchange RatioThe Chiba Bank (Common stock) Chibagin Securities (Common stock)
0.5 1
ii) Calculation Method
In order to ensure the fairness and appropriateness of the share exchange ratio, the Bank and Chibagin Securities requested Nomura
Securities Co., Ltd. and Frontier Management Inc. respectively as third-party valuation institutions to calculate the share exchange
ratio.
Chiba Bank and Chibagin Securities negotiated and consulted carefully referring to those calculations and concluded that the share
exchange ratio above was fair and appropriate to implement the share exchange.
iii) Number of Allotted Shares
8,625 thousand shares
(3) Amount and Cause of Negative Goodwill Incurred
i) Amount of Negative Goodwill Incurred
¥3,408 million
ii) Cause
Difference between the amounts corresponding to the Bank’s equity position in Chibagin Securities and the acquisition cost.
42. Subsequent Events
The Bank resolved at the Board of Directors’ Meeting held on May 11, 2012, to acquire its own shares under Article 156, as applied pursuant to
Paragraph 3, Article 165 of the Companies Act.
(1) Type of Shares to be Acquired
Common stock
(2) Total Number of Shares to be Acquired
Up to 10,000,000 shares
(3) Total Cost of Acquisition
Up to ¥6,000 million
(4) Period of Acquisition
From May 14, 2012 to June 15, 2012
The Bank has completed the acquisition resolved at the Board of Directors’ Meeting and the details were as follows.
(1) Type of Acquired Shares
Common stock
(2) Total Number of Acquired Shares
10,000,000 shares
(3) Total Cost of Acquisition
¥4,586 million
52
Independent Auditor’s Report

53
F i n a n c i a l a n d C o r p o r a t e I n f o r m a t i o n
Millions of Yen (Note 1)Thousands of
U.S. Dollars (Note 1)
2012 2011 2012
Assets
Cash and Due from Banks ¥ 472,367 ¥ 569,198 $ 5,747,260
Call Loans 69,621 50,000 847,078
Receivables under Resale Agreements 29,992 9,996 364,914
Monetary Claims Bought 21,468 28,459 261,210
Trading Assets 326,779 284,217 3,975,901
Money Held in Trust 25,799 25,729 313,902
Securities 2,111,610 1,920,351 25,691,821
Loans and Bills Discounted 7,581,708 7,371,452 92,246,115
Foreign Exchanges 2,205 3,034 26,830
Other Assets 47,752 57,553 581,003
Tangible Fixed Assets 93,301 91,028 1,135,195
Intangible Fixed Assets 10,067 9,586 122,490
Deferred Tax Assets 27,043 42,049 329,037
Customers’ Liabilities for Acceptances and Guarantees 78,052 75,415 949,656
Allowance for Loan Losses (39,255) (47,493) (477,617)
Total Assets ¥10,858,514 ¥10,490,582 $132,114,794
Liabilities
Deposits ¥ 9,677,871 ¥ 9,309,982 $117,749,991
Call Money 34,095 23,797 414,836
Payables under Repurchase Agreements — 14,998 —
Payables under Securities Lending Transactions 77,347 50,776 941,078
Trading Liabilities 29,403 26,668 357,744
Borrowed Money 161,682 255,810 1,967,177
Foreign Exchanges 229 480 2,796
Bonds Payable 40,000 40,000 486,677
Other Liabilities 95,650 67,797 1,163,776
Provision for Retirement Benefits 19,011 18,747 231,308
Provision for Reimbursement of Deposits 1,522 950 18,530
Provision for Point Loyalty Programs 145 808 1,769
Deferred Tax Liabilities for Land Revaluation 13,240 15,158 161,092
Acceptances and Guarantees 78,052 75,415 949,656
Total Liabilities ¥10,228,252 ¥ 9,901,391 $124,446,430
Net Assets
Capital Stock ¥ 145,069 ¥ 145,069 $ 1,765,046
Capital Surplus 122,678 122,134 1,492,624
Retained Earnings 349,589 323,197 4,253,428
Legal Retained Earnings 50,930 50,930 619,664
Other Retained Earnings 298,659 272,267 3,633,764
Treasury Stock (8,038) (6,358) (97,804)
Total Shareholders’ Equity 609,298 584,042 7,413,294
Valuation Difference on Available-for-sale Securities 12,888 (1,250) 156,815
Deferred Gains or Losses on Hedges (1,549) (1,259) (18,855)
Revaluation Reserve for Land 9,393 7,548 114,288
Total Valuation and Translation Adjustments 20,732 5,039 252,248
Subscription Rights to Shares 231 108 2,822
Total Net Assets ¥ 630,262 ¥ 589,190 $ 7,668,364
Total Liabilities and Net Assets ¥10,858,514 ¥10,490,582 $132,114,794
Non-Consolidated Balance Sheets (Unaudited)The Chiba Bank, Ltd.As of March 31, 2012
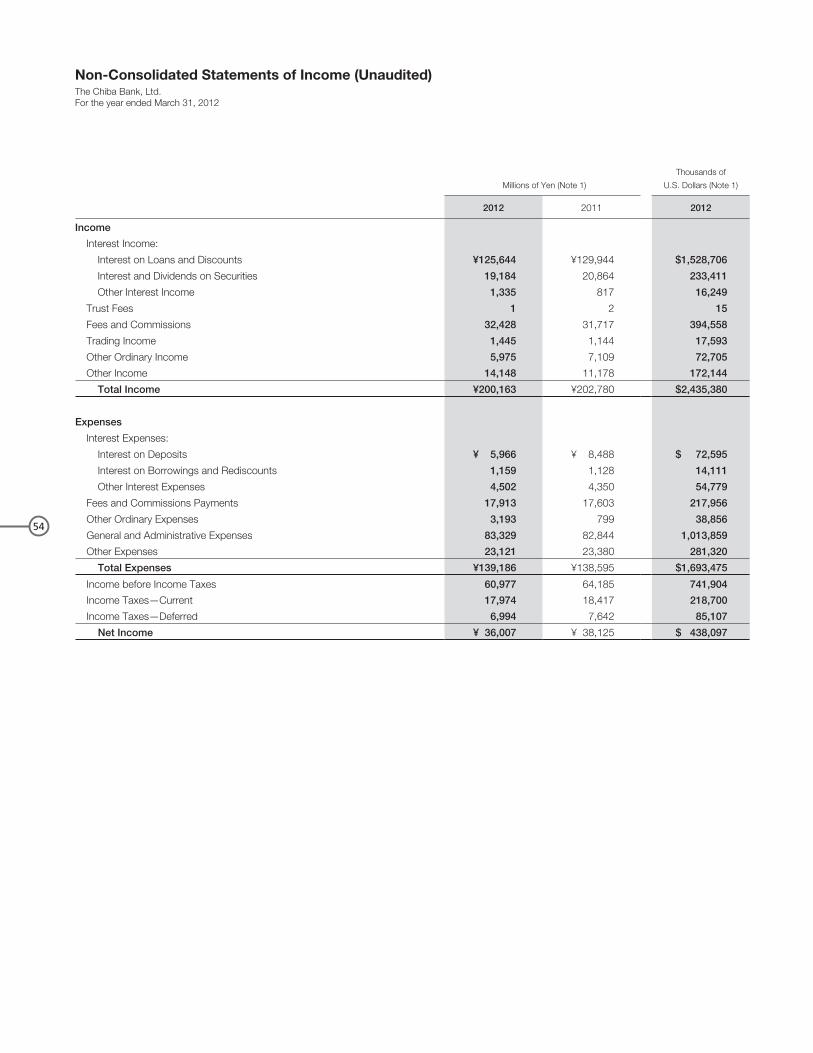
54
Non-Consolidated Statements of Income (Unaudited)The Chiba Bank, Ltd.For the year ended March 31, 2012
Millions of Yen (Note 1)
Thousands of
U.S. Dollars (Note 1)
2012 2011 2012
Income
Interest Income:
Interest on Loans and Discounts ¥125,644 ¥129,944 $1,528,706
Interest and Dividends on Securities 19,184 20,864 233,411
Other Interest Income 1,335 817 16,249
Trust Fees 1 2 15
Fees and Commissions 32,428 31,717 394,558
Trading Income 1,445 1,144 17,593
Other Ordinary Income 5,975 7,109 72,705
Other Income 14,148 11,178 172,144
Total Income ¥200,163 ¥202,780 $2,435,380
Expenses
Interest Expenses:
Interest on Deposits ¥ 5,966 ¥ 8,488 $ 72,595
Interest on Borrowings and Rediscounts 1,159 1,128 14,111
Other Interest Expenses 4,502 4,350 54,779
Fees and Commissions Payments 17,913 17,603 217,956
Other Ordinary Expenses 3,193 799 38,856
General and Administrative Expenses 83,329 82,844 1,013,859
Other Expenses 23,121 23,380 281,320
Total Expenses ¥139,186 ¥138,595 $1,693,475
Income before Income Taxes 60,977 64,185 741,904
Income Taxes—Current 17,974 18,417 218,700
Income Taxes—Deferred 6,994 7,642 85,107
Net Income ¥ 36,007 ¥ 38,125 $ 438,097

55
F i n a n c i a l a n d C o r p o r a t e I n f o r m a t i o n
Supplementary Information (Unaudited)The Chiba Bank, Ltd. and Consolidated SubsidiariesAs of March 31, 2012
Capital Ratio (BIS Guidelines) (Consolidated)
Millions of Yen
Thousands of
U.S. Dollars
2012 2011 2012
Tier 1 Capital:
Common Stock ¥ 145,069 ¥ 145,069 $ 1,765,046
Capital Surplus 123,591 123,380 1,503,732
Retained Earnings 376,039 344,884 4,575,250
Treasury Stock (8,480) (6,358) (103,177)
Expected Outflow from Net Assets (5,817) (5,578) (70,782)
Stock Option 231 108 2,822
Minority Interests in Consolidated Subsidiaries 6,483 13,620 78,889
Net Unrealized Losses on Available-for-sale Securities — (3,677) —
Amount Equivalent to Capital Increase due to Securitization Transaction (73) (78) (892)
50% of Expected Loss Exceeding Eligible Provisions (15,363) (11,944) (186,922)
Total Tier 1 Capital ¥ 621,682 ¥ 599,425 $ 7,563,965
Tier 2 Capital:
45% of Unrealized Gains on Available-for-sale Securities ¥ 3,127 ¥ — $ 38,046
45% of Land Revaluation Excess 10,185 10,218 123,921
General Allowance for Loan Losses 383 889 4,670
Qualifying Subordinated Debt 73,000 73,000 888,186
Total Tier 2 Capital ¥ 86,695 ¥ 84,107 $ 1,054,823
Deductions from Capital ¥ 21,539 ¥ 18,249 $ 262,072
Total Capital ¥ 686,838 ¥ 665,283 $ 8,356,716
Risk-Weighted Assets, etc.:
Credit Risk ¥4,396,297 ¥4,566,319 $53,489,449
On-Balance-Sheet Items 4,186,086 4,280,488 50,931,828
Off-Balance-Sheet Items, etc. 210,210 285,830 2,557,621
Asset Equivalent of Market Risk 78,983 85,667 960,988
Asset Equivalent of Operational Risk 310,097 320,509 3,772,934
Floor Adjustment — — —
Total Risk-Weighted Assets ¥4,785,378 ¥4,972,496 $58,223,371
Capital Ratio (BIS guidelines) 14.35% 13.37% 14.35%
Japanese yen amounts are presented in millions of yen by rounding down figures below one million. As a result, the totals in Japanese yen in the non-consolidated financial statements and supplementary information do not necessarily agree with the sums of individual amounts.U.S. dollar amounts are shown solely for the convenience of the readers of this Annual Report and are translated at the rate of ¥82.19 to $1.00, the exchange rate prevailing at March 31, 2012.The following approaches were adopted to calculate the new capital ratio. Credit Risk: Internal Ratings-Based Approach (using internal ratings for risk measurement) Operational Risk: Standardized Approach (Gross Profits of every business line multiplied by the predetermined rate)

56
Loans and Bills Discounted, Borrower Classification by Industry (Consolidated)Millions of Yen
March 31, 2012Outstanding
Balance
Composition
Domestic operations:
Manufacturing ¥ 679,359 9.08%
Agriculture and Forestry 8,206 0.11%
Fisheries 885 0.01%
Mining, Quarrying and Gravel 13,753 0.18%
Construction 288,582 3.86%
Electricity, Gas, Heat Supply and Water 21,662 0.29%
Information and Communications 52,939 0.71%
Transportation and Postal Service 222,196 2.97%
Wholesale and Retail Trade 702,640 9.40%
Finance and Insurance 304,427 4.07%
Real Estate and Leasing 1,727,117 23.09%
Services 465,584 6.23%
Government and Local Public Sector 220,257 2.95%
Others (Mainly Consumer Loans) 2,770,748 37.05%
Total ¥7,478,359 100.00%
Overseas Operations and JOM Account ¥ 76,564 —
Millions of Yen
March 31, 2011Outstanding
Balance
Composition
Domestic operations:
Manufacturing ¥ 700,812 9.61%
Agriculture and Forestry 7,986 0.11%
Fisheries 909 0.01%
Mining, Quarrying and Gravel 15,913 0.22%
Construction 296,303 4.06%
Electricity, Gas, Heat Supply and Water 18,947 0.26%
Information and Communications 44,128 0.61%
Transportation and Postal Service 215,982 2.96%
Wholesale and Retail Trade 693,095 9.50%
Finance and Insurance 329,020 4.51%
Real Estate and Leasing 1,644,830 22.54%
Services 456,606 6.26%
Government and Local Public Sector 202,268 2.77%
Others (Mainly Consumer Loans) 2,669,050 36.58%
Total ¥7,295,852 100.00%
Overseas Operations and JOM Account ¥ 50,291 —

57
F i n a n c i a l a n d C o r p o r a t e I n f o r m a t i o n
Board of Directors
The Board of Directors consists of nine directors. The directors
make decisions about management policies and other important
matters and supervise the execution of business by the directors
and executive officers. In addition, the Board of Designated Direc-
tors, which consists of directors appointed by the Board of Direc-
tors, meets once each week as a rule to discuss important matters
concerning business operations and other subjects for the purpose
of responding swiftly and appropriately to changes in the operating
environment.
Corporate Auditors
The Chiba Bank has adopted a corporate auditor system with five
corporate auditors, including three highly independent outside cor-
porate auditors. In addition, two of the three outside corporate au-
ditors are standing corporate auditors. They regularly attend meet-
ings of the Board of Directors and other important meetings, check
important documents, and perform other tasks to conduct objec-
tive and reasonable audits for verifying that business operations are
sound and legal. The Chiba Bank believes that this system provides
an adequate management supervisory function.
Executive Officer System
The Chiba Bank employs an executive officer system. Executive of-
ficers, who are appointed by the Board of Directors, are responsible
for business operations in the departments under their supervision.
This system provides for the clear separation of the roles of the di-
rectors, who reach decisions on important matters, supervise the
execution of business operations, and perform other tasks, and the
role of the executive officers, who conduct business operations. In
addition, the Board of Directors and Executive Officers meets once
each month as a rule. This board assists the directors in making
decisions swiftly and properly, checks the business activities that are
conducted by the executive officers, and assists executive officers in
conducting business operations.
Internal Auditing
The Audit and Inspection Division, which is independent of the
units subject to auditing, conducts internal audits of headquarters,
branches and subsidiaries in accordance with the Internal Audit Plan
established each year by the Board of Directors. Audit results and
any observations are reported monthly to the Board of Directors, and
problem areas from the perspective of compliance and risk man-
agement and improvement measures are examined by the Internal
Auditing Committee.
Group Management Systems
The Chiba Bank maintains a system under which subsidiaries decide
their own regulations, in line with the Bank’s Compliance Regulations
and various risk management regulations, and the Bank’s adminis-
trative departments control subsidiary compliance and risk manage-
ment. The Chiba Bank’s internal audit units conduct internal audits
of subsidiaries and assure proper operations throughout the Chiba
Bank Group. For important business operations, Bank consultations
and/or reports are timely required of each Group company. In ad-
dition, the Chiba Bank holds regular meetings with the directors of
each subsidiary to facilitate the sharing of information concerning
management issues in the Chiba Bank Group.
Basic Policy on Establishing Internal Control Systems
The Chiba Bank introduced a basic policy for the establishment of
systems to ensure the appropriateness of operations (Internal Con-
trol Systems) through the Board of Directors. In accordance with this
policy, the Chiba Bank is working to establish a high-quality manage-
ment structure.
Corporate Governance
The Chiba Bank’s fundamental approach to corporate governance is to base all of the Bank’s activities on the Chiba Bank Code
of Ethics, which includes earning unwavering trust, thorough compliance with laws, rules and other fundamental principles,
opposition to antisocial forces, transparent management, and other items. We are currently implementing “Frontier 70,” our
medium-term management plan, which covers the three-year period up to the fiscal year ending March 31, 2014. To earn the
trust of our customers, upgrading management activities is a central theme of the plan. This includes conducting a rigorous
compliance program, strengthening management systems for protecting customers, and other actions. We position the
reinforcement and enhancement of corporate governance as one of our highest management priorities in order to accomplish
these goals. Based on this stance, the Chiba Bank has the following framework for corporate governance.

58
Organization The Chiba Bank, Ltd.As of June 28, 2012
GeneralMeeting ofShareholders
Board ofDesignatedDirectors
Credit Unit
Credit Division
Business Support DivisionStaff
Corporate Auditors
Board of Corporate Auditors
Audit and Inspection Division
Board ofDirectors
Business Promotion Unit
Business Planning Division
Branch Support Division
Corporate Business Division
Regional Business Division
Treasury Division
Treasury Operation Division
Operation Division
EDP System Division
Asset Management Support Division
Operation Planning Division
IT Strategy Office
Business Operation Division
Corporate Planning Division
Public Relations and CSR Division
Corporate Administration Division
Risk Management Division
General Secretariat
Corporate Planning and Administration Unit
Human Resources Division
Compliance Division

59
F i n a n c i a l a n d C o r p o r a t e I n f o r m a t i o n
Directors, Executive Officers and Corporate AuditorsThe Chiba Bank, Ltd.As of June 28, 2012
Directors
President (Representing Director)
Hidetoshi Sakuma
Director and Senior Executive Officer(Representing Director)
Tetsuya KoikeHead of Business Promotion UnitExecutive Officer in charge of Branch Support Division and Asset Management Support Division
Director and Senior Executive Officer
Katsumi IchiharaHead of Corporate Planning and Administration UnitExecutive Officer in charge of Public Relations and CSR Division, Corporate Administration Division, Human Resources Division and General Secretariat
Director and Senior Executive Officer
Kyoichi HanashimaHead of Credit UnitExecutive Officer in charge of Credit Division and Business Support Division
Director and Managing Executive Officer
Masao MorimotoExecutive Officer in charge of Operation Planning Division, EDP System Division, IT Strategy Office, Business Operation Division and Operation Division
Director and Managing Executive Officer
Toshikazu OkuboExecutive Officer in charge of Corporate Planning Division
Director and Managing Executive Officer
Osamu KimuraExecutive Officer in charge of Business Planning Division, Corporate Business Division and Regional Business Division
Director and Managing Executive Officer
Takeshi KuboExecutive Officer in charge of Treasury Division and Treasury Operation Division
Director and Executive Officer
Toru NomuraExecutive Officer in charge of Risk Management Division and Compliance Division
Executive Officers
Executive Officer
Hiroshi YoshinoGeneral Manager, Audit and Inspection Division
Executive Officer
Yoshinori TakeuchiGeneral Manager, Chuo Branch
Executive Officer
Shoichi HatanoGeneral Manager, Branch Support Division
Executive Officer
Masahiro SuzukiGeneral Manager, Funabashi Branch
Executive Officer
Masami OhtaGeneral Manager, Corporate Business Division
Executive Officer
Masaaki SugiyamaGeneral Manager, Tokyo Head Office
Executive Officer
Eiji TaniguchiGeneral Manager, Head Office
Executive Officer
Tomoyuki IkedaGeneral Manager, Corporate Planning Division
Executive Officer
Masahiro OwakuGeneral Manager, Credit Division
Corporate Auditors
Standing Corporate Auditor
Tsutomu Nozawa
Standing Corporate Auditor
Yukio Saruhashi
Standing Corporate Auditor
Junichiro Seo
Corporate Auditor
Susumu Maruyama
Corporate Auditor
Akio Shirato
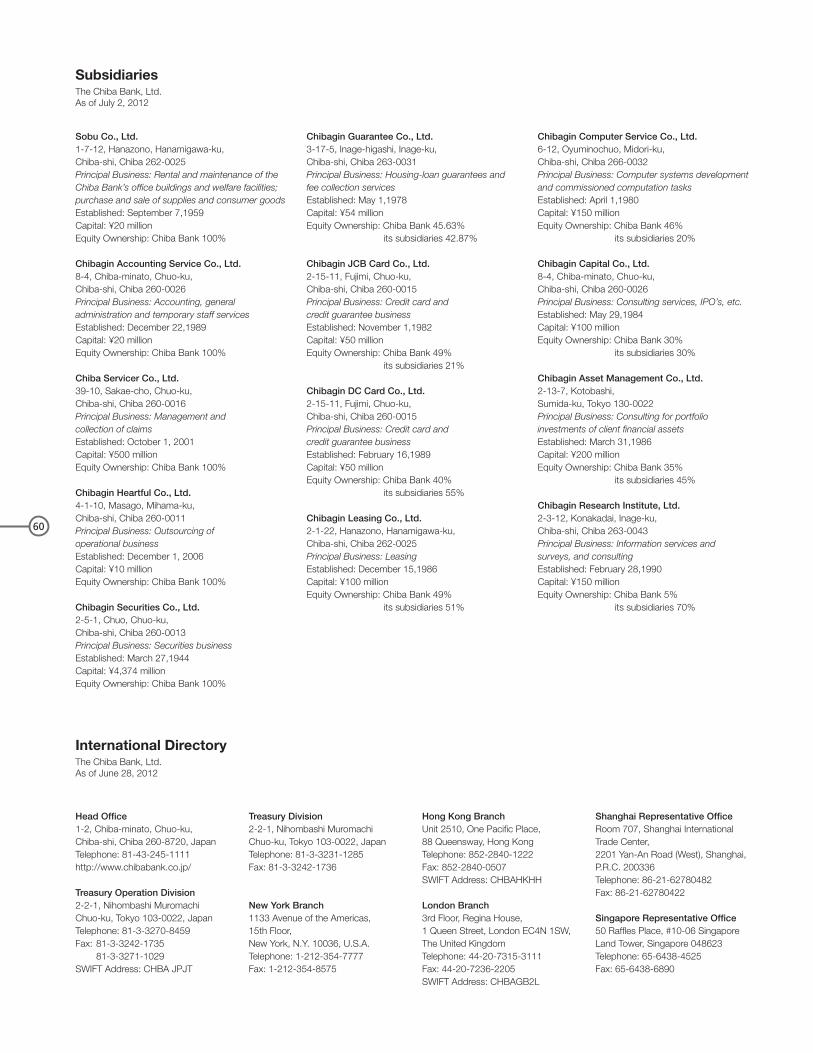
60
SubsidiariesThe Chiba Bank, Ltd.As of July 2, 2012
International DirectoryThe Chiba Bank, Ltd.As of June 28, 2012
Head Office1-2, Chiba-minato, Chuo-ku,Chiba-shi, Chiba 260-8720, JapanTelephone: 81-43-245-1111http://www.chibabank.co.jp/
Treasury Operation Division2-2-1, Nihombashi Muromachi Chuo-ku, Tokyo 103-0022, JapanTelephone: 81-3-3270-8459Fax: 81-3-3242-1735 81-3-3271-1029SWIFT Address: CHBA JPJT
Treasury Division2-2-1, Nihombashi Muromachi Chuo-ku, Tokyo 103-0022, JapanTelephone: 81-3-3231-1285Fax: 81-3-3242-1736
New York Branch1133 Avenue of the Americas, 15th Floor,New York, N.Y. 10036, U.S.A.Telephone: 1-212-354-7777Fax: 1-212-354-8575
Hong Kong BranchUnit 2510, One Pacific Place, 88 Queensway, Hong KongTelephone: 852-2840-1222Fax: 852-2840-0507SWIFT Address: CHBAHKHH
London Branch3rd Floor, Regina House, 1 Queen Street, London EC4N 1SW, The United KingdomTelephone: 44-20-7315-3111Fax: 44-20-7236-2205SWIFT Address: CHBAGB2L
Shanghai Representative OfficeRoom 707, Shanghai International Trade Center,2201 Yan-An Road (West), Shanghai, P.R.C. 200336Telephone: 86-21-62780482Fax: 86-21-62780422
Singapore Representative Office50 Raffles Place, #10-06 Singapore Land Tower, Singapore 048623Telephone: 65-6438-4525Fax: 65-6438-6890
Sobu Co., Ltd.1-7-12, Hanazono, Hanamigawa-ku, Chiba-shi, Chiba 262-0025Principal Business: Rental and maintenance of the Chiba Bank’s office buildings and welfare facilities; purchase and sale of supplies and consumer goodsEstablished: September 7,1959Capital: ¥20 millionEquity Ownership: Chiba Bank 100%
Chibagin Accounting Service Co., Ltd.8-4, Chiba-minato, Chuo-ku, Chiba-shi, Chiba 260-0026Principal Business: Accounting, general administration and temporary staff services Established: December 22,1989Capital: ¥20 millionEquity Ownership: Chiba Bank 100%
Chiba Servicer Co., Ltd.39-10, Sakae-cho, Chuo-ku, Chiba-shi, Chiba 260-0016Principal Business: Management and collection of claimsEstablished: October 1, 2001Capital: ¥500 millionEquity Ownership: Chiba Bank 100%
Chibagin Heartful Co., Ltd.4-1-10, Masago, Mihama-ku, Chiba-shi, Chiba 260-0011Principal Business: Outsourcing of operational businessEstablished: December 1, 2006Capital: ¥10 millionEquity Ownership: Chiba Bank 100%
Chibagin Securities Co., Ltd.2-5-1, Chuo, Chuo-ku,Chiba-shi, Chiba 260-0013Principal Business: Securities businessEstablished: March 27,1944Capital: ¥4,374 millionEquity Ownership: Chiba Bank 100%
Chibagin Guarantee Co., Ltd.3-17-5, Inage-higashi, Inage-ku, Chiba-shi, Chiba 263-0031Principal Business: Housing-loan guarantees and fee collection servicesEstablished: May 1,1978Capital: ¥54 millionEquity Ownership: Chiba Bank 45.63% its subsidiaries 42.87%
Chibagin JCB Card Co., Ltd.2-15-11, Fujimi, Chuo-ku, Chiba-shi, Chiba 260-0015Principal Business: Credit card and credit guarantee businessEstablished: November 1,1982Capital: ¥50 millionEquity Ownership: Chiba Bank 49% its subsidiaries 21%
Chibagin DC Card Co., Ltd.2-15-11, Fujimi, Chuo-ku, Chiba-shi, Chiba 260-0015Principal Business: Credit card and credit guarantee businessEstablished: February 16,1989Capital: ¥50 millionEquity Ownership: Chiba Bank 40% its subsidiaries 55%
Chibagin Leasing Co., Ltd.2-1-22, Hanazono, Hanamigawa-ku, Chiba-shi, Chiba 262-0025Principal Business: LeasingEstablished: December 15,1986Capital: ¥100 millionEquity Ownership: Chiba Bank 49% its subsidiaries 51%
Chibagin Computer Service Co., Ltd.6-12, Oyuminochuo, Midori-ku, Chiba-shi, Chiba 266-0032Principal Business: Computer systems development and commissioned computation tasksEstablished: April 1,1980Capital: ¥150 millionEquity Ownership: Chiba Bank 46% its subsidiaries 20%
Chibagin Capital Co., Ltd.8-4, Chiba-minato, Chuo-ku, Chiba-shi, Chiba 260-0026Principal Business: Consulting services, IPO’s, etc.Established: May 29,1984Capital: ¥100 millionEquity Ownership: Chiba Bank 30% its subsidiaries 30%
Chibagin Asset Management Co., Ltd.2-13-7, Kotobashi, Sumida-ku, Tokyo 130-0022Principal Business: Consulting for portfolio investments of client financial assetsEstablished: March 31,1986Capital: ¥200 millionEquity Ownership: Chiba Bank 35% its subsidiaries 45%
Chibagin Research Institute, Ltd.2-3-12, Konakadai, Inage-ku, Chiba-shi, Chiba 263-0043Principal Business: Information services and surveys, and consultingEstablished: February 28,1990Capital: ¥150 millionEquity Ownership: Chiba Bank 5% its subsidiaries 70%

61
F i n a n c i a l a n d C o r p o r a t e I n f o r m a t i o n
Corporate DataThe Chiba Bank, Ltd.As of March 31, 2012
Corporate InformationEstablished March 1943
Network Domestic
174 Offices (155 branches, 17 sub-branches and 2 virtual branches) 36,032 Off-branch ATM locations (including 11,534 E-net ATM locations at convenience stores, 9,078 LAWSON ATM
locations at convenience stores and 15,161 ATM locations jointly with Seven Bank, Ltd.) 3 Money exchange counters
Overseas 3 Branches (New York/Hong Kong/London) 2 Representative offices (Shanghai/Singapore)
Number of Employees*1 4,308
Total Assets ¥10,858.5 billion
Loans and Bills Discounted ¥7,581.7 billion
Deposits (including NCD) ¥9,677.8 billion
Capital Stock ¥145.0 billion
Capital Ratio (BIS guidelines) 14.35% (Consolidated) 13.63% (Non-consolidated)
Authorized Number of Shares 2,500,000 thousand
Number of Issued Shares 895,521 thousand
Number of Shareholders*2 26,972
TSE Code 8331
Transfer AgentJAPAN SECURITIES AGENTS, LTD.1-2-4, Nihombashi Kayabacho, Chuo-ku, Tokyo 103-8202
Long-term Short-term
Standard & Poor’s A A-1
Credit Ratings Moody’s A1 P-1
Rating and Investment Information AA- —
Figures as shown are presented on a non-consolidated basis.*1 Number of Employees includes transferred employees but excludes temporary staff and one-year contract employees.*2 Shareholders with fewer than 1,000 shares are excluded.
Principal ShareholdersThe ten largest shareholders of the Chiba Bank and their respective shareholdings as of March 31, 2012 were as follows:
Number of shares
(in thousands)*1
Percentage of total
shares issued*2 (%)
Japan Trustee Services Bank, Ltd. (Trust Account) 55,535 6.20
The Master Trust Bank of Japan, Ltd. (Trust Account) 38,408 4.28
The Bank of Tokyo-Mitsubishi UFJ, Ltd. 35,414 3.95
NIPPONKOA Insurance Company, Limited 29,998 3.34
NIPPON LIFE INSURANCE COMPANY 29,270 3.26
The Dai-ichi Life Insurance Company, Limited 26,230 2.92
SUMITOMO LIFE INSURANCE COMPANY 17,842 1.99
Meiji Yasuda Life Insurance Company 15,891 1.77
Chiba Bank Employees’ Shareholding Association 12,505 1.39
The Keiyo Bank, Ltd. 10,187 1.13
Except for the list above, there are 15,720 thousand (1.75%) of own shares. (Excludes one thousand shares which, although registered in the name of the Chiba Bank on the shareholders’ list, are not actually owned by the Chiba Bank.) *1 Rounded down to the nearest thousand*2 Rounded down to the second decimal place

1-2, Chiba-minato, Chuo-ku, Chiba-shi, Chiba 260-8720, JapanPhone: 81-43-245-1111e-mail: [email protected]://www.chibabank.co.jp/