discover financial services financial annual report
TRANSCRIPT

DISCOVER F INANCIAL SERVICES
FINANCIAL ANNUAL REPORT 2007

DISCOVER FINANCIAL SERVICESFinancial Annual Report 2007
Table of Contents
Selected Financial Data . . . . . . . . . . . . . . . . . . . . . . . . . . . . . . . . . . . . . . . . . . . . . . . . . . . . . . . . . . . . . . . . . . . 1
Management’s Discussion and Analysis of Financial Condition and Results of Operations* . . . . . . . . . . . . . 4
Quantitative and Qualitative Disclosures about Market Risk . . . . . . . . . . . . . . . . . . . . . . . . . . . . . . . . . . . . . . 42
Financial Statements and Supplementary Data . . . . . . . . . . . . . . . . . . . . . . . . . . . . . . . . . . . . . . . . . . . . . . . . . 44
Market for Registrant’s Common Equity and Stock Performance Graph . . . . . . . . . . . . . . . . . . . . . . . . . . . . 103
Officers and Directors; Corporate Information . . . . . . . . . . . . . . . . . . . . . . . . . . . . . . . . . . . . . . . . . . . . . . . . . 104
We own or have rights to use the trademarks, trade names and service marks that we use in conjunction withthe operation of our business, including, but not limited to: Discover, PULSE, Cashback Bonus, ShopDiscover,Discover Motiva Card, Miles by Discover Card, Discover Open Road Card, Discover Network and Goldfish. Allother trademarks, trade names and service marks included in this financial annual report are the property of theirrespective owners.
* Information regarding Sale of International Card Segment; First Quarter 2008 Charge (including reconciliationof pro forma results) and Reconciliation of GAAP to Managed Data is provided at pages 7 and 12,respectively.

Selected Financial Data
The following table presents our selected historical financial data and operating statistics. The statement ofincome data for each of the years in the three-year period ended November 30, 2007 and the statement offinancial condition data as of November 30, 2007 and 2006 have been derived from our audited consolidated andcombined financial statements included elsewhere in this financial annual report. The statement of income datafor the years ended November 30, 2004 and 2003 and the statement of financial condition data as ofNovember 30, 2005, 2004 and 2003 are derived from the audited and unaudited combined financial statementsnot included elsewhere in this financial annual report. The unaudited financial statements have been prepared onthe same basis as the audited financial statements, and in the opinion of our management include all adjustments,consisting of only ordinary recurring adjustments, necessary for a fair presentation of the information set forth inthis financial annual report.
The selected historical financial data and operating statistics presented below should be read in conjunctionwith our audited consolidated and combined financial statements and accompanying notes and “Management’sDiscussion and Analysis of Financial Condition and Results of Operations” included elsewhere in this financialannual report. The combined financial information may not be indicative of our future performance and does notnecessarily reflect what the financial position and results of operations would have been had we operated as aseparate, stand-alone entity during the periods presented, including changes that occurred in our operations andcapitalization as a result of our spin-off from Morgan Stanley.
Included in the selected historical financial data are certain amounts and statistics reported on a managedbasis. Our senior management evaluates business performance and allocates resources using financial data that ispresented on a managed basis. Managed loans consist of our on-balance sheet loan portfolio, loans held for saleand loan receivables that have been securitized and against which beneficial interests have been issued. Ownedloans, a subset of managed loans, refer to our on-balance sheet loan portfolio and loans held for sale and includethe undivided seller’s interest we retain in our securitizations. A managed basis presentation, which is not apresentation in accordance with GAAP, involves reporting securitized loans with our owned loans in themanaged basis statements of financial condition and reporting the earnings on securitized loans in the samemanner as the owned loans instead of as securitization income. See “Management’s Discussion and Analysis ofFinancial Condition and Results of Operations—GAAP to Managed Data Reconciliations.”
1

Discover Financial ServicesSelected Historical Data
For the Years Ended November 30,
2007 2006 2005 2004 2003
Statement of Income Data: (dollars in thousands, except per share amounts)Interest income . . . . . . . . . . . . . . . . . . . . . . . . . . . . . . . . . . $ 2,888,169 $ 2,458,526 $ 2,174,811 $ 1,859,504 $ 2,048,695Interest expense . . . . . . . . . . . . . . . . . . . . . . . . . . . . . . . . . 1,382,415 940,040 776,479 647,622 789,667
Net interest income . . . . . . . . . . . . . . . . . . . . . . . . . . . . 1,505,754 1,518,486 1,398,332 1,211,882 1,259,028Other income . . . . . . . . . . . . . . . . . . . . . . . . . . . . . . . . . . . 3,546,119 3,538,939 2,937,037 3,248,386 3,313,478
Revenue net of interest expense . . . . . . . . . . . . . . . . . . . 5,051,873 5,057,425 4,335,369 4,460,268 4,572,506Provision for loan losses . . . . . . . . . . . . . . . . . . . . . . . . . . 950,165 755,637 878,486 925,549 1,266,113Other expense (1) . . . . . . . . . . . . . . . . . . . . . . . . . . . . . . . . 3,156,512 2,719,483 2,532,627 2,315,812 2,279,485
Income before income tax expense(1) . . . . . . . . . . . . . . . 945,196 1,582,305 924,256 1,218,907 1,026,908Income tax expense(1) . . . . . . . . . . . . . . . . . . . . . . . . . . . . . 356,566 505,689 346,341 442,654 378,277
Net income(1) . . . . . . . . . . . . . . . . . . . . . . . . . . . . . . . . . $ 588,630 $ 1,076,616 $ 577,915 $ 776,253 $ 648,631
Statement of Financial Condition Data (as of):Loan receivables . . . . . . . . . . . . . . . . . . . . . . . . . . . . . . . . $ 23,954,295 $ 23,742,750 $ 22,803,166 $20,129,415 $19,379,086Total assets . . . . . . . . . . . . . . . . . . . . . . . . . . . . . . . . . . . . . $ 37,376,105 $ 29,067,242 $ 26,943,923 $24,122,009 $24,032,743Total stockholders’ equity . . . . . . . . . . . . . . . . . . . . . . . . . $ 5,599,422 $ 5,774,772 $ 4,600,449 $ 4,021,349 $ 3,809,285Allowance for loan losses . . . . . . . . . . . . . . . . . . . . . . . . . $ 916,844 $ 832,483 $ 838,848 $ 942,721 $ 1,001,656Long-term borrowings . . . . . . . . . . . . . . . . . . . . . . . . . . . . $ 2,134,093 $ 1,507,578 $ 863,745 $ 1,198,406 $ 931,554Total average interest-earning assets . . . . . . . . . . . . . . . . . $ 31,651,619 $ 25,546,145 $ 23,783,731 $20,627,761 $22,862,081Total average interest-bearing liabilities . . . . . . . . . . . . . . $ 25,897,063 $ 19,830,983 $ 18,656,289 $15,717,897 $17,802,398
Per Common Share:Basic EPS(1) . . . . . . . . . . . . . . . . . . . . . . . . . . . . . . . . . . . . $ 1.23 $ 2.26 $ 1.21 $ 1.63 $ 1.36Diluted EPS(1) . . . . . . . . . . . . . . . . . . . . . . . . . . . . . . . . . . . $ 1.23 $ 2.26 $ 1.21 $ 1.63 $ 1.36Weighted average shares outstanding (000’s)(2) . . . . . . . . 477,328 477,236 477,236 477,236 477,236Weighted average shares outstanding (fully diluted)
(000’s)(2) . . . . . . . . . . . . . . . . . . . . . . . . . . . . . . . . . . . . . 478,879 477,236 477,236 477,236 477,236Cash dividends . . . . . . . . . . . . . . . . . . . . . . . . . . . . . . . . . . $ 0.06 — — — —Dividend payout ratio . . . . . . . . . . . . . . . . . . . . . . . . . . . . 4.88% — — — —
Ratios:Net interest margin . . . . . . . . . . . . . . . . . . . . . . . . . . . . . . . 4.76% 5.94% 5.88% 5.88% 5.51%Return on average equity(1) . . . . . . . . . . . . . . . . . . . . . . . . 10% 20% 13% 18% 14%Return on average assets(1) . . . . . . . . . . . . . . . . . . . . . . . . . 1.73% 3.93% 2.29% 3.54% 2.68%Average stockholders’ equity to average total assets . . . . . 17% 21% 18% 20% 19%
Selected Statistics:Total Credit Card LoansCredit card loans—owned . . . . . . . . . . . . . . . . . . . . . . . . . $ 23,703,101 $ 23,646,901 $ 22,496,211 $19,723,758 $18,929,973Average credit card loans—owned . . . . . . . . . . . . . . . . . . $ 22,814,043 $ 21,656,295 $ 19,931,636 $17,608,445 $19,530,515Owned interest yield . . . . . . . . . . . . . . . . . . . . . . . . . . . . . 10.58% 10.38% 10.12% 10.05% 10.02%Owned net principal charge-off rate . . . . . . . . . . . . . . . . . 3.82% 3.79% 4.84% 5.53% 6.05%Owned delinquency rate (over 30 days) . . . . . . . . . . . . . . 3.50% 3.22% 3.69% 4.08% 5.36%Owned delinquency rate (over 90 days) . . . . . . . . . . . . . . 1.63% 1.53% 1.62% 1.97% 2.53%Credit card loans—managed . . . . . . . . . . . . . . . . . . . . . . . $ 52,302,410 $ 50,350,328 $ 46,936,274 $48,261,402 $48,357,810Average credit card loans—managed . . . . . . . . . . . . . . . . $ 51,338,135 $ 48,216,546 $ 47,330,143 $47,386,940 $50,863,666Managed interest yield . . . . . . . . . . . . . . . . . . . . . . . . . . . . 12.44% 12.36% 11.72% 11.84% 11.93%Managed net principal charge-off rate . . . . . . . . . . . . . . . . 4.08% 4.08% 5.23% 6.00% 6.60%Managed delinquency rate (over 30 days) . . . . . . . . . . . . . 3.73% 3.50% 3.98% 4.55% 5.97%Managed delinquency rate (over 90 days) . . . . . . . . . . . . . 1.74% 1.65% 1.75% 2.18% 2.82%
Total Credit Card VolumeDomestic . . . . . . . . . . . . . . . . . . . . . . . . . . . . . . . . . . . . . . $106,620,818 $102,901,893 $ 98,224,437 $94,509,183 $93,746,658International(3) . . . . . . . . . . . . . . . . . . . . . . . . . . . . . . . . . . 14,254,621 11,881,465 5,907,089 5,077,478 4,128,177
Total . . . . . . . . . . . . . . . . . . . . . . . . . . . . . . . . . . . . . . . . $120,875,439 $114,783,358 $104,131,526 $99,586,661 $97,874,835
2

Discover Financial ServicesSelected Historical Data – (continued)
For the Years Ended November 30,
2007 2006 2005 2004 2003
(dollars in thousands)Credit Card Sales VolumeDomestic . . . . . . . . . . . . . . . . . . . . . . . . . . . . . . . . . . . . . . . $ 90,262,556 $86,385,577 $81,664,000 $76,035,714 $73,974,819International(3) . . . . . . . . . . . . . . . . . . . . . . . . . . . . . . . . . . . 12,955,968 10,335,331 4,291,675 3,466,893 2,845,322
Total . . . . . . . . . . . . . . . . . . . . . . . . . . . . . . . . . . . . . . . . . $103,218,524 $96,720,908 $85,955,675 $79,502,607 $76,820,141
Other Consumer LoansDomestic loan receivables . . . . . . . . . . . . . . . . . . . . . . . . . . $ 251,194 $ 95,849 $ 176,329 $ 287,909 $ 404,514International loan receivables . . . . . . . . . . . . . . . . . . . . . . . — — 130,626 117,749 44,600
Total . . . . . . . . . . . . . . . . . . . . . . . . . . . . . . . . . . . . . . . . . $ 251,194 $ 95,849 $ 306,955 $ 405,658 $ 449,114
Transactions Processed on Networks (000’s)Discover Network . . . . . . . . . . . . . . . . . . . . . . . . . . . . . . . . 1,486,366 1,399,933 1,301,024 1,226,414 1,208,505PULSE Network(4) . . . . . . . . . . . . . . . . . . . . . . . . . . . . . . . . 2,285,061 1,856,477 1,555,782 — —
Total . . . . . . . . . . . . . . . . . . . . . . . . . . . . . . . . . . . . . . . . . 3,771,427 3,256,410 2,856,806 1,226,414 1,208,505
Domestic Credit Card LoansCredit card loans—owned . . . . . . . . . . . . . . . . . . . . . . . . . . $ 20,579,923 $20,694,395 $20,434,977 $18,606,211 $17,586,884Average credit card loans—owned . . . . . . . . . . . . . . . . . . . $ 19,845,880 $19,120,946 $18,644,660 $16,228,520 $17,938,722Owned interest yield . . . . . . . . . . . . . . . . . . . . . . . . . . . . . . 10.75% 10.50% 10.16% 10.13% 10.15%Owned net principal charge-off rate . . . . . . . . . . . . . . . . . . 3.41% 3.64% 4.95% 5.75% 6.34%Owned delinquency rate (over 30 days) . . . . . . . . . . . . . . . 3.28% 3.05% 3.69% 4.19% 5.54%Owned delinquency rate (over 90 days) . . . . . . . . . . . . . . . 1.53% 1.44% 1.61% 2.03% 2.62%Credit card loans—managed . . . . . . . . . . . . . . . . . . . . . . . . $ 47,929,242 $45,706,222 $44,261,121 $45,690,728 $46,141,977Average credit card loans—managed . . . . . . . . . . . . . . . . . $ 46,811,570 $44,277,249 $44,736,702 $45,018,288 $48,590,494Managed interest yield . . . . . . . . . . . . . . . . . . . . . . . . . . . . . 12.66% 12.53% 11.78% 11.91% 12.05%Managed net principal charge-off rate . . . . . . . . . . . . . . . . . 3.84% 3.96% 5.30% 6.12% 6.75%Managed delinquency rate (over 30 days) . . . . . . . . . . . . . . 3.59% 3.39% 3.98% 4.65% 6.09%Managed delinquency rate (over 90 days) . . . . . . . . . . . . . . 1.68% 1.59% 1.75% 2.24% 2.88%
International Credit Card LoansCredit card loans—owned(3) . . . . . . . . . . . . . . . . . . . . . . . . . $ 3,123,178 $ 2,952,506 $ 2,061,234 $ 1,117,547 $ 1,343,089Average credit card loans—owned(3) . . . . . . . . . . . . . . . . . . $ 2,968,163 $ 2,535,349 $ 1,286,976 $ 1,379,925 $ 1,591,793Owned interest yield . . . . . . . . . . . . . . . . . . . . . . . . . . . . . . 9.42% 9.51% 9.63% 9.13% 8.51%Owned net principal charge-off rate . . . . . . . . . . . . . . . . . . 6.56% 4.94% 3.28% 2.94% 2.80%Owned delinquency rate (over 30 days) . . . . . . . . . . . . . . . 4.91% 4.36% 3.78% 2.23% 2.93%Owned delinquency rate (over 90 days) . . . . . . . . . . . . . . . 2.27% 2.16% 1.73% 0.96% 1.41%Credit card loans—managed(3) . . . . . . . . . . . . . . . . . . . . . . . $ 4,373,168 $ 4,644,106 $ 2,675,153 $ 2,570,674 $ 2,215,833Average credit card loans—managed(3) . . . . . . . . . . . . . . . . $ 4,526,565 $ 3,939,297 $ 2,593,441 $ 2,368,652 $ 2,273,172Managed interest yield . . . . . . . . . . . . . . . . . . . . . . . . . . . . . 10.11% 10.38% 10.72% 10.62% 9.44%Managed net principal charge-off rate . . . . . . . . . . . . . . . . . 6.54% 5.45% 4.10% 3.87% 3.44%Managed delinquency rate (over 30 days) . . . . . . . . . . . . . . 5.25% 4.58% 3.95% 2.78% 3.29%Managed delinquency rate (over 90 days) . . . . . . . . . . . . . . 2.43% 2.22% 1.81% 1.22% 1.60%
(1) 2007 includes a $391 million pretax ($279 million after tax) non-cash impairment charge related to our International Card segment.(2) On June 30, 2007, the distribution by Morgan Stanley was completed to the Morgan Stanley stockholders of one share of Discover
Financial Services common stock for every two shares of Morgan Stanley common stock held on June 18, 2007 (the “Distribution”). Asa result, on July 2, 2007, the Company had 477,235,927 shares of common stock outstanding and this share amount is being utilized forthe calculation of basic EPS for all periods presented prior to the date of Distribution. For all periods prior to the date of Distribution, thesame number of shares is being used for diluted EPS as for basic EPS as no common stock of Discover Financial Services was tradedprior to July 2, 2007 and no Discover equity awards were outstanding for the prior periods.
(3) The Goldfish and Liverpool Victoria portfolios were acquired in 2006.(4) PULSE was acquired in January 2005.
3

Management’s Discussion and Analysis of Financial Condition and Results of Operations
The following discussion and analysis of our financial condition and results of operations should be read inconjunction with our audited consolidated and combined financial statements and related notes includedelsewhere in this financial annual report. Some of the information contained in this discussion and analysisconstitutes forward-looking statements that involve risks and uncertainties. Actual results could differ materiallyfrom those discussed in these forward-looking statements. Factors that could cause or contribute to thesedifferences include, but are not limited to, those discussed below and elsewhere in this financial annual reportand under “Special Note Regarding Forward-Looking Statements” and “Risk Factors” included in our annualreport on Form 10-K for the year ended November 30, 2007 on file with the SEC.
Unless otherwise specified, references to Notes to the audited consolidated and combined financialstatements are to the Notes to our audited consolidated and combined financial statements as of November 30,2007 and 2006 and for the three-year period ended November 30, 2007.
Introduction and Overview
We are a leading credit card issuer and electronic payment services company with one of the mostrecognized brands in U.S. financial services. We offer credit and prepaid cards and other financial products andservices to qualified customers in the United States and the United Kingdom, and provide payment processingand related services to merchants and financial institutions in the United States. Our year ends on November 30of each year.
We strive to increase net income and achieve other business objectives by growing loan receivables andincreasing volume on our payments networks to generate interest and fee revenue, while controlling loan lossesand expenses. Our primary revenues come from interest income earned on loan receivables, securitizationincome derived from the transfer of credit card loan receivables and subsequent issuance of beneficial intereststhrough securitization transactions, and fees earned from cardmembers, merchants and issuers. Our primaryexpenses include funding costs (interest expense), loan losses, cardmember rewards and expenses incurred togrow and service our loan receivables (e.g., compensation expense and marketing).
We are actively pursuing a strategy to increase acceptance of Discover Network cards among small andmid-size merchants. We have entered into arrangements with major merchant acquirers to sign new and serviceexisting small and mid-size merchants for acceptance of Discover Network cards.
We undertook a number of initiatives in an effort to restore profitability to our U.K. operations over the longterm and offset the impact of higher loan losses and lower interchange and fee revenues. These initiativesincluded insourcing of our processing platform, consolidation of our operational centers, reductions in staffingand achieving procurement efficiencies. In addition, we revised certain risk policies, modified pricing forportions of the portfolio, implemented annual fees for certain customers, introduced new fee products andmodified certain transaction based fees. On February 7, 2008, we announced that we had entered into a definitivesale and purchase agreement to sell our U.K. credit card business, which represents substantially all of theInternational Card segment, to Barclay’s Bank Plc. See “—Sale of International Card Segment; First Quarter2008 Charge” below for further discussion.
Our business activities have been funded primarily through the process of asset securitization, the raising ofconsumer deposits, and, prior to the Distribution, intercompany lending from Morgan Stanley which has beenreplaced with asset-backed financing and both secured and unsecured debt. In a credit card securitization, loanreceivables are first transferred to securitization trusts, from which beneficial interests are issued to investors. Wecontinue to own and service the accounts that generate the securitized loans. The trusts utilized by us to facilitateasset securitization transactions are not our subsidiaries and are independent from us. These trusts are excludedfrom our consolidated and combined financial statements in accordance with GAAP. Because our securitizationactivities qualify as sales under GAAP and accordingly are not treated as secured financing transactions, weremove credit card loan receivables equal to the amount of the investor interests in securitized loans from the
4

consolidated and combined statements of financial condition. As a result, asset securitizations have a significanteffect on our consolidated and combined financial statements in that the portions of interest income, provision forloan losses and certain components of other income related to the securitized loans against which beneficialinterests have been issued are no longer recorded in our consolidated and combined statements of income;however, they remain significant factors in determining the securitization income we receive on our retainedbeneficial interests in those transactions. Securitization income is our second most significant revenue category.
Our senior management evaluates business performance and allocates resources using financial data that ispresented on a managed basis. Managed loans consist of our on-balance sheet loan portfolio, loans held for saleand loan receivables that have been securitized and against which beneficial interests have been issued. Ownedloans, a subset of managed loans, refer to our on-balance sheet loan portfolio and loans held for sale and includethe undivided seller’s interest we retain in our securitizations. A managed basis presentation, which is anon-GAAP presentation, involves reporting securitized loans with our owned loans in the managed basisstatements of financial condition and reporting the earnings on securitized loans in the same manner as theowned loans instead of as securitization income. The managed basis presentation generally reverses the effects ofsecuritization transactions; however, there are certain assets that arise from securitization transactions that are notreversed. Specifically, these assets are the cash collateral accounts that provide credit enhancement to theinvestors in the transactions and cardmember payments allocated to the securitized loans, both of which are heldat the trusts. These assets also include the interest-only strip receivable, reflecting the estimated fair value of theexcess cash flows allocated to securitized loans and retained certificated beneficial interests. Income derivedfrom these assets representing interest earned on accounts at the trusts, changes in the fair value of the interest-only strip receivable and interest income on investment securities also are not reversed in a managedpresentation.
Management believes it is useful for investors to consider the credit performance of the entire managed loanportfolio to understand the quality of loan originations and the related credit risks inherent in the owned portfolioand retained interests in our securitizations. Managed loan data is also relevant because we service the securitizedand owned loans, and the related accounts, in the same manner without regard to ownership of the loans.
Financial measures using managed data are non-GAAP financial measures. Whenever managed data ispresented in this financial annual report, a reconciliation of the managed data to the most directly comparableGAAP-basis financial measure is provided. See “—GAAP to Managed Data Reconciliations.”
Key Developments Impacting Reported Results
• In August 2007, management began a strategic review of the International Card segment. This review,which was completed in the fourth quarter, involved a review of U.K. financing options and costs(particularly given market disruptions), consideration of industry trends in the United Kingdom, thevarious challenges facing credit card issuers in that market, the impact of certain initiatives we havealready undertaken to restore profitability to the segment and the expected impact of additional actionsplanned in light of these circumstances. As a result of the strategic review, management revised itslong-range projections for the International Card segment, and revised its estimate of the segment’s fairvalue. The carrying value of the International Card segment at November 30, 2007 was in excess of itsrevised estimated fair value, and, as such, we recorded a non-cash impairment charge of $391 million($279 million after tax) to other expense. The total pretax impairment charge included a $291 millionwrite-down of goodwill and $100 million write-down of other intangible assets.
• Certain of our interest-earning assets and interest-bearing liabilities have floating rates which are tied toshort-term market indices, such as the Federal Funds rate and LIBOR. During the year endedNovember 30, 2006, the Federal Reserve increased the Federal Funds target rate by 125 bps to 5.25%.As a result, the yields on interest-earning assets and the costs of floating rate interest-bearing liabilitiesincreased during 2006 and remained at these levels for most of 2007. During this period, therelationship between the Federal Funds rate and LIBOR remained stable.
5

During the fourth quarter of 2007, in response to worsening credit conditions, the Federal Reservedecreased the Federal Funds target rate by 75 basis points to 4.50%. During this period, tight creditconditions caused the relationship between the Federal Funds rate and LIBOR to change materially,with LIBOR often remaining significantly higher than the Federal Funds rate. Also, asset-backedcommercial paper rates rose and credit spreads widened materially.
Market conditions also reduced the availability of new issuance in certain funding markets. In responseto various liquidity events, our senior management increased the size of our liquidity reserve.
• In the United Kingdom, disruptions in the financial markets as well as a weakened consumer creditenvironment have impacted asset-backed securitization issuance, leading us to retain on our balancesheet approximately $500 million of receivables from a maturing asset-backed transaction as ofNovember 30, 2007.
• On June 30, 2007, our Distribution from Morgan Stanley became effective. Our results of operationsfor the year ended November 30, 2007 include costs incurred as a result of the Distribution ofapproximately $34 million.
• New U.S. bankruptcy legislation became effective in October 2005, making it more difficult forconsumers to declare bankruptcy. We experienced a surge in bankruptcy receipts leading up to theeffective date of this legislation. We charge off bankrupt accounts at the end of the month that is 60days following the receipt of notification of the bankruptcy, so in the second half of calendar 2005 weexperienced higher charge-offs as a result of this legislation. October 2005 was the peak month forbankruptcy receipts during this transition to new legislation. October receipts, in accordance with ourpolicy, were charged off in December 2005.
The results of 2005 were adversely impacted by a higher level of bankruptcy charge-offs, a negativerevaluation of the interest-only strip receivable reflecting the impact on projected excess spread ofelevated charge-offs in December 2005 and additional provisions to the allowance for loans losses forbankrupt accounts in the portfolio at November 30, 2005. We experienced a dramatic decline inbankruptcy receipts following the effective date of the new U.S. bankruptcy legislation. The results of2006 benefited from a significantly lower level of bankruptcy charge-offs, a favorable revaluation ofthe interest-only strip receivable reflecting higher excess spread projections and a decrease in the levelof allowance for loan losses. We believe the passing of this legislation negatively impacted 2005 andbenefited the overall results of 2006, causing year-over-year comparisons to the year endedNovember 30, 2007 to be impacted as well. During 2007, the Company experienced a higher level ofbankruptcy charge-offs, although still significantly lower than pre-legislation levels.
• Separate from the previously described impact of the surge in bankruptcy receipts, the underlyingcredit quality of the U.S. loan receivables continued to improve in 2006 and 2005 and remainedrelatively stable throughout most of 2007. In the fourth quarter of 2007, delinquencies began to risereflecting the downturn in market conditions.
• During 2006 and 2005, certain matters caused our use of certain funding sources, including the U.S.credit card securitization market, to vary from our historical use of this market for funding ourbusiness. Following Morgan Stanley’s announcement in April 2005 to explore a spin-off of Discover,the counter party credit ratings on Discover Bank were lowered to their current levels. As a result ofour lower credit ratings, we lost access to Federal Funds as a significant source of short-term financing,but were able to mitigate the impact by increasing short-term borrowings from Morgan Stanley.
In response to the exploration of the spin-off, Moody’s placed the asset-backed securities issueddomestically by the Discover Card Master Trust I (“DCMT”) under review for a possible downgrade,which we believe contributed to a temporary disruption in our ability to access the securitizationmarkets. This disruption lasted approximately five months, at which time Moody’s re-affirmed theratings on the asset-backed securities. This deferral of new securitization transactions, as well as a high
6

level of maturities of existing securitization transactions and the discontinued issuance of new short-term certificates from the DCMT in response to higher projected charge-offs following the October2005 effective date of the new U.S. bankruptcy legislation, caused the level of securitized loans in 2005to decrease below prior year levels. These effects lingered into 2006, causing outstanding securitizationtransactions to remain somewhat lower than historical levels on average. In August 2005, MorganStanley announced that it would not pursue a spin-off of Discover.
• During the last three years, there have been increasing regulatory initiatives in the United Kingdomwith respect to late and overlimit fees, interchange fees and the sale of retail insurance products, and arelaxation of bankruptcy laws that have made it more difficult to collect on delinquent accounts andeasier for cardmembers to declare bankruptcy. The changes contributed to increased U.K. bankruptcycharge-offs and lower late fee, overlimit fee and interchange revenues.
• In February 2006, we acquired the Goldfish credit card business in the United Kingdom, addingapproximately $1.4 billion in receivables. Under the terms of the acquisition, we did not purchase anylate stage delinquencies. As such, the year ended November 30, 2006 reflects a lower level of charge-offs than the year ended November 30, 2007, which includes the full impact of the Goldfishacquisition.
Sale of International Card Segment; First Quarter 2008 Charge
On February 7, 2008 the Company and Barclays Bank Plc entered into a definitive sale and purchaseagreement relating to the sale of £129 million of net assets (equivalent to approximately $258 million) of theCompany’s U.K. credit card business, which represented substantially all of the Company’s International Cardsegment and included $3.1 billion in owned loan receivables at November 30, 2007. The aggregate sale priceunder the agreement is £35 million (equivalent to approximately $70 million), payable in cash at closing andsubject to a post-closing adjustment. The closing is expected to occur by the end of the Company’s secondquarter of 2008. As a result, the International Card segment will be presented as discontinued operationsbeginning with first quarter 2008 reporting. The sale is subject to the satisfaction of a number of conditions,including clearance from the U.K. Office of Fair Trading, a minimum value of receivables to be transferred andconsents under material contracts. There can be no assurance that the sale will occur by the end of the secondquarter of 2008, if at all.
Based on the terms of the sale, the Company expects to record charges of approximately $240 to $270million pre-tax ($190 to $210 million after tax) in the first quarter of 2008 associated with classifying thesegment as held for sale, substantially all of which will be non-cash. These charges, the majority of which areexpected to be recognized in the first quarter of 2008, include approximately $5 million related to the terminationof certain contractual arrangements and approximately $7 million of employee-related costs. This will bepartially offset by the proceeds from the sale of other assets related to the U.K. business of approximately $45million.
7

The table below shows pro forma results excluding the International Card segment, which is a non-GAAPpresentation, as well as a reconciliation of the pro forma results to the most directly comparable GAAP-basisfinancial measure:
For the Years Ended November 30,
2007 2006 2005
(dollars in thousands, except per share amounts)
Net IncomeGAAP Basis . . . . . . . . . . . . . . . . . . . . . . . . . . . . . . . . . . . . . . . . . . . . $588,630 $1,076,616 $577,915Less: International Card segment . . . . . . . . . . . . . . . . . . . . . . . . . . . . 385,457 56,613 21,641
Pro Forma excluding International Card segment . . . . . . . . . . . . . . . $974,087 $1,133,229 $599,556
Diluted Earnings per Common Share(1)
GAAP Basis . . . . . . . . . . . . . . . . . . . . . . . . . . . . . . . . . . . . . . . . . . . . $ 1.23 $ 2.26 $ 1.21Less: International Card segment . . . . . . . . . . . . . . . . . . . . . . . . . . . . 0.80 0.11 0.05
Pro Forma excluding International Card segment . . . . . . . . . . . . . . . $ 2.03 $ 2.37 $ 1.26
Return on EquityGAAP Basis . . . . . . . . . . . . . . . . . . . . . . . . . . . . . . . . . . . . . . . . . . . . 10% 20% 13%Less: International Card segment . . . . . . . . . . . . . . . . . . . . . . . . . . . . 7% 1% 1%
Pro Forma excluding International Card segment . . . . . . . . . . . . . . . 17% 21% 14%
(1) On July 2, 2007, as a result of the Distribution by Morgan Stanley, the Company had 477,235,927 shares of common stock outstanding.As no common shares were traded prior to July 2, 2007 and no equity awards were outstanding, this share amount is being used tocalculate diluted earnings per common share for 2006 and 2005.
Segments
We manage our business activities in three segments: U.S. Card, Third-Party Payments and InternationalCard. In compiling the segment results that follow, the U.S. Card segment bears all overhead costs that are notspecifically associated with a particular segment and all costs associated with Discover Network marketing,servicing and infrastructure, with the exception of an allocation of direct and incremental costs driven by theThird-Party Payments segment.
U.S. Card. The U.S. Card segment offers Discover Card-branded credit cards issued to individuals andsmall businesses over the Discover Network. Also included within the U.S. Card segment are our other consumerproducts and services businesses, including prepaid and other consumer lending and deposit products offeredthrough our subsidiary, Discover Bank.
Third-Party Payments. The Third-Party Payments segment includes PULSE EFT Association (the “PulseNetwork” or “PULSE”) and our third-party payments business.
International Card. The International Card segment offers consumer finance products and services in theUnited Kingdom, including Morgan Stanley-branded, Goldfish-branded and various affinity-branded credit cardsissued on the MasterCard and Visa networks.
8

The following table presents segment data on a managed basis (dollars in thousands), and a reconciliation toa GAAP presentation.
Managed Basis GAAP Basis
For the Years Ended November 30, U.S. CardThird-Party
PaymentsInternational
Card TotalSecuritizationAdjustment(1) Total
2007Interest income . . . . . . . . . . . . . . . . . . . $6,376,298 $ 2,376 $ 481,845 $6,860,519 $(3,972,350) $2,888,169Interest expense . . . . . . . . . . . . . . . . . . 2,729,065 19 246,704 2,975,788 (1,593,373) 1,382,415
Net interest income . . . . . . . . . . . . . . . . 3,647,233 2,357 235,141 3,884,731 (2,378,977) 1,505,754Provision for loan losses . . . . . . . . . . . . 1,853,396 — 317,446 2,170,842 (1,220,677) 950,165Other income . . . . . . . . . . . . . . . . . . . . 2,101,076 118,700 168,043 2,387,819 1,158,300 3,546,119Other expense(2) . . . . . . . . . . . . . . . . . . 2,390,463 84,097 681,952 3,156,512 — 3,156,512
Income (loss) before income taxexpense(2) . . . . . . . . . . . . . . . . . . . . . $1,504,450 $ 36,960 $(596,214) $ 945,196 $ — $ 945,196
2006Interest income . . . . . . . . . . . . . . . . . . . $5,748,698 $ 1,801 $ 416,986 $6,167,485 $(3,708,959) $2,458,526Interest expense . . . . . . . . . . . . . . . . . . 2,160,569 23 176,997 2,337,589 (1,397,549) 940,040
Net interest income . . . . . . . . . . . . . . . . 3,588,129 1,778 239,989 3,829,896 (2,311,410) 1,518,486Provision for loan losses . . . . . . . . . . . . 1,663,472 — 238,172 1,901,644 (1,146,007) 755,637Other income . . . . . . . . . . . . . . . . . . . . 2,097,676 110,700 165,160 2,373,536 1,165,403 3,538,939Other expense . . . . . . . . . . . . . . . . . . . . 2,381,880 83,529 254,074 2,719,483 — 2,719,483
Income (loss) before income taxexpense . . . . . . . . . . . . . . . . . . . . . . . $1,640,453 $ 28,949 $ (87,097) $1,582,305 $ — $1,582,305
2005(3)
Interest income . . . . . . . . . . . . . . . . . . . $5,409,381 $ 673 $ 294,343 $5,704,397 $(3,529,586) $2,174,811Interest expense . . . . . . . . . . . . . . . . . . 1,671,331 95 129,671 1,801,097 (1,024,618) 776,479
Net interest income . . . . . . . . . . . . . . . . 3,738,050 578 164,672 3,903,300 (2,504,968) 1,398,332Provision for loan losses . . . . . . . . . . . . 2,263,617 — 126,462 2,390,079 (1,511,593) 878,486Other income . . . . . . . . . . . . . . . . . . . . 1,753,828 92,143 97,691 1,943,662 993,375 2,937,037Other expense . . . . . . . . . . . . . . . . . . . . 2,272,126 92,866 167,635 2,532,627 — 2,532,627
Income (loss) before income taxexpense . . . . . . . . . . . . . . . . . . . . . . . $ 956,135 $ (145) $ (31,734) $ 924,256 $ — $ 924,256
(1) The Securitization Adjustment column presents the effect of loan securitization by recharacterizing as securitization income the portionsof the following items that relate to the securitized loans: interest income, interest expense, provision for loan losses, discount andinterchange revenue and loan fee revenues. Securitization income is reported in other income.
(2) 2007 includes a $391 million pretax ($279 million after tax) non-cash impairment charge related to our International Card segment.(3) PULSE was acquired in January 2005.
The segment discussions that follow for the years ended November 30, 2007, 2006 and 2005 are on amanaged basis.
U.S. Card
The U.S. Card segment reported pretax income of $1.5 billion for the year ended November 30, 2007, down8% as compared to November 30, 2006. The decrease in pretax income was driven by an increase in provisionfor loan losses partially offset by higher net interest income. Provision for loan losses increased $189.9 million,or 11%, reflecting an increase in bankruptcy charge-offs compared to the unusually low levels in 2006 and ahigher level of loans retained on our balance sheet. Net interest income increased $59.1 million, or 2%, due tohigher interest income, reflecting higher average receivables, partially offset by an increase in interest expense,reflecting increased funding costs and borrowings.
9
For the year ended November 30, 2007, managed loans grew 5%, to $48.2 billion, driven by record salesvolume of $90.3 billion, up 4% over last year. U.S. credit quality remained strong, although delinquency ratesincreased from last year reflecting weakening in the U.S. economy. The managed net charge-off rate of 3.84%was down 12 basis points from last year and the over 30 day delinquency rate of 3.59% was 20 basis pointshigher than last year. In 2008 we estimate the full year managed net charge-off rate will be between 4.75% and5.00%.
A small portion of our newly-originated loans are issued to borrowers with FICO scores below 660 at thetime of account origination but who have met our other specific underwriting criteria indicating to us that theyhave the ability and willingness to pay. We have restricted this initiative to potential customers with FICO scoresabove 600, and the majority of these new accounts had FICO scores at origination in the 640 to 660 range. AtNovember 30, 2007, less than 3.5% of receivables related to new accounts originated within the year were atFICO scores below 660 at time of origination.
While we seek to carefully control the level of new account originations at FICO scores below 660, overtime some accounts that were originated at higher FICO scores will migrate to levels below 660 due tocircumstances that affect their credit performance. Consistent with industry standards for reporting securitizationU.S. master trust data, we disclosed that as of October 31, 2007, approximately 26% of receivable balances in thedomestic trust related to accounts with FICO scores below 660 at that date. While this percentage relates solelyto credit card receivables held in the trust, we believe they are representative of our managed loan portfolio.
The U.S. Card segment produced strong results for the year ended November 30, 2006, with pretax incomeof $1.6 billion, up 72%, as compared to November 30, 2005. These results reflected the strong credit quality ofthe domestic managed credit card portfolio and the continued favorable impact of the new U.S. bankruptcylegislation on charge-offs, the revaluation of the interest-only strip receivable and the allowance for loan losses.The increase in pretax income was due to higher other income and a lower provision for loan losses partiallyoffset by lower net interest income and higher other expenses. Other income increased $343.8 million, or 20%,due primarily to an increase in the fair value of our interest-only strip receivable as a result of lower bankruptcyreceipts and our estimate of its related favorable impact on future charge-offs as well as a higher level of newsecuritization transactions. Provision for loan losses decreased $600.1 million, or 27%, reflecting strong creditquality and lower bankruptcy charge-offs. Net interest income decreased $149.9 million, or 4%, as higher interestexpense was partially offset by higher interest income. The increase in interest expense was primarily due to anincrease in the cost of funds driven by the rising interest rate environment. The increase in interest incomereflects lower interest charge-offs due to improved credit quality and the effect of a rising interest rateenvironment on floating rate credit card loan receivables partially offset by higher promotional rate balances.Other expense increased $109.8 million, or 5%, driven by higher compensation and benefits expense andincreased legal fees, primarily related to the litigation against Visa and MasterCard, and consulting costs,partially offset by lower cardmember fraud expense.
For the year ended November 30, 2006, managed credit card loans grew 3%, to $45.7 billion, driven byhigher transaction volume partially offset by higher cardmember payment rates. Sales volume increased 6%,primarily reflecting increased cardmember usage and higher prices of gasoline (which represents approximately8% of sales volume). Managed interest spread compressed 50 basis points as increased cost of funds outpacedhigher interest yield. The managed net charge-off rate of 3.96% decreased 134 basis points, reflecting strongcredit quality and lower bankruptcy charge-offs. Over 30 and over 90 day delinquency rates decreased 59 basispoints and 16 basis points to 3.39% and 1.59%, respectively, due to a shift to loans with lower risk profiles andimproved collection experience.
Third-Party Payments
The Third-Party Payments segment reported pretax income of $37.0 million for the year endedNovember 30, 2007, up 28% as compared to November 30, 2006. The increase in pretax income was driven byhigher revenue from increased volumes that was partially offset by higher marketing and pricing incentives and
10

from higher third-party card issuer fees. Third-Party Payments debit and credit volume was $91.7 billion for theyear ended November 30, 2007, up 25% from 2006.
The Third-Party Payments segment reported pretax income of $28.9 million for the year endedNovember 30, 2006 versus a pretax loss of $0.1 million for the year ended November 30, 2005 driven byincreased other income and lower other expense. Other income increased $18.5 million, or 20%, due to highervolume from third-party card issuers signed in mid-2005 and higher transaction processing revenue related toincreased volume on the PULSE Network. Other expense decreased $9.3 million, or 10%, as a result of one-timecosts incurred in 2005 in connection with third-party issuer signings partially offset by higher transactionprocessing expense related to increased volumes on the PULSE Network.
Transactions processed on the PULSE Network increased 300 million, or 19%, to 1.9 billion for the yearended November 30, 2006.
International Card
The International Card segment reported a pretax loss of $596.2 million for the year ended November 30,2007, as compared to a pretax loss of $87.1 million for the year ended November 30, 2006, driven by a non-cashimpairment charge of $391 million as well as higher provision for loan losses and other expenses. Continueddisruption in the U.K. financial markets, higher interest rates and our decision to reduce our loan exposure to theU.K. market have negatively affected the book value of the Goldfish business, resulting in the impairmentcharge. The provision for loan losses increased $79.3 million, or 33%, reflecting a full period of charge-offsrelated to the Goldfish and Liverpool Victoria portfolios, weakening in the consumer credit environment in theUnited Kingdom, maturing securitizations resulting in an increase in receivables being retained in the portfolio,and an increase in the provision for loan losses related to the implementation of higher minimum paymentrequirements on certain accounts. Other expenses, excluding the impairment charge, increased $36.9 million, or15%, primarily due to spin-off related costs and various business initiatives.
The International Card managed credit card receivables decreased 6% from last year to $4.4 billion,reflecting increased payments and lower loan growth as we shifted our focus to reducing unprofitable accounts.This was partially offset by favorable foreign exchange rates. The managed net charge-off rate of 6.54%increased 109 basis points from last year. The managed over 30 days delinquency rate increased 67 basis pointsfrom last year to 5.25%.
The International Card segment reported a pretax loss of $87.1 million for the year ended November 30,2006, an increase of $55.4 million over the pretax loss incurred for the year ended November 30, 2005, primarilyas a result of the acquisition of the Goldfish business and the deteriorating consumer credit environment in theUnited Kingdom. The increase in pretax loss was driven by increases in the provision for loan losses and otherexpense partially offset by higher net interest income and other income. The provision for loan losses increased$111.7 million, or 88%, as a result of the weakened credit environment in the United Kingdom, the Goldfishacquisition and increased bankruptcy charge-offs. Other expense increased $86.4 million, or 52%, primarily dueto incremental costs as a result of the acquisition of the Goldfish business. Net interest income increased$75.3 million, or 46%, and other income increased $67.5 million, or 69%, primarily related to a higher level ofmanaged loan receivables as a result of the acquisition of the Goldfish business. The increase in other incomewas partially offset by lower levels of late and overlimit fee revenues resulting from regulatory changes whichlimited the per-incident amount of fees that can be charged.
For the year ended November 30, 2006, managed credit card loans grew $2.0 billion, or 74%, to $4.6 billionprimarily due to the addition of the Goldfish business. Managed interest spread was flat compared to the prioryear as lower yield was offset by lower cost of funds. Credit quality continued to deteriorate as the managed netcharge-off rate rose 135 basis points to 5.45%, and the over 30 and over 90 day delinquency rates increased to4.58% and 2.22%, respectively.
11

GAAP to Managed Data Reconciliations
Securitized loans against which beneficial interests have been issued to third parties are removed from ourstatements of financial condition. Instances in which we retain certificated beneficial interests in thesecuritization transactions result in a reduction to loan receivables of the amount of the retained interest and acorresponding increase in investment securities – available-for-sale. The portions of interest income, provisionfor loan losses and certain components of other income related to the securitized loans against which beneficialinterests have been issued are no longer recorded in our statements of income; however, they remain significantfactors in determining the securitization income we receive on our retained beneficial interests in thosetransactions. Management believes it is useful for investors to consider the credit performance of the entiremanaged loan portfolio to understand the quality of loan originations and the related credit risks inherent in theowned portfolio and retained interests in securitization. Loan receivables on a GAAP (or owned) basis andrelated performance measures, including yield, charge-offs and delinquencies can vary from those presented on amanaged basis. Generally, loan receivables included in the securitization trusts are derived from accounts that aremore seasoned, while owned loan receivables represent a greater concentration of newer accounts, occurring as aresult of the degree to which receivables from newer accounts are added to the trusts. The seasoning of anaccount is measured by the age of the account relationship. In comparison to more seasoned accounts, loanreceivables of newer accounts typically carry lower interest yields resulting from introductory offers to newcardmembers and lower charge-offs and delinquencies.
Beginning with “—Earnings Summary,” the discussion of GAAP results is presented on a consolidated andcombined basis with any material differences between segment performance specifically identified. The tablethat follows provides a GAAP to managed data reconciliation of loan receivables and related statistics that areimpacted by asset securitization:
Reconciliation of GAAP to Managed Data
For the Years Ended November 30,
2007 2006 2005
(dollars in thousands)
Balance Sheet StatisticsLoan ReceivablesGAAP Basis . . . . . . . . . . . . . . . . . . . . . . . . . . . . . . . . . . . . . . . . . . . . $23,954,295 $23,742,750 $22,803,166Securitization Adjustment . . . . . . . . . . . . . . . . . . . . . . . . . . . . . . . . . . 28,599,309 26,703,427 24,440,063
Managed Basis . . . . . . . . . . . . . . . . . . . . . . . . . . . . . . . . . . . . . . . . . . $52,553,604 $50,446,177 $47,243,229
Total AssetsGAAP Basis . . . . . . . . . . . . . . . . . . . . . . . . . . . . . . . . . . . . . . . . . . . . $37,376,105 $29,067,242 $26,943,923Securitization Adjustment . . . . . . . . . . . . . . . . . . . . . . . . . . . . . . . . . . 28,375,826 26,444,943 24,370,113
Managed Basis . . . . . . . . . . . . . . . . . . . . . . . . . . . . . . . . . . . . . . . . . . $65,751,931 $55,512,185 $51,314,036
Total Credit Card LoansCredit Card LoansGAAP Basis . . . . . . . . . . . . . . . . . . . . . . . . . . . . . . . . . . . . . . . . . . . . $23,703,101 $23,646,901 $22,496,211Securitization Adjustment . . . . . . . . . . . . . . . . . . . . . . . . . . . . . . . . . . 28,599,309 26,703,427 24,440,063
Managed Basis . . . . . . . . . . . . . . . . . . . . . . . . . . . . . . . . . . . . . . . . . . $52,302,410 $50,350,328 $46,936,274
Average Credit Card LoansGAAP Basis . . . . . . . . . . . . . . . . . . . . . . . . . . . . . . . . . . . . . . . . . . . . $22,814,043 $21,656,295 $19,931,636Securitization Adjustment . . . . . . . . . . . . . . . . . . . . . . . . . . . . . . . . . . 28,524,092 26,560,251 27,398,507
Managed Basis . . . . . . . . . . . . . . . . . . . . . . . . . . . . . . . . . . . . . . . . . . $51,338,135 $48,216,546 $47,330,143
12

For the Years Ended November 30,
2007 2006 2005
(dollars in thousands)
Interest YieldGAAP Basis . . . . . . . . . . . . . . . . . . . . . . . . . . . . . . . . . . . . . . . . . . . . 10.58% 10.38% 10.12%Securitization Adjustment . . . . . . . . . . . . . . . . . . . . . . . . . . . . . . . . . . 13.93% 13.96% 12.88%Managed Basis . . . . . . . . . . . . . . . . . . . . . . . . . . . . . . . . . . . . . . . . . . 12.44% 12.36% 11.72%
Net Principal Charge-off RateGAAP Basis . . . . . . . . . . . . . . . . . . . . . . . . . . . . . . . . . . . . . . . . . . . . 3.82% 3.79% 4.84%Securitization Adjustment . . . . . . . . . . . . . . . . . . . . . . . . . . . . . . . . . . 4.28% 4.31% 5.52%Managed Basis . . . . . . . . . . . . . . . . . . . . . . . . . . . . . . . . . . . . . . . . . . 4.08% 4.08% 5.23%
Delinquency Rate (over 30 days)GAAP Basis . . . . . . . . . . . . . . . . . . . . . . . . . . . . . . . . . . . . . . . . . . . . 3.50% 3.22% 3.69%Securitization Adjustment . . . . . . . . . . . . . . . . . . . . . . . . . . . . . . . . . . 3.92% 3.76% 4.24%Managed Basis . . . . . . . . . . . . . . . . . . . . . . . . . . . . . . . . . . . . . . . . . . 3.73% 3.50% 3.98%
Delinquency Rate (over 90 days)GAAP Basis . . . . . . . . . . . . . . . . . . . . . . . . . . . . . . . . . . . . . . . . . . . . 1.63% 1.53% 1.62%Securitization Adjustment . . . . . . . . . . . . . . . . . . . . . . . . . . . . . . . . . . 1.84% 1.75% 1.87%Managed Basis . . . . . . . . . . . . . . . . . . . . . . . . . . . . . . . . . . . . . . . . . . 1.74% 1.65% 1.75%
U.S. CARDLoan ReceivablesGAAP Basis . . . . . . . . . . . . . . . . . . . . . . . . . . . . . . . . . . . . . . . . . . . . $20,831,117 $20,790,244 $20,611,306Securitization Adjustment . . . . . . . . . . . . . . . . . . . . . . . . . . . . . . . . . . 27,349,319 25,011,827 23,826,144
Managed Basis . . . . . . . . . . . . . . . . . . . . . . . . . . . . . . . . . . . . . . . . . . $48,180,436 $45,802,071 $44,437,450
Domestic Credit Card LoansCredit Card LoansGAAP Basis . . . . . . . . . . . . . . . . . . . . . . . . . . . . . . . . . . . . . . . . . . . . $20,579,923 $20,694,395 $20,434,977Securitization Adjustment . . . . . . . . . . . . . . . . . . . . . . . . . . . . . . . . . . 27,349,319 25,011,827 23,826,144
Managed Basis . . . . . . . . . . . . . . . . . . . . . . . . . . . . . . . . . . . . . . . . . . $47,929,242 $45,706,222 $44,261,121
Average Credit Card LoansGAAP Basis . . . . . . . . . . . . . . . . . . . . . . . . . . . . . . . . . . . . . . . . . . . . $19,845,880 $19,120,946 $18,644,660Securitization Adjustment . . . . . . . . . . . . . . . . . . . . . . . . . . . . . . . . . . 26,965,690 25,156,303 26,092,042
Managed Basis . . . . . . . . . . . . . . . . . . . . . . . . . . . . . . . . . . . . . . . . . . $46,811,570 $44,277,249 $44,736,702
Interest YieldGAAP Basis . . . . . . . . . . . . . . . . . . . . . . . . . . . . . . . . . . . . . . . . . . . . 10.75% 10.50% 10.16%Securitization Adjustment . . . . . . . . . . . . . . . . . . . . . . . . . . . . . . . . . . 14.07% 14.08% 12.93%Managed Basis . . . . . . . . . . . . . . . . . . . . . . . . . . . . . . . . . . . . . . . . . . 12.66% 12.53% 11.78%
Net Principal Charge-off RateGAAP Basis . . . . . . . . . . . . . . . . . . . . . . . . . . . . . . . . . . . . . . . . . . . . 3.41% 3.64% 4.95%Securitization Adjustment . . . . . . . . . . . . . . . . . . . . . . . . . . . . . . . . . . 4.15% 4.20% 5.55%Managed Basis . . . . . . . . . . . . . . . . . . . . . . . . . . . . . . . . . . . . . . . . . . 3.84% 3.96% 5.30%
Delinquency Rate (over 30 days)GAAP Basis . . . . . . . . . . . . . . . . . . . . . . . . . . . . . . . . . . . . . . . . . . . . 3.28% 3.05% 3.69%Securitization Adjustment . . . . . . . . . . . . . . . . . . . . . . . . . . . . . . . . . . 3.82% 3.67% 4.23%Managed Basis . . . . . . . . . . . . . . . . . . . . . . . . . . . . . . . . . . . . . . . . . . 3.59% 3.39% 3.98%
13

For the Years Ended November 30,
2007 2006 2005
(dollars in thousands)
Delinquency Rate (over 90 days)GAAP Basis . . . . . . . . . . . . . . . . . . . . . . . . . . . . . . . . . . . . . . . . . . . . . . . 1.53% 1.44% 1.61%Securitization Adjustment . . . . . . . . . . . . . . . . . . . . . . . . . . . . . . . . . . . . . 1.79% 1.72% 1.86%Managed Basis . . . . . . . . . . . . . . . . . . . . . . . . . . . . . . . . . . . . . . . . . . . . . 1.68% 1.59% 1.75%
INTERNATIONAL CARD
Credit Card LoansGAAP Basis . . . . . . . . . . . . . . . . . . . . . . . . . . . . . . . . . . . . . . . . . . . . . . . $3,123,178 $2,952,506 $2,061,234Securitization Adjustment . . . . . . . . . . . . . . . . . . . . . . . . . . . . . . . . . . . . . 1,249,990 1,691,600 613,919
Managed Basis . . . . . . . . . . . . . . . . . . . . . . . . . . . . . . . . . . . . . . . . . . . . . $4,373,168 $4,644,106 $2,675,153
Average Credit Card LoansGAAP Basis . . . . . . . . . . . . . . . . . . . . . . . . . . . . . . . . . . . . . . . . . . . . . . . $2,968,163 $2,535,349 $1,286,976Securitization Adjustment . . . . . . . . . . . . . . . . . . . . . . . . . . . . . . . . . . . . . 1,558,402 1,403,948 1,306,465
Managed Basis . . . . . . . . . . . . . . . . . . . . . . . . . . . . . . . . . . . . . . . . . . . . . $4,526,565 $3,939,297 $2,593,441
Interest YieldGAAP Basis . . . . . . . . . . . . . . . . . . . . . . . . . . . . . . . . . . . . . . . . . . . . . . . 9.42% 9.51% 9.63%Securitization Adjustment . . . . . . . . . . . . . . . . . . . . . . . . . . . . . . . . . . . . . 11.43% 11.94% 11.80%Managed Basis . . . . . . . . . . . . . . . . . . . . . . . . . . . . . . . . . . . . . . . . . . . . . 10.11% 10.38% 10.72%
Net Principal Charge-off RateGAAP Basis . . . . . . . . . . . . . . . . . . . . . . . . . . . . . . . . . . . . . . . . . . . . . . . 6.56% 4.94% 3.28%Securitization Adjustment . . . . . . . . . . . . . . . . . . . . . . . . . . . . . . . . . . . . . 6.49% 6.36% 4.91%Managed Basis . . . . . . . . . . . . . . . . . . . . . . . . . . . . . . . . . . . . . . . . . . . . . 6.54% 5.45% 4.10%
Delinquency Rate (over 30 days)GAAP Basis . . . . . . . . . . . . . . . . . . . . . . . . . . . . . . . . . . . . . . . . . . . . . . . 4.91% 4.36% 3.78%Securitization Adjustment . . . . . . . . . . . . . . . . . . . . . . . . . . . . . . . . . . . . . 6.09% 4.96% 4.53%Managed Basis . . . . . . . . . . . . . . . . . . . . . . . . . . . . . . . . . . . . . . . . . . . . . 5.25% 4.58% 3.95%
Delinquency Rate (over 90 days)GAAP Basis . . . . . . . . . . . . . . . . . . . . . . . . . . . . . . . . . . . . . . . . . . . . . . . 2.27% 2.16% 1.73%Securitization Adjustment . . . . . . . . . . . . . . . . . . . . . . . . . . . . . . . . . . . . . 2.83% 2.32% 2.09%Managed Basis . . . . . . . . . . . . . . . . . . . . . . . . . . . . . . . . . . . . . . . . . . . . . 2.43% 2.22% 1.81%
Critical Accounting Policies
In preparing our consolidated and combined financial statements in conformity with GAAP, managementmust make judgments and use estimates and assumptions about the effects of matters that are uncertain. Forestimates that involve a high degree of judgment and subjectivity, it is possible that different estimates couldreasonably be derived for the same period. For estimates that are particularly sensitive to changes in economic ormarket conditions, significant changes to the estimated amount from period to period are also possible.Management believes the current assumptions and other considerations used to estimate amounts reflected in ourconsolidated and combined financial statements are appropriate. However, if actual experience differs from theassumptions and other considerations used in estimating amounts in our consolidated and combined financialstatements, the resulting changes could have a material adverse effect on our consolidated and combined resultsof operations and, in certain cases, could have a material adverse effect on our consolidated and combinedfinancial condition. Management has identified the policies related to the estimation of the allowance for loanlosses, the accounting for asset securitization transactions, interest income recognition, the accrual ofcardmember rewards cost, the evaluation of goodwill for potential impairment and accrual of income taxes ascritical accounting policies.
14

Allowance for Loan Losses
The allowance for loan losses represents management’s estimate of probable net loan losses inherent in theloan portfolio. Management evaluates the allowance quarterly for adequacy. The allowance is establishedthrough a charge to the provision for loan losses. In estimating losses inherent in the credit card loan portfolio,we use an approach that utilizes a migration analysis of delinquent and current credit card receivables. Amigration analysis is a technique used to estimate the likelihood that a loan receivable will progress through thevarious stages of delinquency and to charge-off. The migration analysis considers uncollectible principal, interestand fees reflected in loan receivables. In determining the proper level of the allowance for loan losses,management also considers factors that may impact loan loss experience, including current economic conditions,recent trends in delinquencies and bankruptcy receipts, account collection management, policy changes, accountseasoning, loan volume and amounts, payment rates and forecasting uncertainties.
If management used different assumptions in estimating probable losses, the impact to the allowance forloan losses could have a material effect on our consolidated and combined financial condition and results ofoperations. For example, a 10% change in management’s estimate of probable net loan losses could have resultedin a change of approximately $92 million in the allowance for loan losses at November 30, 2007, with acorresponding change in the provision for loan losses. See Note 5: Loan Receivables to the audited consolidatedand combined financial statements for further details about the allowance for loan losses.
Accounting for Asset Securitization Transactions
We account for our securitization transactions in accordance with Statement No. 140. The gain on thesecuritization transaction depends in part on the previous carrying amount of the assets involved in the transfer,allocated between the assets transferred and the retained interests based upon their respective fair values at thedate of the transfer. The interest-only strip receivable represents the contractual right to receive interest andcertain loan fee revenues less certain costs, including loan losses on securitized loans and the contractual rate ofinterest paid to third-party investors in the securitization as well as a servicing fee from the trust over the life ofthe asset sold. In the absence of observable market prices, the fair value of the interest-only strip receivable isestimated based on the present value of expected future cash flows using management’s best estimate of the keyassumptions, including forecasted interest yield, loan losses and payment rates, the interest paid to investors anda discount rate commensurate with the risks involved. Changes in the estimated fair value of the interest-onlystrip receivable, as well as certain other retained interests, are recorded in securitization income. The use ofdifferent estimates or assumptions could produce materially different financial results. In addition, estimates arelikely to change in the future as components of the interest-only strip receivable valuation are sensitive to marketand economic conditions.
If management used different assumptions in estimating the value of the interest-only strip receivable, theimpact could have a material effect on our consolidated and combined financial condition and results ofoperations. For example, a 20% change in the excess spread assumption for all securitized loans could haveresulted in a change of approximately $80 million in the value of the interest-only strip receivable as ofNovember 30, 2007. See Note 6: Credit Card Securitization Activities to the audited consolidated and combinedfinancial statements for further information about the accounting for securitizations.
Interest Income Recognition
Interest income earned through finance charges on credit card loans is calculated based on the amount ofloans outstanding and the contractual interest rates on such loans. Accrued interest is included in credit card loanreceivables when billed to the cardmember. We accrue unbilled interest revenue on a monthly basis from acardmember’s billing cycle date to the end of the month. The unbilled interest accrual is recorded on theconsolidated and combined statements of financial condition in accrued interest receivable for owned loans andin amounts due from asset securitization for securitized loans. We make certain assumptions and estimates in the
15

determination of unbilled accrued interest, including a projection of the percentage of loan balances that willrevolve. We apply the same methodology in the determination of unbilled accrued interest for both owned loansand securitized loans.
If management used different assumptions in the determination of the unbilled portion of accrued interestincome and the valuation of accrued interest on securitized loans, our financial condition and results ofoperations could have been materially different. For example, a 10% change in management’s projection of thepercentage of loans that will revolve in the next cycle could have resulted in a combined change in accruedinterest receivable and amounts due from asset securitization of approximately $31 million at November 30,2007, with a corresponding change in interest income. See “—Net Interest Income” for additional detailsconcerning interest earned through finance charges on credit card loans.
Cardmember Rewards Cost
We offer our cardmembers various reward programs, including the Cashback Bonus reward program,pursuant to which we offer certain cardmembers a reward equal to a percentage of their purchase amounts basedon the type and volume of the cardmember’s purchases. The liability for cardmember rewards is included inaccrued expenses and other liabilities on our consolidated and combined statements of financial condition. Wecompute rewards liability on an individual cardmember basis and it is accumulated as qualified cardmembersmake progress toward earning a reward through their ongoing purchase activity. The liability is adjusted forexpected forfeitures of accumulated rewards. We estimate forfeitures based on historical account closure andcharge-off experience and actual cardmember purchase activity. We recognize Cashback Bonus reward cost forboth owned loans and securitized loans as a reduction of discount and interchange revenue in the consolidatedand combined statements of income.
If management used a different estimate of forfeitures, our consolidated and combined financial conditionand results of operations could have differed significantly. For example, a 100 basis point decrease in theestimated forfeiture rate as of November 30, 2007, could have resulted in an increase in accrued expenses andother liabilities of approximately $9 million. The corresponding increase in rewards cost would have beenreflected as a decrease in discount and interchange revenue. See “—Other Income” and Note 2: Summary ofSignificant Accounting Policies to the audited consolidated and combined financial statements for further detailsabout cardmember rewards cost.
Goodwill
We recognize goodwill when the purchase price of an acquired business exceeds the fair values of theacquired net assets. As required by GAAP, we test goodwill for impairment annually, or more often if indicatorsof impairment exist. In evaluating goodwill for impairment, management must estimate the fair value of thebusiness unit(s) to which the goodwill relates. Because market data concerning acquisitions of comparablebusinesses typically are not readily obtainable, other valuation techniques such as earnings multiples and cashflow models are used in estimating the fair values of these businesses. In applying these techniques, managementconsiders historical results, business forecasts, market and industry conditions and other factors. We may alsoconsult independent valuation experts where needed in applying these valuation techniques. The valuationmethodologies we use involve assumptions about business performance, revenue and expense growth, discountrates and other assumptions that are judgmental in nature.
If the assumptions used by management in valuing its acquired businesses are inappropriate, we may beexposed to an impairment loss that, when realized, could have a material impact on our consolidated andcombined financial condition and results of operations.
Following a strategic review of the International Card segment that began in the third quarter of 2007 andwas completed in the fourth quarter, management determined that an interim test for impairment was needed on
16

the goodwill associated with that segment. The impairment test resulted in the recognition of an impairmentcharge impacting goodwill and other intangible assets. See Note 9: Goodwill to the audited consolidated andcombined financial statements for further details concerning the fourth quarter goodwill impairment charge.
Income Taxes
We are subject to the income tax laws of the jurisdictions where we have business operations, primarily theUnited States, its states and municipalities, and the United Kingdom. We must make judgments andinterpretations about the application of these inherently complex tax laws when determining the provision forincome taxes and must also make estimates about when in the future certain items will affect taxable income inthe various taxing jurisdictions. Disputes over interpretations of the tax laws may be settled with the taxingauthority upon examination or audit. We regularly evaluate the likelihood of assessments in each of the taxingjurisdictions resulting from current and subsequent years’ examinations, and tax reserves are established asappropriate.
Changes in the estimate of income taxes can occur due to tax rate changes, interpretations of tax laws, thestatus and resolution of examinations by the taxing authorities, and newly enacted laws and regulations thatimpact the relative merits of tax positions taken. When such changes occur, the effect on our consolidated andcombined financial condition and results of operations can be significant. See Note 17: Income Taxes to theaudited consolidated and combined financial statements for additional information about income taxes.
Earnings Summary
The following table outlines changes in our consolidated and combined statement of income for the periodspresented (dollars in thousands):
For the Years EndedNovember 30,
2007 vs. 2006increase (decrease)
2006 vs. 2005increase (decrease)
2007 2006 2005 $ % $ %
Interest income . . . . . . . . . . . . . . . . . . . . . . . $2,888,169 $2,458,526 $2,174,811 $ 429,643 17% $283,715 13%Interest expense . . . . . . . . . . . . . . . . . . . . . . 1,382,415 940,040 776,479 442,375 47% 163,561 21%
Net interest income . . . . . . . . . . . . . . . . . . . 1,505,754 1,518,486 1,398,332 (12,732) (1%) 120,154 9%Provision for loan losses . . . . . . . . . . . . . . . 950,165 755,637 878,486 194,528 26% (122,849) (14%)
Net interest income after provision for loanlosses . . . . . . . . . . . . . . . . . . . . . . . . . . . . 555,589 762,849 519,846 (207,260) (27%) 243,003 47%
Other income . . . . . . . . . . . . . . . . . . . . . . . . 3,546,119 3,538,939 2,937,037 7,180 0% 601,902 20%Other expense . . . . . . . . . . . . . . . . . . . . . . . 3,156,512 2,719,483 2,532,627 437,029 16% 186,856 7%
Pretax income . . . . . . . . . . . . . . . . . . . . . . . 945,196 1,582,305 924,256 (637,109) (40%) 658,049 71%Income tax expense . . . . . . . . . . . . . . . . . . . 356,566 505,689 346,341 (149,123) (29%) 159,348 46%
Net income . . . . . . . . . . . . . . . . . . . . . . . . . . $ 588,630 $1,076,616 $ 577,915 $(487,986) (45%) $498,701 86%
Net income for the year ended November 30, 2007 was $588.6 million, down 45% compared to the yearended November 30, 2006, driven by a non-cash impairment charge of $391 million, as well as higher provisionfor loan losses and other expense. The U.S. provision for loan losses increased, reflecting a trend toward higherlevels of delinquencies as well as a higher level of loans retained on the company’s balance sheet. Theinternational provision for loan losses increased due to a full period of charge-offs related to the Goldfish andLiverpool Victoria portfolios, weakening in the consumer credit environment in the United Kingdom, certainmaturing securitized receivables being retained in the portfolio, and an increase in reserves related to theimplementation of higher minimum payment requirements on certain accounts. Other expense excluding theimpairment charge, increased due to spin-off related costs and various business initiatives. The year endedNovember 30, 2007 also included a higher effective tax rate.
Net income for 2006 and 2005 was influenced by consumer behavior in anticipation of the October 2005effective date of the new U.S. bankruptcy legislation. We believe 2005 results were adversely affected as
17

consumers filed for bankruptcy before the new U.S. bankruptcy legislation. This legislation resulted in anacceleration of charge-offs in 2005 and first quarter 2006, a negative revaluation of the interest-only stripreceivable in 2005 and additional provisions to the allowance for loan losses in 2005. In contrast, full year 2006results were positively affected by a sharp decline in consumer bankruptcy receipts, resulting in lowercharge-offs. Full year 2006 also benefited from a favorable revaluation of the interest-only strip receivable and adecrease in the level of allowance for loan losses.
Net income for the year ended November 30, 2006 was a record $1.1 billion, up 86% compared to the yearended November 30, 2005, driven by higher other income and net interest income and lower provision for loanlosses, as well as a lower effective tax rate, partially offset by higher other expenses. Other income increased dueto higher securitization income resulting from lower credit losses on securitized loans attributable to strong creditquality and the continued lower level of charge-offs following the October 2005 effective date of the new U.S.bankruptcy legislation, resulting in a higher excess spread and a favorable revaluation of the interest-only stripreceivable. Increases in other expenses were driven by costs related to the Goldfish acquisition, highercompensation and benefit costs and increased legal and consulting costs. Also, the year ended November 30,2006 included a lower effective tax rate due to tax benefits related to the favorable resolution of various taxmatters.
Net Interest Income
Net interest income represents the difference between interest income earned on interest-earning assetswhich we own and the interest expense incurred to finance those assets. Net interest margin states the interestincome, net of interest expense, as a percentage of total interest-earning assets. Our interest-earning assets consistof loan receivables, certain retained interests in securitization transactions included in amounts due from assetsecuritization, certain cash and cash equivalents, including Federal Funds sold, and investment securities.Because the third-party investor interests in securitization transactions are not assets owned by us, they are notincluded in interest-earning assets nor is the interest yield on the related loans included in interest income. SeeNote 4: Investment Securities for further disclosure regarding investment securities.
Net interest income for the year ended November 30, 2007 decreased $12.7 million, or 1%, and net interestmargin decreased 118 basis points to 4.76% as compared to the year ended November 30, 2006. The modestdecrease in net interest income was due to higher average interest-bearing liabilities and a higher cost of funds oninterest-bearing liabilities largely offset by higher average interest-earning assets. In 2007, the establishment ofthe liquidity reserve, which earns a lower interest rate, adversely impacted the net interest margin for the yearended November 30, 2007. Net interest income for the year ended November 30, 2006 increased $120.2 million,or 9%, and net interest margin increased 6 basis points to 5.94% as compared to the year ended November 30,2005. The increase in net interest income is due to higher average interest-earning assets and a higher interestyield offset by an increase in the cost of funds. The favorable impact of the higher interest yield on net interestmargin was offset in part by the higher average interest-earning assets and the higher cost of funds.
Interest income is influenced by the level of interest-earning assets, the most significant of which is our loanreceivables. The level of loan receivables can be influenced by portfolio growth strategies, including portfolioacquisition, cardmember spending and payment behavior and changes in the level of securitized loans. Typically,new securitization transactions have the effect of decreasing loan receivables, whereas maturities of existingsecuritization transactions increase loan receivables. For the years ended November 30, 2007 and 2006, therewere higher levels of average securitized loans than their respective prior year comparisons. However, thesehigher levels were more than offset by overall growth in average loans, resulting in higher average loanreceivables, contributing favorably to interest income in 2007 and 2006.
Other interest-earning assets that can influence interest income are certain amounts due from assetsecuritization included in other interest-earning assets on the average balance sheet, certain cash and cashequivalents, including Federal Funds sold, and investment securities. Amounts due from asset securitization
18
relate to certain assets retained by us in securitization transactions. The levels of these assets are impacted bysecuritization maturities and can vary in relation to the level of securitized loans. Federal Funds sold representamounts maintained for liquidity purposes. For the year ended November 30, 2007, the interest income wasfavorably impacted by a higher level of Federal Funds sold, which was significantly greater in comparison to thatof prior years as a result of the establishment of our liquidity reserve in the first half of 2007. See “—Liquidityand Capital Resources” for further discussion of our liquidity reserve.
Interest income is also influenced by the interest rate on interest-earning assets. Credit card loan receivablesearn interest at fixed rates as well as floating rates that are aligned with the prime rate. Amounts due from assetsecuritization and Federal Funds sold earn interest at floating rates tied to short-term rates aligned with marketindices. Accordingly, interest income earned on floating rate interest-earning assets is influenced by changes inthe interest rate environment. Loan receivables are our largest asset. During the years ended November 30, 2007,2006 and 2005, average credit card loan receivables earning interest at floating rates represented 45%, 52% and50%, respectively, of total average loan receivables. The prime rate decreased 0.75% during the fourth quarter of2007. The impact of this decline on interest income in 2007 was lessened due to the timing of the decrease in theprime rate and a shift to a higher percentage of fixed rate average loan receivables. Conversely, during 2006 and2005, the prime rate increased 1.25% and 2.00%, respectively, which contributed favorably to interest incomeearned on the owned loan receivables, amounts due from asset securitizations and Federal Funds sold.Additionally, interest income in 2006 was further impacted by a higher percentage of loan receivables earninginterest at floating rates.
Credit performance is another factor which influences interest income. As a result of the improved creditenvironment following the October 2005 effective date of the new U.S. bankruptcy legislation and our riskmanagement practices, the number of cardmembers having lower risk profiles has increased. Generally,cardmembers with a lower risk profile have higher payment rates, resulting in a lower percentage of loanreceivables on which interest is accrued. Although interest income is lower as a result, interest-related charge-offs, which are recorded as a reduction to interest income, are also lower. This was particularly evident followingthe October 2005 effective date of the new U.S. bankruptcy legislation. The differences in year-over-yearcomparisons have narrowed as charge-offs have increased from the levels seen at the initial time periodfollowing the legislation’s effective date. The interest billed and subsequently charged-off, net of recoveries, was0.90% for both years ended November 30, 2007 and 2006 and 1.14% for the year ended November 30, 2005.
Interest-bearing liabilities reflect our funding requirements and consist of deposits and short- and long-termborrowings. Prior to the Distribution, interest-bearing liabilities also included borrowings from Morgan Stanley. Weincur interest expense on our interest-bearing liabilities at fixed and floating rates. Accordingly, changes in theinterest rate environment, changes in the percentage of floating rate interest-bearing liabilities and the replacementof maturing debt can impact interest expense. The floating rate average interest-bearing liabilities as a percentage oftotal average interest-bearing liabilities was approximately 48% during both years ended November 30, 2007 and2006 and 41% during the year ended November 30, 2005. The level of average interest-bearing liabilities during2007 was higher than prior year, reflecting the establishment of a liquidity reserve and growth in loan receivables.Accordingly, the level of floating rate average interest-bearing liabilities, specifically money market accounts, washigher as well. The increased levels of floating rate interest-bearing liabilities coupled with the higher interest rateenvironment in 2007 as compared to 2006, adversely impacted interest expense. In addition, the higher interest rateenvironment in 2007 also had a negative effect on the cost of issuing new fixed rate certificates of deposit to replacematuring certificates of deposit issued at lower, historical rates. Similarly, the increase in the percentage of floatingrate average interest-bearing liabilities during the year ended November 30, 2006, as compared to 2005, adverselyimpacted interest expense due to a rising interest rate environment.
Interest expense also includes the effects of any interest rate swaps we enter into as part of our interest raterisk management program. The program is designed to reduce the volatility of earnings resulting from changes ininterest rates by having a financing portfolio that reflects the existing repricing schedules of loan receivables aswell as our right, with notice to cardmembers, to reprice certain fixed or floating rate loan receivables to a newinterest rate in the future.
19

The following tables provide further analysis of net interest income, net interest margin and the impact ofrate and volume changes for the years ended November 30 (dollars in thousands):
Average Balance Sheet Analysis2007 2006 2005
AverageBalance Rate Interest
AverageBalance Rate Interest
AverageBalance Rate Interest
AssetsInterest-earning assets:
Interest-earning deposits in otherbanks . . . . . . . . . . . . . . . . . . . . . . $ 464,643 5.41% $ 25,114 $ 1,101 3.78% $ 42 $ 861 3.48% $ 30
Federal Funds sold . . . . . . . . . . . . . 4,737,859 5.10% 241,727 339,016 4.74% 16,055 562,278 3.16% 17,771Commercial paper . . . . . . . . . . . . . 15,434 5.26% 812 13,850 5.01% 693 13,955 3.07% 428Investment securities . . . . . . . . . . . 199,075 5.28% 10,502 55,476 5.46% 3,028 14,350 4.74% 680Loans:(1)
DomesticCredit cards . . . . . . . . . . . . . . . 19,845,880 10.75% 2,134,188 19,120,946 10.50% 2,007,737 18,644,660 10.16% 1,893,681Other consumer loans . . . . . . . 101,904 6.32% 6,442 131,982 7.20% 9,501 231,093 7.51% 17,357
Total domestic . . . . . . . . . . . . 19,947,784 10.73% 2,140,630 19,252,928 10.48% 2,017,238 18,875,753 10.12% 1,911,038International
Credit cards . . . . . . . . . . . . . . . 2,968,163 9.42% 279,700 2,535,349 9.51% 241,205 1,286,976 9.63% 123,940Other consumer loans . . . . . . . — — — 53,019 7.62% 4,040 135,494 7.72% 10,459
Total international . . . . . . . . . 2,968,163 9.42% 279,700 2,588,368 9.47% 245,245 1,422,470 9.45% 134,399
Total loans . . . . . . . . . . . . . . . 22,915,947 10.56% 2,420,330 21,841,296 10.36% 2,262,483 20,298,223 10.08% 2,045,437Other interest-earning assets . . . . . . 3,318,661 5.72% 189,684 3,295,406 5.35% 176,225 2,894,064 3.82% 110,465
Total interest-earningassets . . . . . . . . . . . . . . . . . . 31,651,619 9.12% 2,888,169 25,546,145 9.62% 2,458,526 23,783,731 9.14% 2,174,811
Allowance for loan losses . . . . . . . . . . (802,066) (791,088) (864,224)Other assets . . . . . . . . . . . . . . . . . . . . . 3,082,026 2,629,713 2,319,973
Total assets . . . . . . . . . . . . . . . $33,931,579 $27,384,770 $25,239,480
Liabilities and Stockholders’Equity
Interest-bearing liabilities:Interest-bearing deposits:
Time deposits(2) . . . . . . . . . . . . . $16,423,343 5.19% 851,987 $12,585,124 4.67% 587,243 $13,829,102 4.28% 591,338Money market deposits . . . . . . . . 3,662,961 5.22% 191,389 1,683,975 4.88% 82,239 685,201 2.90% 19,885Other interest-bearing
deposits . . . . . . . . . . . . . . . . . . 36,748 3.26% 1,198 25,613 3.29% 844 6,038 1.01% 60
Total interest-bearingdeposits . . . . . . . . . . . . . . . . 20,123,052 5.19% 1,044,574 14,294,712 4.69% 670,326 14,520,341 4.21% 611,283
Borrowings:Short-term borrowings
Domestic . . . . . . . . . . . . . . . . . 1,629,810 5.48% 89,312 2,334,648 5.03% 117,462 2,040,719 3.07% 62,686International . . . . . . . . . . . . . . 2,341,140 6.10% 142,885 1,805,302 4.22% 76,258 998,431 4.49% 44,799
Total short-termborrowings . . . . . . . . . . . . . 3,970,950 5.85% 232,197 4,139,950 4.68% 193,720 3,039,150 3.54% 107,485
Long-term borrowingsDomestic . . . . . . . . . . . . . . . . . 1,459,114 6.13% 89,377 820,045 5.91% 48,492 817,224 5.41% 44,243International . . . . . . . . . . . . . . 343,947 4.73% 16,267 576,276 4.77% 27,502 279,574 4.82% 13,468
Total long-term borrowings . . 1,803,061 5.86% 105,644 1,396,321 5.44% 75,994 1,096,798 5.26% 57,711
Total borrowings . . . . . . . . . . 5,774,011 5.85% 337,841 5,536,271 4.87% 269,714 4,135,948 3.99% 165,196
Total interest-bearingliabilities . . . . . . . . . . . . . . . 25,897,063 5.34% 1,382,415 19,830,983 4.74% 940,040 18,656,289 4.16% 776,479
Other liabilities and stockholders’equity . . . . . . . . . . . . . . . . . . . . . . . 8,034,516 7,553,787 6,583,191
Total liabilities andstockholders’ equity . . . . . . $33,931,579 $27,384,770 $25,239,480
Net interest income . . . . . . . . . $1,505,754 $1,518,486 $1,398,332
Net interest margin(3) . . . . . . . . . . . . . 4.76% 5.94% 5.88%Interest rate spread(4) . . . . . . . . . . . . . . 3.78% 4.88% 4.98%
(1) Average balances of loan receivables include non-accruing loans and these loans are therefore included in the yield calculations. If thesebalances were excluded, there would not be a material impact on the amounts reported above.
(2) Includes the impact of interest rate swap agreements used to change a portion of fixed-rate funding to floating-rate funding.(3) Net interest margin represents net interest income as a percentage of total interest-earning assets.(4) Interest rate spread represents the difference between the rate on total interest-earning assets and the rate on total interest-bearing
liabilities.
20

Rate/Volume Variance Analysis(1)
2007 vs. 2006 2006 vs. 2005
Volume Rate Total Volume Rate Total
(in thousands)Increase/(decrease) in net interest incomedue to changes in:Interest-earning assets:
Interest-earning deposits in other banks . . . . . . . . . . . . . . . . . . . . $ 25,047 $ 25 $ 25,072 $ 10 $ 2 $ 12Federal Funds sold . . . . . . . . . . . . . . . . . . . . . . . . . . . . . . . . . . . . 224,335 1,337 225,672 (8,616) 6,900 (1,716)Commercial paper . . . . . . . . . . . . . . . . . . . . . . . . . . . . . . . . . . . . . 82 37 119 (3) 268 265Investment securities . . . . . . . . . . . . . . . . . . . . . . . . . . . . . . . . . . . 7,578 (104) 7,474 2,230 118 2,348Loans:
DomesticCredit cards . . . . . . . . . . . . . . . . . . . . . . . . . . . . . . . . . . . . . . 77,242 49,209 126,451 49,079 64,977 114,056Other consumer loans . . . . . . . . . . . . . . . . . . . . . . . . . . . . . . (1,993) (1,066) (3,059) (7,162) (694) (7,856)
Total domestic loans . . . . . . . . . . . . . . . . . . . . . . . . . . . . . . . 75,249 48,143 123,392 41,917 64,283 106,200International
Credit cards . . . . . . . . . . . . . . . . . . . . . . . . . . . . . . . . . . . . . . 40,807 (2,312) 38,495 118,784 (1,519) 117,265Other consumer loans . . . . . . . . . . . . . . . . . . . . . . . . . . . . . . (2,020) (2,020) (4,040) (6,286) (133) (6,419)
Total international loans . . . . . . . . . . . . . . . . . . . . . . . . . . . . 38,787 (4,332) 34,455 112,498 (1,652) 110,846
Total loans . . . . . . . . . . . . . . . . . . . . . . . . . . . . . . . . . . . . . . . 114,036 43,811 157,847 154,415 62,631 217,046Other interest-earning assets . . . . . . . . . . . . . . . . . . . . . . . . . . . . . 1,252 12,207 13,459 16,898 48,862 65,760
Total interest income . . . . . . . . . . . . . . . . . . . . . . . . . . . . . . . 372,330 57,313 429,643 164,934 118,781 283,715Interest-bearing liabilities:
Interest-bearing deposits:Time deposits . . . . . . . . . . . . . . . . . . . . . . . . . . . . . . . . . . . . . . 193,746 70,998 264,744 (55,602) 51,507 (4,095)Money market deposits . . . . . . . . . . . . . . . . . . . . . . . . . . . . . . . 103,023 6,127 109,150 42,463 19,891 62,354Other interest-bearing deposits . . . . . . . . . . . . . . . . . . . . . . . . . 363 (9) 354 461 323 784
Total interest-bearing deposits . . . . . . . . . . . . . . . . . . . . . . . 297,132 77,116 374,248 (12,678) 71,721 59,043Borrowings:
Short-term borrowingsDomestic . . . . . . . . . . . . . . . . . . . . . . . . . . . . . . . . . . . . . . . . (37,903) 9,753 (28,150) 10,090 44,686 54,776International . . . . . . . . . . . . . . . . . . . . . . . . . . . . . . . . . . . . . 26,664 39,963 66,627 34,226 (2,767) 31,459
Total short-term borrowings . . . . . . . . . . . . . . . . . . . . . . . . . (11,239) 49,716 38,477 44,316 41,919 86,235Long-term borrowings
Domestic . . . . . . . . . . . . . . . . . . . . . . . . . . . . . . . . . . . . . . . . 39,087 1,798 40,885 153 4,095 4,248International . . . . . . . . . . . . . . . . . . . . . . . . . . . . . . . . . . . . . (10,990) (245) (11,235) 14,161 (126) 14,035
Total long-term borrowings . . . . . . . . . . . . . . . . . . . . . . . . . 28,097 1,553 29,650 14,314 3,969 18,283
Total borrowings . . . . . . . . . . . . . . . . . . . . . . . . . . . . . . . . . . 16,858 51,269 68,127 58,630 45,888 104,518
Total interest expense . . . . . . . . . . . . . . . . . . . . . . . . . . . . . . 313,990 128,385 442,375 45,952 117,609 163,561
Net interest income . . . . . . . . . . . . . . . . . . . . . . . . . . . . . . . . $ 58,340 $ (71,072) $ (12,732) $118,982 $ 1,172 $120,154
(1) The rate/volume variance for each category has been allocated on a consistent basis between rate and volume variances based on thepercentage of the rate or volume variance to the sum of the two absolute variances.
For the year ended November 30, 2007, interest income increased $429.6 million, or 17%, as compared tothe year ended November 30, 2006, due to higher average interest-earning assets of $6.1 billion offset by a 50basis point decrease in interest yield. The level of interest-earning assets reflects higher Federal Funds soldassociated with the establishment of a liquidity reserve, growth in credit card loan receivables and the inclusionof Goldfish loan receivables for a full twelve months. The interest yield for the year ended November 30, 2007,was adversely impacted by a higher mix of lower yielding Federal Funds sold associated with the establishmentof the liquidity reserve. This was offset in part by the favorable impact of a higher comparative interest rateenvironment on floating rate assets, including domestic credit card loan receivables, amounts due from assetsecuritization and Federal Funds sold.
21

For the year ended November 30, 2007, interest expense increased $442.4 million, or 47%, as compared tothe year ended November 30, 2006, due to a $6.1 billion increase in the level of average interest-bearingliabilities to support the increase in interest-earning assets and a 60 basis point increase in the average cost offunds. The higher cost of funds reflects the impact of the higher comparative interest rate environment onfloating rate money market deposits and short-term borrowings, the replacement of maturing certificates ofdeposit with issuances having higher interest rates and the higher cost of funding following the Distribution.
For the year ended November 30, 2006, interest income increased $283.7 million, or 13%, as compared tothe year ended November 30, 2005, due to higher average interest-earning assets of $1.8 billion and a 48 basispoint increase in interest yield. The level of interest-earning assets reflects higher credit card loan receivablesresulting from the acquisition of Goldfish and higher domestic sales volume, in addition to higher amounts duefrom asset securitization. The increase in the interest yield is largely attributable to improved credit quality on thedomestic credit card loan receivables following the October 2005 effective date of the new U.S. bankruptcylegislation and the related lower level of interest charge-offs. The higher interest yield also reflects higher interestincome on floating rate interest-earning assets resulting from the rising interest rate environment.
For the year ended November 30, 2006, interest expense increased $163.6 million, or 21%, as compared tothe year ended November 30, 2005, due to a 58 basis point increase in the average cost of funds and a$1.2 billion increase in the level of average interest-bearing liabilities to support the increase in interest-earningassets. The increase in the average cost of funds reflects the effect of the rising interest rate environment oninterest-bearing liabilities that are tied to floating rates. This effect was partially offset by the replacement ofmaturing brokered certificates of deposit with shorter-term instruments having lower costs. The increase inaverage interest-bearing liabilities consists of higher short-term notes payable to Morgan Stanley due to a lowerlevel of U.K. securitized loans, higher money market accounts obtained from the Bank Deposit Program andhigher Federal Funds purchased, specifically from Morgan Stanley Bank.
Maturities and Sensitivities of Loan Receivables to Changes in Interest Rates
Our loan receivables had the following maturity distribution(1) at November 30, 2007 (dollars in thousands):
Due OneYear or Less
Due AfterOne YearThrough
Five YearsDue AfterFive Years Total
Domestic:Credit card . . . . . . . . . . . . . . . . . . . . . . . . . . . . . . . . $4,961,352 $10,333,950 $5,050,485 $20,345,787Commercial loans . . . . . . . . . . . . . . . . . . . . . . . . . . 72,686 124,948 36,502 234,136Other consumer loans . . . . . . . . . . . . . . . . . . . . . . . 2,574 80,034 168,586 251,194
International . . . . . . . . . . . . . . . . . . . . . . . . . . . . . . . . . . 672,368 1,521,498 929,312 3,123,178
Loan receivables . . . . . . . . . . . . . . . . . . . . . . . $5,708,980 $12,060,430 $6,184,885 $23,954,295
(1) Because of the uncertainty regarding loan repayment patterns, which historically have been higher than contractually required minimumpayments, this amount may not necessarily be indicative of our actual loan repayments.
At November 30, 2007, of our loan receivables due after one year, approximately $6.8 billion had interestrates tied to an index and approximately $11.4 billion were fixed rate loans.
Provision for Loan Losses
Provision for loan losses is the expense related to maintaining the allowance for loan losses at a leveladequate to absorb the estimated probable losses in the loan portfolio at each period end date. Factors that
22

influence the provision for loan losses include the level and direction of loan delinquencies and charge-offs,changes in consumer spending and payment behaviors, bankruptcy trends, regulatory changes or new regulatoryguidance, the seasoning of our loan portfolio, interest rate movements and their impact on consumer behavior,and changes in our loan portfolio, including the overall mix of accounts, products and loan balances within theportfolio. We consider the credit quality of the loan portfolio in determining the allowance for loan losses. See“—Critical Accounting Policies” and Note 2: Summary of Significant Accounting Policies to the auditedconsolidated and combined financial statements for further discussion. Credit quality at any time reflects, amongother factors, our credit granting practices and effectiveness of collection efforts, the impact of general economicconditions on the consumer, and the seasoning of the loans.
For the year ended November 30, 2007, the provision for loan losses increased $194.5 million, or 26%, ascompared to the year ended November 30, 2006, reflecting a higher level of loan receivables and an increase indomestic delinquencies in the fourth quarter of 2007, as well as deteriorating credit quality in the internationalloan portfolio. For the year ended November 30, 2006, the provision for loan losses decreased $122.8 million, or14%, as compared to the year ended November 30, 2005, reflecting improvements in domestic loan losses offsetin part by higher losses on international loans. The decrease in net domestic charge-offs reflected an accelerationof charge-offs in 2005, resulting in lower amounts in 2006, as a result of a decline in bankruptcy receiptsfollowing the October 2005 effective date of the new U.S. bankruptcy legislation, and improved domestic creditand collection experience. In 2006, international loan net charge-offs include the impact of the Goldfishacquisition in February 2006.
Allowance for Loan Losses
The following table provides a summary of the allowance for loan losses (dollars in thousands):
For the Years Ended November 30,
2007 2006 2005 2004 2003
Balance at beginning of period . . . . . . . . . $ 832,483 $ 838,848 $ 942,721 $1,001,656 $ 927,351Charge-offs:
Domestic . . . . . . . . . . . . . . . . . . . . . . (839,091) (852,636) (1,076,179) (1,061,084) (1,246,954)International . . . . . . . . . . . . . . . . . . . (221,785) (148,794) (68,177) (58,655) (56,181)
Total charge-offs . . . . . . . . . . . . (1,060,876) (1,001,430) (1,144,356) (1,119,739) (1,303,135)Recoveries:
Domestic . . . . . . . . . . . . . . . . . . . . . . 161,213 154,066 145,642 114,721 96,219International . . . . . . . . . . . . . . . . . . . 27,079 20,418 20,805 16,835 11,452
Total recoveries . . . . . . . . . . . . . 188,292 174,484 166,447 131,556 107,671
Net charge-offs . . . . . . . . . . . . . . . . . . . . . (872,584) (826,946) (977,909) (988,183) (1,195,464)
Provision for loan losses:Domestic . . . . . . . . . . . . . . . . . . . . . . 733,887 606,765 816,197 893,531 1,220,094International . . . . . . . . . . . . . . . . . . . 216,278 148,872 62,289 32,018 46,018
Total provision for loanlosses . . . . . . . . . . . . . . . . . . . 950,165 755,637 878,486 925,549 1,266,112
Other activity:Domestic . . . . . . . . . . . . . . . . . . . . . . — — (199) — —International:
Reserves acquired(1) . . . . . . . . . . — 55,499 — — —Translation adjustments and
other . . . . . . . . . . . . . . . . . . . . 6,780 9,445 (4,251) 3,699 3,656
Total other activity . . . . . . . . . . 6,780 64,944 (4,450) 3,699 3,656
Balance at end of period . . . . . . . . . . . . . . $ 916,844 $ 832,483 $ 838,848 $ 942,721 $1,001,656
(1) Acquired reserves related to the Goldfish acquisition.
23

The allowance for loan losses increased $84.4 million, or 10%, at November 30, 2007 as compared toNovember 30, 2006, reflecting a higher loan portfolio, deterioration in the consumer credit environment in theUnited Kingdom and higher domestic delinquencies. As a result of the higher domestic delinquencies specificallyin the latter months of 2007 coupled with a higher loan portfolio at November 30, 2007, we increased ourallowance for loan losses by $124 million in the fourth quarter of 2007, which accounted for more than the fullyear change. The allowance for loan losses decreased $6.4 million, or 1%, at November 30, 2006 as compared toNovember 30, 2005, reflecting improved domestic credit quality offset in part by a decline in international creditquality, recognition of reserves acquired with Goldfish and an increase in the loan portfolio. The factorsimpacting the changes in credit quality across these periods are discussed further in the net charge-offs anddelinquency sections below.
The following table provides a summary of the composition of the allowance for loan losses (dollars inthousands):
At November 30,
2007 2006 2005 2004 2003
$% toTotal $
% toTotal $
% toTotal $
% toTotal $
% toTotal
Domestic . . . . . . . . . . . . . . . . $759,925 82.9% $703,917 84.6% $795,722 94.9% $910,261 96.6% $ 963,092 96.1%International . . . . . . . . . . . . . . 156,919 17.1 128,566 15.4 43,126 5.1 32,460 3.4 38,564 3.9
Allowance for loan losses atend of period . . . . . . . . . . . $916,844 100.0% $832,483 100.0% $838,848 100.0% $942,721 100.0% $1,001,656 100.0%
The allowance for loan losses is a general allowance that is determined separately for the domestic andinternational loan portfolios. Accordingly, the percentage of the allowance for loan losses applicable to thedomestic and international loan receivables will be a function of both the loan balances and credit quality of eachportfolio. The percentage of the total allowance for loan losses applicable to the domestic loan portfolio declinedto 82.9% at November 30, 2007 from 84.6% at November 30, 2006. This decrease reflected a higher allowancefor loan losses on the international loan portfolio attributable to deteriorating credit quality and a higher level ofloan receivables resulting from certain maturing securitizations being retained on the balance sheet. This wasoffset in part by an increase in the domestic loan portfolio. The percentage of the total allowance for lossesapplicable to the domestic loan portfolio declined to 84.6% at November 30, 2006 from 94.9% at November 30,2005. This decrease was due to improved credit quality in the domestic loan portfolio as compared todeterioration in international loan credit quality and a slightly smaller relative percentage of the loan balancescomposed of domestic loans. In 2006, we recorded an acquired allowance for loan losses related to internationalloan portfolio acquisitions of $55.5 million.
Net Charge-offs
Our net charge-offs include the principal amount of losses charged-off less current period principalrecoveries and exclude charged-off interest and fees, current period recoveries of interest and fees and fraudlosses. Charged-off and recovered interest and fees are recorded in interest and loan fee income for loanreceivables and in securitization income for securitized loans while fraud losses are recorded in other expense.Credit card loans are charged-off at the end of the month during which an account becomes 180 dayscontractually past due, except in the case of cardmember bankruptcies and probate accounts. Cardmemberbankruptcies and probate accounts are charged-off at the end of the month 60 days following the receipt ofnotification of the bankruptcy or death but not later than the 180-day contractual time frame. The net charge-offrate is calculated by dividing net charge-offs for the period by the average loan receivables for the period.
24

The following table presents amounts and rates of net charge-offs of loan receivables (dollars in thousands):
For the Years Ended November 30,
2007 2006 2005 2004 2003
$ % $ % $ % $ % $ %
Net Charge-offsDomestic . . . . . . . . . . $677,878 3.40% $698,570 3.63% $930,537 4.93% $946,363 5.71% $1,150,735 6.26%International . . . . . . . . 194,706 6.56% 128,376 4.96% 47,372 3.33% 41,820 2.87% 44,729 2.78%
Total . . . . . . . . . . $872,584 3.81% $826,946 3.79% $977,909 4.82% $988,183 5.48% $1,195,464 5.98%
The net charge-off rate on our total loan receivables increased 2 basis points for the year endedNovember 30, 2007 as compared to the year ended November 30, 2006, reflecting deteriorating credit quality inthe international portfolio and the inclusion of Goldfish loan receivables for a full year, largely offset by soundcredit performance in the domestic portfolio. The net charge-off rate on our loan receivables decreased 103 basispoints for the year ended November 30, 2006 as compared to the prior year. The decrease reflected theacceleration of charge-offs in the domestic loan portfolio in 2005 related to new bankruptcy legislation, offset inpart by deteriorating credit quality in the international portfolio and a higher percentage of international loanreceivables in the portfolio as a result of the Goldfish acquisition.
The net charge-off rate on domestic loan receivables declined 23 basis points for the year endedNovember 30, 2007 as compared to the year ended November 30, 2006. This decline reflected a continued lowerlevel of bankruptcy-related charge-offs following the October 2005 effective date of the new U.S. bankruptcylegislation, offset in part by a higher level of contractual charge-offs. The bankruptcy legislation, which made itmore difficult for individuals to declare bankruptcy, resulted in a surge in bankruptcy receipts and relatedcharge-offs in 2005 and early 2006. Accordingly, the year ended November 30, 2006 was adversely impacted byan elevated level of charge-offs in the first quarter. The net charge-off rate on domestic loan receivables declined130 basis points for the year ended November 30, 2006 compared to the prior year, reflecting record low levelsof bankruptcy charge-offs following the effective date of the legislation, as well as improved credit andcollection experience.
The net charge-off rate on international loan receivables increased 160 basis points and 163 basis points forthe years ended November 30, 2007 and 2006, respectively, as compared to prior respective periods. Theseincreases were due to legislative changes in the United Kingdom that have led to increased bankruptcy andindividual voluntary arrangement filings and a general deterioration in consumer credit quality in the UnitedKingdom. In addition, the year ended November 30, 2007 reflected the implementation of higher minimumpayment requirements on certain accounts as well as a full year of charge-offs related to the Goldfish portfolio,which was acquired in February 2006.
Delinquencies
Delinquencies are an indicator of credit quality at any point in time. Loan balances are considereddelinquent when contractual payments on the loan become 30 days past due.
The following table presents the amounts and delinquency rates of loan receivables over 30 days past due(dollars in thousands):
At November 30,
Loans over30 days delinquent 2007 2006 2005 2004 2003
$ % $ % $ % $ % $ %
Domestic . . . . . . . $678,963 3.26% $633,150 3.05% $756,198 3.67% $790,048 4.18% $ 990,767 5.51%International . . . . 153,337 4.91% 128,806 4.36% 77,919 3.55% 24,895 2.02% 39,351 2.84%
Total . . . . . . $832,300 3.47% $761,956 3.21% $834,117 3.66% $814,943 4.05% $1,030,118 5.32%
25

The over 30 day delinquency rate of our total loan portfolio increased 26 basis points to 3.47% atNovember 30, 2007 as compared to November 30, 2006, reflecting higher delinquencies in both the domestic andinternational portfolios. The domestic over 30 day delinquency rate increased 21 basis points to 3.26% atNovember 30, 2007 as compared to prior year as a result of a weakening U.S. economy. The international over30 day delinquency rate increased 55 basis points to 4.91% at November 30, 2007 as compared to prior year,reflecting deterioration in consumer credit quality in the United Kingdom and increases in minimum paymentrequirements on certain accounts.
The over 30 day delinquency rate of our total loan portfolio decreased 45 basis points at November 30, 2006as compared to November 30, 2005, due to improved domestic credit quality partially offset by deterioratinginternational credit quality and a higher percentage of international loans in loan receivables. The over 30 daydelinquency rate of our domestic loan receivables declined 62 basis points at November 30, 2006 compared toprior year due to improved credit quality and collection experience. The over 30 day delinquency rate of ourinternational loan receivables increased 81 basis points at November 30, 2006 as compared to prior year due to ageneral deterioration in consumer credit quality in the United Kingdom. For 2006, the over 30 day delinquencyrates include the impact of the acquisition of the Goldfish business in February 2006.
The following table presents the amounts and delinquency rates of loan receivables that are accruing interestand are over 90 days delinquent (dollars in thousands):
At November 30,
Loans over 90 daysdelinquent andaccruing interest 2007 2006 2005 2004 2003
$ % $ % $ % $ % $ %
Domestic . . . . . . . . $271,227 1.30% $244,669 1.18% $263,439 1.28% $342,324 1.81% $409,644 2.28%International . . . . . 49,438 1.58% 38,997 1.32% 26,640 1.29% 9,822 0.88% 12,767 0.95%
Total . . . . . . . $320,665 1.34% $283,666 1.19% $290,079 1.27% $352,146 1.75% $422,411 2.18%
These loans are included in loan receivables over 30 days delinquent and the related discussion thereof.
The following table presents the amounts and delinquency rates of loan receivables that are not accruinginterest, regardless of delinquency (dollars in thousands):
At November 30,
Loans notaccruing interest 2007 2006 2005 2004 2003
$ % $ % $ % $ % $ %
Domestic . . . . . . . . $102,286 0.49% $110,486 0.53% $215,671 1.05% $116,596 0.62% $138,918 0.77%International(1) . . . . 118,572 3.80% 143,435 4.86% 57,428 2.79% 16,467 1.47% 11,601 0.86%
Total . . . . . . . $220,858 0.92% $253,921 1.07% $273,099 1.20% $133,063 0.66% $150,519 0.78%
(1) The increase in international loans not accruing interest beginning in 2006 is attributable to the acquisition of Goldfish.
Loan receivables are placed on non-accrual status upon receipt of notification of the bankruptcy or death ofa cardmember and as part of certain collection processes. Our loan receivables not accruing interest atNovember 30, 2007 decreased 15 basis points to 0.92% as compared to November 30, 2006. This decrease wasattributable to tighter collection strategies on the international portfolio. Our loans not accruing interest atNovember 30, 2006 decreased 13 basis points to 1.07% as compared to November 30, 2005, when domesticnon-accrual loans were elevated due to the surge in bankruptcy receipts before the October 2005 effective date ofthe new U.S. bankruptcy legislation.
26

Other Income
The principal component of other income is securitization income. The following table presents thecomponents of other income for the periods presented (dollars in thousands):
For the Years Ended November 30,2007 vs. 2006
increase (decrease)2006 vs. 2005
increase (decrease)
2007 2006 2005 $ % $ %
Securitization income . . . . . . . . . . . $2,384,487 $2,338,405 $1,608,928 $46,082 2% $729,477 45%Loan fee income . . . . . . . . . . . . . . . 387,203 369,449 338,169 17,754 5% 31,280 9%Discount and interchange
revenue(1) . . . . . . . . . . . . . . . . . . . 263,913 365,986 618,158 (102,073) (28%) (252,172) (41%)Insurance . . . . . . . . . . . . . . . . . . . . . 202,164 188,160 168,791 14,004 7% 19,369 11%Merchant fees . . . . . . . . . . . . . . . . . 92,518 109,230 72,871 (16,712) (15%) 36,359 50%Transaction processing revenue . . . 99,653 94,472 86,903 5,181 5% 7,569 9%Other income . . . . . . . . . . . . . . . . . . 116,181 73,237 43,217 42,944 59% 30,020 69%
Total other income . . . . . . . . . $3,546,119 $3,538,939 $2,937,037 $ 7,180 0% $601,902 20%
(1) Net of rewards, including Cashback Bonus rewards, of $787 million, $767 million and $659 million for the years ended November 30,2007, 2006 and 2005, respectively.
Total other income was relatively flat for the year ended November 30, 2007 as compared to the year endedNovember 30, 2006, as higher securitization income and other income were offset by lower discount andinterchange revenue. Total other income increased $601.9 million, or 20%, for the year ended November 30,2006 as compared to the year ended November 30, 2005, primarily related to higher securitization income.
Securitization income in 2006 benefited from a favorable revaluation of the interest-only strip receivablereflecting higher excess spread projections as a result of the new U.S. bankruptcy legislation which becameeffective in October 2005. Securitization income in 2005 was negatively impacted by the effect of the anticipatedlevel of charge-offs on the projected excess spread which in turn adversely affected the valuation of theinterest-only strip receivable.
For securitization transactions completed on or after November 3, 2004, in accordance with governingsecuritization documents, we allocate portions of our discount and interchange revenue to new securitizationtransactions. Within other income, this change to allocating discount and interchange revenue has the effect ofdecreasing discount and interchange revenue and increasing securitization income. The amount of discount andinterchange revenue allocated to securitization income has increased since this change was made in 2004 and isexpected to continue increasing as new transactions which include allocations are completed and securitizationtransactions that did not receive allocations mature. For the years ended November 30, 2007, 2006 and 2005,there were 69%, 54% and 22%, respectively, of average securitized loans to which discount and interchangerevenue was allocated.
To broaden merchant acceptance of Discover Network cards, we began outsourcing our acquisition andservicing of small and mid-sized merchants to merchant acquiring organizations in late 2006. In addition, we areselling small and mid-size merchant portfolios to third-party acquirers to facilitate integrated servicing andreduce costs. As the outsourcing continues, merchant discount will be replaced by acquirer interchange andassessments, which will reduce the percentage of income per transaction and, over time, operating expenses aswe no longer incur costs to acquire and service small and mid-sized merchants. The lower cost per transaction isexpected to be offset by increased volume due to broader acceptance. Any gains on the sale of merchantacquiring portfolios will be reflected in other income as earned.
27

Securitization Income
Securitization income is a significant source of our income and is derived through asset securitizations andcontinued servicing of a portion of the credit card receivables we originated. The issuance of asset-backedsecurities to investors has the effect of removing the owned loan receivables from the consolidated and combinedstatements of financial condition. Also, portions of interest income, provision for loan losses and certaincomponents of other income related to the securitized loans against which beneficial interests have been issuedare no longer reported in our statements of income; however, they remain significant factors in determiningsecuritization income we receive on our retained beneficial interest in those transactions. Investors insecuritizations are allocated the cash flows derived from interest and loan fee revenue earned on securitizedloans. In addition, for domestic securitization transactions completed on or after November 3, 2004, inaccordance with governing securitization documents, we allocate portions of our discount and interchangerevenue to new securitization transactions. These cash flows are used to pay investors in the transactions acontractual fixed or floating rate of return on their investment, to reimburse investors for losses of principalresulting from charged-off loans, net of recoveries, and to pay us a contractual fee for servicing the securitizedloans. Any excess cash flows remaining are paid to us. Both servicing fees and excess spread are recorded insecuritization income. Securitization income also includes the net revaluation of the interest-only strip receivableand certain other retained interests, reflecting adjustments to the fair values of the retained interests that resultfrom changes in the level of securitized loans and assumptions used to value the retained interests.
Securitization income is significantly influenced by the level of average securitized loans. For the yearsended November 30, 2007, 2006 and 2005, the average securitized loans were $28.5 billion, $26.6 billion and$27.4 billion, respectively.
The table below presents the components of securitization income (dollars in thousands):
For the Years Ended November 30,2007 vs. 2006
increase (decrease)2006 vs. 2005
increase (decrease)
2007 2006 2005 $ % $ %
Excess spread . . . . . . . . . . . . . . . . . . . . $1,792,330 $1,662,355 $1,158,331 $129,975 8% $504,024 44%Servicing fees on securitized loans . . . 569,215 535,985 548,694 33,230 6% (12,709) (2%)Net revaluation of retained interests . . 44,878 159,442 (78,474) (114,564) (72%) 237,916 303%Other (principally transaction costs) . . (21,936) (19,377) (19,623) (2,559) (13%) 246 1%
Total securitization income . . . . . . . . . $2,384,487 $2,338,405 $1,608,928 $ 46,082 2% $729,477 45%
For the year ended November 30, 2007, securitization income increased $46.1 million, or 2%, as comparedto the year ended November 30, 2006. The increase reflects higher excess spread and servicing fees related to ahigher level of average securitized loans, offset in part by a lower net revaluation of retained interests. For theyear ended November 30, 2006, securitization income increased $729.5 million, or 45%, as compared to the yearended November 30, 2005. The increase reflects a higher excess spread on securitized loans and a higher netrevaluation of the interest-only strip receivable, both of which were offset in part by a lower level of averagesecuritized loans.
28

Excess spread. The following table provides the components of excess spread (dollars in thousands):
For the Years Ended November 30,2007 vs. 2006
increase (decrease)2006 vs. 2005
increase (decrease)
2007 2006 2005 $ % $ %
Interest income on securitized loans . . . . . . . . . $ 3,972,350 $ 3,708,959 $ 3,529,586 $263,391 7% $179,373 5%Interest paid to investors in asset-backed
securities . . . . . . . . . . . . . . . . . . . . . . . . . . . . (1,593,373) (1,397,549) (1,024,618) (195,824) (14%) (372,931) (36%)
Net interest income . . . . . . . . . . . . . . . . . . . . . . 2,378,977 2,311,410 2,504,968 67,567 3% (193,558) (8%)Other fee revenue on securitized loans(1) . . . . . 1,203,245 1,032,937 713,650 170,308 16% 319,287 45%Net charge-offs on securitized loans . . . . . . . . . (1,220,677) (1,146,007) (1,511,593) (74,670) (7%) 365,586 24%
Net revenues on securitized loans . . . . . . . . . . . 2,361,545 2,198,340 1,707,025 163,205 7% 491,315 29%Servicing fees on securitized loans . . . . . . . . . . (569,215) (535,985) (548,694) (33,230) (6%) 12,709 2%
Excess spread . . . . . . . . . . . . . . . . . . . . . . . . . . $ 1,792,330 $ 1,662,355 $ 1,158,331 $129,975 8% $504,024 44%
(1) Other fee income includes discount and interchange revenue, loan fee income and insurance (credit fee products) revenues.
For the year ended November 30, 2007, excess spread on securitized loans increased $130.0 million, or 8%,as compared to the year ended November 30, 2006, due primarily to a higher level of average securitized loansand other fee revenue on securitized loans resulting from the higher level of outstanding securitized loansreceiving discount and interchange revenue. Although net interest income increased as a result of the higher levelof average securitized loans, the net interest spread for the year ended November 30, 2007 was lower due to ahigher rate of return paid on floating rate investor interests due to higher average LIBOR.
For the year ended November 30, 2006, excess spread on securitized loans increased $504.0 million, or44%, as compared to the year ended November 30, 2005. The higher excess spread reflects lower net charge-offsand higher other fee revenue, partially offset by lower net interest income. The decrease in net charge-offsreflects the improved credit quality following the October 2005 effective date of the new U.S. bankruptcylegislation. The increase in other fee income reflects a higher level of outstanding securitized loans receivingmerchant discount and interchange revenue. The decrease in net interest income is primarily attributable to ahigher rate of return paid to investors reflecting the impact of the rising interest rate environment on floating rateinvestor interests.
Servicing fees on securitized loans. We are paid a servicing fee for the cash flows generated by thesecuritized loans. These cash flows include interest income and loan fee income as well as discount andinterchange revenue for certain securitized loans. For the year ended November 30, 2007, servicing feesincreased $33.2 million, or 6%, from the prior year due to a higher level of securitized loans. For the year endedNovember 30, 2006, servicing fees decreased $12.7 million, or 2% from the prior year due to a lower level ofsecuritized loans in comparison to the prior year.
29

Net revaluation of retained interests. The components of net revaluation of retained interests aresummarized in the table below (dollars in thousands):
For the Years Ended November 30,2007 vs. 2006
increase (decrease)2006 vs. 2005
increase (decrease)
2007 2006 2005 $ $
Initial gain on new securitizationtransactions . . . . . . . . . . . . . . . . . . . . $122,949 $103,805 $ 81,947 $ 19,144 $ 21,858
Revaluation of retained interests . . . . . . (78,071) 55,637 (160,421) (133,708) 216,058
Net revaluation of retained interests . . . $ 44,878 $159,442 $ (78,474) $(114,564) $237,916
The net revaluation of retained interests includes the initial gain on securitized loan receivables againstwhich beneficial interests have been issued to third-parties and changes in the fair value of retained interests,principally the interest-only strip receivable. The net revaluation of the interest-only strip receivable representschanges in the estimated present value of certain components of excess spread on the securitized loans to beearned in the future. Changes in the maturity profile and the estimate of performance measures of the securitizedloans, such as interest yield and charge-offs, as well as changes in the interest rate environment, can affect futureexcess spread projections and, accordingly, the net revaluation of the interest-only strip receivable.
The net revaluation of retained interests for the year ended November 30, 2007 decreased to $44.9 millionas compared to $159.4 million for the year ended November 30, 2006. The negative net revaluation of retainedinterests of $78.1 million for the year ended November 30, 2007 was primarily attributable to net gainamortization related to the maturity of securitization transactions. This was offset in part by higher projectedexcess spread at November 30, 2007, reflecting the lower absolute interest rate environment as compared to thatassumed at prior year end. The year ended November 30, 2007 also reflected a higher initial gain as a result of ahigher level of new securitization transactions as compared to the year ended November 30, 2006.
The net revaluation of retained interests for the year ended November 30, 2006 increased to $159.4 millionas compared to a net negative revaluation of $78.5 million for the year ended November 30, 2005. The netpositive revaluation of retained interests for the year ended November 30, 2006 was favorably impacted by theeffect of lower charge-offs following the October 2005 effective date of the new U.S. bankruptcy legislation onthe interest-only strip receivable. Additionally, during the year ended November 30, 2006, there was a higherlevel of new credit card securitization transactions as compared to the year ended November 30, 2005, as well asa decrease in net gain amortization related to prior securitization transactions.
Loan Fee Income
Loan fee income consists primarily of fees on credit card loans and includes late, overlimit, balance transfer,cash advance and other miscellaneous fees. Loan fee income increased $17.8 million, or 5%, for the year endedNovember 30, 2007 as compared to November 30, 2006, reflecting higher balance transfer fees partially offset bylower late and overlimit fees. Loan fee income increased $31.3 million, or 9%, for the year ended November 30,2006 as compared to the year ended November 30, 2005, primarily due to portfolio growth in the UnitedKingdom related to the Goldfish acquisition as well as lower fee net charge-offs and waivers and higher balancetransfer fees in the United States.
Discount and Interchange Revenue
Discount and interchange revenue includes discount revenue and acquirer interchange net of interchangepaid to third-party issuers in the United States, and issuer interchange revenue in the United Kingdom. In theUnited States, we earn discount revenue from fees charged to merchants with whom we have entered into cardacceptance agreements for processing cardmember purchase transactions and acquirer interchange revenue from
30

merchant acquirers on all Discover Network card transactions made by cardholders at merchants with whommerchant acquirers have entered into card acceptance agreements for processing cardholder purchasetransactions. We incur an interchange cost to card issuing entities that have entered into contractual arrangementsto issue cards on the Discover Network. This cost is contractually established and is based on the card issuingorganizations’ transaction volume and is reported as a reduction to discount and interchange revenue. In theUnited Kingdom, where we issue MasterCard and Visa branded cards, we earn interchange revenue fromtransactions processed by those networks. We offer our cardmembers various reward programs, including theCashback Bonus reward program, pursuant to which we pay certain cardmembers a percentage of their purchaseamounts based on the type and volume of the cardmember’s purchases. Reward costs are recorded as a reductionto discount and interchange revenue. For securitization transactions completed on or after November 3, 2004, inaccordance with governing securitization documents, we allocate portions of discount and interchange revenue tonew securitization transactions, which results in a decrease in discount and interchange revenue and an increasein securitization income. However, cardmember rewards costs associated with the securitized loans are notallocated to investor interests, and as such, do not impact securitization income.
Discount and interchange revenue decreased $102.1 million, or 28%, for the year ended November 30, 2007as compared to the year ended November 30, 2006, due to higher allocations to securitized loans which have theeffect of reclassifying discount and interchange revenue to securitization income and higher cardmemberrewards, partially offset by an increase in discount and interchange revenue earned related to increased salesvolume. The increase in allocations to securitized loans was due to a higher level of outstanding securitized loansreceiving allocations than in 2006. The increase in cardmember rewards reflected higher sales volume.
Discount and interchange revenue decreased $252.2 million, or 41%, for the year ended November 30, 2006as compared to the year ended November 30, 2005, due to higher allocations to securitized loans which have theeffect of reclassifying discount and interchange revenue to securitization income, and due to higher cardmemberrewards partially offset by an increase in discount and interchange revenue earned. The increase in allocations tosecuritized loans was due to a higher level of outstanding securitized loans receiving allocations than in 2005.This adverse effect on discount and interchange revenue was partially offset by higher sales volume in 2006reflecting increased cardmember usage and the acquisition of Goldfish in February 2006. The increase incardmember rewards reflected higher sales volume and the impact of promotional programs which offer certaincardmembers additional rewards for various types of purchases.
Insurance (Credit Fee Products)
We earn revenue primarily related to fees received for marketing credit-related ancillary products includinginsurance, debt deferment/debt cancellation contracts and credit protection services to cardmembers. The amountof revenue recorded is based on the terms of the insurance policies and contracts with third-party providers. Wedo not retain any significant underwriting loss exposure. We recognize this income over the policy or contractperiod as earned. Insurance income increased $14.0 million, or 7%, for the year ended November 30, 2007, ascompared to the year ended November 30, 2006, primarily related to higher credit protection revenue. Insuranceincome increased $19.4 million, or 11%, for the year ended November 30, 2006 as compared to the year endedNovember 30, 2005, primarily related to increased cardmember participation resulting from the Goldfishacquisition.
Merchant Fees
Merchant fees consist primarily of fees charged to merchants for various services including manualauthorization of transactions and delivery of hardcopy statements. Merchant fees decreased $16.7 million, or15%, for the year ended November 30, 2007 as compared to November 30, 2006 due to increased outsourcing tomerchant acquirers. Merchant fees increased $36.4 million, or 50%, for the year ended November 30, 2006 ascompared to the year ended November 30, 2005, due to an increase in pricing on certain fees. As merchant
31

acquiring portfolios are sold to third-party merchant acquirers, this revenue will decrease along with associatedcosts.
Transaction Processing Revenue
Transaction processing revenues include switch fees charged to financial institutions for accessing thePULSE Network to process transactions and various participation and membership fees. Switch fees are chargedon a per transaction basis. Transactions processing revenue increased $5.2 million, or 5%, for the year endedNovember 30, 2007 as compared to November 30, 2006, primarily due to increased volumes partially offset bypricing incentives. Transaction processing revenue increased $7.6 million, or 9%, for the year endedNovember 30, 2006 as compared to the year ended November 30, 2005, related to an increased volume oftransactions processed on the network. Transaction processing revenue was a new revenue source in 2005introduced by our acquisition of PULSE in January 2005.
Other Income
Other income includes revenues on various fee-based products, revenues from the referral of declinedapplications to certain third-party issuers on the Discover Network, unrealized gains and losses related toderivative contracts, gains on sales of mortgage loans, investment gains and losses, and other miscellaneousrevenue items. Other income increased $42.9 million, or 59%, for the year ended November 30, 2007 ascompared to November 30, 2006 related to gains from sales of merchant contracts and revenue from the referralof declined applications. This increase was partially offset by losses recorded in recognizing our interest rateswap agreements at their fair values prior to re-designation of hedge accounting in the third quarter of 2007.Other income increased $30.0 million, or 69%, for the year ended November 30, 2006 as compared to the yearended November 30, 2005, primarily related to increased revenue from the referral of declined applications andan increase in unrealized gains on derivative transactions.
Other Expense
The following table represents the components of other expense for the periods presented (dollars inthousands):
For the Years EndedNovember 30,
2007 vs. 2006increase
(decrease)
2006 vs. 2005increase
(decrease)
2007 2006 2005 $ % $ %
Employee compensation and benefits . . . . . . . . . . . . . . . . . $ 922,089 $ 933,196 $ 869,635 $ (11,107) (1%) $ 63,561 7%Marketing and business development . . . . . . . . . . . . . . . . . 610,205 603,556 586,801 6,649 1% 16,755 3%Information processing and communications . . . . . . . . . . . 388,065 387,595 353,054 470 0% 34,541 10%Professional fees . . . . . . . . . . . . . . . . . . . . . . . . . . . . . . . . . 391,024 367,769 292,966 23,255 6% 74,803 26%Premises and equipment . . . . . . . . . . . . . . . . . . . . . . . . . . . 91,531 92,278 91,032 (747) (1%) 1,246 1%Goodwill and intangible impairment loss(1) . . . . . . . . . . . . 391,119 — — 391,119 NM — —Other expense . . . . . . . . . . . . . . . . . . . . . . . . . . . . . . . . . . . 362,479 335,089 339,139 27,390 8% (4,050) (1%)
Total other expense(1) . . . . . . . . . . . . . . . . . . . . . . . . . $3,156,512 $2,719,483 $2,532,627 $437,029 16% $186,856 7%
(1) 2007 includes a $391 million non-cash impairment charge related to our International Card segment.
Total other expense increased $437.0 million, or 16%, for the year ended November 30, 2007, as comparedto the year ended November 30, 2006, primarily related to a $391 million goodwill and intangible impairmentloss in November 2007. Total other expense increased $186.9 million, or 7%, for the year ended November 30,2006 as compared to the year ended November 30, 2005, primarily related to higher employee compensation andbenefits and professional fees.
32

Employee Compensation and Benefits
Employee compensation and benefits decreased $11.1 million, or 1%, for the year ended November 30,2007 as compared to the year ended November 30, 2006, primarily related to a decrease in overhead allocationsfrom Morgan Stanley as a result of the Distribution and lower benefit and commission costs partially offset byhigher salaries and higher amortization related to Founder’s Grant awards. Employee compensation and benefitsincreased $63.6 million, or 7%, for the year ended November 30, 2006 as compared to the year endedNovember 30, 2005, primarily related to additional employees acquired with the Goldfish business, increasedemployee salary levels and benefit costs and incremental compensation related to equity awards granted to ourretirement-eligible employees.
Marketing and Business Development
Marketing and business development increased $6.6 million, or 1%, for the year ended November 30, 2007as compared to the year ended November 30, 2006, related to increased acquisition spending partially offset byreduced advertising. Marketing and business development increased $16.8 million, or 3%, for the year endedNovember 30, 2006 as compared to the year ended November 30, 2005, due to increased acquisition expensesrelated to the launch of the Discover Business Card and other new products and management’s continued focuson receivables growth.
Information Processing and Communications
Information processing and communications for the year ended November 30, 2007 was relativelyunchanged as compared to the year ended November 30, 2006. Information processing and communicationsincreased $34.5 million, or 10%, for the year ended November 30, 2006 as compared to the year endedNovember 30, 2005, primarily related to additional processing costs as a result of the Goldfish acquisition andincreased transaction volume on the PULSE Network.
Professional Fees
Professional fees increased $23.3 million, or 6%, for the year ended November 30, 2007 as compared to theyear ended November 30, 2006, primarily due to spin-off related costs partially offset by lower overheadallocations from Morgan Stanley as a result of the Distribution. Professional fees increased $74.8 million, or26%, for the year ended November 30, 2006 as compared to the year ended November 30, 2005, primarilyrelated to increased legal fees and consulting costs. The increase in legal fees was primarily driven by costsassociated with our lawsuit against Visa and MasterCard. Consulting costs increased due to investments in theDiscover Business Card and various other business initiatives.
Premises and Equipment
Premises and equipment decreased $0.7 million, or 1%, for the year ended November 30, 2007 as comparedto the year ended November 30, 2006, and increased $1.2 million, or 1%, for the year ended November 30, 2006as compared to the year ended November 30, 2005, See Note 7: Premises and Equipment to the auditedconsolidated and combined financial statements for further information related to premises and equipment.
Goodwill and Intangible Impairment Loss
For the year ended November 30, 2007, a non-cash impairment charge of $391 million was recorded in theInternational Card segment, related to our Goldfish business in the United Kingdom. The charge was comprisedof a $291 million goodwill impairment, a $55 million impairment of trade name intangibles and a $45 millionimpairment of purchased credit cardholder relationships (“PCCRs”). There were no such impairment charges ineither of the two prior years.
33

Management completed a strategic review of the International Card segment in the fourth quarter of 2007.As a result, management revised its long-range projections for the International Card segment, and theseprojections were used as the basis for a revised estimate of the segment’s fair value.
The International Card segment comprises a single reporting unit for purposes of goodwill allocation underFinancial Accounting Standards Board (“FASB”) Statement of Financial Accounting Standards No. 142,Goodwill and Other Intangible Assets (“Statement No. 142”). The carrying value of this reporting unit was inexcess of its revised estimated fair value, indicating that goodwill was impaired. Based on evaluation of theestimated fair values of the individual assets and liabilities of the reporting unit, management concluded thatgoodwill had an implied fair value of zero, and accordingly, the $291 million carrying value of goodwillassociated with this reporting unit was written off.
In conjunction with the strategic review and prior to testing goodwill for impairment, managementevaluated the PCCRs and trade name intangibles associated with the International Card segment to determinewhether the carrying values of those assets were recoverable from the future cash flow estimates indicated by therevised long-term projections. Based on those evaluations, neither asset group was deemed to be entirelyrecoverable from expected future cash flows, and accordingly, each was written down to its estimated fair valueas required by Statement No. 142. These write downs, totaling $100 million before taxes, consisted of $45million related to PCCRs and $55 million related to trade name intangibles. See Note 9: Goodwill and Note 10:Other Intangible Assets to the audited consolidated and combined financial statements for further detailsconcerning these impairment charges.
Other Expense
Other expense increased $27.4 million, or 8%, for the year ended November 30, 2007 as compared to theyear ended November 30, 2006, primarily related to higher fraud expense and higher transactional related taxexpense related to the International Card segment. Other expense decreased $4.0 million, or 1%, for the yearended November 30, 2006 as compared to the year ended November 30, 2005, primarily related to lower fraudexpense and legal accruals partially offset by higher franchise taxes, amortization of intangibles and costassociated with new account acquisitions.
Income Tax Expense
Income tax expense decreased $149.1 million, or 29%, for the year ended November 30, 2007 as comparedto the year ended November 30, 2006, reflecting a decrease in pretax income partially offset by a higher effectivetax rate. The effective tax rate increased to 37.7% for the year ended November 30, 2007 from 32.0% for the yearended November 30, 2006. The year ended November 30, 2006 benefited from a favorable resolution of taxexamination issues addressed during the course of a federal tax audit for the years 1997 through 1998 and thefavorable settlement of state tax matters. The year ended November 30, 2007, includes the impact of filing statecombined returns exclusive of Morgan Stanley as well as the International Card segment impairment and rewardsprogram benefits. Income tax expense increased $159.3 million, or 46%, for the year ended November 30, 2006as compared to the year ended November 30, 2005, reflecting an increase in pretax income partially offset by alower effective tax rate. The effective tax rate decreased to 32.0% for the year ended November 30, 2006 from37.5% for the year ended November 30, 2005, primarily related to the favorable resolution of tax examinationissues addressed during the course of a federal tax audit for the years 1997 through 1998 as well as the favorablesettlement of state tax matters.
34

Quarterly Results
The following table presents results on a quarterly basis (dollars in thousands):
For the Three Months EndedNovember 30,
2007August 31,
2007May 31,
2007February 28,
2007
Interest income . . . . . . . . . . . . . . . . . . . . . . . . . . . . . . . . . . . . . $ 748,889 $755,610 $703,365 $680,305Interest expense . . . . . . . . . . . . . . . . . . . . . . . . . . . . . . . . . . . . 400,734 361,469 336,253 283,959
Net interest income . . . . . . . . . . . . . . . . . . . . . . . . . . . . . . 348,155 394,141 367,112 396,346Provision for loan losses . . . . . . . . . . . . . . . . . . . . . . . . . . . . . . 339,916 211,576 203,287 195,386Other income . . . . . . . . . . . . . . . . . . . . . . . . . . . . . . . . . . . . . . 1,003,251 845,498 871,693 825,677Other expense(1) . . . . . . . . . . . . . . . . . . . . . . . . . . . . . . . . . . . . 1,099,495 698,849 702,992 655,176
Income before income tax expense (benefit)(1) . . . . . . . . (88,005) 329,214 332,526 371,461Income tax expense (benefit)(1) . . . . . . . . . . . . . . . . . . . . . . . . (31,521) 126,974 123,284 137,829
Net income (loss)(1) . . . . . . . . . . . . . . . . . . . . . . . . . . . . . . $ (56,484) $202,240 $209,242 $233,632
(1) November 30, 2007 includes a $391 million pretax ($279 million after tax) non-cash impairment charge related to our International Cardsegment.
Liquidity and Capital Resources
We seek to maintain liquidity, capital and funding policies that ensure our credit ratings and bankcapitalization levels are sufficient to provide cost effective access to debt and deposit markets thus providingsufficient liquidity to fund our business. Our liquidity and funding risk management policies are designed tomitigate the risk that we may be unable to access adequate financing to service our financial obligations whenthey come due. Liquidity risk is addressed through various funding criteria and targets that guide our access tothe long-term and short-term debt capital markets, the maturity profile of our liabilities, the diversity of ourfunding sources and investor base, as well as the level of our liquidity reserve as part of a contingency fundingplan. We attempt to ensure that the maturity of our liabilities equals or exceeds the expected holding period of theassets being financed.
Liquidity risk is assessed by several measures including the liquidity position, which measures funding invarious maturity tranches. The maturities of the various funding instruments are reviewed during the fundingplanning and execution process to ensure the maturities are staggered. The mix of funding sources and thecomposition of our investor base are also reviewed during the funding process to ensure appropriatediversification. Funding sources include externally derived short-term borrowings, asset-backed commercialpaper conduit financing, long-term asset-backed securitizations, bank deposits and bank notes.
Corporate Treasury monitors and reviews liquidity and capital management policies and executes strategiesto maintain prudent levels of liquidity and capital. Our senior management reviews financial performancerelative to these policies, monitors the availability of alternative financing sources, evaluates liquidity risk andcapital adequacy, and assesses the interest rate sensitivity of our assets and liabilities.
In light of the Distribution, total intercompany balances from Morgan Stanley were entirely replaced withcertificates of deposit, external deposits from broker-dealers, external secured borrowings, unsecured long-termdebt and asset-backed financing. In June 2007, funding sourced through the Morgan Stanley Global WealthManagement Bank Deposit Program was replaced through the issuance of deposits and the use of alternativeexternal broker-dealer client funds deposited into Discover Bank. Also in June, we facilitated the repayment ofshort- and long-term borrowings from Morgan Stanley through the issuance of new debt. Specifically, wereplaced short-term borrowings related to our cash collateral accounts with external secured financingarrangements, and short-term borrowings related to our fixed assets with our own long-term debt. In June 2007,we also structured external secured financing agreements to replace short- and long-term borrowings related toour International Card segment.
35

Management has implemented liquidity and capital management policies which seek to provide us withadequate access to and supply of funding through the business cycle. Accordingly, management has maintainedan investment grade rating at Discover Bank and received an investment grade rating for Discover FinancialServices following the Distribution. Discover Bank has maintained its BBB rating from S&P and has beenassigned a Baa2 deposit and Baa2 senior unsecured rating from Moody’s and a BBB rating from Fitch. DiscoverFinancial Services has been assigned a BBB- long-term rating from S&P, a Baa3 senior unsecured rating fromMoody’s and a BBB long-term rating from Fitch.
In light of the Distribution, we modified our Contingency Funding Plan (“CFP”) to eliminate reliance onMorgan Stanley sourced funding while limiting our access to the asset-backed and certificate of deposit markets.Our CFP model incorporates a wide range of potential cash outflows during a liquidity stress event, including,but not limited to: (i) repayment of all debt maturing within one year; (ii) expected funding requirements fromreceivable growth and/or volatility; and (iii) customer cash withdrawals from interest-bearing deposits. If we areunable to continue to securitize our credit card receivables at acceptable pricing levels, or at all, including byreason of the early amortization of any of our securitization transactions, we would seek to liquidate investmentsecurities, increase bank deposits and use alternative funding sources (such as federal funds, bank notes, andunsecured debt) to fund increases in loan receivables and meet our other liquidity needs.
By June 30, 2007, in anticipation of the Distribution, we enhanced our liquidity by increasing the amount ofour liquidity reserve to target $5 billion (with a $5.1 billion balance as of June 30, 2007), increasing committedundrawn securitization conduit facilities to approximately $2.4 billion and negotiating a $2.5 billion unsecuredcommitted credit facility that became effective on July 2, 2007. Through the establishment of these liquiditysources, we expect to manage a CFP that is designed to withstand a Discover stress event characterized bylimited access to the brokered deposit and asset-backed securitization markets.
Throughout the second half of 2007, the ongoing disruptions in the debt and asset-backed capital marketscaused the LIBOR and asset-backed commercial paper rates to rise, credit spreads to widen materially andreduced availability of new issuance in some funding markets. In response to various liquidity events, our seniormanagement increased liquidity targets. As of November 30, 2007, our contingent sources includedapproximately $8.3 billion in our liquidity reserve (primarily invested in Fed Funds sold and bank deposits), $1.9billion of unutilized commitments from third-party commercial paper asset-backed conduits for securitizationfunding, and $2.5 billion of unsecured committed credit. In addition, we had AAA note issuance capacity of$2.75 billion in the Discover Card Execution Note Trust structure.
Our consolidated statement of financial condition at November 30, 2007 consisted primarily of credit cardloan receivables, of which 87% were originated in the U.S. and 13% in the United Kingdom. The balance ofcredit card receivables fluctuates from time to time due to trends in credit card spending and payments, as well asthe issuance of new securitization transactions and maturities of existing securitization transactions. Our creditcard loan receivables provide us with flexibility in financing and managing our business, as the market forfinancing credit card loan receivables is generally large and active.
Equity Capital Management. Our senior management views equity capital as an important source offinancial strength. We determine the level of capital necessary to support our business based on our managedcredit card loan receivables, goodwill and other intangible assets, taking into account, among other things,regulatory requirements, rating agency guidelines and internally managed requirements to sustain growth. At thetime of the Distribution, we targeted approximately $5.5 billion of capital as appropriate to support theDistribution, made a dividend of $350 million in June 2007 to Morgan Stanley, and received an equity infusionfrom Morgan Stanley in the amount of $135 million to further adjust our capital to its appropriate level.
Under regulatory capital requirements adopted by the FDIC and other bank regulatory agencies, FDIC-insured financial institutions must maintain minimum levels of capital that are dependent upon the risk of thefinancial institutions assets, specifically (a) 3% to 5% of Tier 1 capital, as defined, to average assets (“leverageratio”), (b) 4% to 6% of Tier 1 capital, as defined, to risk-weighted assets (“Tier 1 risk-weighted capital ratio”)
36

and (c) 8% to 10% of total capital, as defined, to risk-weighted assets (“total risk-weighted capital ratio”). AtNovember 30, 2007, the leverage ratio, Tier 1 risk-weighted capital ratio and total risk-weighted capital ratio ofDiscover Bank as well as our other FDIC-insured financial institution, Bank of New Castle, exceeded theseregulatory minimums.
Dividend Policy. Although we intend to reinvest a substantial portion of our earnings in our business, weintend to continue to pay a regular quarterly cash dividend on our common stock, subject to the approval of ourBoard of Directors. The declaration and payment of dividends, as well as the amount thereof, are subject to thediscretion of our Board of Directors and will depend upon our results of operations, financial condition, cashrequirements, future prospects and other factors deemed relevant by the Board of Directors. Accordingly, therecan be no assurance that we will declare and pay any dividends. In addition, as a result of applicable bankingregulations and provisions that may be contained in our borrowing agreements or the borrowing agreements ofour subsidiaries, our ability to pay dividends to our stockholders may further be limited.
Stock Repurchase Program. On December 3, 2007, Discover Financial Services announced that its Boardof Directors authorized the repurchase of up to $1 billion of Discover Financial Services’ outstanding stock undera new share repurchase program. This share repurchase program expires on November 30, 2010, and may beterminated at any time.
Special Dividend. On June 19, 2007, we declared a special dividend to Morgan Stanley. Pursuant to thespecial dividend, upon resolution of our outstanding litigation with Visa U.S.A., Inc. and MasterCard Worldwide,after expenses incurred by us in connection with such litigation, we are required to pay Morgan Stanley (1) thefirst $700 million of value of cash or non-cash proceeds (increased at the rate of 6% per annum until paid in full)(the “minimum proceeds”) and (2) 50% of any proceeds in excess of $1.5 billion, subject to certain limitationsand a maximum potential payment to Morgan Stanley of $1.5 billion. All payments by us to Morgan Stanley willbe net of taxes payable by us with respect to such proceeds. If, in connection with or following a change incontrol of our company, the litigation is settled for an amount less than minimum proceeds, we are required topay Morgan Stanley an amount equal to the minimum proceeds. A copy of the special dividend is attached asSchedule 2 to the Separation and Distribution Agreement between Morgan Stanley and us that was filed by us ona Current Report on Form 8-K on July 5, 2007.
Short-Term Borrowings. Short-term borrowings consist of term, overnight Federal Funds purchased andother short-term borrowings with original maturities less than one year.
The following table identifies the balances and weighted average interest rates on short-term borrowingsoutstanding at and for the years ended (dollars in thousands):
November 30, 2007 November 30, 2006 November 30, 2005
MaximumMonth-
End BalanceDuring Year
Year-EndAmount
Year-EndWeightedAverage
Interest Rate
MaximumMonth-
End BalanceDuring Year
Year-EndAmount
Year-EndWeightedAverage
Interest Rate
MaximumMonth
End BalanceDuring Year
Year-EndAmount
Year-EndWeightedAverage
Interest Rate
Domestic:Overnight Federal Funds
purchased . . . . . . . . . . . $3,430,000 $ 250,000 4.68% $3,000,000 $3,000,000 5.31% $ 934,000 $ — —Term Federal Funds
purchased . . . . . . . . . . . $ 540,000 — — $1,769,000 100,000 5.35% $1,865,000 — —Other short-term
borrowings . . . . . . . . . . $2,106,124 — — $4,655,321 1,811,124 5.46% $3,447,064 1,845,910 4.20%International:
Other short-termborrowings . . . . . . . . . . $3,052,739 2,925,426 6.11% $2,186,646 1,828,554 5.25% $1,927,150 1,927,150 4.81%
Total short-termborrowings . . . . . . . . . . $3,175,426 5.99% $6,739,678 5.34% $3,773,060 4.51%
37

On June 20, 2007, we received proceeds of $2.7 billion related to the issuance of debt by unrelated conduitproviders. The transaction was structured as a borrowing secured by the performance of the owned credit cardreceivables of the International Card segment. The financing arrangement, which has a flexible term of up to 364days, facilitated the pay down of short-term and long-term borrowings with Morgan Stanley. As of November 30,2007, the balance of this structured secured borrowing was $2.9 billion.
Deposits. We utilize deposits to diversify funding sources and to reduce our reliance on short-term credit-sensitive funding sources, thus enhancing our liquidity position. We obtain our deposits through variouschannels: direct retail certificates of deposit and money market accounts, retail and institutional brokeragearrangements and money market accounts, under which we receive funds swept through external third-parties.Direct consumer retail deposits are marketed to and received from individual customers, without the use of athird-party intermediary, and are an important, stable funding source that typically reacts more slowly to interestrate changes than other deposits. Brokered deposits are deposits placed to consumers through registered brokers.These deposits typically provide funding with maturities ranging from one month to ten years. Total interest-bearing deposits of $24.6 billion increased $11.4 billion from November 30, 2006. The increase from prioryear-end reflected the replacement of funding sourced from Morgan Stanley to funding sourced by us inanticipation of the Distribution. In addition, the increase in deposits also financed the increase in our liquidityportfolio. At November 30, 2007, the weighted average maturity of all certificates of deposit was approximately22 months.
Prior to the Distribution, Discover Bank received funds from Morgan Stanley sourced money marketaccounts obtained through the Morgan Stanley Global Wealth Management Bank Deposit Program, under whichwe received funds swept directly from certain Morgan Stanley Global Wealth Management clients. We beganparticipating in this program in the second quarter of 2006, accumulating a balance of $3.0 billion by May 31,2007. Morgan Stanley subsequently withdrew all these deposits on June 11, 2007, in anticipation of theDistribution. Beginning in the second quarter of 2007, Discover Bank entered into similar agreements with thirdparties, accumulating balances of $2.9 billion in aggregate at November 30, 2007.
The following table summarizes the remaining maturities of our interest-bearing deposits at November 30,2007 (dollars in thousands):
Total
ThreeMonths or
Less
Over ThreeMonths
ThroughSix Months
Over SixMonths
ThroughTwelveMonths
Over TwelveMonths
Certificates of deposit in amounts lessthan $100,000 . . . . . . . . . . . . . . . . . . . . $19,385,024 $2,532,031 $2,120,911 $4,632,848 $10,099,234
Certificates of deposit in amounts of$100,000 or greater . . . . . . . . . . . . . . . . 775,717 408,572 47,275 130,801 189,069
Savings deposits, including money marketdeposit accounts . . . . . . . . . . . . . . . . . . 4,482,776 4,482,776 — — —
Total interest-bearing deposits . . . . . $24,643,517 $7,423,379 $2,168,186 $4,763,649 $10,288,303
Long-Term Debt and Bank Notes. An additional source of funding is provided by our Global Bank NoteProgram. The program was launched in 2004 by Discover Bank. Bank notes may be issued under this programwith maturities of thirty days or more from the date of issuance. At November 30, 2007 and 2006, we had $250million par value in bank notes outstanding which mature in February 2009.
On June 12, 2007, we received proceeds on the issuance of $800 million par value of unsecured debt toexternal third parties. The financing is comprised of $400 million having a three-year maturity with a floatingcoupon and $400 million with a ten-year maturity with a fixed coupon. The transaction provided additionalliquidity to us to support funding requirements of our subsidiaries.
38

Securitization Financing. We also generate a significant portion of our funding through the securitizationof credit card loan receivables utilizing non-consolidated securitization trusts. Securitized loans against whichbeneficial interests have been issued are accounted for as sold and, accordingly, are removed from theconsolidated and combined statements of financial condition. We have historically securitized betweenapproximately 50% and 60% of our managed credit card loan receivables.
We utilize both the term securitization market as well as the privately placed asset-backed commercial paperconduit financing market. Outstanding term financing and asset-backed commercial paper conduit financing atNovember 30, 2007 were $25.0 billion and $3.2 billion, respectively. At November 30, 2007, we had $1.9 billionin unused asset-backed commercial paper conduit capacity.
The following table summarizes expected maturities of the investors’ interests in securitizations atNovember 30, 2007 (dollars in thousands):
TotalLess ThanOne Year
One YearThrough
Three Years
Four YearsThrough
Five YearsAfter Five
Years
Expected maturities of the investors’interest in securitizations . . . . . . . . . . . . $28,212,725 $8,338,929 $11,069,512 $6,024,511 $2,779,773
We access the term asset securitization market through the Discover Card Master Trust I and, beginningJuly 26, 2007, the Discover Card Execution Note Trust using receivables generated by our U.S. Card business.Through the Discover Card Master Trust I, we have been using a structure utilizing Class A, triple-A ratedcertificates and Class B, single-A rated certificates held by third parties, with credit enhancement provided by thesubordinated Class B certificates and a cash collateral account. The Discover Card Execution Note Trust includesthree classes of securities sold to investors, the most senior class generally receiving a triple-A rating. In thisstructure, in order to issue senior, higher rated, classes of notes, it is necessary to obtain the appropriate amountof credit enhancement, generally through the issuance of junior, lower rated classes of notes.
As of November 30, 2007, cash collateral accounts underlying the securitization transactions of DiscoverCard Master Trust I had a balance of $1.8 billion. Discover Financial Services financed $1.7 billion of cashcollateral accounts (reflected in amounts due from asset securitizations in the consolidated and combinedstatements of financial condition). The rights to repayment of a portion of the cash collateral account loans havebeen sold to a special purpose subsidiary, DRFC Funding LLC, as part of a $1.1 billion secured financing and arenot expected to be available to creditors of Discover Financial Services.
The following table summarizes estimated maturities of the cash collateral accounts at November 30, 2007(dollars in thousands):
TotalLess ThanOne Year
One YearThrough
ThreeYears
FourYears
ThroughFive Years
After FiveYears
Estimated maturities of cash collateral accounts . . . $1,665,734 $561,209 $636,824 $315,956 $151,745
In our International Card segment, we access the term asset-backed securitization market through theCumbernauld Funding plc master trust. Through this trust, we have traditionally utilized a structure havingClass A, triple-A rated notes, with credit enhancement provided by subordination through the overcollateralization of receivables and a cash collateral account.
The securitization structures include certain features designed to protect investors that could result in earlier-than-expected amortization of the transactions, accelerating the need for alternative funding. The primary feature
39

relates to the availability and adequacy of cash flows in the securitized pool of receivables to meet contractualrequirements (“economic early amortization”). In the event of an economic early amortization (which wouldoccur if the excess spread falls below 0% for a contractually specified period, generally a three-month average),the receivables that otherwise would have been subsequently purchased by the trust from us would insteadcontinue to be recognized on our statement of financial condition since the cash flows generated in the trustwould instead be used to repay investors in the asset-backed securities. As of November 30, 2007, no economicearly amortization events have occurred. The table below provides information concerning investor interest andrelated excess spreads at November 30, 2007 (dollars in thousands):
Investor Interest# of Series
Outstanding
3-Month RollingAverage Excess
Spread
Interchange series(1) . . . . . . . . . . . . . . . . . . . . . . . . . . . . . . . . . . . . . $17,043,165 19 8.53%Non-interchange series . . . . . . . . . . . . . . . . . . . . . . . . . . . . . . . . . . . 6,970,508 7 5.16%
Discover Card Master Trust I . . . . . . . . . . . . . . . . . . . . . . . . . . . . . . 24,013,673 26 5.16%Discover Card Execution Note Trust . . . . . . . . . . . . . . . . . . . . . . . . 2,965,000 6 7.82%Cumbernauld Funding plc . . . . . . . . . . . . . . . . . . . . . . . . . . . . . . . . 1,234,052 1 3.81%
Total Company . . . . . . . . . . . . . . . . . . . . . . . . . . . . . . . . . . . . . . . . . $28,212,725 33
(1) Discover Card Master Trust I certificates issued subsequent to and including series 2004-1 include cash flows derived from discount andinterchange revenue earned by Discover Bank.
Secured Committed Credit Facilities. The maintenance of revolving committed credit agreements serves tofurther diversify our funding sources. In connection with our asset securitization program, we have access tocommitted undrawn funding capacity through third-party bank-sponsored securitization conduits to supportcredit card loan receivables funding requirements. At November 30, 2007, these conduits totaled $5.1 billion, ofwhich $1.9 billion was unused. These facilities are 364-day agreements and are reviewed for renewal annually.
Unsecured Committed Credit Facilities. In light of the Distribution, we negotiated a 59-month unsecuredcommitted credit facility of $2.5 billion that will serve to diversify our funding sources and enhance our liquidity.This facility became effective at the time of the Distribution, is provided by a group of major global banks, and isavailable to both Discover Financial Services and Discover Bank. We anticipate that the facility will supportgeneral liquidity needs and may be drawn to meet short-term funding needs from time to time.
Off-Balance Sheet Arrangements
See “—Liquidity and Capital Resources—Securitization Financing.”
Guarantees
Guarantees are contracts or indemnification agreements that contingently require us to make payments to aguaranteed party based on changes in an underlying asset, liability, equity security of a guaranteed party, rate orindex. Our guarantees relate to certain representations and warranties made with regard to securitized loans,transactions processed through the Discover Network and cardmember-related services provided to U.K.cardmembers. Also included in guarantees are contracts that contingently require the guarantor to makepayments to the guaranteed party based on another entity’s failure to perform under an agreement. AtNovember 30, 2007, we had not recorded any contingent liabilities in our consolidated statement of financialcondition related to these transactions. See Note 20: Commitments, Contingencies and Guarantees for furtherdiscussion regarding our guarantees.
40

Contractual Obligations and Contingent Liabilities and Commitments
In the normal course of business, we enter into various contractual obligations that may require future cashpayments. Contractual obligations at November 30, 2007, include long-term borrowings, operating and capitallease obligations. Our future cash payments associated with our contractual obligations as of November 30, 2007are summarized below (dollars in thousands):
Payments Due By Period
TotalLess ThanOne Year
One YearThrough
ThreeYears
Four YearsThrough
Five YearsMore ThanFive Years
Deposits(1) . . . . . . . . . . . . . . . . . . . . . . . . . $24,725,401 $14,151,984 $7,883,949 $1,508,513 $1,180,955Bank notes(2) . . . . . . . . . . . . . . . . . . . . . . . 250,000 — 250,000 — —Secured borrowings(3) . . . . . . . . . . . . . . . . 1,080,063 397,606 376,141 306,316 —Unsecured borrowings(4) . . . . . . . . . . . . . . 800,000 — 400,000 — 400,000Capital lease obligations(5) . . . . . . . . . . . . 4,952 1,306 2,871 775 —Operating leases(5) . . . . . . . . . . . . . . . . . . . 30,786 7,623 13,962 6,787 2,414Interest payments on fixed rate debt . . . . . 245,888 25,800 51,600 51,600 116,888
Total contractual obligations . . . . . . . $27,137,090 $14,584,319 $8,978,523 $1,873,991 $1,700,257
(1) See Note 11: Deposits to the audited consolidated and combined financial statements for further information concerning our deposits.The certificates of deposit accrue interest at fixed rates. All other interest-bearing deposits accrue interest at variable rates.
(2) See Note 13: Long-Term Borrowings to the audited consolidated and combined financial statements for further discussion. Total futurepayment of interest charges is estimated to be $15.3 million as of November 30, 2007, utilizing the current interest rate of 5.03% atNovember 30, 2007.
(3) Interest charges on secured borrowings, of which the full repayment is dependent upon the available balances of the cash collateralaccounts at the maturities of the underlying securitization transactions, are based on a fifty basis point spread over monthly commercialpaper issuance costs. See Note 13: Long-Term Borrowings to the audited consolidated and combined financial statements for furtherdiscussion. Total future payment of interest charges is estimated to be $108.6 million as of November 30, 2007, utilizing the currentinterest rate of 5.67% at November 30, 2007.
(4) See Note 13: Long-Term Borrowings to the audited consolidated and combined financial statements for further discussion. Total futurepayment of interest charges for the floating rate note is estimated to be $63.9 million as of November 30, 2007, utilizing the currentinterest rate of 6.23% at November 30, 2007. Total future payment of interest charges for the fixed rate note is equal to the amountreported included in the table above under Interest payments on fixed rate debt.
(5) See Note 20: Commitments, Contingencies and Guarantees to the audited consolidated and combined financial statements for furtherinformation concerning our capital and operating lease obligations.
At November 30, 2007, we extended credit for consumer and commercial loans of approximately $265billion. Such commitments arise primarily from agreements with customers for unused lines of credit on certaincredit cards, provided there is no violation of conditions established in the related agreement. Thesecommitments, substantially all of which we can terminate at any time and which do not necessarily representfuture cash requirements, are periodically reviewed based on account usage and customer creditworthiness. Inaddition, in the ordinary course of business, we guarantee payment on behalf of subsidiaries relating tocontractual obligations with external parties. The activities of the subsidiaries covered by these guarantees areincluded in our consolidated and combined financial statements.
41

Quantitative and Qualitative Disclosures about Market Risk
Market risk refers to the risk that a change in the level of one or more market prices, rates, indices,correlations or other market factors will result in losses for a position or portfolio. We are exposed to market riskprimarily from changes in interest rates and to a lesser degree, foreign currency exchange rates.
Interest Rate Risk. Changes in interest rates impact interest-earning assets, principally credit card loanreceivables, Federal Funds sold, money market funds and other assets as well as excess spread received inconnection with the securitized loan receivables against which beneficial interests have been issued. Changes ininterest rates also impact interest sensitive liabilities that finance these assets, including asset-backedsecuritizations, long-term borrowings, and deposits.
Our interest rate risk management policies are designed to reduce the potential volatility of earnings thatmay arise from changes in interest rates by having a financing portfolio that reflects the existing repricingschedules of credit card loan receivables as well as our right, with notice to cardmembers, to reprice certain fixedor floating rate credit card loan receivables to a new interest rate in the future. To the extent that asset and relatedfinancing repricing characteristics of a particular portfolio are not matched effectively, we may utilize interestrate derivative contracts, such as swap agreements, to achieve our objectives. Interest rate swap agreementseffectively convert the underlying asset or financing from fixed to floating rate or from floating to fixed rate. SeeNote 22: Fair Value Disclosures to the audited consolidated and combined financial statements for furtherinformation concerning our derivative financial instruments.
We use an interest rate sensitivity simulation to assess our interest rate risk exposure. For purposes ofpresenting the possible earnings effect of a hypothetical, adverse change in interest rates over the 12-monthperiod from our reporting date, we assume that all interest rate sensitive assets and liabilities will be impacted bya hypothetical, immediate 100-basis-point increase in interest rates as of the beginning of the period.
Interest rate sensitive assets are assumed to be those for which the stated interest rate is not contractuallyfixed for the next 12-month period. The Company’s interest rate sensitive assets include Federal Funds sold,certain amounts due from asset securitizations, interest-earning deposits in other banks, certain investmentsecurities and loan receivables. Portions of our credit card loan receivables have fixed interest rates, although wehave the right, with notice to cardmembers, to subsequently reprice these receivables to a new interest rate unlessthe account has been closed or the cardmember opts out. Therefore, we consider a portion of the credit card loanreceivables with a fixed interest rate to be interest rate sensitive. We measured the earnings sensitivity for theseassets from the expected repricing date, which takes into consideration the required notice period. In addition,assets with rates that are fixed at period-end but which will mature, or otherwise contractually reset to a market-based indexed or other fixed rate prior to the end of the 12-month period, are rate sensitive. The latter categoryincludes certain credit card loans that may be offered at below-market rates for an introductory period, such asbalance transfers and special promotional programs, after which the loans will contractually reprice inaccordance with our normal market-based pricing structure. For purposes of measuring rate sensitivity for suchloans, only the effect of the hypothetical 100-basis-point change in the underlying market-based indexed or otherfixed rate has been considered rather than the full change in the rate to which the loan would contractuallyreprice. For assets that have a fixed interest rate at the fiscal period-end but which contractually will, or areassumed to, reset to a market-based indexed or other fixed rate during the next 12 months, earnings sensitivity ismeasured from the expected repricing date. In addition, for all interest rate sensitive assets, earnings sensitivity iscalculated net of expected loan losses.
Interest rate sensitive liabilities are assumed to be those for which the stated interest rate is not contractuallyfixed for the next 12-month period. Thus, liabilities that vary with changes in a market-based index, such asFederal Funds or LIBOR, which will reset before the end of the 12-month period, or liabilities whose rates arefixed at the fiscal period end but which will mature and are assumed to be replaced with a market-based indexedrate prior to the end of the 12-month period, are rate sensitive. For these fixed rate liabilities, earnings sensitivityis measured from the expected repricing date.
42

Assuming an immediate 100-basis-point increase in the interest rates affecting all interest rate sensitiveassets and liabilities as of November 30, 2007, we estimate that the pretax income of lending and relatedactivities over the following 12-month period would be reduced by approximately $113 million. We estimate thecomparable reduction of pretax income for the 12-month period following November 30, 2006 to beapproximately $125 million. The hypothetical decline in pretax income was lower than the prior year due to ahigher level of other interest-earning assets related to the liquidity reserve partially offset by a higher level ofvariable rate funding at November 30, 2007.
The model assumes that the balances of interest rate sensitive assets and liabilities at the fiscal period endwill remain constant over the next 12-month period. It does not assume any growth, strategic change in businessfocus, change in asset pricing philosophy or change in asset/liability funding mix. Thus, this model represents astatic analysis that cannot adequately portray how we would respond to significant changes in market conditionssuch as those recently experienced. Furthermore, the analysis does not necessarily reflect our expectationsregarding the movement of interest rates in the near term, including the likelihood of an immediate 100-basis-point change in market interest rates, nor necessarily the actual effect on earnings if such rate changes were tooccur.
Foreign Currency Exchange Risk. Changes in foreign exchange rates relative to the U.S. dollar may impactearnings and capital translated from international operations. Our U.K. business generates credit card loanreceivables denominated in pounds sterling which is primarily funded by the issuance of debt by unrelatedconduit providers and intercompany lending. We have hedged foreign exchange exposure related tointercompany lending with our International Card segment through the use of forward contracts. We monitor andmanage our exposure to reflect the risk tolerance established by our senior management. We expect to continueto monitor foreign exchange exposure created as a result of our net investment in international operations and tomanage these risks within our risk management guidelines.
43
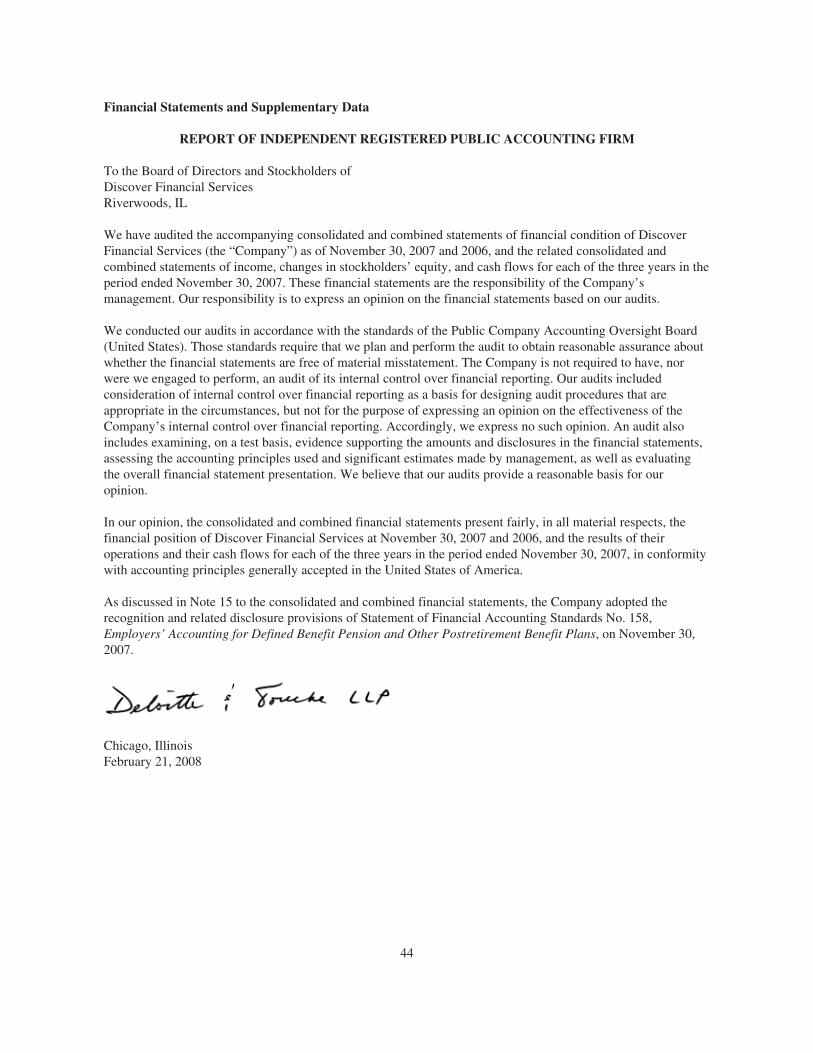
Financial Statements and Supplementary Data
REPORT OF INDEPENDENT REGISTERED PUBLIC ACCOUNTING FIRM
To the Board of Directors and Stockholders ofDiscover Financial ServicesRiverwoods, IL
We have audited the accompanying consolidated and combined statements of financial condition of DiscoverFinancial Services (the “Company”) as of November 30, 2007 and 2006, and the related consolidated andcombined statements of income, changes in stockholders’ equity, and cash flows for each of the three years in theperiod ended November 30, 2007. These financial statements are the responsibility of the Company’smanagement. Our responsibility is to express an opinion on the financial statements based on our audits.
We conducted our audits in accordance with the standards of the Public Company Accounting Oversight Board(United States). Those standards require that we plan and perform the audit to obtain reasonable assurance aboutwhether the financial statements are free of material misstatement. The Company is not required to have, norwere we engaged to perform, an audit of its internal control over financial reporting. Our audits includedconsideration of internal control over financial reporting as a basis for designing audit procedures that areappropriate in the circumstances, but not for the purpose of expressing an opinion on the effectiveness of theCompany’s internal control over financial reporting. Accordingly, we express no such opinion. An audit alsoincludes examining, on a test basis, evidence supporting the amounts and disclosures in the financial statements,assessing the accounting principles used and significant estimates made by management, as well as evaluatingthe overall financial statement presentation. We believe that our audits provide a reasonable basis for ouropinion.
In our opinion, the consolidated and combined financial statements present fairly, in all material respects, thefinancial position of Discover Financial Services at November 30, 2007 and 2006, and the results of theiroperations and their cash flows for each of the three years in the period ended November 30, 2007, in conformitywith accounting principles generally accepted in the United States of America.
As discussed in Note 15 to the consolidated and combined financial statements, the Company adopted therecognition and related disclosure provisions of Statement of Financial Accounting Standards No. 158,Employers’ Accounting for Defined Benefit Pension and Other Postretirement Benefit Plans, on November 30,2007.
Chicago, IllinoisFebruary 21, 2008
44

Discover Financial ServicesConsolidated and Combined Statements of Financial Condition
November 30,2007
November 30,2006
(dollars in thousands,except per share amounts)
AssetsCash and due from banks . . . . . . . . . . . . . . . . . . . . . . . . . . . . . . . . . . . . . . . . . . . . . . . . . . . . . . . . . . . . . . . . $ 369,965 $ 334,035Federal Funds sold . . . . . . . . . . . . . . . . . . . . . . . . . . . . . . . . . . . . . . . . . . . . . . . . . . . . . . . . . . . . . . . . . . . . . . 6,270,600 525,000Interest-earning deposits in other banks . . . . . . . . . . . . . . . . . . . . . . . . . . . . . . . . . . . . . . . . . . . . . . . . . . . . . 2,135,339 —Commercial paper . . . . . . . . . . . . . . . . . . . . . . . . . . . . . . . . . . . . . . . . . . . . . . . . . . . . . . . . . . . . . . . . . . . . . . 11,191 15,322
Cash and cash equivalents . . . . . . . . . . . . . . . . . . . . . . . . . . . . . . . . . . . . . . . . . . . . . . . . . . . . . . . . . . . . 8,787,095 874,357Investment securities:
Available-for-sale (amortized cost of $425,681 and $2,000 at November 30, 2007 and 2006,respectively) . . . . . . . . . . . . . . . . . . . . . . . . . . . . . . . . . . . . . . . . . . . . . . . . . . . . . . . . . . . . . . . . . . . . 420,837 2,314
Held-to-maturity (market value $100,769 and $82,241 at November 30, 2007 and 2006,respectively) . . . . . . . . . . . . . . . . . . . . . . . . . . . . . . . . . . . . . . . . . . . . . . . . . . . . . . . . . . . . . . . . . . . . 104,602 82,097
Loan receivables:Loans held for sale . . . . . . . . . . . . . . . . . . . . . . . . . . . . . . . . . . . . . . . . . . . . . . . . . . . . . . . . . . . . . . . . . — 1,056,380Loan portfolio:
Credit card . . . . . . . . . . . . . . . . . . . . . . . . . . . . . . . . . . . . . . . . . . . . . . . . . . . . . . . . . . . . . . . . . . . . 23,468,965 22,535,181Commercial loans . . . . . . . . . . . . . . . . . . . . . . . . . . . . . . . . . . . . . . . . . . . . . . . . . . . . . . . . . . . . . . 234,136 59,089Other consumer loans . . . . . . . . . . . . . . . . . . . . . . . . . . . . . . . . . . . . . . . . . . . . . . . . . . . . . . . . . . . 251,194 92,100
Total loan portfolio . . . . . . . . . . . . . . . . . . . . . . . . . . . . . . . . . . . . . . . . . . . . . . . . . . . . . . . . . 23,954,295 22,686,370
Total loan receivables . . . . . . . . . . . . . . . . . . . . . . . . . . . . . . . . . . . . . . . . . . . . . . . . . . . . . . . 23,954,295 23,742,750Allowance for loan losses . . . . . . . . . . . . . . . . . . . . . . . . . . . . . . . . . . . . . . . . . . . . . . . . . . . . . . . . . . . . (916,844) (832,483)
Net loan receivables . . . . . . . . . . . . . . . . . . . . . . . . . . . . . . . . . . . . . . . . . . . . . . . . . . . . . . . . . . . . 23,037,451 22,910,267Accrued interest receivable . . . . . . . . . . . . . . . . . . . . . . . . . . . . . . . . . . . . . . . . . . . . . . . . . . . . . . . . . . . . . . . 139,414 123,855Amounts due from asset securitization . . . . . . . . . . . . . . . . . . . . . . . . . . . . . . . . . . . . . . . . . . . . . . . . . . . . . . 3,093,472 3,169,895Premises and equipment, net . . . . . . . . . . . . . . . . . . . . . . . . . . . . . . . . . . . . . . . . . . . . . . . . . . . . . . . . . . . . . . 658,492 660,900Goodwill . . . . . . . . . . . . . . . . . . . . . . . . . . . . . . . . . . . . . . . . . . . . . . . . . . . . . . . . . . . . . . . . . . . . . . . . . . . . . 255,421 533,728Intangible assets, net . . . . . . . . . . . . . . . . . . . . . . . . . . . . . . . . . . . . . . . . . . . . . . . . . . . . . . . . . . . . . . . . . . . . 98,043 201,177Other assets . . . . . . . . . . . . . . . . . . . . . . . . . . . . . . . . . . . . . . . . . . . . . . . . . . . . . . . . . . . . . . . . . . . . . . . . . . . 781,278 508,652
Total assets . . . . . . . . . . . . . . . . . . . . . . . . . . . . . . . . . . . . . . . . . . . . . . . . . . . . . . . . . . . . . . . $37,376,105 $29,067,242
Liabilities and Stockholders’ EquityDeposits:
Interest-bearing deposit accounts . . . . . . . . . . . . . . . . . . . . . . . . . . . . . . . . . . . . . . . . . . . . . . . . . . . . . . $24,643,517 $13,238,827Non-interest bearing deposit accounts . . . . . . . . . . . . . . . . . . . . . . . . . . . . . . . . . . . . . . . . . . . . . . . . . . . 81,884 105,032
Total deposits . . . . . . . . . . . . . . . . . . . . . . . . . . . . . . . . . . . . . . . . . . . . . . . . . . . . . . . . . . . . . 24,725,401 13,343,859Short-term borrowings . . . . . . . . . . . . . . . . . . . . . . . . . . . . . . . . . . . . . . . . . . . . . . . . . . . . . . . . . . . . . . . . . . 3,175,426 6,739,678Long-term borrowings . . . . . . . . . . . . . . . . . . . . . . . . . . . . . . . . . . . . . . . . . . . . . . . . . . . . . . . . . . . . . . . . . . . 2,134,093 1,507,578Accrued interest payable . . . . . . . . . . . . . . . . . . . . . . . . . . . . . . . . . . . . . . . . . . . . . . . . . . . . . . . . . . . . . . . . . 264,938 135,464Accrued expenses and other liabilities . . . . . . . . . . . . . . . . . . . . . . . . . . . . . . . . . . . . . . . . . . . . . . . . . . . . . . 1,476,825 1,565,891
Total liabilities . . . . . . . . . . . . . . . . . . . . . . . . . . . . . . . . . . . . . . . . . . . . . . . . . . . . . . . . . . . . . 31,776,683 23,292,470Commitments, contingencies and guarantees (Note 20)Stockholders’ Equity:Preferred stock, $.01 par value per share; authorized 200,000,000 shares, none issued or outstanding . . . . . — —Common stock ($.01 par value at November 30, 2007 and $100 at November 30, 2006;
Shares authorized: 2,000,000,000 at November 30, 2007 and 50,000 at November 30, 2006;Shares issued: 477,762,018 at November 30, 2007 and 1,000 at November 30, 2006) . . . . . . . . . . . . . . . 4,777 100
Additional paid-in capital . . . . . . . . . . . . . . . . . . . . . . . . . . . . . . . . . . . . . . . . . . . . . . . . . . . . . . . . . . . . . . . . 2,846,127 2,636,265Retained earnings . . . . . . . . . . . . . . . . . . . . . . . . . . . . . . . . . . . . . . . . . . . . . . . . . . . . . . . . . . . . . . . . . . . . . . 2,717,905 3,008,421Accumulated other comprehensive income . . . . . . . . . . . . . . . . . . . . . . . . . . . . . . . . . . . . . . . . . . . . . . . . . . . 32,032 129,986Treasury stock, at cost; 73,795 shares as of November 30, 2007 . . . . . . . . . . . . . . . . . . . . . . . . . . . . . . . . . . (1,419) —
Total stockholders’ equity . . . . . . . . . . . . . . . . . . . . . . . . . . . . . . . . . . . . . . . . . . . . . . . . . . . . 5,599,422 5,774,772
Total liabilities and stockholders’ equity . . . . . . . . . . . . . . . . . . . . . . . . . . . . . . . . . . . . . . . . $37,376,105 $29,067,242
See Notes to Consolidated and Combined Financial Statements.
45
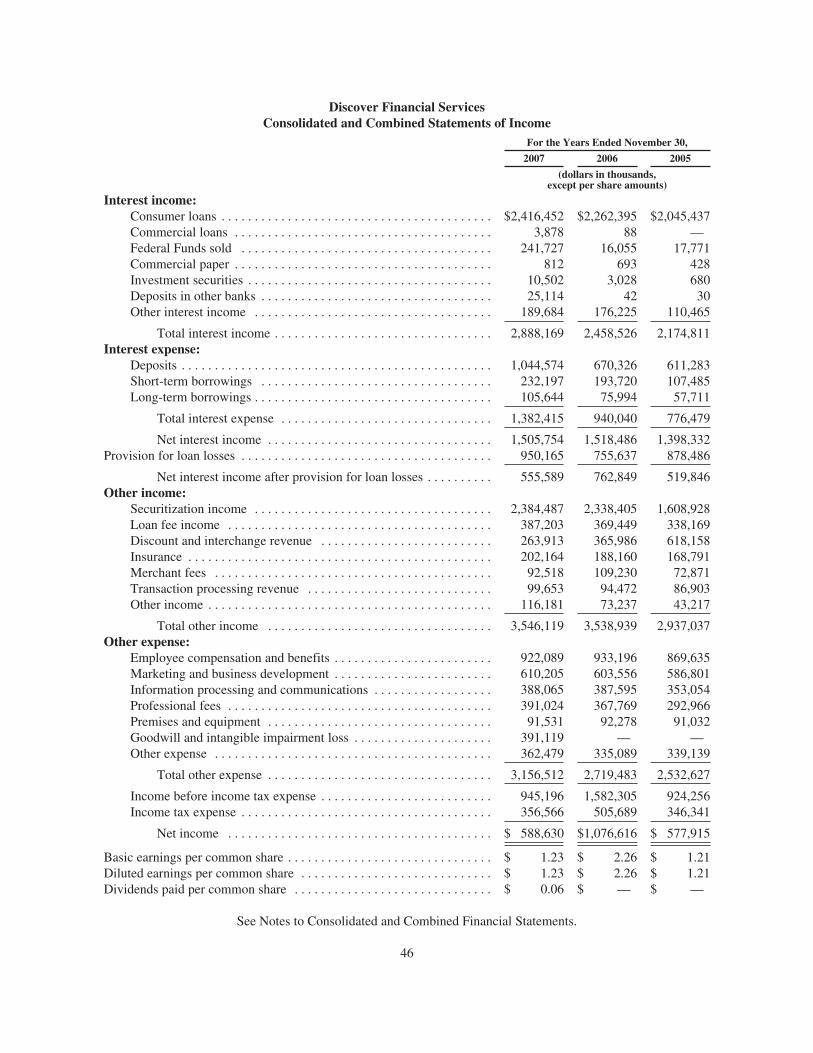
Discover Financial ServicesConsolidated and Combined Statements of Income
For the Years Ended November 30,
2007 2006 2005
(dollars in thousands,except per share amounts)
Interest income:Consumer loans . . . . . . . . . . . . . . . . . . . . . . . . . . . . . . . . . . . . . . . . . $2,416,452 $2,262,395 $2,045,437Commercial loans . . . . . . . . . . . . . . . . . . . . . . . . . . . . . . . . . . . . . . . 3,878 88 —Federal Funds sold . . . . . . . . . . . . . . . . . . . . . . . . . . . . . . . . . . . . . . 241,727 16,055 17,771Commercial paper . . . . . . . . . . . . . . . . . . . . . . . . . . . . . . . . . . . . . . . 812 693 428Investment securities . . . . . . . . . . . . . . . . . . . . . . . . . . . . . . . . . . . . . 10,502 3,028 680Deposits in other banks . . . . . . . . . . . . . . . . . . . . . . . . . . . . . . . . . . . 25,114 42 30Other interest income . . . . . . . . . . . . . . . . . . . . . . . . . . . . . . . . . . . . 189,684 176,225 110,465
Total interest income . . . . . . . . . . . . . . . . . . . . . . . . . . . . . . . . . 2,888,169 2,458,526 2,174,811Interest expense:
Deposits . . . . . . . . . . . . . . . . . . . . . . . . . . . . . . . . . . . . . . . . . . . . . . . 1,044,574 670,326 611,283Short-term borrowings . . . . . . . . . . . . . . . . . . . . . . . . . . . . . . . . . . . 232,197 193,720 107,485Long-term borrowings . . . . . . . . . . . . . . . . . . . . . . . . . . . . . . . . . . . . 105,644 75,994 57,711
Total interest expense . . . . . . . . . . . . . . . . . . . . . . . . . . . . . . . . 1,382,415 940,040 776,479
Net interest income . . . . . . . . . . . . . . . . . . . . . . . . . . . . . . . . . . 1,505,754 1,518,486 1,398,332Provision for loan losses . . . . . . . . . . . . . . . . . . . . . . . . . . . . . . . . . . . . . . 950,165 755,637 878,486
Net interest income after provision for loan losses . . . . . . . . . . 555,589 762,849 519,846Other income:
Securitization income . . . . . . . . . . . . . . . . . . . . . . . . . . . . . . . . . . . . 2,384,487 2,338,405 1,608,928Loan fee income . . . . . . . . . . . . . . . . . . . . . . . . . . . . . . . . . . . . . . . . 387,203 369,449 338,169Discount and interchange revenue . . . . . . . . . . . . . . . . . . . . . . . . . . 263,913 365,986 618,158Insurance . . . . . . . . . . . . . . . . . . . . . . . . . . . . . . . . . . . . . . . . . . . . . . 202,164 188,160 168,791Merchant fees . . . . . . . . . . . . . . . . . . . . . . . . . . . . . . . . . . . . . . . . . . 92,518 109,230 72,871Transaction processing revenue . . . . . . . . . . . . . . . . . . . . . . . . . . . . 99,653 94,472 86,903Other income . . . . . . . . . . . . . . . . . . . . . . . . . . . . . . . . . . . . . . . . . . . 116,181 73,237 43,217
Total other income . . . . . . . . . . . . . . . . . . . . . . . . . . . . . . . . . . 3,546,119 3,538,939 2,937,037Other expense:
Employee compensation and benefits . . . . . . . . . . . . . . . . . . . . . . . . 922,089 933,196 869,635Marketing and business development . . . . . . . . . . . . . . . . . . . . . . . . 610,205 603,556 586,801Information processing and communications . . . . . . . . . . . . . . . . . . 388,065 387,595 353,054Professional fees . . . . . . . . . . . . . . . . . . . . . . . . . . . . . . . . . . . . . . . . 391,024 367,769 292,966Premises and equipment . . . . . . . . . . . . . . . . . . . . . . . . . . . . . . . . . . 91,531 92,278 91,032Goodwill and intangible impairment loss . . . . . . . . . . . . . . . . . . . . . 391,119 — —Other expense . . . . . . . . . . . . . . . . . . . . . . . . . . . . . . . . . . . . . . . . . . 362,479 335,089 339,139
Total other expense . . . . . . . . . . . . . . . . . . . . . . . . . . . . . . . . . . 3,156,512 2,719,483 2,532,627
Income before income tax expense . . . . . . . . . . . . . . . . . . . . . . . . . . 945,196 1,582,305 924,256Income tax expense . . . . . . . . . . . . . . . . . . . . . . . . . . . . . . . . . . . . . . 356,566 505,689 346,341
Net income . . . . . . . . . . . . . . . . . . . . . . . . . . . . . . . . . . . . . . . . $ 588,630 $1,076,616 $ 577,915
Basic earnings per common share . . . . . . . . . . . . . . . . . . . . . . . . . . . . . . . $ 1.23 $ 2.26 $ 1.21Diluted earnings per common share . . . . . . . . . . . . . . . . . . . . . . . . . . . . . $ 1.23 $ 2.26 $ 1.21Dividends paid per common share . . . . . . . . . . . . . . . . . . . . . . . . . . . . . . $ 0.06 $ — $ —
See Notes to Consolidated and Combined Financial Statements.
46

Discover Financial ServicesConsolidated and Combined Statements of Changes in Stockholders’ Equity
Common Stock AdditionalPaid-in Capital
RetainedEarnings
AccumulatedOther
ComprehensiveIncome
TreasuryStock
TotalStockholders’
EquityShares Amount
(dollars and shares in thousands)Balance at November 30, 2004 . . . . . . . 1 $ 100 $2,078,005 $1,853,890 $ 89,354 — $4,021,349Comprehensive income:
Net Income . . . . . . . . . . . . . . . . . . . . . — — — 577,915 — — 577,915Foreign currency translation
(accumulated amount of $45,229 atNovember 30, 2005) . . . . . . . . . . . . — — — — (43,743) —
Net unrealized losses on investmentsecurities . . . . . . . . . . . . . . . . . . . . . — — — — (154) —
Other . . . . . . . . . . . . . . . . . . . . . . . . . . — — — — (237) —
Other comprehensive loss . . . . . . . . — — — — (44,134) — (44,134)
Comprehensive income . . . . . . . . . — — — — — — 533,781Capital contribution from Morgan
Stanley . . . . . . . . . . . . . . . . . . . . . . . . — — 42,133 — — — 42,133Other . . . . . . . . . . . . . . . . . . . . . . . . . . . . — — 3,186 — — — 3,186
Balance at November 30, 2005 . . . . . . . 1 $ 100 $2,123,324 $2,431,805 $ 45,220 $ — $4,600,449Comprehensive income:
Net income . . . . . . . . . . . . . . . . . . . . . — — — 1,076,616 — — 1,076,616Foreign currency translation
(accumulated amount of $129,984at November 30, 2006) . . . . . . . . . . — — — — 84,755 —
Net unrealized losses on investmentsecurities . . . . . . . . . . . . . . . . . . . . . — — — — (25) —
Other . . . . . . . . . . . . . . . . . . . . . . . . . . — — — — 36 —
Other comprehensive income . . . . . — — — — 84,766 — 84,766
Comprehensive income . . . . . . . . . — — — — — — 1,161,382Capital contribution from Morgan
Stanley . . . . . . . . . . . . . . . . . . . . . . . . — — 512,941 — — — 512,941Cash dividends paid to Morgan
Stanley . . . . . . . . . . . . . . . . . . . . . . . . — — — (500,000) — — (500,000)
Balance at November 30, 2006 . . . . . . . 1 $ 100 $2,636,265 $3,008,421 $129,986 $ — $5,774,772Comprehensive income:
Net income . . . . . . . . . . . . . . . . . . . . . — — — 588,630 — — 588,630Foreign currency translation
(accumulated amount of $48,358 atNovember 30, 2007) . . . . . . . . . . . . — — — — (81,626) —
Net unrealized losses on investmentsecurities . . . . . . . . . . . . . . . . . . . . . — — — — (3,264) —
Other . . . . . . . . . . . . . . . . . . . . . . . . . . — — — — 69 —
Other comprehensive loss . . . . . . . . — — — — (84,821) — (84,821)
Comprehensive income . . . . . . . . . — — — — — — 503,809Adoption of FASB Statement No. 158,
net of tax . . . . . . . . . . . . . . . . . . . . . . . — — — — (13,133) — (13,133)Consummation of spin-off transaction
on June 30, 2007, and distribution ofDiscover Financial Services commonstock by Morgan Stanley . . . . . . . . . . 526,233 5,162 (5,162) — — — —
Purchases of Treasury Stock . . . . . . . . . — — — — — (1,419) (1,419)Common stock issued and stock-based
compensation expense . . . . . . . . . . . . 527 5 35,705 — — — 35,710Capital contribution from Morgan
Stanley . . . . . . . . . . . . . . . . . . . . . . . . — — 178,829 — — — 178,829Cash dividends paid to Morgan
Stanley . . . . . . . . . . . . . . . . . . . . . . . . — — — (850,000) — — (850,000)Dividends . . . . . . . . . . . . . . . . . . . . . . . . — — — (29,146) — — (29,146)Other . . . . . . . . . . . . . . . . . . . . . . . . . . . . (48,999) (490) 490 — — — —
Balance at November 30, 2007 . . . . . . . 477,762 $4,777 $2,846,127 $2,717,905 $ 32,032 $(1,419) $5,599,422
See Notes to Consolidated and Combined Financial Statements.
47

Discover Financial ServicesConsolidated and Combined Statements of Cash Flows
For the Years Ended November 30,
2007 2006 2005
(dollars in thousands)Cash flows from operating activities
Net income . . . . . . . . . . . . . . . . . . . . . . . . . . . . . . . . . . . . . . . . . . . . . . . . . . . . . . . . . . . . . . $ 588,630 $ 1,076,616 $ 577,915Adjustments to reconcile net income to net cash provided by operating activities:
Gains on sales of mortgages and installment loans . . . . . . . . . . . . . . . . . . . . . . . . . . . . (3,105) (7,399) (6,195)Net principal disbursed on loans originated for sale . . . . . . . . . . . . . . . . . . . . . . . . . . . (99,158) (207,659) (115,901)Loss on investments . . . . . . . . . . . . . . . . . . . . . . . . . . . . . . . . . . . . . . . . . . . . . . . . . . . 11,404 — —Proceeds from sales of loans originated for sale . . . . . . . . . . . . . . . . . . . . . . . . . . . . . . 106,010 213,545 124,739Stock-based compensation expense . . . . . . . . . . . . . . . . . . . . . . . . . . . . . . . . . . . . . . . 35,710 — —Deferred income taxes . . . . . . . . . . . . . . . . . . . . . . . . . . . . . . . . . . . . . . . . . . . . . . . . . . (218,215) 76,285 (43,608)Depreciation and amortization on premises and equipment . . . . . . . . . . . . . . . . . . . . . 122,934 113,169 112,856Impairment of goodwill and intangible assets . . . . . . . . . . . . . . . . . . . . . . . . . . . . . . . . 391,119 — —Other depreciation and amortization . . . . . . . . . . . . . . . . . . . . . . . . . . . . . . . . . . . . . . . 134,197 109,629 101,455Provision for loan losses . . . . . . . . . . . . . . . . . . . . . . . . . . . . . . . . . . . . . . . . . . . . . . . . 950,165 755,637 878,486Amortization of deferred revenues . . . . . . . . . . . . . . . . . . . . . . . . . . . . . . . . . . . . . . . . (22,484) (26,150) (28,998)Changes in assets and liabilities:
(Increase) decrease in amounts due from asset securitization . . . . . . . . . . . . . . . . 79,124 (377,273) 91,106(Increase) decrease in other assets . . . . . . . . . . . . . . . . . . . . . . . . . . . . . . . . . . . . . (129,261) (52,542) (33,882)Increase (decrease) in accrued expenses and other liabilities . . . . . . . . . . . . . . . . 90,955 46,929 (21,899)
Net cash provided by operating activities . . . . . . . . . . . . . . . . . . . . . . . . . . . . . . . . . . . . . . . . . . . 2,038,025 1,720,787 1,636,074Cash flows from investing activities
Net proceeds from (payments for):Business and other acquisitions . . . . . . . . . . . . . . . . . . . . . . . . . . . . . . . . . . . . . . . . . . . (5,000) (1,924,491) (323,426)Maturities of investment securities . . . . . . . . . . . . . . . . . . . . . . . . . . . . . . . . . . . . . . . . 10,556 6,952 5,422Purchases of investment securities . . . . . . . . . . . . . . . . . . . . . . . . . . . . . . . . . . . . . . . . (153,075) (73,055) (10,529)Proceeds from securitization and sale of loans held for investment . . . . . . . . . . . . . . . 8,434,488 8,949,961 7,324,055Net principal disbursed on loans held for investment . . . . . . . . . . . . . . . . . . . . . . . . . . (9,763,849) (8,839,046) (11,207,376)Purchases of premises and equipment . . . . . . . . . . . . . . . . . . . . . . . . . . . . . . . . . . . . . . (118,265) (144,151) (97,963)
Net cash used for investing activities . . . . . . . . . . . . . . . . . . . . . . . . . . . . . . . . . . . . . . . . . . . . . . (1,595,145) (2,023,830) (4,309,817)Cash flows from financing activities
Net (decrease) increase in short-term borrowings . . . . . . . . . . . . . . . . . . . . . . . . . . . . . (3,895,600) 3,258,908 (380,173)Proceeds from issuance of long-term debt and bank notes . . . . . . . . . . . . . . . . . . . . . . 2,102,951 638,691 —Repayment of long-term debt and bank notes . . . . . . . . . . . . . . . . . . . . . . . . . . . . . . . . (1,486,271) (45,621) (321,242)Purchases of treasury stock . . . . . . . . . . . . . . . . . . . . . . . . . . . . . . . . . . . . . . . . . . . . . . (1,419) — —Net increase (decrease) in deposits . . . . . . . . . . . . . . . . . . . . . . . . . . . . . . . . . . . . . . . . 11,345,340 (2,730,723) 3,127,611Capital contributions from Morgan Stanley . . . . . . . . . . . . . . . . . . . . . . . . . . . . . . . . . 273,138 — —Dividends paid to Morgan Stanley . . . . . . . . . . . . . . . . . . . . . . . . . . . . . . . . . . . . . . . . (850,000) (500,000) —Dividends paid . . . . . . . . . . . . . . . . . . . . . . . . . . . . . . . . . . . . . . . . . . . . . . . . . . . . . . . . (29,146) — —
Net cash provided by financing activities . . . . . . . . . . . . . . . . . . . . . . . . . . . . . . . . . . . . . . . . . . . 7,458,993 621,255 2,426,196Effect of exchange rate changes on cash and cash equivalents . . . . . . . . . . . . . . . . . . . . . . . . . . . 10,865 663 (1,583)
Net increase (decrease) in cash and cash equivalents . . . . . . . . . . . . . . . . . . . . . . . . . . . . . . . . . . 7,912,738 318,875 (249,130)Cash and cash equivalents, at beginning of period . . . . . . . . . . . . . . . . . . . . . . . . . . . . . . . . . . . . 874,357 555,482 804,612
Cash and cash equivalents, at end of period . . . . . . . . . . . . . . . . . . . . . . . . . . . . . . . . . . . . . . . . . $ 8,787,095 $ 874,357 $ 555,482
SUPPLEMENTAL DISCLOSURES OF CASH FLOW INFORMATION:Cash paid during the year for:
Interest expense . . . . . . . . . . . . . . . . . . . . . . . . . . . . . . . . . . . . . . . . . . . . . . . . . . . . . . . . . . . $ 1,233,366 $ 992,575 $ 710,748
Income taxes, net of income tax refunds . . . . . . . . . . . . . . . . . . . . . . . . . . . . . . . . . . . . . . . . $ 531,253 $ 519,717 $ 437,158
Non-cash transactions:Capital contributions (to) from Morgan Stanley . . . . . . . . . . . . . . . . . . . . . . . . . . . . . . . . . . $ (94,309) $ 512,941 $ 42,133
Exchange of retained seller’s interest for certificated beneficial interests in DCENT . . . . . $ 315,000 $ — $ —
See Notes to Consolidated and Combined Financial Statements.
48

Notes to Consolidated and Combined Financial Statements
1. Description of Business, Formation of the Company and Basis of Presentation
Description of Business. Discover Financial Services (“DFS” or the “Company”) is a leading credit cardissuer and electronic payment services company. The Company’s business segments include U.S. Card, Third-Party Payments and International Card. The U.S. Card segment includes Discover Card-branded credit cardsissued over Discover’s signature card network (the “Discover Network”) and other consumer lending and depositproducts offered through the Company’s Discover Bank subsidiary. The Third-Party Payments segment includesPULSE EFT Association (the “PULSE Network” or “PULSE”), an automated teller machine, debit andelectronic funds transfer network and the Company’s third-party payments business. The International Cardsegment includes credit cards and consumer lending products and services in the United Kingdom through theCompany’s Goldfish Bank subsidiary. See Note 23: Segment Disclosures for additional information about theCompany’s operating segments.
Distribution. On December 19, 2006, Morgan Stanley, a global financial services firm, announced that itsBoard of Directors had authorized the distribution of its Discover segment to the holders of Morgan Stanleycommon stock. On June 30, 2007, we were spun-off from our former parent company, Morgan Stanley, throughthe distribution of our shares to its shareholders (the “Distribution”). Prior to the Distribution, the Discoversegment comprised Discover Financial Services, a wholly-owned subsidiary of Morgan Stanley, as well ascertain other subsidiaries and assets related to credit card operations in the United Kingdom contributed to theDiscover segment by Morgan Stanley. DFS is a Delaware corporation whose subsidiaries include DFS ServicesLLC (formerly Discover Financial Services LLC), a Delaware limited liability company headquartered inRiverwoods, Illinois, two Delaware state-chartered banks, Discover Bank and Bank of New Castle, both of whichare regulated by the Federal Deposit Insurance Corporation (“FDIC”) and the Office of the Delaware State BankCommissioner (the “Delaware Commissioner”), and Goldfish Bank Limited, a U.K. entity and direct subsidiaryof Discover Bank that is authorized and regulated in the United Kingdom by the Financial Services Authority(“FSA”). Prior to the date of the Distribution, a total of 50,000 shares of common stock of DFS were authorizedwith par value of $100 per share, and 1,000 shares were issued and outstanding. On the date of the Distribution,the Company increased the number of authorized shares to 2,200,000,000, consisting of 2,000,000,000 shares ofcommon stock and 200,000,000 shares of preferred stock.
Basis of Presentation. The accompanying consolidated and combined financial statements have beenprepared in accordance with accounting principles generally accepted in the United States (“GAAP”). Thepreparation of financial statements in conformity with GAAP requires the Company to make estimates andassumptions that affect the amounts reported in the consolidated and combined financial statements and relateddisclosures. These estimates are based on information available as of the date of the consolidated and combinedfinancial statements. The Company believes that the estimates used in the preparation of the consolidated andcombined financial statements are reasonable. Actual results could differ from those estimates.
The financial statements presented in this annual report for periods on or after the Distribution are presentedon a consolidated basis and include the results of operations, financial condition and cash flows of the Companyand its wholly-owned subsidiaries. The financial statements for the periods prior to the Distribution are presentedon a combined basis and reflect the historical combined results of operations, financial condition and cash flowsof the Morgan Stanley subsidiaries that comprised its Discover segment (as described in the preceding section)for the periods presented. The combined statements of income for periods prior to the Distribution reflectintercompany expense allocations made to the Discover segment by Morgan Stanley for certain corporatefunctions such as treasury, financial control, human resources, internal audit, legal, investor relations and variousother functions historically provided by Morgan Stanley. Where possible, these allocations were made on aspecific identification basis. Otherwise, such expenses were allocated by Morgan Stanley based on relativepercentages of headcount or some other basis depending on the nature of the cost that was allocated. Thesehistorical cost allocations may not be indicative of costs the Company will incur to obtain these same services as
49

an independent entity. See Note 26: Related Party Transactions for further information on expenses allocated byMorgan Stanley. Prior to the Distribution, the Company entered into certain transitional services agreements withMorgan Stanley and its subsidiaries to obtain certain corporate services for a period generally not expected toexceed eighteen months at prices negotiated between the two companies. As a stand-alone entity, the Companyexpects to incur expenses that may not be comparable in future periods to what is reported for the historicalperiods presented in this annual report.
The historical financial results in the combined financial statements presented for periods prior to theDistribution may not be indicative of the results that would have been achieved had the Company operated as aseparate, stand-alone entity during those periods. The combined financial statements presented for those periodsdo not reflect any changes that may occur in the financing and operations of the Company as a result of theDistribution. The Company has a capital structure different from the capital structure in the combined financialstatements and accordingly, interest expense is not necessarily indicative of the interest expense the Companywould have incurred as a separate, independent company. However, management believes that the combinedfinancial statements presented for periods prior to the Distribution include all adjustments necessary for a fairpresentation of the business. All intercompany balances and transactions of the Company have been eliminated.
Principles of Consolidation. The consolidated and combined financial statements include the accounts of theCompany and its wholly-owned subsidiaries. The Company’s policy is to consolidate all entities in which it ownsmore than 50% of the outstanding voting stock unless it does not control the entity. However, the Company didnot have a controlling financial interest in any entity other than its wholly-owned subsidiaries in the periodspresented in the accompanying consolidated and combined financial statements. It is also the Company’s policyto consolidate any variable interest entity for which the Company is the primary beneficiary, as required byFinancial Accounting Standards Board (“FASB”) Interpretation No. 46R, Consolidation of Variable InterestEntities (revised December 2003)—an interpretation of ARB No. 51 (“FIN 46R”). However, the Company hasdetermined that it was not the primary beneficiary of any variable interest entity in the periods presented in theaccompanying consolidated and combined financial statements. For investments in any entities in which theCompany owns 50% or less of the outstanding voting stock but in which the Company has significant influenceover operating and financial decisions, the Company applies the equity method of accounting. In cases where theCompany’s investment is less than 20% and significant influence does not exist, such investments are carried atcost.
Whenever the Company securitizes credit card receivables, it does so using trusts that are qualifying specialpurpose entities (“QSPEs”) under FASB Statement of Financial Accounting Standards No. 140, Accounting forTransfers and Servicing of Financial Assets and Extinguishments of Liabilities, as amended (“StatementNo. 140”). As QSPEs, these trusts are specifically exempted from the consolidation provisions of FIN 46R.Pursuant to the provisions of Statement No. 140 and FIN 46R, these QSPEs are not consolidated by or combinedwith the Company and are therefore excluded from the accompanying consolidated and combined financialstatements.
2. Summary of Significant Accounting Policies
Cash and Cash Equivalents. Cash and cash equivalents includes cash and due from banks, Federal Fundssold, money market mutual funds and commercial paper. Cash and due from banks is defined by the Company ascash on hand and on deposit with banks, including time deposits and other highly liquid investments withmaturities of 90 days or less when purchased.
Investment Securities. Investment securities consist of certificated retained beneficial interests in theDiscover Card Master Trust I issued in the form of Class B and Class C notes, U.S. Treasury obligations,mortgage-backed securities issued by government and government-sponsored agencies and state agency bonds,all of which have maturities of six months or more when purchased. Investment securities also include U.S.asset-backed commercial paper notes of one issuer that are currently in default and which are expected to be
50

restructured in 2008. Investment securities are classified based on management’s intent on the date of purchase.Investment securities which the Company has the positive intent and ability to hold to maturity are classified asheld-to-maturity and are reported at amortized cost. All other investment securities are classified asavailable-for-sale, as the Company does not hold investment securities for trading purposes. Investmentsecurities available-for-sale are reported at fair value with unrealized gains and losses, net of tax, reported as acomponent of accumulated other comprehensive income included in stockholders’ equity. The amortized cost,for both held-to-maturity and available-for-sale securities, is adjusted for amortization of premiums and accretionof discounts. Such amortization or accretion is included in interest income. The Company evaluates its unrealizedloss positions for other-than-temporary impairment in accordance with FASB Staff Position No. 115-1, TheMeaning of Other-Than-Temporary Impairment and its Application to Certain Investments. Realized gains andlosses and other-than-temporary impairments related to investment securities are determined using the specificidentification method and are reported in other income.
Retained Interests in Securitized Assets. The Company periodically transfers credit card loan receivables toasset securitization trusts. Securitized credit card loan receivables include outstanding principal, interest and fees.The Company’s securitization transactions are recognized as sales under Statement No. 140; accordingly, theCompany removes securitized credit card receivables from loan receivables on its consolidated and combinedstatements of financial condition. The Company may retain interests in the transferred financial assets in variousforms including an undivided seller’s interest, retained certificated beneficial interests, accrued interest and feeson securitized credit card receivables (“accrued interest receivable”), cash collateral accounts, servicing rightsand rights to certain excess cash flows remaining after payments to investors in the securitization trust of theircontractual rate of return, the payment of servicing fees to the Company and reimbursement of credit card losses(“interest-only strip receivables”).
The Company includes its undivided seller’s interest within loan receivables in the consolidated andcombined statements of financial condition. A portion of the undivided seller’s interest will be reclassified asloans held for sale to the extent that new securitizations are expected to take place. Due to contractualrequirements to hold minimum seller’s interest percentages under the securitization agreements, only a portion ofthe Company’s undivided seller’s interest can be classified as held for sale (also see Loans Held for Sale). TheCompany classifies retained certificated beneficial interests as investment securities – available-for-sale on theconsolidated and combined statements of financial condition at their estimated fair values. All other retainedinterests are recorded on the consolidated and combined statements of financial condition in amounts due fromasset securitization at their estimated fair values. These other retained interests are accounted for like tradingsecurities and accordingly, changes in their estimated fair values are recorded in securitization income. TheCompany does not recognize servicing assets or servicing liabilities for servicing rights since the servicing feeapproximates just adequate compensation to the Company for performing the servicing.
Cash flows associated with the securitization of credit card receivables that were originated for investmentare included in cash flows from investing activities. Cash flows related to credit card receivables transferred tothe trust during the term of a securitization in order to maintain a constant level of investor interest in receivablesare classified as operating cash flows, as those receivables are treated as being originated specifically for sale.
Loans Held for Sale. Loans held for sale includes the amount of credit card receivables necessary to supportnet new securitization transactions expected to take place in the next three months as well as mortgages that wereoriginated with the intent to sell. Management believes its ability to reasonably forecast the amount of existingcredit card receivables that should be reclassified as held for sale is limited to three months from the balancesheet date, as securitizations that occur beyond that point will involve a significant proportion of receivables thathave not yet been originated, due to cardholder repayment behavior and the revolving nature of credit cards. Inestimating the amount of credit card receivables that should be classified as held for sale, the Company considersits ability to access the securitization market given current market conditions, scheduled maturities of outstandingasset-backed securities, management’s targeted mix of funding sources used, and the relative availability of theCompany’s other funding sources.
51

The amount of credit card receivables classified as held for sale is determined on a homogeneous portfoliobasis, because the seller’s interest represents an undivided interest in each loan transferred to the securitizationtrust. In contrast, mortgages held for sale are classified on an individual loan basis. The Company includes itsloans held for sale in loan receivables and carries these assets at the lower of aggregate cost or fair value. The parvalue of loans classified as held for sale in the consolidated and combined statements of financial conditionapproximates their fair values as a result of the short-term nature of these assets. An allowance for loan lossesdoes not apply to loans held for sale.
When credit card receivables that are classified as held for sale are securitized and beneficial interests areissued to third parties, loans held for sale is reduced, cash is received and amounts due from asset securitizationis adjusted to reflect changes in the Company’s retained interests as applicable. When certificated beneficialinterests are retained, loans held for sale is reduced and investment securities – available-for-sale is increased.
Loan Receivables. Loan receivables consist of credit card receivables and other loans and include loansclassified as held for sale and loans classified as held for investment. Loans held for investment include creditcard, commercial loans and other consumer loans. Credit card receivables include consumer credit cardreceivables and business credit card receivables. Business credit card receivables are presented in theconsolidated and combined financial statements and accompanying notes as commercial loans. Other consumerloans consist of mortgages and other consumer installment loans. Consumer and business credit card loanreceivables are reported at their principal amounts outstanding and include uncollected billed interest and fees.Other consumer loans are reported at their principal amounts outstanding.
All new originations of credit card receivables (except for the amount of new receivables transferred to thetrust during the term of a securitization to maintain a constant level of investor interest in receivables) aredeemed to be held for investment at origination because management has the intent and ability to hold them forthe foreseeable future. In determining the amount of loans held for investment, management makes judgmentsabout the Company’s ability to fund these loans through means other than securitization, such as deposits andother borrowings, and considers the targeted mix of funding sources to be used. In determining what constitutesthe foreseeable future, management considers the short average life and homogeneous nature of credit cardreceivables. In assessing whether loans can continue to be held for investment, management also considerscapital levels and scheduled maturities of funding instruments used. Management believes that the assertionregarding its intent and ability to hold credit card loans for the foreseeable future can be made with a high degreeof certainty given the maturity distribution of deposits and other on-balance sheet funding instruments, thehistoric ability to replace maturing deposits and other borrowings with new deposits or borrowings, and historiccredit card payment activity. Due to the homogeneous nature of credit card receivables, loans are classified asheld for investment on a portfolio basis. When a decision to securitize additional credit card receivables is made,to the extent necessary, loans held for investment will be reclassified as held for sale on a portfolio basis.
Cash flows associated with loans that are originated with the intent to sell are included in cash flows fromoperating activities. Cash flows associated with loans originated for investment are classified as investing cashflows, regardless of a subsequent change in intent.
Allowance for Loan Losses. The Company maintains an allowance for loan losses at a level that is adequateto absorb probable losses inherent in the loan portfolio. The allowance is evaluated quarterly for adequacy and isestablished through a charge to the provision for loan losses. Additions to the allowance are made throughcharges to the provision for loan losses and when reserves are acquired as part of business or portfolioacquisitions. Charge-offs are deducted from the allowance and subsequent recoveries increase the allowance.
The allowance for loan losses is applicable to the loan portfolio. In estimating net charge-offs inherent in thecredit card loan portfolio, the Company uses an approach which utilizes a migration analysis of delinquent andcurrent credit card receivables. A migration analysis is a technique used to estimate the likelihood that a loan
52

receivable will progress through the various stages of delinquency to charge off. The migration analysisconsiders uncollectible principal, interest and fees reflected in loan receivables. In determining the proper levelof the allowance for loan losses, management also considers factors that may impact loan loss experience,including current economic conditions, recent trends in delinquencies and bankruptcy filings, account collectionmanagement, policy changes, account seasoning, loan volume and amounts, payment rates and forecastinguncertainties.
The allowance for loan losses is applicable only to the Company’s owned loan portfolio and does notconsider losses inherent in securitized loans. Net charge-offs related to securitized loans are absorbed by thesecuritization trusts pursuant to the terms of documents governing the securitization transactions, and as such, arenot included in the Company’s allowance for loan losses but are reflected in the valuation of the interest-onlystrip receivable.
Delinquent Loans. The entire balance of an account is contractually past due if the minimum payment is notreceived by the specified date on the cardmember’s billing statement. Delinquency is reported on loans that are30 or more days past due.
Credit card loans are charged-off at the end of the month during which an account becomes 180 days pastdue, except in the case of cardmember bankruptcies, probate accounts and fraudulent transactions. Cardmemberbankruptcies and probate accounts are charged-off at the end of the month 60 days following the receipt ofnotification of the bankruptcy or death, but not later than the 180-day time frame described above. TheCompany’s charge-off policies comply with guidelines established by the Federal Financial InstitutionsExamination Council (“FFIEC”).
Fraudulent transactions are included in loan receivables. Receivables associated with alleged or potentialfraud are adjusted to their net realizable value upon receipt of notification of such fraud through a charge to otherexpense and are subsequently written off at the end of the month 90 days following notification, but not later thanthe contractual 180-day time frame.
The practice of re-aging an account also may affect credit card loan delinquencies and charge-offs. A re-ageis intended to assist delinquent cardmembers who have experienced financial difficulties but who demonstrateboth an ability and willingness to repay. Accounts meeting specific criteria are re-aged when the Company andthe cardmember agree on a temporary repayment schedule that may include concessionary terms. With re-aging,the outstanding balance of a delinquent account is returned to a current status. Cardmembers may also qualify fora workout re-age when either a longer term or permanent hardship exists. The Company’s re-age practicescomply with FFIEC guidelines.
Premises and Equipment, net. Premises and equipment, net are stated at cost less accumulated depreciationand amortization, which is computed using the straight-line method over the estimated useful lives of the assets.Buildings are depreciated over a period of 39 years. The costs of leasehold improvements are capitalized anddepreciated over the lesser of the remaining term of the lease or the asset’s estimated useful life, typically tenyears. Furniture and fixtures are depreciated over a period of five to ten years. Equipment is depreciated overthree to ten years. Capitalized leases, consisting of computers and processing equipment, are depreciated overthree and six years, respectively. Maintenance and repairs are immediately expensed, while the costs ofimprovements are capitalized.
Purchased software and capitalized costs related to internally developed software are amortized over theiruseful lives of three to five years. Costs incurred during the application development stage related to internallydeveloped software are capitalized in accordance with American Institute of Certified Public AccountantsStatement of Position 98-1, Accounting for the Cost of Computer Software Developed or Obtained for InternalUse (“SOP 98-1”). Pursuant to SOP 98-1, costs are expensed as incurred during the preliminary project stage andpost implementation stage. Once the capitalization criteria of SOP 98-1 have been met, external direct costs
53

incurred for materials and services used in developing or obtaining internal-use computer software, payroll andpayroll-related costs for employees who are directly associated with the internal-use computer software project(to the extent those employees devoted time directly to the project), and interest costs incurred when developingcomputer software for internal use are capitalized. Amortization of capitalized costs begins when the software isready for its intended use. Capitalized software is included in premises and equipment, net in the Company’sconsolidated and combined statements of financial condition. See Note 7: Premises and Equipment for furtherinformation about the Company’s premises and equipment.
Goodwill. Goodwill is recorded as part of the Company’s acquisitions of businesses when the purchase priceexceeds the fair value of the net tangible and separately identifiable intangible assets acquired. The Company’sgoodwill is not amortized, but rather is subject to an impairment test at the reporting unit level each year, or moreoften if conditions indicate impairment may have occurred, pursuant to FASB Statement of Financial AccountingStandards No. 142, Goodwill and Other Intangible Assets (“Statement No. 142”). In the fourth quarter of 2007,the Company recognized goodwill impairment associated with its International Card segment. See Note 9:Goodwill for information concerning this impairment charge. There was no impairment of the Company’sgoodwill in the years ended November 30, 2006 and 2005.
Intangible Assets. The Company’s amortizable intangible assets consists primarily of acquired customerrelationships and trade name intangibles. Acquired customer relationships include purchased credit cardholderrelationships (“PCCRs”) and other customer relationships. All of the Company’s amortizable intangible assetsare carried at net book value and are amortized over their estimated useful lives. The amortization periodsapproximate the periods over which the Company expects to generate future net cash inflows from the use ofthese assets. Accordingly, PCCRs and other customer relationships are amortized over a useful life of 15 years,and trade names are amortized over a useful life of 25 years. The Company’s policy is to amortize all intangiblesin a manner that reflects the pattern in which the projected net cash inflows to the Company are expected tooccur, as opposed to the straight-line basis. This method of amortization typically results in a greater portion ofthe intangible asset’s carrying value being amortized in the earlier years of the asset’s useful life.
All of the Company’s amortizable intangible assets, as well as other amortizable or depreciable long-livedassets such as premises and equipment, are subject to impairment testing in accordance with Statement ofFinancial Accounting Standards No. 144, Accounting for the Impairment or Disposal of Long-Lived Assets(“Statement No. 144”) when events or conditions indicate that the assets may not be fully recoverable. A test forrecoverability is done by comparing the asset’s carrying value to the sum of the undiscounted future net cashinflows expected to be generated from the use of the asset over its remaining useful life. In accordance withStatement No. 144, impairment exists if the sum of the undiscounted expected future net cash inflows is less thanthe carrying amount of the asset. Impairment would result in a write-down of the asset to its estimated fair value.The estimated fair values of these assets are based on the discounted present value of the stream of future netcash inflows expected to be derived over their remaining useful lives. If an impairment write-down is recorded,the remaining useful life of the asset will be evaluated to determine whether revision of the remainingamortization or depreciation period is appropriate. In the fourth quarter of 2007, the Company recognizedimpairment of certain amortizable intangible assets associated with its International Card segment. See Note 10:Other Intangible Assets for further details concerning these impairment charges. There was no impairment write-down of any of the Company’s intangible assets nor of any of the Company’s other amortizable or depreciablelong-lived assets for the years ended November 30, 2006 and 2005.
Securitization Income. In accordance with Statement No. 140, when beneficial interests in securitizedreceivables are issued to third-party investors, the Company recognizes a gain on the transfer of the loanreceivables. The amount of the gain depends in part on the previous carrying amount of the assets involved in thetransfer, allocated between the assets transferred and the retained interests based upon their relative fair values atthe date of the transfer. An interest-only strip receivable is recorded in the consolidated and combined statementsof financial condition and represents the contractual right to receive interest and certain other revenue less certaincosts, including charge-offs on securitized loans and the interest paid to investors in the securitization
54

transactions (“the excess spread”) from the trust over the estimated life of the securitized loan receivables. Theinterest-only strip receivable is recorded at its estimated fair value with subsequent changes in fair value recordedin securitization income. The Company estimates the fair value of the interest-only strip receivable based on thepresent value of expected future cash flows using management’s best estimate of the key assumptions, includingforecasted interest yield, loan losses and payment rates, the interest rate paid to investors and a discount ratecommensurate with the risks involved. The recognition of securitization income from the actual net excess cashflows accrued is offset in part by the revaluation of the interest-only strip receivable such that the interest-onlystrip receivable reflects only future excess cash flows. Also included in securitization income is the annualservicing fee the Company receives based on a percentage of the investor interest outstanding. The Companydoes not recognize servicing assets or servicing liabilities for servicing rights since the servicing feeapproximates just adequate compensation to the Company for performing the servicing. In addition, forsecuritization transactions completed on or after November 3, 2004, the Company, in accordance with governingsecuritization documents, allocates portions of discount and interchange revenue to new securitizationtransactions, which is also recognized as securitization income. Securitization transaction costs are deferred andamortized to securitization income over the life of the related transactions.
Loan Interest and Fee Income. Interest on loans is comprised largely of interest on credit card loans and isrecognized based upon the amount of loans outstanding and their contractual interest rate. Interest on loans isincluded in loan receivables when billed to the cardmember. The Company accrues unbilled interest revenue on amonthly basis from a cardmember’s billing cycle date to the end of the month. The Company applies an estimateof the percentage of loans that will revolve in the next cycle in the estimation of the accrued unbilled portion ofinterest revenue that is included in accrued interest receivable on the consolidated and combined statements offinancial condition. The Company also applies the same estimate in the valuation of the accrued interest onsecuritized loans that is included in amounts due from asset securitization.
The Company recognizes fees (except annual fees and certain product fees) on loan receivables in earningsas fees are assessed. Annual fees and certain product fees are recognized in revenue ratably over the periods towhich they relate. Loan fee income consists of fees on credit card loans and includes annual, late, overlimit,balance transfer, returned check, cash advance and other miscellaneous fees and is reflected net of waivers. Thesefees are included in loan receivables when billed to credit card loans and accrued interest receivable when billedto other consumer loans. Pursuant to EITF Issue No. 92-5, Amortization Period for Net Deferred Credit CardOrigination Costs, direct loan origination costs on credit card loans are deferred and amortized to consumer orcommercial loan interest income on a straight-line basis over a one-year period. As of November 30, 2007 and2006, the remaining unamortized deferred costs related to these items were $24.7 million and $29.4 million,respectively, and are recorded in loan receivables.
The Company accrues interest and fees on loan receivables until the loans are paid or charged-off, except ininstances of cardmember bankruptcy, death or fraud, where no further interest and fee accruals occur followingnotification. The Company may, in connection with collection activities, place a loan on non-accrual status.When loan receivables are charged-off, unpaid accrued interest and fees are reversed against the income lineitems in which they were originally recorded in the consolidated and combined statements of income. TheCompany considers uncollectible interest and fee revenues in assessing the adequacy of the allowance for loanlosses.
Discount and Interchange Revenue. The Company earns discount revenue from fees charged to merchantswith whom the Company has entered into a direct card acceptance agreement for processing Discover Networkcard transactions. The Company earns acquirer interchange revenue from merchant acquirers on all DiscoverNetwork card transactions made by cardholders at merchants with whom merchant acquirers have entered intocard acceptance agreements for processing cardholder purchase transactions. Discount revenue is deducted fromthe payment to the merchant and recorded in discount and interchange revenue at the time the cardholder chargetransaction is captured.
55
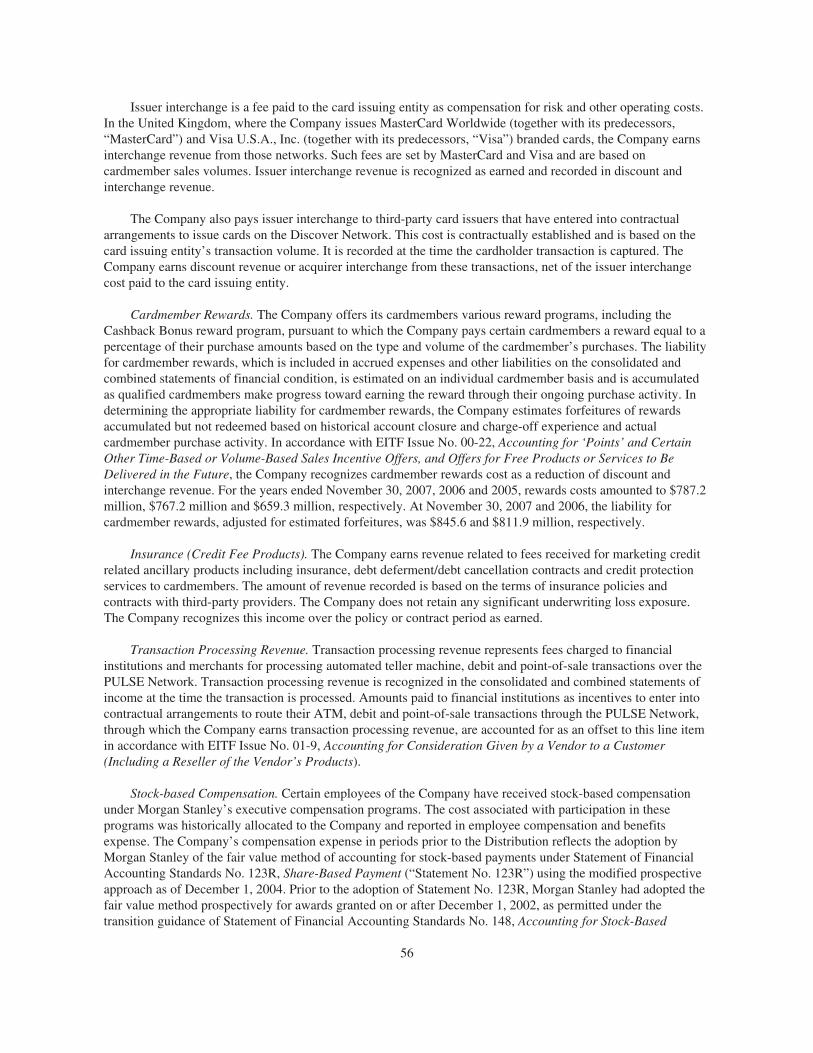
Issuer interchange is a fee paid to the card issuing entity as compensation for risk and other operating costs.In the United Kingdom, where the Company issues MasterCard Worldwide (together with its predecessors,“MasterCard”) and Visa U.S.A., Inc. (together with its predecessors, “Visa”) branded cards, the Company earnsinterchange revenue from those networks. Such fees are set by MasterCard and Visa and are based oncardmember sales volumes. Issuer interchange revenue is recognized as earned and recorded in discount andinterchange revenue.
The Company also pays issuer interchange to third-party card issuers that have entered into contractualarrangements to issue cards on the Discover Network. This cost is contractually established and is based on thecard issuing entity’s transaction volume. It is recorded at the time the cardholder transaction is captured. TheCompany earns discount revenue or acquirer interchange from these transactions, net of the issuer interchangecost paid to the card issuing entity.
Cardmember Rewards. The Company offers its cardmembers various reward programs, including theCashback Bonus reward program, pursuant to which the Company pays certain cardmembers a reward equal to apercentage of their purchase amounts based on the type and volume of the cardmember’s purchases. The liabilityfor cardmember rewards, which is included in accrued expenses and other liabilities on the consolidated andcombined statements of financial condition, is estimated on an individual cardmember basis and is accumulatedas qualified cardmembers make progress toward earning the reward through their ongoing purchase activity. Indetermining the appropriate liability for cardmember rewards, the Company estimates forfeitures of rewardsaccumulated but not redeemed based on historical account closure and charge-off experience and actualcardmember purchase activity. In accordance with EITF Issue No. 00-22, Accounting for ‘Points’ and CertainOther Time-Based or Volume-Based Sales Incentive Offers, and Offers for Free Products or Services to BeDelivered in the Future, the Company recognizes cardmember rewards cost as a reduction of discount andinterchange revenue. For the years ended November 30, 2007, 2006 and 2005, rewards costs amounted to $787.2million, $767.2 million and $659.3 million, respectively. At November 30, 2007 and 2006, the liability forcardmember rewards, adjusted for estimated forfeitures, was $845.6 and $811.9 million, respectively.
Insurance (Credit Fee Products). The Company earns revenue related to fees received for marketing creditrelated ancillary products including insurance, debt deferment/debt cancellation contracts and credit protectionservices to cardmembers. The amount of revenue recorded is based on the terms of insurance policies andcontracts with third-party providers. The Company does not retain any significant underwriting loss exposure.The Company recognizes this income over the policy or contract period as earned.
Transaction Processing Revenue. Transaction processing revenue represents fees charged to financialinstitutions and merchants for processing automated teller machine, debit and point-of-sale transactions over thePULSE Network. Transaction processing revenue is recognized in the consolidated and combined statements ofincome at the time the transaction is processed. Amounts paid to financial institutions as incentives to enter intocontractual arrangements to route their ATM, debit and point-of-sale transactions through the PULSE Network,through which the Company earns transaction processing revenue, are accounted for as an offset to this line itemin accordance with EITF Issue No. 01-9, Accounting for Consideration Given by a Vendor to a Customer(Including a Reseller of the Vendor’s Products).
Stock-based Compensation. Certain employees of the Company have received stock-based compensationunder Morgan Stanley’s executive compensation programs. The cost associated with participation in theseprograms was historically allocated to the Company and reported in employee compensation and benefitsexpense. The Company’s compensation expense in periods prior to the Distribution reflects the adoption byMorgan Stanley of the fair value method of accounting for stock-based payments under Statement of FinancialAccounting Standards No. 123R, Share-Based Payment (“Statement No. 123R”) using the modified prospectiveapproach as of December 1, 2004. Prior to the adoption of Statement No. 123R, Morgan Stanley had adopted thefair value method prospectively for awards granted on or after December 1, 2002, as permitted under thetransition guidance of Statement of Financial Accounting Standards No. 148, Accounting for Stock-Based
56

Compensation—Transition and Disclosure, an amendment of FASB Statement No. 123. For awards granted priorto December 1, 2002 (some of which remained unvested or unexercised in the periods presented in thesefinancial statements), Morgan Stanley applied the intrinsic value method prescribed by Accounting PrinciplesBoard Opinion No. 25, Accounting for Stock Issued to Employees.
Additionally, based on interpretive guidance related to Statement No. 123R, in the first quarter of 2006,Morgan Stanley changed its accounting policy for expensing the cost of anticipated 2006 year-end stock-basedawards that were granted to retirement-eligible employees in the first quarter of 2007. Effective December 1,2005, Morgan Stanley began accruing the estimated cost of these awards over the course of the current yearrather than expensing the awards on the date of grant. Allocations made to the Company in periods prior to theDistribution reflect this change.
Advertising Costs. The Company expenses advertising costs as incurred. Television advertising costs areexpensed in the period in which the advertising is first aired. Advertising costs are recorded in marketing andbusiness development.
Income Taxes. Income tax expense is provided for using the asset and liability method, under whichdeferred tax assets and liabilities are determined based on the temporary differences between the financialstatement and income tax bases of assets and liabilities using currently enacted tax rates. See Note 17: IncomeTaxes for more information about the Company’s income taxes.
The Company’s taxable income was historically included in the consolidated U.S. federal income tax returnof Morgan Stanley and in returns filed by Morgan Stanley with certain state taxing jurisdictions. For periodsprior to the Distribution, the Company’s income tax liability has been computed and presented in thesestatements as if it were a separate tax-paying entity. For periods prior to the Distribution, Federal and state taxeswere remitted to Morgan Stanley pursuant to a tax sharing agreement between the companies.
Financial Instruments Used for Asset and Liability Management. The Company enters into derivativefinancial instruments, specifically interest rate swaps, for non-trading purposes. The Company uses interest rateswaps to manage interest rate risk arising from interest-bearing deposits. Through October 2006, derivativefinancial instruments were designated and qualified as fair value hedges in accordance with Statement ofFinancial Accounting Standards No. 133, Accounting for Derivative Instruments and Hedging Activities, asamended (“Statement No. 133”). Derivative contracts having positive net fair values at November 30, 2007 and2006, inclusive of net accrued interest receipts or payments, are recorded in other assets. Derivative contractswith negative net fair values, inclusive of net accrued interest payments or receipts, are recorded in accruedexpenses and other liabilities. With regard to such derivatives hedging interest-bearing deposits, through October2006, changes in both the fair value of the derivatives and the gains or losses on the hedged interest-bearingdeposits relating to the risk being hedged were recorded in interest expense and provided offset to one another.Ineffectiveness related to these fair value hedges, if any, was recorded in interest expense. To the extent thatdifferences in notional amounts of the derivatives and hedged liabilities arose subsequent to the closing of thetransactions, the hedge relationship was de-designated, with the change in the fair value of the derivativesrecorded currently in other income. On November 1, 2006, the Company de-designated all of the derivativeswhich previously hedged interest-bearing deposits and no longer accounted for them as fair value hedges.Beginning in November 2006, the basis adjustments to the fair value of the interest-bearing deposits that arosefrom the previous hedge accounting are amortized to interest expense over the lives of the previously hedgedinterest-bearing deposits using the effective yield method. Subsequent changes in the fair value of the interestrate swaps were recorded in other income.
Beginning July 1, 2007, the Company designated certain derivatives to hedge specific longer term interest-bearing deposits, qualifying them as fair value hedges under the long haul method in accordance with StatementNo. 133. These derivatives were among those previously de-designated on November 1, 2006. The basisadjustments to the fair value of interest-bearing deposits that arose from this previous hedge accounting, as well
57

as the basis adjustments existing on the hedged interest-bearing deposits at the time of re-designation, areamortized to interest expense over the lives of the related interest-bearing deposits using the effective yieldmethod. To the extent these fair value hedges are effective, changes in the fair value of the derivatives and thegains or losses on the hedged interest-bearing deposits relating to the risk being hedged are recorded in interestexpense, providing offset to one another. In contrast, changes in the fair value of interest rate swaps that do notqualify as fair value hedges are recorded in other income.
For each interest rate swap agreement the Company entered into with the Discover Card Master Trust I tohedge a securitization transaction, the Company also entered into a mirror interest rate swap agreement withequal and offsetting terms. Net fair values of these agreements were recorded in other assets and accruedexpenses and other liabilities, as applicable for positive and negative net fair values, respectively. Changes in thefair value of these interest rate agreements are recorded in earnings netting to an effect of zero as a result of theoffsetting positions. See Note 22: Fair Value Disclosures for further discussion concerning derivative financialinstruments.
Accumulated Other Comprehensive Income. In accordance with Statement of Financial AccountingStandards No. 130, Reporting Comprehensive Income, the Company records unrealized gains and losses onavailable-for-sale securities, certain pension adjustments and foreign currency translation adjustments inaccumulated other comprehensive income on an after tax basis where applicable. The Company presentsaccumulated other comprehensive income, net of tax, in its consolidated and combined statements of changes instockholders’ equity.
Translation of Foreign Currencies. The financial statements of the Company’s consolidated and combinedforeign subsidiaries have been translated into U.S. dollars in accordance with GAAP. Assets and liabilities havebeen translated using the exchange rate in effect at each year-end; income and expense amounts have beentranslated using the average exchange rate for the period in which the transactions occurred. The translation gainsand losses resulting from the change in exchange rates have been reported as a component of accumulated othercomprehensive income included in stockholders’ equity.
Recently Issued Accounting Pronouncements
In July 2006, the FASB issued FASB Interpretation No. 48, Accounting for Uncertainty in Income Taxes, aninterpretation of FASB Statement No. 109 (“FIN 48”). FIN 48 clarifies the accounting for uncertainty in incometaxes recognized in a company’s financial statements and prescribes a recognition threshold and measurementattribute for the financial statement recognition and measurement of a tax position taken or expected to be takenin an income tax return. FIN 48 also provides guidance on derecognition, classification, interest and penalties,accounting in interim periods, disclosure and transition. FIN 48 is effective for the Company as of December 1,2007. The Company anticipates that the adoption of FIN 48 will result in a charge to the opening balance ofretained earnings as of December 1, 2007 of approximately $8.7 million.
In June 2007, the FASB’s EITF ratified Issue No. 06-11, Accounting for Income Tax Benefits of Dividendson Share-Based Payment Awards (“EITF 06-11”), which clarifies the accounting for income tax benefits relatedto dividends paid on stock-based awards. The issue is effective for awards declared in fiscal years beginning afterDecember 15, 2007, and interim periods within those years. EITF 06-11 is not expected to have a material impacton the Company’s consolidated financial condition, results of operations or cash flows.
3. Accounting Change
In accordance with Statement No. 142, the Company completed its annual goodwill impairment testing as ofDecember 1, 2006 and 2005. During the quarter ended August 31, 2007 but prior to the Distribution, theCompany changed the date of its annual goodwill impairment testing to June 1 in order to move the impairmenttesting outside of the normal year-end reporting process to a date when resources are less constrained. As a result
58

of the change in the date of the annual goodwill impairment test, goodwill was evaluated for impairment as ofJune 1, 2007, after which management concluded that goodwill was not impaired as of that date. The Companybelieves that the resulting change in accounting principle related to the annual testing date did not delay,accelerate, or avoid an impairment charge. The Company determined that the change in accounting principlerelated to the annual testing date is preferable under the circumstances and does not result in adjustments to theCompany’s financial statements when applied retrospectively. In accordance with Statement No. 142, theCompany also considers the need for interim impairment testing when circumstances requiring it arise.Management determined that an interim test was needed in the fourth quarter of 2007 for goodwill associatedwith the International Card segment and that evaluation resulted in the recognition of an impairment charge. SeeNote 9: Goodwill for further details concerning the fourth quarter goodwill impairment charge related to theInternational Card segment.
4. Investment Securities
The Company’s investment securities consist of the following (dollars in thousands):
November 30,
2007 2006
U.S. Treasury and other U.S. government agency obligations . . . . . . . . . . . . . . . . . . . . . . . . $ 23,160 $22,838State and political subdivisions of states . . . . . . . . . . . . . . . . . . . . . . . . . . . . . . . . . . . . . . . . . 61,091 41,836Other securities . . . . . . . . . . . . . . . . . . . . . . . . . . . . . . . . . . . . . . . . . . . . . . . . . . . . . . . . . . . . 441,188 19,737
Investment securities . . . . . . . . . . . . . . . . . . . . . . . . . . . . . . . . . . . . . . . . . . . . . . . . . . . . $525,439 $84,411
The following table summarizes investment securities—held-to-maturity by type (dollars in thousands):
Net BookValue
UnrealizedGains
UnrealizedLosses
FairValue
At November 30, 2007Investment Securities—Held-to-Maturity
U.S. Treasury and other U.S. government agencyobligations . . . . . . . . . . . . . . . . . . . . . . . . . . . . . . . . . . . . . . $ 5,930 $ 3 $ — $ 5,933
State and political subdivisions of states . . . . . . . . . . . . . . . . . 61,091 388 (4,379) 57,100Mortgage-backed securities . . . . . . . . . . . . . . . . . . . . . . . . . . . 17,230 192 (37) 17,385Other debt securities . . . . . . . . . . . . . . . . . . . . . . . . . . . . . . . . 20,351 — — 20,351
Total investment securities—held-to-maturity . . . . . . . . $104,602 $ 583 $(4,416) $100,769
At November 30, 2006Investment Securities—Held-to-Maturity
U.S. Treasury and other U.S. government agencyobligations . . . . . . . . . . . . . . . . . . . . . . . . . . . . . . . . . . . . . . $ 1,466 $ — $ — $ 1,466
State and political subdivisions of states . . . . . . . . . . . . . . . . . 41,836 512 (462) 41,886Mortgage-backed securities . . . . . . . . . . . . . . . . . . . . . . . . . . . 21,372 144 (50) 21,466Other debt securities . . . . . . . . . . . . . . . . . . . . . . . . . . . . . . . . 17,423 — — 17,423
Total investment securities—held-to-maturity . . . . . . . . $ 82,097 $ 656 $ (512) $ 82,241
59

The following table summarizes investment securities that have been in a continuous unrealized lossposition for less than 12 months and those that have been in an unrealized loss position for 12 months or more(dollars in thousands):
Less than 12 months More than 12 months
UnrealizedLosses
FairValue
UnrealizedLosses
FairValue
At November 30, 2007Investment Securities—Available-for-Sale
Equity securities . . . . . . . . . . . . . . . . . . . . . . . . . . . . . . . . . . . . . $ (705) $ 1,295 $ — $ —Other debt securities . . . . . . . . . . . . . . . . . . . . . . . . . . . . . . . . . . $(4,139) $310,861 $ — $ —
Investment Securities—Held-to-MaturityState and political subdivisions of states . . . . . . . . . . . . . . . . . . . $(3,048) $ 36,742 $(1,331) $8,664Mortgage-backed securities . . . . . . . . . . . . . . . . . . . . . . . . . . . . . $ — $ — $ (37) $2,039
At November 30, 2006Investment Securities—Available-for-Sale
Equity securities . . . . . . . . . . . . . . . . . . . . . . . . . . . . . . . . . . . . . $ — $ — $ — $ —Investment Securities—Held-to-Maturity
State and political subdivisions of states . . . . . . . . . . . . . . . . . . . $ (462) $ 9,538 $ — $ —Mortgage-backed securities . . . . . . . . . . . . . . . . . . . . . . . . . . . . . $ — $ — $ (50) $3,839
Management has determined that it has the intent and ability to hold these investments until maturity.
During the years ended November 30, 2007, 2006 and 2005, investment securities—held-to-maturity withstate and political subdivisions of states incurred losses of $5 thousand, $33 thousand and $3 thousand (excludingany tax effects), respectively. These losses reflect the write-down of the bonds to net realizable value and arerecorded in other income. There were no other impairment charges on held-to-maturity securities recorded in theyears ended November 30, 2007, 2006 and 2005.
During the years ended November 30, 2007, 2006 and 2005, tax exempt income earned on investmentsecurities of state and political subdivisions of states was $2.2 million, $1.0 million and $33 thousand,respectively. U.S. Treasury obligations held at the Federal Reserve Bank of Philadelphia at November 30, 2007,2006 and 2005 of $1.6 million, $1.5 million and $1.2 million, respectively, were pledged securities to providecollateral for public deposits in excess of FDIC insurance limits.
Included in investment securities—held-to-maturity at November 30, 2007 and 2006 are commercialadvances of $18.7 million and $15.9 million, respectively, related to the Company’s Community ReinvestmentAct strategies.
Investment securities classified as available-for-sale consist of marketable equity and debt securities. Thefollowing table summarizes investment securities—available-for-sale (dollars in thousands):
November 30,
2007 2006 2005
Equity securitiesAmortized cost . . . . . . . . . . . . . . . . . . . . . . . . . . . . . . . . . . . . . . . . . . . . . . . . . $ 2,000 $ 2,000 $ 2,000Fair value . . . . . . . . . . . . . . . . . . . . . . . . . . . . . . . . . . . . . . . . . . . . . . . . . . . . . . $ 1,295 $ 2,314 $ 2,362Gross unrealized (loss)/gain . . . . . . . . . . . . . . . . . . . . . . . . . . . . . . . . . . . . . . . $ (705) $ 314 $ 362Accumulated other comprehensive (loss)/income, net of tax . . . . . . . . . . . . . . $ (452) $ 203 $ 228Dividend income (for the years ended November 30) . . . . . . . . . . . . . . . . . . . $ 180 $ 180 $ 176
Other debt securitiesAmortized cost . . . . . . . . . . . . . . . . . . . . . . . . . . . . . . . . . . . . . . . . . . . . . . . . . $ 423,681 $ — $ —Fair value . . . . . . . . . . . . . . . . . . . . . . . . . . . . . . . . . . . . . . . . . . . . . . . . . . . . . . $ 419,542 $ — $ —Gross unrealized loss . . . . . . . . . . . . . . . . . . . . . . . . . . . . . . . . . . . . . . . . . . . . . $ (4,139) $ — $ —Accumulated other comprehensive loss, net of tax . . . . . . . . . . . . . . . . . . . . . . $ (2,609) $ — $ —Interest income (for the years ended November 30) . . . . . . . . . . . . . . . . . . . . . $ 5,311 $ — $ —
60

Investment securities—available-for-sale are reported in the consolidated and combined statements offinancial condition at their fair values with unrealized gains and losses recorded in accumulated othercomprehensive income. Losses considered to be other-than-temporary are recorded as a reduction to otherincome and the cost basis of each impaired security is decreased accordingly.
Other debt securities reported as available-for-sale include certificated retained interests in the DiscoverCard Master Trust I (the “Trust”) having an amortized cost of $315.0 million and asset-backed commercial papernotes (hereinafter the “notes”) having an amortized cost of $108.7 million. During the year ended November 30,2007, an $11.4 million other-than-temporary impairment was recorded on the notes. There were no otherimpairment charges on available-for-sale securities recorded in the years ended November 30, 2007, 2006 and2005.
The notes represent U.S. asset-backed commercial paper notes of one issuer. At August 31, 2007, the noteswere assets of the Trust, to which the Company holds certain retained beneficial interests, including an undividedfractional interest and the right to certain Trust collections. When purchased as an asset of the Trust, the notescarried the highest available credit rating for commercial paper but were subsequently downgraded to belowinvestment grade due to rating agencies’ concerns about the issuer’s exposure to U.S. sub-prime mortgage-backedsecurities. As a result of the downgrades, the mandatory acceleration trigger for the commercial paper program hadbeen breached, causing the issuer’s liabilities to be accelerated and leading to a wind-down of the commercial paperprogram, which may result in the liquidation of the issuer’s assets or a restructuring of its liabilities. No proceedswere received by the Trust on the September 14, 2007 maturity date of the notes. On the Trust’s September 17,2007 distribution date, the Company received part of its distribution of collections in cash and the remainder in theform of these notes which had a par value of $120.1 million. As the notes are no longer traded, fair value atNovember 30, 2007 was determined utilizing a valuation analysis performed by the investment advisor assigned bythe trustee of the commercial paper program, reflecting an estimate of the market value of the assets held by theissuer. The Company currently expects these notes to be restructured by the issuer sometime in 2008, which,depending on the terms, may result in further impairment of the Company’s investment.
Maturities and yields of available-for-sale debt securities and held-to-maturity securities at November 30,2007 are provided in the tables below (dollars in thousands):
One Yearor
Less
After OneYear
ThroughFive
Years
AfterFive
YearsThrough
TenYears
After TenYears Total
Available-for-sale—Amortized CostOther debt securities . . . . . . . . . . . . . . . . . . . . . . . . . . . $108,681 $315,000 $ — $ — $423,681
Held-to-maturity—Book ValuesU.S. Treasury and other U.S. government agency
obligations . . . . . . . . . . . . . . . . . . . . . . . . . . . . . . . . 5,930 — — — 5,930State and political subdivisions of states . . . . . . . . . . . — — 10,000 51,091 61,091Mortgage-backed securities . . . . . . . . . . . . . . . . . . . . . — — — 17,230 17,230Other debt securities . . . . . . . . . . . . . . . . . . . . . . . . . . . 14,383 1,218 3,177 1,573 20,351
Total investment securities—held-to-maturity . . . $ 20,313 $ 1,218 $13,177 $69,894 $104,602
Available-for-sale—Fair ValuesOther debt securities . . . . . . . . . . . . . . . . . . . . . . . . . . . $108,681 $310,861 $ — $ — $419,542
Held-to-maturity—Fair ValuesU.S. Treasury and other U.S. government agency
obligations . . . . . . . . . . . . . . . . . . . . . . . . . . . . . . . . 5,933 — — — 5,933State and political subdivisions of states . . . . . . . . . . . — — 10,387 46,713 57,100Mortgage-backed securities . . . . . . . . . . . . . . . . . . . . . — — — 17,385 17,385Other debt securities . . . . . . . . . . . . . . . . . . . . . . . . . . . 14,383 1,218 3,177 1,573 20,351
Total investment securities—held-to-maturity . . . $ 20,316 $ 1,218 $13,564 $65,671 $100,769
61

One Yearor
Less
After OneYear
ThroughFive
Years
AfterFive
YearsThrough
TenYears
After TenYears Total
Investment securities—available-for-saleOther debt securities . . . . . . . . . . . . . . . . . . . . . . . . . . . 0.00% 6.00% — — 4.44%
Investment securities—held-to-maturityU.S. Treasury and other U.S. government agency
obligations . . . . . . . . . . . . . . . . . . . . . . . . . . . . . . . . 3.69% — — — 3.69%State and political subdivisions of states . . . . . . . . . . . — — 5.42% 4.66% 4.78%Mortgage-backed securities . . . . . . . . . . . . . . . . . . . . . — — — 5.52% 5.52%Other debt securities . . . . . . . . . . . . . . . . . . . . . . . . . . . 6.77% 6.32% 6.66% 5.07% 6.59%
Total investment securities—held-to-maturity . . . 5.87% 6.32% 5.72% 4.88% 5.19%
The Company had no investment securities classified as trading during the years ended November 30, 2007and 2006.
In 2005, the Company acquired investment securities available-for-sale and held-to-maturity of $5.5 millionand $6.8 million, respectively, with the acquisition of the PULSE business. In that same year, the Company soldthe investment securities at a net loss of $37 thousand. There were no other investment securities sold during theyears ended November 30, 2007, 2006 and 2005.
5. Loan Receivables
Loan receivables consist of the following (dollars in thousands):
November 30,
2007 2006
Loans held for sale:Domestic . . . . . . . . . . . . . . . . . . . . . . . . . . . . . . . . . . . . . . . . . . . . . . . . . . . . . . . . . . . . $ — $ 1,056,380International . . . . . . . . . . . . . . . . . . . . . . . . . . . . . . . . . . . . . . . . . . . . . . . . . . . . . . . . . — —
Total loans held for sale . . . . . . . . . . . . . . . . . . . . . . . . . . . . . . . . . . . . . . . . — 1,056,380Loan portfolio:
Credit cardDomestic . . . . . . . . . . . . . . . . . . . . . . . . . . . . . . . . . . . . . . . . . . . . . . . . . . . . . . . . 20,345,787 19,582,675International . . . . . . . . . . . . . . . . . . . . . . . . . . . . . . . . . . . . . . . . . . . . . . . . . . . . . 3,123,178 2,952,506
Total credit card . . . . . . . . . . . . . . . . . . . . . . . . . . . . . . . . . . . . . . . . . . . . . . 23,468,965 22,535,181Commercial loans
Domestic . . . . . . . . . . . . . . . . . . . . . . . . . . . . . . . . . . . . . . . . . . . . . . . . . . . . . . . . 234,136 59,089
Total commercial loans . . . . . . . . . . . . . . . . . . . . . . . . . . . . . . . . . . . . . . . . 234,136 59,089
Total credit card, including consumer and commercial . . . . . . . . . . . . . . . . 23,703,101 22,594,270Other consumer loans
Domestic . . . . . . . . . . . . . . . . . . . . . . . . . . . . . . . . . . . . . . . . . . . . . . . . . . . . . . . . 251,194 92,100International . . . . . . . . . . . . . . . . . . . . . . . . . . . . . . . . . . . . . . . . . . . . . . . . . . . . . — —
Total other consumer loans . . . . . . . . . . . . . . . . . . . . . . . . . . . . . . . . . . . . . 251,194 92,100
Total loan portfolio . . . . . . . . . . . . . . . . . . . . . . . . . . . . . . . . . . . . . . . . . . . . 23,954,295 22,686,370
Total loan receivables . . . . . . . . . . . . . . . . . . . . . . . . . . . . . . . . . . . . . . . . . . 23,954,295 23,742,750Allowance for loan losses
Domestic . . . . . . . . . . . . . . . . . . . . . . . . . . . . . . . . . . . . . . . . . . . . . . . . . . . . . . . . . . . . (759,925) (703,917)International . . . . . . . . . . . . . . . . . . . . . . . . . . . . . . . . . . . . . . . . . . . . . . . . . . . . . . . . . (156,919) (128,566)
Total allowance for loan losses . . . . . . . . . . . . . . . . . . . . . . . . . . . . . . . . . . (916,844) (832,483)
Net loan receivables . . . . . . . . . . . . . . . . . . . . . . . . . . . . . . . . . . . . . . . . . . . $23,037,451 $22,910,267
62

Proceeds from loan sales are as follows (dollars in thousands):
For the Years Ended November 30,
2007 2006 2005
Net proceeds from credit card securitizations . . . . . . . . . . . . . . . . . . . . . . $8,434,488 $8,740,325 $7,231,301Net proceeds from mortgage and installment loan sales . . . . . . . . . . . . . . 102,905 399,073 217,592
Net proceeds from loan sales . . . . . . . . . . . . . . . . . . . . . . . . . . . . . . . . . . $8,537,393 $9,139,398 $7,448,893
Activity in the allowance for loan losses is as follows (dollars in thousands):
For the Years Ended November 30,
2007 2006 2005
Balance at beginning of period . . . . . . . . . . . . . . . . . . . . . . . . . . . . . . . $ 832,483 $ 838,848 $ 942,721Additions:
Provision for loan losses . . . . . . . . . . . . . . . . . . . . . . . . . . . . . . . . 950,165 755,637 878,486Reserves acquired . . . . . . . . . . . . . . . . . . . . . . . . . . . . . . . . . . . . . — 55,499 —
Deductions:Charge-offs . . . . . . . . . . . . . . . . . . . . . . . . . . . . . . . . . . . . . . . . . . (1,060,876) (1,001,430) (1,144,356)Recoveries . . . . . . . . . . . . . . . . . . . . . . . . . . . . . . . . . . . . . . . . . . . 188,292 174,484 166,447
Net charge-offs . . . . . . . . . . . . . . . . . . . . . . . . . . . . . . . . . . . (872,584) (826,946) (977,909)Translation adjustments and other . . . . . . . . . . . . . . . . . . . . . . . . . . . . 6,780 9,445 (4,450)
Balance at end of period . . . . . . . . . . . . . . . . . . . . . . . . . . . . . . . . . . . . $ 916,844 $ 832,483 $ 838,848
Information regarding net charge-offs of interest and fee revenues on credit card loans is as follows (dollarsin thousands):
For the Years Ended November 30,
2007 2006 2005
Interest accrued subsequently charged off, net of recoveries(recorded as a reduction of interest income) . . . . . . . . . . . . . . . . . . . . . . . . . $204,886 $195,695 $227,054
Loan fees accrued subsequently charged off, net of recoveries(recorded as a reduction to loan fee income) . . . . . . . . . . . . . . . . . . . . . . . . . $ 83,294 $ 97,368 $121,791
Information regarding loan receivables that are over 90 days delinquent and accruing interest is as follows(dollars in thousands):
November 30,
2007 2006
Domestic . . . . . . . . . . . . . . . . . . . . . . . . . . . . . . . . . . . . . . . . . . . . . . . . . . . . . . . . . . . . . . . . $271,227 $244,669International . . . . . . . . . . . . . . . . . . . . . . . . . . . . . . . . . . . . . . . . . . . . . . . . . . . . . . . . . . . . . 49,438 38,997
Total loans over 90 days delinquent and accruing interest . . . . . . . . . . . . . . . . . . . . . . $320,665 $283,666
Information regarding loan receivables that are not accruing interest is as follows (dollars in thousands):
November 30,
2007 2006
Domestic . . . . . . . . . . . . . . . . . . . . . . . . . . . . . . . . . . . . . . . . . . . . . . . . . . . . . . . . . . . . . . . . $102,286 $110,486International . . . . . . . . . . . . . . . . . . . . . . . . . . . . . . . . . . . . . . . . . . . . . . . . . . . . . . . . . . . . . 118,572 143,435
Total loans not accruing interest . . . . . . . . . . . . . . . . . . . . . . . . . . . . . . . . . . . . . . . . . . $220,858 $253,921
63

6. Credit Card Securitization Activities
The Company’s retained interests in credit card asset securitizations include undivided seller’s interests,certificated beneficial interests, accrued interest receivable on securitized credit card receivables, cash collateralaccounts, servicing rights, the interest-only strip receivable and other retained interests. The undivided seller’sinterests are not certificated and are reported in loan receivables. The Company’s undivided seller’s interests rankpari passu with investors’ interests in the securitization trusts. The remaining retained interests are subordinate toinvestors’ interests, and as such, may not be realized by the Company if needed to absorb deficiencies in cashflows that are allocated to the investors of the trusts. Accrued interest receivable and certain other subordinatedretained interests are recorded in amounts due from asset securitization at amounts that approximate fair value.The Company receives annual servicing fees based on a percentage of the investor principal balance outstandingwhich are included in securitization income on the consolidated and combined statements of income. TheCompany does not recognize servicing assets or servicing liabilities for servicing rights since the servicing feeapproximates just adequate compensation to the Company for performing the servicing. The interest-only stripreceivable and cash collateral accounts are recorded in amounts due from asset securitization and reflected attheir estimated fair values. Changes in the fair value estimates are recorded in securitization income.Subordinated certificated beneficial interests totaled $0.3 billion at November 30, 2007 and are recorded ininvestment securities—available-for-sale. At November 30, 2007, the Company had $15.4 billion of retainedinterests, including $11.9 billion of undivided seller’s interests in credit card asset securitizations. AtNovember 30, 2006, the Company had $12.7 billion of retained interests, including $9.4 billion of undividedseller’s interests in credit card asset securitizations. The retained interests are subject to credit, payment andinterest rate risks on the transferred credit card receivables. The investors and the securitization trusts have norecourse to the Company’s other assets for failure of cardmembers to pay when due.
The following table summarizes amounts due from asset securitizations (dollars in thousands):
November 30,
2007 2006
Cash collateral accounts . . . . . . . . . . . . . . . . . . . . . . . . . . . . . . . . . . . . . . . $1,641,193 $1,816,003Accrued interest receivable . . . . . . . . . . . . . . . . . . . . . . . . . . . . . . . . . . . . . 573,998 520,232Interest-only strip receivable . . . . . . . . . . . . . . . . . . . . . . . . . . . . . . . . . . . . 400,313 337,752Other subordinated retained interests . . . . . . . . . . . . . . . . . . . . . . . . . . . . . 419,928 439,384Other . . . . . . . . . . . . . . . . . . . . . . . . . . . . . . . . . . . . . . . . . . . . . . . . . . . . . . 58,040 56,524
Amounts due from asset securitization . . . . . . . . . . . . . . . . . . . . . . . . $3,093,472 $3,169,895
During the years ended November 30, 2007, 2006 and 2005, the Company completed consumer credit cardasset securitizations of $8.4 billion, $8.7 billion and $7.2 billion, respectively, and recognized a net revaluation oftheir subordinated retained interests, principally the interest-only strip receivable, of $44.9 million, $159.4million and ($78.5) million, respectively, in securitization income in the consolidated and combined statementsof income. Securitized consumer credit card loans outstanding at November 30, 2007 and 2006, were $28.6billion and $26.7 billion, respectively.
Key economic assumptions used in measuring the interest-only strip receivable at the date of securitizationthat resulted from credit card securitizations completed were as follows:
For the Years Ended November 30,
2007 2006
Weighted average life (in months) . . . . . . . . . . . . . . . . . . . . . 4.7 – 5.0 3.7 – 4.7Payment rate (rate per month) . . . . . . . . . . . . . . . . . . . . . . . . 20.06% – 20.92% 19.69% – 21.58%Principal charge-offs (rate per annum) . . . . . . . . . . . . . . . . . 4.17% – 4.38% 4.57% – 5.23%Discount rate (rate per annum) . . . . . . . . . . . . . . . . . . . . . . . 11.00% 11.00%
64

Key economic assumptions and the sensitivity of the reported fair value of the interest-only strip receivableto immediate 10% and 20% adverse changes in those assumptions were as follows (dollars in millions):
November 30,
2007 2006
Interest-only receivable strip (carrying amount/fair value) . . . . . . . . . . . . . . . . . . . $ 400 $ 338Weighted average life (in months) . . . . . . . . . . . . . . . . . . . . . . . . . . . . . . . . . . . . . . 4.4 4.4Weighted average payment rate (rate per month) . . . . . . . . . . . . . . . . . . . . . . . . . . . 19.97% 21.44%
Impact on fair value of 10% adverse change . . . . . . . . . . . . . . . . . . . . . . . . . . $ (29) $ (27)Impact on fair value of 20% adverse change . . . . . . . . . . . . . . . . . . . . . . . . . . $ (54) $ (50)
Weighted average principal charge-offs (rate per annum) . . . . . . . . . . . . . . . . . . . . 4.56% 4.48%Impact on fair value of 10% adverse change . . . . . . . . . . . . . . . . . . . . . . . . . . $ (41) $ (39)Impact on fair value of 20% adverse change . . . . . . . . . . . . . . . . . . . . . . . . . . $ (81) $ (78)
Weighted average discount rate (rate per annum) . . . . . . . . . . . . . . . . . . . . . . . . . . . 12.00% 11.00%Impact on fair value of 10% adverse change . . . . . . . . . . . . . . . . . . . . . . . . . . $ (2) $ (1)Impact on fair value of 20% adverse change . . . . . . . . . . . . . . . . . . . . . . . . . . $ (4) $ (3)
The sensitivity analysis in the table above is hypothetical and should be used with caution. Changes in fairvalue based on a 10% or 20% variation in an assumption generally cannot be extrapolated because therelationship of the change in the assumption to the change in fair value may not be linear. Also, the effect of avariation in a particular assumption on the fair value of the interest-only strip receivable is calculatedindependent of changes in any other assumption; in practice, changes in one factor may result in changes inanother (for example, increases in market interest rates may result in lower payments and increased charge-offs),which might magnify or counteract the sensitivities. In addition, the sensitivity analysis does not consider anycorrective action that the Company may take to mitigate the impact of any adverse changes in the keyassumptions.
The table below summarizes certain cash flows received from the securitization master trusts (dollars inmillions):
For the Years EndedNovember 30,
2007 2006 2005
Proceeds from third-party investors in new credit card securitizations . . . . . . . . . . $ 8,434 $ 8,727 $ 7,231Proceeds from collections reinvested in previous credit card securitizations . . . . . $62,941 $60,947 $54,947Contractual servicing fees received . . . . . . . . . . . . . . . . . . . . . . . . . . . . . . . . . . . . . $ 569 $ 536 $ 558Cash flows received from retained interests . . . . . . . . . . . . . . . . . . . . . . . . . . . . . . $ 2,495 $ 2,336 $ 2,291
65

The table below presents quantitative information about delinquencies, net principal charge-offs andcomponents of managed credit card loans, including securitized loans (dollars in millions):
November 30, 2007For the Year EndedNovember 30, 2007
LoansOutstanding
LoansDelinquent
AverageLoans
NetPrincipal
Charge-offs
Managed credit card loans . . . . . . . . . . . . . . . . . . . . . . . . . . . . . . $52,302 $1,949 $51,338 $2,093Less: Securitized credit card loans . . . . . . . . . . . . . . . . . . . . . . . 28,599 1,120 28,524 1,221
Owned credit card loans . . . . . . . . . . . . . . . . . . . . . . . . . . . . . . . $23,703 $ 829 $22,814 $ 872
November 30, 2006For the Year EndedNovember 30, 2006
LoansOutstanding
LoansDelinquent
AverageLoans
NetPrincipal
Charge-offs
Managed credit card loans . . . . . . . . . . . . . . . . . . . . . . . . . . . . . . $50,350 $1,763 $48,216 $1,967Less: Securitized credit card loans . . . . . . . . . . . . . . . . . . . . . . . 26,703 1,003 26,560 1,146
Owned credit card loans . . . . . . . . . . . . . . . . . . . . . . . . . . . . . . . $23,647 $ 760 $21,656 $ 821
7. Premises and Equipment
A summary of premises and equipment, net is as follows (dollars in thousands):
November 30, 2007
2007 2006
Land . . . . . . . . . . . . . . . . . . . . . . . . . . . . . . . . . . . . . . . . . . . . . . . . . . . . . . . $ 44,592 $ 44,531Buildings and improvements . . . . . . . . . . . . . . . . . . . . . . . . . . . . . . . . . . . . 539,103 525,900Capitalized equipment leases . . . . . . . . . . . . . . . . . . . . . . . . . . . . . . . . . . . 7,924 7,924Furniture, fixtures and equipment . . . . . . . . . . . . . . . . . . . . . . . . . . . . . . . . 461,753 411,178Software . . . . . . . . . . . . . . . . . . . . . . . . . . . . . . . . . . . . . . . . . . . . . . . . . . . 306,084 275,441
Premises and equipment . . . . . . . . . . . . . . . . . . . . . . . . . . . . . . . . . . . 1,359,456 1,264,974Less: Accumulated depreciation . . . . . . . . . . . . . . . . . . . . . . . . . . . . . . . . . (511,829) (454,425)Less: Accumulated amortization of software . . . . . . . . . . . . . . . . . . . . . . . (189,135) (149,649)
Premises and equipment, net . . . . . . . . . . . . . . . . . . . . . . . . . . . . . . . . $ 658,492 $ 660,900
Depreciation expense, including amortization of assets recorded under capital leases, was $84.3 million,$87.0 million and $90.3 million for the years ended November 30, 2007, 2006 and 2005, respectively.Amortization expense on capitalized software was $38.6 million, $26.2 million and $22.6 million for the yearsended November 30, 2007, 2006 and 2005, respectively.
The Company has premises and equipment located in the United Kingdom with net book values of $83.3million and $67.8 million at November 30, 2007 and 2006, respectively. The Company’s remaining premises andequipment are located in the United States.
8. Business Combinations and Other Acquisitions
Liverpool Victoria. On May 13, 2006 and August 1, 2006, the Company acquired certain credit card assetsin the United Kingdom from financial services company Liverpool Victoria. The aggregate acquisition price wasapproximately $178.5 million, which was paid in cash during the year ended November 30, 2006. The Companyrecorded PCCRs of $7.1 million in connection with the acquisition. The acquisition of the Liverpool Victoria
66

portfolios, included within the International Card segment, was not significant to the Company’s consolidatedand combined results of operations or cash flows for the year ended November 30, 2006.
Goldfish. On February 17, 2006, the Company acquired the Goldfish credit card business in the UnitedKingdom from Lloyds TSB Group Plc. Since the acquisition date, the results of operations and cash flows ofGoldfish have been included in the Company’s consolidated and combined results of operations and cash flowswithin the International Card segment. The acquisition price was approximately $1.7 billion, which was fundedfrom excess capital and was paid in cash during February 2006. The Company recorded goodwill of $246.3million, PCCRs of $53.2 million and trade name intangibles of $69.1 million in connection with the acquisition.The pro forma impact of the acquisition of Goldfish was not significant to the Company’s consolidated andcombined results of operations or cash flows for the year ended November 30, 2006.
The following table summarizes the fair values of the assets acquired and the liabilities assumed at the dateof the Goldfish acquisition (dollars in thousands):
AtFebruary 17,
2006
Consumer loans . . . . . . . . . . . . . . . . . . . . . . . . . . . . . . . . . . . . . . . . . . . . . . . . . . . . . . . . . . $1,304,074Goodwill(1) . . . . . . . . . . . . . . . . . . . . . . . . . . . . . . . . . . . . . . . . . . . . . . . . . . . . . . . . . . . . . . 246,264Amortizable intangible assets . . . . . . . . . . . . . . . . . . . . . . . . . . . . . . . . . . . . . . . . . . . . . . . 122,294Other assets . . . . . . . . . . . . . . . . . . . . . . . . . . . . . . . . . . . . . . . . . . . . . . . . . . . . . . . . . . . . . 19,842
Total assets acquired . . . . . . . . . . . . . . . . . . . . . . . . . . . . . . . . . . . . . . . . . . . . . . . . . . 1,692,474Total liabilities assumed . . . . . . . . . . . . . . . . . . . . . . . . . . . . . . . . . . . . . . . . . . . . . . . 29,502
Net assets acquired . . . . . . . . . . . . . . . . . . . . . . . . . . . . . . . . . . . . . . . . . . . . . . . $1,662,972
(1) All of the goodwill acquired is expected to be deductible by the Company for income tax purposes.
In 2005, the Company acquired PULSE EFT Association, which is included in the Third-Party Paymentssegment, and recorded goodwill and intangibles related to this acquisition at that time.
There were no acquisitions completed by the Company during the year ended November 30, 2007.
9. Goodwill
Goodwill was recognized by the Company upon its acquisitions of both PULSE and Goldfish. See Note 8:Business Combinations and Other Acquisitions for further detail on the Goldfish acquisition.
The following table presents changes to goodwill by segment (dollars in thousands):
U.S. CardInternational
CardThird-Party
Payments Total
November 30, 2005 . . . . . . . . . . . . . . . . . . . . . . . . . . . . . . . . . . . $ — $ — $255,421 $255,421Acquisitions . . . . . . . . . . . . . . . . . . . . . . . . . . . . . . . . . . . . . . . . . — 246,264 — 246,264Translation adjustments . . . . . . . . . . . . . . . . . . . . . . . . . . . . . . . . — 32,043 — 32,043
November 30, 2006 . . . . . . . . . . . . . . . . . . . . . . . . . . . . . . . . . . . $ — $ 278,307 $255,421 $533,728Translation adjustments . . . . . . . . . . . . . . . . . . . . . . . . . . . . . . . . — 12,854 — 12,854Impairment . . . . . . . . . . . . . . . . . . . . . . . . . . . . . . . . . . . . . . . . . . — (291,161) — (291,161)
November 30, 2007 . . . . . . . . . . . . . . . . . . . . . . . . . . . . . . . . . . . $ — $ — $255,421 $255,421
67

During the fourth quarter of 2007, the International Card segment recorded a non-cash impairment charge togoodwill of $291 million. The impairment charge is recorded as a component of total other expense in theaccompanying consolidated and combined statements of income.
In August 2007, management began a strategic review of the International Card segment. This review,which was completed in the fourth quarter, involved consideration of industry trends in the United Kingdom, thevarious challenges facing credit card issuers in that market, the impact of certain initiatives already undertakenby the Company to restore profitability in the segment and the expected impact of additional actions planned inlight of these circumstances. As a result of the strategic review, management revised its long-range projectionsfor the International Card segment, and these projections were used as the basis for a revised estimate of thesegment’s fair value.
The fair value of the segment was estimated using a discounted cash flow method that incorporated therevised long-range projections and an estimated terminal value. This valuation methodology incorporatesassumptions about the amount and timing of future cash flows, discount rates and other factors that are inherentlyuncertain and judgmental in nature.
The International Card segment comprises a single reporting unit for purposes of goodwill allocation underStatement No. 142. The carrying value of this reporting unit was in excess of its revised estimated fair value,indicating that goodwill was impaired. Based on evaluation of the estimated fair values of the individual assetsand liabilities of the reporting unit, management concluded that goodwill had an implied fair value of zero andaccordingly, the $291 million carrying value of goodwill associated with this reporting unit was written off.
10. Other Intangible Assets
The Company’s amortizable intangible assets consist primarily of acquired customer relationships and tradename intangibles recognized in the acquisitions of PULSE in January 2005 and the Goldfish credit card businessin February 2006. Acquired customer relationships consist of PCCRs and other acquired customer relationships.PCCRs consist of the cardholder relationships acquired as part of the acquisitions of the Goldfish business andthe Liverpool Victoria portfolios. Other acquired customer relationships consist of those relationships inexistence between PULSE and the numerous financial institutions that participate in its network, as valued at thedate of the Company’s acquisition of PULSE. See Note 8: Business Combinations and Other Acquisitions forfurther detail.
During the fourth quarter of 2007, the International Card segment recorded a non-cash impairment charge tointangible assets of $100 million. The impairment charge is recorded as a component of total other expense in theaccompanying consolidated and combined statements of income.
In conjunction with the strategic review completed in the fourth quarter related to the International Cardsegment, management evaluated the PCCRs and trade name intangibles associated with this segment todetermine whether the carrying values of those assets were recoverable from the estimated future cash flowsindicated by the revised long-term projections. Recoverability of an amortizable intangible asset is determined bycomparing the carrying value of the asset to the sum of the undiscounted future cash flows expected to be derivedfrom the use of the asset. Pursuant to Statement No. 142, if the carrying value exceeds the sum of theundiscounted cash flows, the asset is deemed to be not recoverable and must be written down to its estimated fairvalue. Fair value for PCCRs is estimated using the expected stream of future cash flows discounted at a ratecommensurate with the risk associated with such cash flows. Fair value for trade name intangibles is estimatedusing a relief from royalty method, which applies an assumed royalty rate to the estimated revenues to begenerated from the use of the asset to approximate the costs saved by the owner of the trade name who wouldotherwise have to pay for its use. The cash flow stream derived by this method is then discounted at a ratecommensurate with the risk associated with such cash flows to estimate the fair value of the asset. Based on those
68

evaluations, neither asset group was deemed to be entirely recoverable from expected future cash flows andaccordingly, each was written down to its estimated fair value. These write-downs, totaling $100 million beforetaxes, consisted of $45 million related to PCCRs and $55 million related to trade name intangibles.
The following table summarizes the Company’s other intangible assets (dollars in thousands):
November 30, 2007 November 30, 2006
GrossCarryingAmount
AccumulatedAmortization
Net BookValue
GrossCarryingAmount
AccumulatedAmortization
Net BookValue
Customer relationships . . . . . . . . . . . . . $ 94,808 $25,133 $69,675 $136,937 $13,851 $123,086Trade names/other . . . . . . . . . . . . . . . . . 34,643 6,275 28,368 80,748 2,657 78,091
Intangible assets . . . . . . . . . . . . . . . . . . $129,451 $31,408 $98,043 $217,685 $16,508 $201,177
Amortization expense related to the Company’s intangible assets was $14.4 million, $11.0 million and $5.5million for the years ended November 30, 2007, 2006 and 2005, respectively. Changes in foreign currencyexchange rates impacted the value of other intangible assets related to the Company’s International Card segmentby an increase of approximately $11.2 million and $16.2 million during the years ended November 30, 2007 and2006, respectively.
The following table presents expected intangible asset amortization expense for the next five years based onintangible assets at November 30, 2007 (dollars in thousands):
Year Amount
2008 . . . . . . . . . . . . . . . . . . . . . . . . . . . . . . . . . . . . . . . . . . . . . . $9,4112009 . . . . . . . . . . . . . . . . . . . . . . . . . . . . . . . . . . . . . . . . . . . . . . $9,3532010 . . . . . . . . . . . . . . . . . . . . . . . . . . . . . . . . . . . . . . . . . . . . . . $9,6492011 . . . . . . . . . . . . . . . . . . . . . . . . . . . . . . . . . . . . . . . . . . . . . . $9,4162012 . . . . . . . . . . . . . . . . . . . . . . . . . . . . . . . . . . . . . . . . . . . . . . $8,472
11. Deposits
The Company’s deposits consist of brokered and direct certificates of deposits, money market depositaccounts, and, to a lesser degree, deposits payable upon demand. All interest-bearing deposit accounts arederived from the domestic operations. A summary of interest-bearing deposit accounts is as follows (dollars inthousands):
November 30,
2007 2006(1)
Certificates of deposit in amounts less than $100,000 . . . . . . . . $19,385,024 $ 9,633,351Certificates of deposit in amounts of $100,000 or greater . . . . . 775,717 671,996Savings deposits, including money market deposit accounts . . . 4,482,776 2,933,480
Total interest-bearing deposits . . . . . . . . . . . . . . . . . . . . . . $24,643,517 $13,238,827
Average annual interest rate . . . . . . . . . . . . . . . . . . . . . . . . . . . . 5.18% 4.68%
(1) Certain balances in 2006 have been reclassified to reflect clarifying bank regulatory guidance.
At November 30, 2006, money market deposit accounts included $1.9 billion of amounts obtained throughthe Morgan Stanley Global Wealth Management Bank Deposit Program. As of November 30, 2007 thesedeposits were zero. See Note 26: Related Party Transactions for further information on this arrangement.Beginning in the second quarter of 2007, Discover Bank entered into similar arrangements with various otherbrokers. At November 30, 2007 money market deposits include $2.9 billion of amounts obtained through theserelationships.
69

At November 30, 2007 and 2006, non-interest bearing deposit accounts included $14.1 million and $28.7million, respectively, derived from the Company’s U.K. operations.
At November 30, 2007, certificates of deposit maturing over the next five years and thereafter were asfollows (dollars in thousands):
Year Amount
2008 . . . . . . . . . . . . . . . . . . . . . . . . . . . . . . . . . . . . . . . . . . . $9,872,4372009 . . . . . . . . . . . . . . . . . . . . . . . . . . . . . . . . . . . . . . . . . . . $4,312,3362010 . . . . . . . . . . . . . . . . . . . . . . . . . . . . . . . . . . . . . . . . . . . $2,463,9062011 . . . . . . . . . . . . . . . . . . . . . . . . . . . . . . . . . . . . . . . . . . . $ 832,2192012 . . . . . . . . . . . . . . . . . . . . . . . . . . . . . . . . . . . . . . . . . . . $1,498,888Thereafter . . . . . . . . . . . . . . . . . . . . . . . . . . . . . . . . . . . . . . $1,180,955
12. Short-Term Borrowings
Short-term borrowings consist of term and overnight Federal Funds purchased and other short-termborrowings with original maturities less than one year. The following table identifies the balances and weightedaverage interest rates on short-term borrowings outstanding at period end (dollars in thousands):
November 30, 2007 November 30, 2006
Amount
WeightedAverageInterest
Rate Amount
WeightedAverageInterest
Rate
Domestic:Overnight Federal Funds purchased . . . . . . . . . . . . . . . . . . . $ 250,000 4.68% $3,000,000 5.31%Term Federal Funds purchased . . . . . . . . . . . . . . . . . . . . . . . — — 100,000 5.35%Other short-term borrowings . . . . . . . . . . . . . . . . . . . . . . . . . — — 1,811,124 5.46%
International:Other short-term borrowings . . . . . . . . . . . . . . . . . . . . . . . . . 2,925,426 6.11% 1,828,554 5.25%
Total short-term borrowings . . . . . . . . . . . . . . . . . . . . . . . . . $3,175,426 5.99% $6,739,678 5.34%
The following table identifies the interest expense paid on short-term borrowings (dollars in thousands):
For the Years Ended November 30,
2007 2006 2005
Domestic:Overnight Federal Funds purchased . . . . . . . . . . . . . . . . . . . . . . . . . . . . . . $ 29,840 $ 15,187 $ 183Term Federal Funds purchased . . . . . . . . . . . . . . . . . . . . . . . . . . . . . . . . . 23,463 18,534 13,344Other short-term borrowings . . . . . . . . . . . . . . . . . . . . . . . . . . . . . . . . . . . 36,009 83,741 49,159
International:Other short-term borrowings . . . . . . . . . . . . . . . . . . . . . . . . . . . . . . . . . . . 142,885 76,258 44,799
Total interest expense on short-term borrowings . . . . . . . . . . . . . . . . . . . . $232,197 $193,720 $107,485
On June 20, 2007, the Company received proceeds of $2.7 billion related to the issuance of debt byunrelated conduit providers. The transaction was structured as a borrowing secured by the performance of theowned credit card receivables of the International Card segment. The financing arrangement which has a flexibleterm of up to 364 days, facilitated the pay down of short-term and long-term borrowings with Morgan Stanley.As of November 30, 2007, the balance of this structured secured borrowing was $2.9 billion and the remainingavailable financing was approximately $0.8 billion.
70

Short-term borrowings as of November 30, 2006 include certain short-term borrowings from MorganStanley. Prior to the Distribution, the Company repaid all outstanding balances with Morgan Stanley. SeeNote 26: Related Party Transactions herein for further disclosure concerning transactions with Morgan Stanley.
13. Long-Term Borrowings
Long-term borrowings consist of borrowings and capital leases having original maturities of one year ormore. The following table provides a summary of the Company’s long-term borrowings and weighted averageinterest rates on balances outstanding at period end (dollars in thousands):
November 30, 2007 November 30, 2006
Amount
WeightedAverage Interest
Rate Amount
WeightedAverage Interest
Rate
Domestic:Bank notes . . . . . . . . . . . . . . . . . . . . . . . . . . . . . $ 249,856 5.03% $ 249,737 5.30%Secured borrowings . . . . . . . . . . . . . . . . . . . . . . 1,080,063 5.67% — —Unsecured borrowings . . . . . . . . . . . . . . . . . . . . 799,222 6.34% 563,579 6.18%Capital lease obligations . . . . . . . . . . . . . . . . . . 4,952 6.26% 6,179 6.28%
International:Unsecured borrowings . . . . . . . . . . . . . . . . . . . . — — 688,083 4.77%
Total long-term borrowings . . . . . . . . . . . . . . . . $2,134,093 5.85% $1,507,578 5.39%
Bank notes are issued from the Global Bank Note Program established by Discover Bank with an issuingcapacity of $5 billion. As such, they represent direct, unconditional, unsecured obligations of Discover Bank orthe Company. At November 30, 2007 and November 30, 2006, there was approximately $250 million par valueof floating-rate bank notes outstanding. Interest on the notes is paid quarterly and is assessed at 15 basis pointsover the three-month London Interbank Offered Rate (“LIBOR”) and the notes mature in February 2009.
On June 15, 2007, the Company borrowed $1.3 billion from an unrelated conduit provider, the fullrepayment of which is dependent upon the available balances of the cash collateral accounts at the maturities ofunderlying securitization transactions. The financing has a term of approximately 3.5 years and a cost ofapproximately 50 basis points over the commercial paper rate.
On June 12, 2007, the Company received proceeds on the issuance of $800 million par value of unsecureddebt to external third parties. The financing is comprised of $400 million having a three-year maturity with aspread of 53 basis points over LIBOR and $400 million with a ten-year maturity with a fixed coupon of 6.45%.
Maturities. Long-term borrowings had the following maturities at November 30, 2007 (dollars inthousands):
Amount
Due in 2008 . . . . . . . . . . . . . . . . . . . . . . . . . . . . . . . . . . . . . . . . . . . . . . . . . . . . . $ 398,912Due in 2009 . . . . . . . . . . . . . . . . . . . . . . . . . . . . . . . . . . . . . . . . . . . . . . . . . . . . . 405,458Due in 2010 . . . . . . . . . . . . . . . . . . . . . . . . . . . . . . . . . . . . . . . . . . . . . . . . . . . . . 623,410Due in 2011 . . . . . . . . . . . . . . . . . . . . . . . . . . . . . . . . . . . . . . . . . . . . . . . . . . . . . 307,091Due in 2012 . . . . . . . . . . . . . . . . . . . . . . . . . . . . . . . . . . . . . . . . . . . . . . . . . . . . . —Thereafter . . . . . . . . . . . . . . . . . . . . . . . . . . . . . . . . . . . . . . . . . . . . . . . . . . . . . . 399,222
Total . . . . . . . . . . . . . . . . . . . . . . . . . . . . . . . . . . . . . . . . . . . . . . . . . . . . . . $2,134,093
The Company negotiated a 59-month $2.5 billion unsecured credit agreement that became effective July 2,2007. The credit agreement provides for a revolving credit commitment of up to $2.5 billion (of which theCompany may borrow up to 30%, and Discover Bank may borrow up to 100%, of the revolving credit
71

commitment). The credit agreement provides for a commitment fee on the unused portion of the facility, whichcan range from 0.07% to 0.175% depending on the index debt ratings. Loans outstanding under the credit facilitybear interest at a margin above the Federal Funds rate, LIBOR, the EURIBO rate or the Euro Reference rate. Theterms of the credit agreement include various affirmative and negative covenants, including financial covenantsrelated to the maintenance of certain capitalization and tangible net worth levels, and certain double leverage,delinquency and tier 1 capital to managed loans ratios. The credit agreement also includes customary events ofdefault with corresponding grace periods, including, without limitation, payment defaults, cross-defaults to otheragreements evidencing indebtedness for borrowed money and bankruptcy-related defaults. The commitmentsmay be terminated upon an event of default. As of November 30, 2007, the Company had not drawn down any ofthe outstanding credit.
14. Employee Compensation Plans
Conversion of Existing Awards Under Morgan Stanley Plans. Prior to the Distribution, all employee stock-based compensation awards were granted by Morgan Stanley. Participation by Discover employees in theMorgan Stanley Employee Stock Purchase Plan ceased in connection with the Distribution. In addition, at thetime of the Distribution, 270 individual holders of Morgan Stanley restricted stock units (“RSUs”) and optionswho were current employees of Discover had their awards converted into newly issued Company RSUs andoptions pursuant to a formula that was intended to preserve the intrinsic value of the pre-Distribution RSUs andoptions. The Company’s stock-based compensation awards issued upon completion of the conversion of existingMorgan Stanley equity awards into Discover equity awards on this date and the related weighted-average grant-date fair value is presented below:
Shares Converted upon DistributionNumber of
Shares
Weighted-Average Grant
Date Fair Value(1)
Stock options . . . . . . . . . . . . . . . . . . . . . . . . . . . . . . . . . . . . . . . . . . . . . . . . . . . . . . . . 5,223,738 $11.33Restricted stock units . . . . . . . . . . . . . . . . . . . . . . . . . . . . . . . . . . . . . . . . . . . . . . . . . 3,832,871 $20.14
(1) For stock options, amount includes incremental cost related to the modification of awards upon conversion (see discussion below forfurther details).
The conversion of all existing Morgan Stanley stock-based compensation awards into Discover awards wasconsidered a modification of these awards in accordance with Statement No. 123R. As a result, Discovercompared the fair value of the stock option award immediately prior to the Distribution to the fair value of theaward immediately after the Distribution to measure the incremental compensation cost. This resulted in therecognition of a one-time incremental expense of $1.3 million, which was recorded during the quarter endedAugust 31, 2007.
Stock Compensation Plans. Prior to and in connection with the Distribution, the Company adopted threestock-based compensation plans: the Discover Financial Services Omnibus Incentive Plan, the DiscoverFinancial Services Directors’ Compensation Plan and the Discover Financial Services Employee Stock PurchasePlan. On July 2, 2007, the Company issued “Founder’s Grants” of RSUs to certain directors, executive officersand employees of the Company in the aggregate amount of $134.1 million which are subject to various vestingterms of up to four years. In connection with these awards, the Company recognized expense of $23.5 million,net of estimated forfeitures, for the fiscal year ended November 30, 2007.
On July 27, 2007, Discover stock was offered to employees of the Company’s business in the UnitedKingdom through a Share Incentive Plan offered by Gold Card Bank Limited in the aggregate amount of $2.1million subject to various vesting terms over the next three years. In connection with these awards, the Companyrecognized expense of $0.4 million, for the year ended November 30, 2007.
The total compensation cost that has been charged against income for all of the above plans was $28.8million for the period from July 2, 2007 to November 30, 2007. The total income tax benefit recognized in theincome statement for stock-based compensation arrangements was $10.7 million for the period from July 2, 2007
72

to November 30, 2007. The following tables detail the compensation cost, net of forfeitures, related to each of theabove plans, as well as those costs (in thousands) allocated by Morgan Stanley prior to the Distribution:
For the Year Ended November 30,
2007 2006(1) 2005
Restricted stock units . . . . . . . . . . . . . . . . . . . . . . . . . . . . . . . . . . . . . . . . . . . . . . . $41,865 $27,729 $12,112Stock options . . . . . . . . . . . . . . . . . . . . . . . . . . . . . . . . . . . . . . . . . . . . . . . . . . . . . 3,028 2,873 3,076Employee stock purchase plan . . . . . . . . . . . . . . . . . . . . . . . . . . . . . . . . . . . . . . . . 540 716 714
Total . . . . . . . . . . . . . . . . . . . . . . . . . . . . . . . . . . . . . . . . . . . . . . . . . . . . . . . . $45,433 $31,318 $15,902
(1) Includes $7.1 million of accrued stock-based compensation expense for Morgan Stanley equity awards granted to the Company’sretirement-eligible employees in December 2005.
Pre-DistributionPeriod fromDecember 1,
2006 to June 30,2007
Post-DistributionPeriod from
July 1, 2007 toNovember 30,
2007 Total
Restricted stock units . . . . . . . . . . . . . . . . . . . . . . . . . . . . . . . . . . . . . . . . $14,926 $26,939 $41,865Stock options . . . . . . . . . . . . . . . . . . . . . . . . . . . . . . . . . . . . . . . . . . . . . . 1,176 1,852 3,028Employee stock purchase plan . . . . . . . . . . . . . . . . . . . . . . . . . . . . . . . . . 540 — 540
Total . . . . . . . . . . . . . . . . . . . . . . . . . . . . . . . . . . . . . . . . . . . . . . . . . $16,642 $28,791 $45,433
Omnibus Incentive Plan. The Discover Financial Services Omnibus Incentive Plan (“Omnibus Plan”),which is stockholder-approved, provides for the award of stock options, stock appreciation rights, restrictedstock, RSUs and other stock-based and/or cash awards (collectively, “Awards”). The total number of shares thatmay be granted is 45 million shares, subject to adjustments for certain transactions as described in the OmnibusPlan document. Shares granted under the Omnibus Plan may be authorized but unissued shares or treasury sharesthat the Company acquires in the open market, in private transactions or otherwise.
Option awards are generally granted with an exercise price equal to the fair market value of one Discovershare at the date of grant; these types of awards expire ten years from the grant date and may be subject torestrictions on transfer, vesting requirements or cancellation under specified circumstances. Similarly, stockawards also may be subject to similar restrictions determined at the time of grant under this plan. Certain optionand stock awards provide for accelerated vesting if there is a change in control or upon certain terminations (asdefined in the Omnibus Plan).
Directors’ Compensation Plan. The Discover Financial Services Directors’ Compensation Plan (the“Directors’ Compensation Plan”), which is stockholder-approved, permits the grant of retainers and RSUs tonon-employee directors. The total number of units available for grant under the Directors’ Compensation Planequals the excess, if any, of (i) 500,000 shares over (ii) the sum of (a) the number of shares subject to outstandingawards granted under the Directors’ Compensation Plan and (b) the number of shares previously issued pursuantto the Directors’ Compensation Plan. Shares of stock that are issuable pursuant to the awards granted under theDirectors’ Compensation Plan shall be authorized and unissued shares, treasury shares or shares of stockpurchased by, or on behalf of, the Company in open-market transactions.
A person that became an eligible director prior to December 31, 2007 was entitled to receive a number ofRSUs equal to the number obtained by dividing $350,000 by the fair market value of a share of stock on the dateof grant. However, if such person is elected or appointed as a director after the date of the spin-off of Discoverfrom Morgan Stanley, this initial award is prorated for the two-year period following the Distribution.Subsequent awards for eligible directors will be obtained by dividing $125,000 by the fair market value of ashare of stock on the date of grant. The initial RSUs will be subject to a restriction period whereby 50% of suchunits shall vest on the first anniversary of the date of grant and the remaining units shall vest on the secondanniversary of the date of grant. Subsequent awards will be subject to a restriction period whereby 100% of suchunits shall vest on the first anniversary of the date of grant.
73

Employee Stock Purchase Plan. Prior to the Distribution, employees of the Company were allowed topurchase shares of Morgan Stanley common stock at a 15% discount from market value through MorganStanley’s Employee Stock Purchase Plan (“ESPP”). The Company expensed the 15% discount associated withthe ESPP. The Company adopted the Discover Financial Services Employee Stock Purchase Plan in connectionwith the Distribution, but did not implement the plan in 2007.
Stock Option Activity. The following table sets forth the activity concerning stock option activity as ofJuly 2, 2007, and changes during the year ended November 30, 2007:
Number ofShares
Weighted-AverageExercise
Price
Weighted-Average
RemainingContractual
Term(in years)
AggregateIntrinsic Value(in thousands)
Options outstanding at July 2, 2007 . . . . . . . . . . . . . . . . . . . . . 5,223,738 $19.35Granted . . . . . . . . . . . . . . . . . . . . . . . . . . . . . . . . . . . . . . . . . . . —Exercised . . . . . . . . . . . . . . . . . . . . . . . . . . . . . . . . . . . . . . . . . (80,992) $ 9.64Canceled . . . . . . . . . . . . . . . . . . . . . . . . . . . . . . . . . . . . . . . . . . (633) $20.73
Options outstanding at November 30, 2007 . . . . . . . . . . . . . . . 5,142,113 $19.50 5.2 $2,850
Vested and expected to vest at November 30, 2007 . . . . . . . . 5,075,026 $19.50 5.2 $2,850Options exercisable at November 30, 2007 . . . . . . . . . . . . . . . 4,247,609 $19.43 4.8 $2,848
No stock options were granted in the period from July 2, 2007 to November 30, 2007. As of November 30,2007, there was $1.3 million of total unrecognized compensation cost related to non-vested stock options grantedunder the Company’s Omnibus Plan. The cost is expected to be recognized over a total period of 2.5 years and aweighted-average period of 0.7 years. The total intrinsic value of options exercised during this period was $0.9million. The related excess tax benefit for the period was not material.
Prior to the Distribution, the Company utilized the Black-Scholes pricing model to estimate the fair value ofeach option as of its date of grant. The fair value is amortized on a straight-line basis over the requisite serviceperiods of the awards, which is generally the vesting period. Use of a valuation model requires management tomake certain assumptions with respect to selected model inputs. Prior to the Distribution, the expected option lifeof stock options and the expected dividend yield of stock were determined based upon Morgan Stanley’shistorical experience. Also, prior to the Distribution, the expected stock price volatility had been determinedbased upon Morgan Stanley’s historical stock price data over a time period similar to the expected option life.The risk-free interest rate is based on U.S. Treasury Strips with a remaining term equal to the expected lifeassumed at the date of grant. These assumptions are not necessarily indicative of future assumptions orexperience.
Restricted Stock Unit Activity. The following table sets forth the activity concerning vested and unvestedRSUs as of July 2, 2007, and changes during the year ended November 30, 2007:
Number ofShares
Weighted-AverageGrant-DateFair Value
Restricted stock units at July 2, 2007 . . . . . . . . . . . . . . . . . . . . . . . . . . . . . . . . . . . . 3,832,871 $20.14Granted . . . . . . . . . . . . . . . . . . . . . . . . . . . . . . . . . . . . . . . . . . . . . . . . . . . . . . . . . . . 4,868,223 $27.80Conversions to common stock . . . . . . . . . . . . . . . . . . . . . . . . . . . . . . . . . . . . . . . . . . (355,404) $14.83Canceled . . . . . . . . . . . . . . . . . . . . . . . . . . . . . . . . . . . . . . . . . . . . . . . . . . . . . . . . . . (106,416) $27.57
Restricted stock units at November 30, 2007 . . . . . . . . . . . . . . . . . . . . . . . . . . . . . . 8,239,274 $24.80
74

The following table sets forth the activity concerning unvested restricted stock units as of July 2, 2007, andchanges during the year ended November 30, 2007:
Number ofShares
Weighted-AverageGrant-Date Fair
Value
Unvested restricted stock units at July 2, 2007 . . . . . . . . . . . . . . . . . . . . . . . . . . . . . 2,168,052 $21.17Granted . . . . . . . . . . . . . . . . . . . . . . . . . . . . . . . . . . . . . . . . . . . . . . . . . . . . . . . . . . . 4,868,223 $27.80Vested . . . . . . . . . . . . . . . . . . . . . . . . . . . . . . . . . . . . . . . . . . . . . . . . . . . . . . . . . . . . (18,409) $21.50Canceled . . . . . . . . . . . . . . . . . . . . . . . . . . . . . . . . . . . . . . . . . . . . . . . . . . . . . . . . . . (106,416) $27.57
Unvested restricted stock units at November 30, 2007 (1) . . . . . . . . . . . . . . . . . . . . . 6,911,450 $25.74
(1) Unvested restricted stock units represent awards where recipients have yet to satisfy either explicit vesting terms or retirement-eligibilityrequirements.
The fair value of restricted stock units is determined based on the number of units granted and the fair valueon the date of grant. The total fair value of RSUs vested during the period from July 2, 2007 to November 30,2007 was $0.4 million. As of November 30, 2007, there was $117.7 million of total unrecognized compensationcost related to non-vested RSUs granted. The cost is expected to be recognized over a total period of 4.1 yearsand a weighted-average period of 1.05 years.
Discover 401(k) Awards (Pre-Distribution—Morgan Stanley 401(k) Awards). Eligible U.S. employees ofthe Company receive 401(k) matching contributions under the Discover 401(k) Plan. Prior to the Distribution,eligible U.S. employees of Discover participated in the Morgan Stanley 401(k) Plan, which included 401(k)matching contributions to eligible employees. The pretax expense associated with the 401(k) match related to theCompany’s employees for the years ended November 30, 2007, 2006 and 2005 was $17.0 million, $14.8 million,and $14.6 million, respectively.
15. Employee Benefit Plans
The Company sponsors defined benefit pension and other postretirement plans for its eligible U.S.employees. The Company also sponsors a separate defined contribution pension plan that covers substantially allof its non-U.S. employees. The following discussion summarizes these plans.
Defined Benefit Pension and Other Postretirement Plans. The Company sponsors the Discover FinancialServices Pension Plan for eligible employees in the U.S., which is a non-contributory defined benefit plan that isqualified under Section 401(a) of the Internal Revenue Code (the “Qualified Plan”). The Company also sponsorsan unfunded supplementary plan (the “Supplemental Plan”) that covers certain executives. These pension plansgenerally provide pension benefits that are based on each employee’s years of credited service and oncompensation levels specified in the plans. For the Qualified Plan, the Company’s policy is to fund at least theamounts sufficient to meet minimum funding requirements under the Employee Retirement Income Security Actof 1974 (“ERISA”). Liabilities for benefits payable under the Supplemental Plan are accrued by the Companyand are funded when paid to the beneficiaries. All information related to pensions in this footnote is presented onan aggregate basis, unless otherwise specified.
The Company also participates in an unfunded postretirement benefit plan that provides medical and lifeinsurance for eligible U.S. retirees and their dependents.
The Company uses a measurement date of September 30 to calculate obligations under its pension andpostretirement plans.
In conjunction with the Distribution, the Company’s portion of the Morgan Stanley Employees RetirementPlan (“MSERP”) was spun off to the Qualified Plan effective December 31, 2006. As a result, the net periodic
75

pension cost for the year ended November 30, 2007 was remeasured as of December 31, 2006. The qualified planassets and liabilities relating to the pre-distribution participation of the Company’s employees in the MSERPwere transferred prior to November 30, 2007. Historically, the Company’s portion of pension and postretirementobligations and expense have been calculated using separate actuarial valuations based on the Company’sspecific demographic data and separately tracked plan assets. Unrecognized gains and losses and unrecognizedprior service costs (plan amendments) have been calculated and tracked separately as well based on theCompany’s experience.
Net Periodic Benefit Cost. Net periodic benefit cost expensed by the Company included the followingcomponents (dollars in thousands):
Pension Postretirement
For the Years Ended November 30,For the Years Ended
November 30,
2007 2006 2005 2007 2006 2005
Service cost, benefits earned during the period . . . $ 18,427 $ 20,093 $ 18,642 $1,097 $1,441 $1,134Interest cost on projected benefit obligation . . . . . . 19,389 18,340 16,734 1,310 1,437 1,433Expected return on plan assets . . . . . . . . . . . . . . . . (22,665) (20,648) (19,363) — — —Net amortization . . . . . . . . . . . . . . . . . . . . . . . . . . . 641 4,082 2,797 (552) (374) (378)Net settlements and curtailments . . . . . . . . . . . . . . 60 — — — — —
Net periodic benefit cost . . . . . . . . . . . . . . . . . $ 15,852 $ 21,867 $ 18,810 $1,855 $2,504 $2,189
Adoption of Statement No. 158
As of November 30, 2007, the Company adopted the recognition and disclosure provisions of Statement ofFinancial Accounting Standards No. 158, Employer’s Accounting for Defined Benefit Pensions and OtherPostretirement Plans—an amendment of FASB Statements No. 87, 88, 106, and 132(R) (“Statement No. 158”). Inaccordance with this standard, the Company recorded the funded status of each of its defined benefit pension andpostretirement plans as an asset or liability on its consolidated and combined statements of financial conditionwith a corresponding offset, net of taxes, recorded in accumulated other comprehensive income withinstockholders’ equity, resulting in an after tax decrease in equity of $13.1 million.
The following table shows the effects of adopting Statement No. 158 as of November 30, 2007 on theindividual line items in the consolidated and combined statements of financial condition (dollars in thousands):
Before Adoptionof Statement No. 158 Adjustments
As Reported atNovember 30, 2007
Other Assets (1) . . . . . . . . . . . . . . . . . . . . . . . . . . . . . . . . . . . . $ 794,749 $(13,471) $ 781,278Total Assets . . . . . . . . . . . . . . . . . . . . . . . . . . . . . . . . . . . . . . $37,389,576 $(13,471) $37,376,105Accrued expenses and other liabilities (2) . . . . . . . . . . . . . . . $ 1,477,163 $ (338) $ 1,476,825Total liabilities . . . . . . . . . . . . . . . . . . . . . . . . . . . . . . . . . . . . $31,777,021 $ (338) $31,776,683Accumulated other comprehensive income, net of tax . . . . . $ 45,165 $(13,133) $ 32,032Total stockholders’ equity . . . . . . . . . . . . . . . . . . . . . . . . . . . $ 5,612,555 $(13,133) $ 5,599,422Total liabilities and stockholders’ equity . . . . . . . . . . . . . . . $37,389,576 $(13,471) $37,376,105
(1) The benefit asset and net deferred tax assets are included in other assets.(2) The benefit liability is included in accrued expenses and other liabilities.
76

Accumulated Other Comprehensive Income. Pretax amounts recognized in accumulated othercomprehensive income that have not yet been recognized as components of net periodic benefit cost consist of(dollars in thousands):
Pension Postretirement
Prior service credit . . . . . . . . . . . . . . . . . . . . . . . . . . . . . . . . . . . . . . . . . . . . . . . . . . . . $ 44,120 $ 497Net loss . . . . . . . . . . . . . . . . . . . . . . . . . . . . . . . . . . . . . . . . . . . . . . . . . . . . . . . . . . . . (65,455) (158)
Total . . . . . . . . . . . . . . . . . . . . . . . . . . . . . . . . . . . . . . . . . . . . . . . . . . . . . . . . . . . $(21,335) $ 339
The estimated portion of the prior service credit and net loss above that is expected to be recognized as acomponent of net periodic benefit cost in 2008 is shown below (dollars in thousands):
Pension Postretirement
Prior service credit . . . . . . . . . . . . . . . . . . . . . . . . . . . . . . . . . . . . . . . . . . . . . . . . . . . . . $(5,228) $(465)Net loss . . . . . . . . . . . . . . . . . . . . . . . . . . . . . . . . . . . . . . . . . . . . . . . . . . . . . . . . . . . . . 2,989 —
Total . . . . . . . . . . . . . . . . . . . . . . . . . . . . . . . . . . . . . . . . . . . . . . . . . . . . . . . . . . . . $(2,239) $(465)
Benefit Obligations and Funded Status. The following table provides a reconciliation of the changes in thebenefit obligation and fair value of plan assets as well as a summary of the Company’s funded status (dollars inthousands):
Pension Postretirement
For the Years EndedNovember 30,
For the Years EndedNovember 30,
2007 2006 2007 2006
Reconciliation of benefit obligation:Benefit obligation at beginning of year . . . . . . . . . . . . . . . . . . . . . . . . . . . . . . . . $337,485 $325,058 $ 22,604 $ 25,731Service cost . . . . . . . . . . . . . . . . . . . . . . . . . . . . . . . . . . . . . . . . . . . . . . . . . . . . . 18,427 20,093 1,097 1,441Interest cost . . . . . . . . . . . . . . . . . . . . . . . . . . . . . . . . . . . . . . . . . . . . . . . . . . . . . 19,389 18,340 1,310 1,437Actuarial (gain) loss . . . . . . . . . . . . . . . . . . . . . . . . . . . . . . . . . . . . . . . . . . . . . . (37,780) (13,400) 23 (4,711)Settlements . . . . . . . . . . . . . . . . . . . . . . . . . . . . . . . . . . . . . . . . . . . . . . . . . . . . . (240) — — —Benefits paid . . . . . . . . . . . . . . . . . . . . . . . . . . . . . . . . . . . . . . . . . . . . . . . . . . . . (17,093) (12,606) (1,462) (1,294)
Benefit obligation at end of year . . . . . . . . . . . . . . . . . . . . . . . . . . . . . . . . . $320,188 $337,485 $ 23,572 $ 22,604
Reconciliation of fair value of plan assets:Fair value of plan assets at beginning of year . . . . . . . . . . . . . . . . . . . . . . . . . . . $340,517 $323,961 $ — $ —Actual return on plan assets . . . . . . . . . . . . . . . . . . . . . . . . . . . . . . . . . . . . . . . . 19,750 19,923 — —Employer contributions . . . . . . . . . . . . . . . . . . . . . . . . . . . . . . . . . . . . . . . . . . . . 21,599 9,239 1,462 1,294Settlements . . . . . . . . . . . . . . . . . . . . . . . . . . . . . . . . . . . . . . . . . . . . . . . . . . . . . (241) — — —Benefits paid . . . . . . . . . . . . . . . . . . . . . . . . . . . . . . . . . . . . . . . . . . . . . . . . . . . . (17,093) (12,606) (1,462) (1,294)
Fair value of plan assets at end of year . . . . . . . . . . . . . . . . . . . . . . . . . . . . $364,532 $340,517 $ — $ —
Funded and unfunded status: (1)
Funded status . . . . . . . . . . . . . . . . . . . . . . . . . . . . . . . . . . . . . . . . . . . . . . . . . . . . $ 44,344 $ 3,032 $(23,572) $(22,604)Amount contributed to plan after measurement date . . . . . . . . . . . . . . . . . . . . . — 21 — —Unrecognized prior-service credit . . . . . . . . . . . . . . . . . . . . . . . . . . . . . . . . . . . . N/A (49,348) N/A (971)Unrecognized loss . . . . . . . . . . . . . . . . . . . . . . . . . . . . . . . . . . . . . . . . . . . . . . . . N/A 106,249 N/A 57
Net amount recognized . . . . . . . . . . . . . . . . . . . . . . . . . . . . . . . . . . . . . . . . $ 44,344 $ 59,954 $(23,572) $(23,518)
Amounts recognized in the consolidated and combined statement of financialcondition consist of:
Other assets . . . . . . . . . . . . . . . . . . . . . . . . . . . . . . . . . . . . . . . . . . . . . . . . . . . . . $ 45,190 $ 60,665 $ — $ —Accrued expenses and other liabilities . . . . . . . . . . . . . . . . . . . . . . . . . . . . . . . . (846) (977) (23,572) (23,518)Minimum pension liability adjustment . . . . . . . . . . . . . . . . . . . . . . . . . . . . . . . . N/A 266 N/A —
Net amount recognized . . . . . . . . . . . . . . . . . . . . . . . . . . . . . . . . . . . . . . . . $ 44,344 $ 59,954 $(23,572) $(23,518)
(1) Due to the adoption of Statement No. 158 as of November 30, 2007, the funded status of the plans are reflected in the November 30,2007 consolidated and combined statements of financial condition.
77
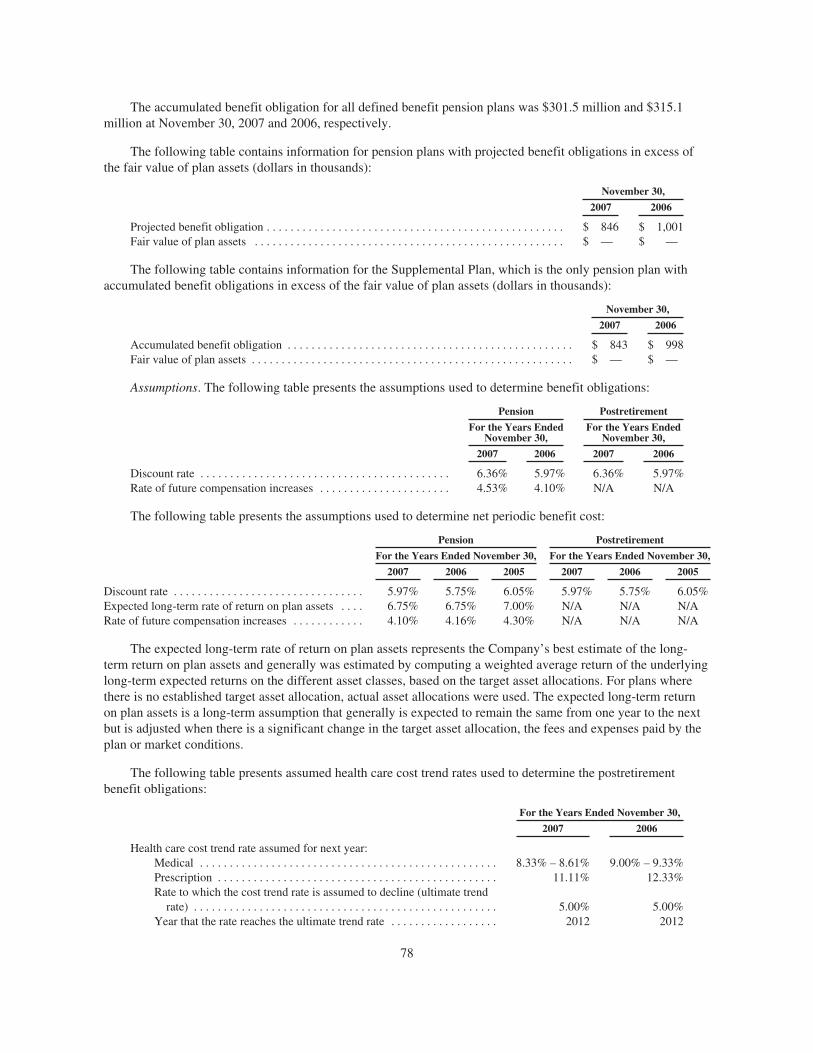
The accumulated benefit obligation for all defined benefit pension plans was $301.5 million and $315.1million at November 30, 2007 and 2006, respectively.
The following table contains information for pension plans with projected benefit obligations in excess ofthe fair value of plan assets (dollars in thousands):
November 30,
2007 2006
Projected benefit obligation . . . . . . . . . . . . . . . . . . . . . . . . . . . . . . . . . . . . . . . . . . . . . . . . . . $ 846 $ 1,001Fair value of plan assets . . . . . . . . . . . . . . . . . . . . . . . . . . . . . . . . . . . . . . . . . . . . . . . . . . . . $ — $ —
The following table contains information for the Supplemental Plan, which is the only pension plan withaccumulated benefit obligations in excess of the fair value of plan assets (dollars in thousands):
November 30,
2007 2006
Accumulated benefit obligation . . . . . . . . . . . . . . . . . . . . . . . . . . . . . . . . . . . . . . . . . . . . . . . . $ 843 $ 998Fair value of plan assets . . . . . . . . . . . . . . . . . . . . . . . . . . . . . . . . . . . . . . . . . . . . . . . . . . . . . . $ — $ —
Assumptions. The following table presents the assumptions used to determine benefit obligations:
Pension Postretirement
For the Years EndedNovember 30,
For the Years EndedNovember 30,
2007 2006 2007 2006
Discount rate . . . . . . . . . . . . . . . . . . . . . . . . . . . . . . . . . . . . . . . . . . 6.36% 5.97% 6.36% 5.97%Rate of future compensation increases . . . . . . . . . . . . . . . . . . . . . . 4.53% 4.10% N/A N/A
The following table presents the assumptions used to determine net periodic benefit cost:
Pension Postretirement
For the Years Ended November 30, For the Years Ended November 30,
2007 2006 2005 2007 2006 2005
Discount rate . . . . . . . . . . . . . . . . . . . . . . . . . . . . . . . . 5.97% 5.75% 6.05% 5.97% 5.75% 6.05%Expected long-term rate of return on plan assets . . . . 6.75% 6.75% 7.00% N/A N/A N/ARate of future compensation increases . . . . . . . . . . . . 4.10% 4.16% 4.30% N/A N/A N/A
The expected long-term rate of return on plan assets represents the Company’s best estimate of the long-term return on plan assets and generally was estimated by computing a weighted average return of the underlyinglong-term expected returns on the different asset classes, based on the target asset allocations. For plans wherethere is no established target asset allocation, actual asset allocations were used. The expected long-term returnon plan assets is a long-term assumption that generally is expected to remain the same from one year to the nextbut is adjusted when there is a significant change in the target asset allocation, the fees and expenses paid by theplan or market conditions.
The following table presents assumed health care cost trend rates used to determine the postretirementbenefit obligations:
For the Years Ended November 30,
2007 2006
Health care cost trend rate assumed for next year:Medical . . . . . . . . . . . . . . . . . . . . . . . . . . . . . . . . . . . . . . . . . . . . . . . . . . 8.33% – 8.61% 9.00% – 9.33%Prescription . . . . . . . . . . . . . . . . . . . . . . . . . . . . . . . . . . . . . . . . . . . . . . . 11.11% 12.33%Rate to which the cost trend rate is assumed to decline (ultimate trend
rate) . . . . . . . . . . . . . . . . . . . . . . . . . . . . . . . . . . . . . . . . . . . . . . . . . . . 5.00% 5.00%Year that the rate reaches the ultimate trend rate . . . . . . . . . . . . . . . . . . 2012 2012
78

Assumed health care cost trend rates can have a significant effect on the amounts reported for theCompany’s postretirement benefit plans. A one-percentage point change in assumed health care cost trend rateswould have the following effects (dollars in thousands):
One PercentagePoint Increase
One PercentagePoint Decrease
Effect on total of service and interest cost . . . . . . . . . . . . . . . . . . . . . . $ 5 $ (8)Effect on postretirement benefit obligation . . . . . . . . . . . . . . . . . . . . . $310 $(272)
Qualified Plan Assets. The asset allocation for the Qualified Plan at November 30, 2007 and November 30,2006 and the targeted asset allocation for 2008 by asset class is as follows:
For the Years EndedNovember 30,
2008Target 2007 2006
Equity securities . . . . . . . . . . . . . . . . . . . . . . . . . . . . . . . . . . . . . . . . . . . . . . 45.0% 44.5% 44.4%Fixed income securities . . . . . . . . . . . . . . . . . . . . . . . . . . . . . . . . . . . . . . . . . 55.0 54.1 51.4Other—primarily cash . . . . . . . . . . . . . . . . . . . . . . . . . . . . . . . . . . . . . . . . . . 0.0 1.4 4.2
Total . . . . . . . . . . . . . . . . . . . . . . . . . . . . . . . . . . . . . . . . . . . . . . . . . . . 100.0% 100.0% 100.0%
Qualified Plan Asset Allocation. The Company determined the asset allocation targets for the Qualified Planbased on its assessment of business and financial conditions, demographic and actuarial data, fundingcharacteristics and related risk factors. Other relevant factors, including industry practices and long-termhistorical and prospective capital market returns were considered as well.
The Qualified Plan return objectives provide long-term measures for monitoring the investmentperformance against growth in the pension obligations. The overall allocation is expected to help protect theQualified Plan’s funded status while generating sufficiently stable real returns (net of inflation) to help covercurrent and future benefit payments. Total Qualified Plan portfolio performance is assessed by comparing actualreturns with relevant benchmarks, such as the by Standard & Poor’s (“S&P”) 500 Index, the Russell 2000 Index,the MSCI EAFE Index and, in the case of the fixed income portfolio, the Qualified Plan’s liability profile.
Both the equity and fixed income portions of the asset allocation use a combination of active and passiveinvestment strategies and different investment styles. The fixed income asset allocation consists of longerduration fixed income securities in order to help reduce plan exposure to interest rate variation and to bettercorrelate assets with obligations. The longer duration fixed income allocation is expected to help stabilize plancontributions over the long run.
The asset mix of the Qualified Plan is reviewed by the Discover Financial Services Retirement PlanInvestment Committee (the “Investment Committee”) on a regular basis. When asset class exposure reaches aminimum or maximum level, an asset allocation review process is initiated and the portfolio is automaticallyrebalanced back to target allocation levels, unless the Investment Committee determines otherwise.
The Investment Committee has determined to allocate no more than 10% of the Qualified Plan assets to“alternative” asset classes that provide attractive diversification benefits, absolute return enhancement and/orother potential benefit to the plan. Allocations to alternative asset classes will be made based upon an evaluationof particular attributes and relevant considerations of each asset class.
79

Derivative instruments are permitted in the Qualified Plan’s portfolio only to the extent that they complywith all of the plan’s policy guidelines and are consistent with the plan’s risk and return objectives. In addition,any investment in derivatives must meet the following conditions:
• Derivatives may be used only if the vehicle is deemed by the investment manager to be more attractivethan a similar direct investment in the underlying cash market; or if the vehicle is being used to managerisk of the portfolio.
• Under no circumstances may derivatives be used in a speculative manner or to leverage the portfolio.
• Derivatives may not be used as short-term trading vehicles. The investment philosophy of the QualifiedPlan is that investment activity is undertaken for long-term investment, rather than short-term trading.
• Derivatives may only be used in the management of the Qualified Plan’s portfolio when their possibleeffects can be quantified, shown to enhance the risk-return profile of the portfolio and reported in ameaningful and understandable manner.
As a fundamental operating principle, any restrictions on the underlying assets apply to a respectivederivative product. This includes percentage allocations and credit quality. The purpose of the use of derivativesis to enhance investment in the underlying assets, not to circumvent portfolio restrictions.
Cash Flows. The Company expects to contribute approximately $18.5 million to its pension andpostretirement benefit plans in 2008 based upon their current funded status and expected asset return assumptionsfor 2008, as applicable.
Expected benefit payments associated with the Company’s pension and postretirement benefit plans for thenext five years and in aggregate for the years thereafter are as follows (dollars in thousands):
Pension Postretirement
2008 . . . . . . . . . . . . . . . . . . . . . . . . . . . . . . . . . . . . . . . . . . . . . . . . . . . . . . . . $10,821 $ 1,6052009 . . . . . . . . . . . . . . . . . . . . . . . . . . . . . . . . . . . . . . . . . . . . . . . . . . . . . . . . $11,685 $ 1,7052010 . . . . . . . . . . . . . . . . . . . . . . . . . . . . . . . . . . . . . . . . . . . . . . . . . . . . . . . . $12,305 $ 1,8492011 . . . . . . . . . . . . . . . . . . . . . . . . . . . . . . . . . . . . . . . . . . . . . . . . . . . . . . . . $13,755 $ 1,9802012 . . . . . . . . . . . . . . . . . . . . . . . . . . . . . . . . . . . . . . . . . . . . . . . . . . . . . . . . $15,186 $ 1,982Thereafter . . . . . . . . . . . . . . . . . . . . . . . . . . . . . . . . . . . . . . . . . . . . . . . . . . . . $99,077 $11,015
Defined Contribution Pension Plans. The Company maintains separate defined contribution pension plansthat cover substantially all of its non-U.S. employees. Prior to the Distribution, the Company participated insimilar plans maintained by Morgan Stanley. Under such plans, benefits equal the accumulated value ofcontributions paid. In 2007, 2006 and 2005, the Company’s expense related to these plans was $2.2 million, $3.0million and $1.5 million, respectively.
16. Other Expense
Total other expense includes the following components (dollars in thousands):
For the Years Ended November 30,
2007 2006 2005
Postage . . . . . . . . . . . . . . . . . . . . . . . . . . . . . . . . . . . . . . . . . . . . . $109,170 $109,059 $104,597Fraud losses . . . . . . . . . . . . . . . . . . . . . . . . . . . . . . . . . . . . . . . . . 84,515 69,727 103,825Supplies . . . . . . . . . . . . . . . . . . . . . . . . . . . . . . . . . . . . . . . . . . . . 37,079 33,466 34,785Credit bureau inquiry fees . . . . . . . . . . . . . . . . . . . . . . . . . . . . . . 29,106 29,872 23,726Other . . . . . . . . . . . . . . . . . . . . . . . . . . . . . . . . . . . . . . . . . . . . . . . 102,609 92,965 72,206
Other expense . . . . . . . . . . . . . . . . . . . . . . . . . . . . . . . . . . . . $362,479 $335,089 $339,139
80

17. Income Taxes
Income tax expense consisted of the following (dollars in thousands):
For the Years Ended November 30,
2007 2006 2005
Current:U.S. federal . . . . . . . . . . . . . . . . . . . . . . . . . . . . . . . . . . . . . . $520,909 $414,246 $384,767U.S. state and local(1) . . . . . . . . . . . . . . . . . . . . . . . . . . . . . . 41,913 (18,663) 35,292International . . . . . . . . . . . . . . . . . . . . . . . . . . . . . . . . . . . . . 12,299 33,775 (9)
Total . . . . . . . . . . . . . . . . . . . . . . . . . . . . . . . . . . . . . . . 575,121 429,358 420,050Deferred:
U.S. federal . . . . . . . . . . . . . . . . . . . . . . . . . . . . . . . . . . . . . . (206,350) 80,819 (72,119)U.S. state and local . . . . . . . . . . . . . . . . . . . . . . . . . . . . . . . . (12,783) (2,509) (1,033)International . . . . . . . . . . . . . . . . . . . . . . . . . . . . . . . . . . . . . 578 (1,979) (557)
Total . . . . . . . . . . . . . . . . . . . . . . . . . . . . . . . . . . . . . . . (218,555) 76,331 (73,709)
Income tax expense . . . . . . . . . . . . . . . . . . . . . . . $356,566 $505,689 $346,341
(1) In 2006, the Company had several outstanding tax matters resolved or settled in its favor that had a $60 million impact on income taxexpense.
Subsequent to the Distribution, the Company has determined that all earnings of its foreign subsidiaries willbe permanently reinvested to meet their future business goals. As such, the Company has not provided U.S.deferred income taxes or foreign withholding taxes on the undistributed earnings of its foreign subsidiaries as ofNovember 30, 2007. The earnings of foreign subsidiaries encompassed in the International Card segment wereearmarked for repatriation at November 30, 2006 and 2005 and were not considered to be permanentlyreinvested. For years 2006 and 2005, any applicable foreign taxes related to the International Card segment werepaid by a non-U.S. affiliate of Morgan Stanley.
The following table reconciles the Company’s effective tax rate to the U.S. federal statutory income tax rate:
For the Years Ended November 30,
2007 2006 2005
U.S. federal statutory income tax rate . . . . . . . . . . . . . . . . . . . . . . . . . . . . . . . . . . . 35.0% 35.0% 35.0%U.S. state and local income taxes, net of U.S. federal income tax benefits . . . . . . 3.2 1.8 3.7Federal examinations and settlements . . . . . . . . . . . . . . . . . . . . . . . . . . . . . . . . . . — (2.4) 0.1State examinations and settlements . . . . . . . . . . . . . . . . . . . . . . . . . . . . . . . . . . . . (0.1) (1.4) (1.3)Non-deductible spin-off costs . . . . . . . . . . . . . . . . . . . . . . . . . . . . . . . . . . . . . . . . . 0.5 — —Goodwill basis differential . . . . . . . . . . . . . . . . . . . . . . . . . . . . . . . . . . . . . . . . . . . 2.9 — —Rewards program benefits . . . . . . . . . . . . . . . . . . . . . . . . . . . . . . . . . . . . . . . . . . . (2.9) — —Other . . . . . . . . . . . . . . . . . . . . . . . . . . . . . . . . . . . . . . . . . . . . . . . . . . . . . . . . . . . . (0.9) (1.0) —
Effective income tax rate . . . . . . . . . . . . . . . . . . . . . . . . . . . . . . . . . . . . . . . . 37.7% 32.0% 37.5%
Effective October 5, 2007, Goldfish Bank Ltd. is treated as a disregarded entity for U.S. tax purposesthrough the filing of an entity classification election. As a consequence of this “check the box” election, U.S.deferred tax assets related to the bank’s goodwill and rewards programs were established during fiscal 2007. Thetax basis in the bank’s goodwill is less than the related impairment charge, which offsets the tax benefitassociated with future reward program deductions.
81

Deferred income taxes reflect the net tax effects of temporary differences between the financial reportingand tax bases of assets and liabilities and are measured using the enacted tax rates and laws that will be in effectwhen such differences are expected to reverse. Significant components of the Company’s net deferred incometaxes were as follows (dollars in thousands):
November 30,
2007 2006
Deferred tax assets:Allowance for loan losses . . . . . . . . . . . . . . . . . . . . . . . . . . . . . . . . . . . . . . . . . . . . . . $ 346,231 $ 307,407Compensation and benefits . . . . . . . . . . . . . . . . . . . . . . . . . . . . . . . . . . . . . . . . . . . . . 29,480 11,948Goodwill . . . . . . . . . . . . . . . . . . . . . . . . . . . . . . . . . . . . . . . . . . . . . . . . . . . . . . . . . . . 113,231 —State income taxes . . . . . . . . . . . . . . . . . . . . . . . . . . . . . . . . . . . . . . . . . . . . . . . . . . . 29,839 27,984Unrealized gains/losses . . . . . . . . . . . . . . . . . . . . . . . . . . . . . . . . . . . . . . . . . . . . . . . 23,305 1,982Cardmember fees and rewards . . . . . . . . . . . . . . . . . . . . . . . . . . . . . . . . . . . . . . . . . . 26,931 —Unearned income . . . . . . . . . . . . . . . . . . . . . . . . . . . . . . . . . . . . . . . . . . . . . . . . . . . . 19,807 4,821Other . . . . . . . . . . . . . . . . . . . . . . . . . . . . . . . . . . . . . . . . . . . . . . . . . . . . . . . . . . . . . . 29,329 35,150
Total deferred tax assets before valuation allowance . . . . . . . . . . . . . . . . . . . . . 618,153 389,292Valuation allowance . . . . . . . . . . . . . . . . . . . . . . . . . . . . . . . . . . . . . . . . . . . . . . (1,143) (11,054)
Total deferred tax assets (net of valuation allowance) . . . . . . . . . . . . . . . . 617,010 378,238Deferred tax liabilities:
Cardmember fees and rewards . . . . . . . . . . . . . . . . . . . . . . . . . . . . . . . . . . . . . . . . . . — (2,973)Depreciation . . . . . . . . . . . . . . . . . . . . . . . . . . . . . . . . . . . . . . . . . . . . . . . . . . . . . . . . (24,043) (27,846)Securitizations . . . . . . . . . . . . . . . . . . . . . . . . . . . . . . . . . . . . . . . . . . . . . . . . . . . . . . (145,341) (119,439)Customer relationships . . . . . . . . . . . . . . . . . . . . . . . . . . . . . . . . . . . . . . . . . . . . . . . . (21,339) (22,182)Software and processing costs . . . . . . . . . . . . . . . . . . . . . . . . . . . . . . . . . . . . . . . . . . (23,549) (4,110)Other . . . . . . . . . . . . . . . . . . . . . . . . . . . . . . . . . . . . . . . . . . . . . . . . . . . . . . . . . . . . . . (14,819) (39,996)
Total deferred tax liabilities . . . . . . . . . . . . . . . . . . . . . . . . . . . . . . . . . . . . (229,091) (216,546)
Net deferred tax assets . . . . . . . . . . . . . . . . . . . . . . . . . . . . . . . . . . . . $ 387,919 $ 161,692
Net deferred tax assets are included in other assets in the Company’s consolidated and combined statementsof financial condition.
Deferred income tax assets were reduced by a valuation allowance of $1.1 million and $11.1 million atNovember 30, 2007 and 2006, respectively. The valuation allowance is attributable to a state deferred income taxasset arising from the existence of a state tax net operating loss carryforward, the realization of which isuncertain at the present time. The state tax net operating loss carryforward relates to Ohio and will expire in 2009when the Ohio corporation franchise (income) tax is fully phased out.
The Company is under continuous examination by the IRS and the tax authorities for various states. The taxyears under examination vary by jurisdiction; for example, the current IRS examination covers 1999 through2005. Based on current progress, the Company expects this IRS examination to be substantially completed in2008. The Company regularly assesses the likelihood of additional assessments in each of the taxing jurisdictionsresulting from these and subsequent years’ examinations. Pursuant to Statement of Financial AccountingStandards No. 5, Accounting for Contingencies (“Statement No. 5”), tax reserves are established for taxassessments that are deemed to be probable and which can be reasonably estimated. Once established, reservesare adjusted only when there is more information available or when an event occurs necessitating a change to thereserves. The resolution of tax matters will not have a material effect on the consolidated and combined financialcondition of the Company, although a resolution could have a material impact on the Company’s consolidatedand combined statements of income for a particular future period and on the Company’s effective income taxrate.
82

18. Earnings Per Share
Basic earnings per share (“EPS”) is computed by dividing income available to common stockholders by theweighted average number of common shares outstanding for the period. Diluted EPS reflects the assumedconversion of all dilutive securities. On June 30, 2007, the Distribution by Morgan Stanley was completed to theMorgan Stanley stockholders of one share of DFS common stock for every two shares of Morgan Stanleycommon stock held on June 18, 2007. As a result, on July 2, 2007, the Company had 477,235,927 shares ofcommon stock outstanding and this share amount is being utilized for the calculation of basic EPS for all periodspresented prior to the date of the Distribution.
The following table presents the calculation of basic EPS (dollars in thousands, except per share amounts):
For the Years Ended November 30,
2007 2006 2005
Basic EPS:Net income . . . . . . . . . . . . . . . . . . . . . . . . . . . . . . . $ 588,630 $ 1,076,616 $ 577,915Weighted average common shares outstanding . . . 477,327,627 477,235,927 477,235,927Earnings per basic common share . . . . . . . . . . . . . . $ 1.23 $ 2.26 $ 1.21
For all periods prior to the date of Distribution, the same number of shares is being used for diluted EPS asfor basic EPS as no common stock of DFS was traded prior to July 2, 2007 and no Discover equity awards wereoutstanding for the prior periods.
The following table presents the computation of diluted EPS (dollars in thousands, except per shareamounts):
For the Years Ended November 30,
2007 2006 2005
Diluted EPS:Net income . . . . . . . . . . . . . . . . . . . . . . . . . . . . . . . $ 588,630 $ 1,076,616 $ 577,915Weighted average common shares outstanding . . . 477,327,627 477,235,927 477,235,927Effect of dilutive stock options and restricted stock
units . . . . . . . . . . . . . . . . . . . . . . . . . . . . . . . . . . . 1,551,182 — —
Weighted average common shares outstanding andcommon stock equivalents . . . . . . . . . . . . . . . . . 478,878,809 477,235,927 477,235,927
Earnings per diluted common share . . . . . . . . . . . . $ 1.23 $ 2.26 $ 1.21
The following securities were considered anti-dilutive and therefore were excluded from the computation ofdiluted EPS:
For the Years Ended November 30,
2007 2006 2005
Number of anti-dilutive securities (stock options and restricted stock units)outstanding at end of period . . . . . . . . . . . . . . . . . . . . . . . . . . . . . . . . . . . . 4,932,323 — —
83

19. Capital Adequacy
The Company’s domestic banking entities, Discover Bank and Bank of New Castle, are subject to variousregulatory capital requirements as administered by the FDIC. Failure to meet minimum capital requirements canresult in the initiation of certain mandatory, and possibly additional discretionary, actions by regulators that, ifundertaken, could have a direct material effect on the position and results of Discover Bank and Bank of NewCastle, and ultimately those of the Company. Under capital adequacy guidelines and the regulatory frameworkfor prompt corrective action, both banks must meet specific capital guidelines that involve quantitative measuresof assets, liabilities, and certain off-balance sheet items, as calculated under regulatory accounting practices.Discover Bank and Bank of New Castle capital amounts and classification are also subject to qualitativejudgments by the regulators about components, risk weightings and other factors.
Quantitative measures established by regulation to ensure capital adequacy require Discover Bank and Bankof New Castle to maintain minimum amounts and ratios (set forth in the following table) of total and Tier 1capital (as defined in the regulations) to risk-weighted assets (as defined), and of Tier I capital (as defined) toaverage assets (as defined). Management believes that, as of November 30, 2007, both Discover Bank and Bankof New Castle met all capital adequacy requirements to which they are subject. Both banks met all capitaladequacy requirements to which they were subject at November 30, 2006.
Under regulatory capital requirements adopted by the FDIC and other bank regulatory agencies, FDIC-insured financial institutions must maintain minimum levels of capital that are dependent upon the risk of thefinancial institutions assets, specifically (a) 3% to 5% of Tier 1 capital, as defined, to average assets (“leverageratio”), (b) 4% to 6% of Tier 1 capital, as defined, to risk-weighted assets (“Tier 1 risk-weighted capital ratio”)and (c) 8% to 10% of total capital, as defined, to risk-weighted assets (“total risk-weighted capital ratio”). As ofNovember 30, 2007 and 2006, the most recent notification from the FDIC categorized both Discover Bank andBank of New Castle as “well-capitalized” under the regulatory framework for prompt corrective action. To becategorized as “well-capitalized,” Discover Bank and Bank of New Castle must maintain minimum total risk-based, Tier I risk-based, and Tier I leverage ratios as set forth in the following table. There are no conditions orevents since that notification that management believes have changed either bank’s categories.
84
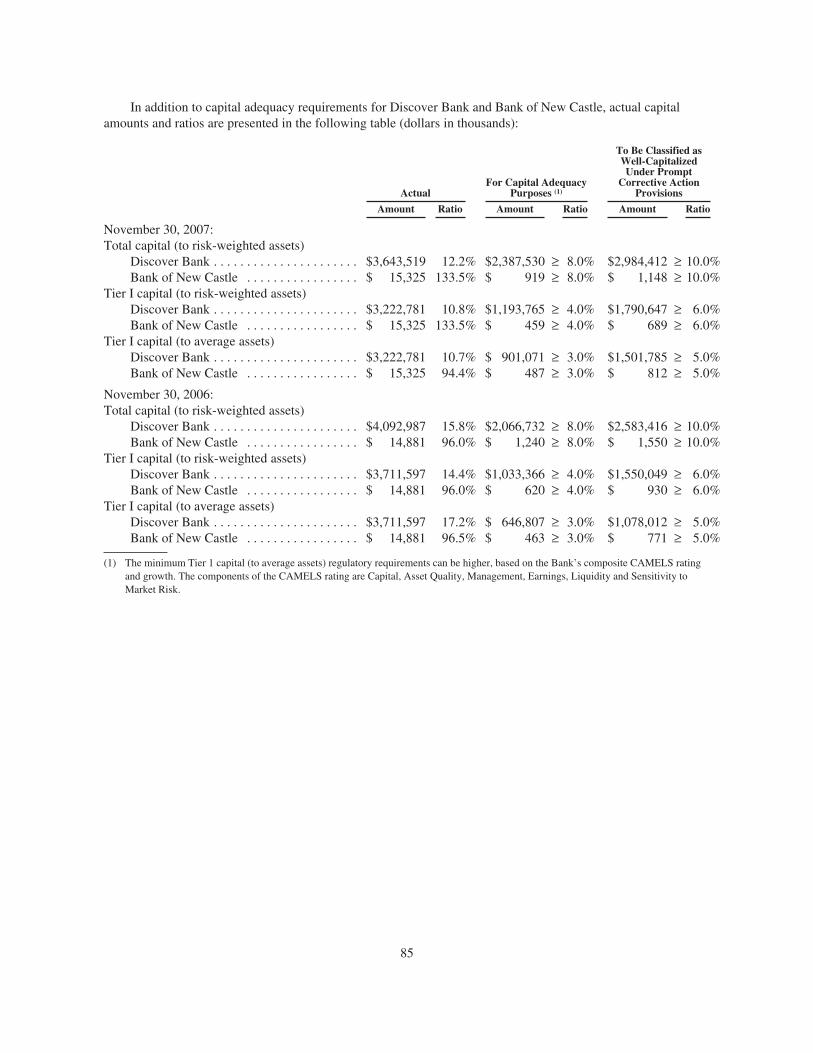
In addition to capital adequacy requirements for Discover Bank and Bank of New Castle, actual capitalamounts and ratios are presented in the following table (dollars in thousands):
ActualFor Capital Adequacy
Purposes (1)
To Be Classified asWell-CapitalizedUnder Prompt
Corrective ActionProvisions
Amount Ratio Amount Ratio Amount Ratio
November 30, 2007:Total capital (to risk-weighted assets)
Discover Bank . . . . . . . . . . . . . . . . . . . . . . $3,643,519 12.2% $2,387,530 ≥ 8.0% $2,984,412 ≥ 10.0%Bank of New Castle . . . . . . . . . . . . . . . . . $ 15,325 133.5% $ 919 ≥ 8.0% $ 1,148 ≥ 10.0%
Tier I capital (to risk-weighted assets)Discover Bank . . . . . . . . . . . . . . . . . . . . . . $3,222,781 10.8% $1,193,765 ≥ 4.0% $1,790,647 ≥ 6.0%Bank of New Castle . . . . . . . . . . . . . . . . . $ 15,325 133.5% $ 459 ≥ 4.0% $ 689 ≥ 6.0%
Tier I capital (to average assets)Discover Bank . . . . . . . . . . . . . . . . . . . . . . $3,222,781 10.7% $ 901,071 ≥ 3.0% $1,501,785 ≥ 5.0%Bank of New Castle . . . . . . . . . . . . . . . . . $ 15,325 94.4% $ 487 ≥ 3.0% $ 812 ≥ 5.0%
November 30, 2006:Total capital (to risk-weighted assets)
Discover Bank . . . . . . . . . . . . . . . . . . . . . . $4,092,987 15.8% $2,066,732 ≥ 8.0% $2,583,416 ≥ 10.0%Bank of New Castle . . . . . . . . . . . . . . . . . $ 14,881 96.0% $ 1,240 ≥ 8.0% $ 1,550 ≥ 10.0%
Tier I capital (to risk-weighted assets)Discover Bank . . . . . . . . . . . . . . . . . . . . . . $3,711,597 14.4% $1,033,366 ≥ 4.0% $1,550,049 ≥ 6.0%Bank of New Castle . . . . . . . . . . . . . . . . . $ 14,881 96.0% $ 620 ≥ 4.0% $ 930 ≥ 6.0%
Tier I capital (to average assets)Discover Bank . . . . . . . . . . . . . . . . . . . . . . $3,711,597 17.2% $ 646,807 ≥ 3.0% $1,078,012 ≥ 5.0%Bank of New Castle . . . . . . . . . . . . . . . . . $ 14,881 96.5% $ 463 ≥ 3.0% $ 771 ≥ 5.0%
(1) The minimum Tier 1 capital (to average assets) regulatory requirements can be higher, based on the Bank’s composite CAMELS ratingand growth. The components of the CAMELS rating are Capital, Asset Quality, Management, Earnings, Liquidity and Sensitivity toMarket Risk.
85

The amount of dividends that a bank may pay in any year is subject to certain regulatory restrictions. Underthe current banking regulations, a bank may not pay dividends if such a payment would leave the bankinadequately capitalized. In the years ended November 30, 2007, 2006 and 2005, Discover Bank paid dividendsfrom retained earnings to its parent, Discover Financial Services, of $1.6 billion, $500 million and $175 million,respectively, which were eliminated in consolidation. Bank of New Castle paid no dividends in those years. Forthe year ended November 30, 2007, 2006 and 2005, the Company paid dividends to Morgan Stanley of $850million, $500 million and $0, respectively. See Note 26: Related Party Transactions herein for further disclosureconcerning capital transactions with Morgan Stanley. The Company paid dividends of $29 million to itsstockholders of record in the year ended November 30, 2007 following the Distribution.
The U.K. banking entity is regulated by the FSA with respect to capital adequacy. At November 30, 2007,this entity was compliant with all applicable capital standards.
20. Commitments, Contingencies and Guarantees
Lease commitments. The Company leases various office space and equipment under capital andnon-cancelable operating leases which expire at various dates through 2013. At November 30, 2007, futureminimum payments on leases with remaining terms in excess of one year, consist of the following (dollars inthousands):
CapitalizedLeases
OperatingLeases
2008 . . . . . . . . . . . . . . . . . . . . . . . . . . . . . . . . . . . . . . . . . . . . . . . . . . . . . . . . . . $1,579 $ 7,6232009 . . . . . . . . . . . . . . . . . . . . . . . . . . . . . . . . . . . . . . . . . . . . . . . . . . . . . . . . . . 1,579 7,9582010 . . . . . . . . . . . . . . . . . . . . . . . . . . . . . . . . . . . . . . . . . . . . . . . . . . . . . . . . . . 1,579 6,0042011 . . . . . . . . . . . . . . . . . . . . . . . . . . . . . . . . . . . . . . . . . . . . . . . . . . . . . . . . . . 790 3,4342012 . . . . . . . . . . . . . . . . . . . . . . . . . . . . . . . . . . . . . . . . . . . . . . . . . . . . . . . . . . — 3,353Thereafter . . . . . . . . . . . . . . . . . . . . . . . . . . . . . . . . . . . . . . . . . . . . . . . . . . . . . . — 2,414
Total minimum lease payments . . . . . . . . . . . . . . . . . . . . . . . . . . . . . . . . . . . . . 5,527 $30,786
Less: Amount representing interest . . . . . . . . . . . . . . . . . . . . . . . . . . . . . . . . . . 575
Present value of net minimum lease payments . . . . . . . . . . . . . . . . . . . . . . . . . $4,952
Occupancy lease agreements, in addition to base rentals, generally provide for rent and operating expenseescalations resulting from increased assessments for real estate taxes and other charges. Total rent expense underoperating lease agreements, which considers contractual escalations and is net of sublease rental income, was$14.6 million, $12.6 million and $14.7 million for the years ended November 30, 2007, 2006 and 2005,respectively. For the years ended November 30, 2007, 2006 and 2005, sublease rental income was $3.1 million,$4.9 million and $4.8 million, respectively. See Note 26: Related Party Transactions for further informationregarding rental expense and sublease rental income prior to Distribution.
Unused commitments to extend credit. At November 30, 2007, the Company had unused commitments toextend credit for consumer and commercial loans of approximately $265 billion. Such commitments ariseprimarily from agreements with customers for unused lines of credit on certain credit cards, provided there is noviolation of conditions established in the related agreement. These commitments, substantially all of which theCompany can terminate at any time and which do not necessarily represent future cash requirements, areperiodically reviewed based on account usage and customer creditworthiness.
Guarantees. The Company has certain obligations under certain guarantee arrangements, including contractsand indemnification agreements that contingently require the Company to make payments to the guaranteed partybased on changes in an underlying (such as a security) related to an asset, liability or equity security of aguaranteed party. Also included as guarantees are contracts that contingently require the Company to make
86

payments to the guaranteed party based on another entity’s failure to perform under an agreement. TheCompany’s use of guarantees is disclosed below by type of guarantee.
Securitized Asset Representations and Warranties. As part of the Company’s securitization activities, theCompany provides representations and warranties that certain securitized assets conform to specifiedguidelines. The Company may be required to repurchase such assets or indemnify the purchaser againstlosses if the assets do not meet certain conforming guidelines. Due diligence is performed by the Companyto ensure that asset guideline qualifications are met. The maximum potential amount of future payments theCompany could be required to make would be equal to the current outstanding balances of all assets subjectto such securitization activities. The Company has not recorded any contingent liability in the consolidatedand combined financial statements for these representations and warranties and believes that the probabilityof any payments under these arrangements is remote.
Merchant Chargeback Guarantees. The Company issues credit cards in the United States and UnitedKingdom and owns and operates the Discover Network in the United States. The Company is contingentlyliable for certain transactions processed on the Discover Network in the event of a dispute between thecardholder and a merchant. The contingent liability arises if the disputed transaction involves a merchant ormerchant acquirer with whom Discover Network has a direct relationship. If a dispute is resolved in thecardholder’s favor, the Discover Network will credit or refund the disputed amount to the Discover Networkcard issuer, who in turn credits its cardholder’s account. Discover Network will then charge back thetransaction to the merchant or merchant acquirer. If the Discover Network is unable to collect the amountfrom the merchant or merchant acquirer, it will bear the loss for the amount credited or refunded to thecardholder. In most instances, a payment requirement by the Discover Network is unlikely to arise becausemost products or services are delivered when purchased, and credits are issued by merchants on returneditems in a timely fashion. However, where the product or service is not provided until some later datefollowing the purchase, the likelihood of payment by the Discover Network increases. Similarly, theCompany is also contingently liable for the resolution of cardmember disputes associated with its generalpurpose credit cards issued by its U.K. subsidiary on the MasterCard and Visa networks. The maximumpotential amount of future payments related to these contingent liabilities is estimated to be the portion ofthe total Discover Network sales transaction volume processed to date as well as the total U.K. cardmembersales transaction volume billed to date for which timely and valid disputes may be raised under applicablelaw, and relevant issuer and cardmember agreements. However, the Company believes that amount is notrepresentative of the Company’s actual potential loss exposure based on the Company’s historicalexperience. The actual amount of the potential exposure cannot be quantified as the Company cannotdetermine whether the current or cumulative transaction volumes may include or result in disputedtransactions.
The table below summarizes certain information regarding merchant chargeback guarantees:
For the Years Ended November 30,
2007 2006 2005
Losses related to merchant chargebacks (in thousands) . . . . . . . . $ 7,062 $ 5,183 $ 5,893Aggregate transaction volume (in millions) (1) . . . . . . . . . . . . . . . . $106,732 $100,343 $87,165
(1) Represents period transactions processed on Discover Network to which a potential liability exists as well as U.K.cardmember sales transactions which, in aggregate, can differ from credit card sales volume.
The amount of the liability related to the Company’s cardmember merchant guarantee was not material atNovember 30, 2007 and 2006. The Company mitigates this risk by withholding settlement from merchants orobtaining escrow deposits from certain merchant acquirers or merchants that are considered higher risk due tovarious factors such as time delays in the delivery of products or services.
87

The table below provides information regarding the settlement withholdings and escrow deposits (dollars inthousands):
November 30,
2007 2006
Settlement withholdings and escrow deposits . . . . . . . . . . . . . . . . . . . . . . . . . . . . $52,683 $54,741
Settlement withholdings and escrow deposits are recorded in interest-bearing deposit accounts and accruedexpenses and other liabilities on the Company’s consolidated and combined statement of financial condition.
21. Litigation
In the normal course of business, the Company has been named, from time to time, as a defendant in variouslegal actions, including arbitrations, class actions and other litigation, arising in connection with its activities.Certain of the actual or threatened legal actions include claims for substantial compensatory and/or punitivedamages or claims for indeterminate amounts of damages. The Company has historically relied on the arbitrationclause in its cardmember agreements which has limited the costs and exposure to litigation. The Company is alsoinvolved, from time to time, in other reviews, investigations and proceedings (both formal and informal) bygovernmental agencies regarding the Company’s business, including, among other matters, accounting andoperational matters, certain of which may result in adverse judgments, settlements, fines, penalties, injunctions orother relief. Litigation and regulatory actions could also adversely affect the reputation of the Company.
The Company contests liability and/or the amount of damages as appropriate in each pending matter. Inview of the inherent difficulty of predicting the outcome of such matters, particularly in cases where claimantsseek substantial or indeterminate damages or where investigations and proceedings are in the early stages, theCompany often cannot reasonably estimate the loss or range of loss, if any, related to such matters, how suchmatters will be resolved, when they will ultimately be resolved, or what the eventual settlement, fine, penalty orother relief, if any, might be. Subject to the foregoing, the Company believes, based on current knowledge andafter consultation with counsel, that the outcome of the pending matters, including any judgment or settlement, inexcess of established legal reserves, will not have a material adverse effect on the consolidated and combinedfinancial condition of the Company, although the outcome of such matters could be material to the Company’soperating results and cash flows for a particular future period, depending on, among other things, the level of theCompany’s income for such period. For currently pending matters about which management believes it is onlyreasonably possible that a loss has been incurred, management has concluded that it cannot reasonably estimatethe amount of the loss or range of loss. For matters where management has concluded that a loss is both probableand can be reasonably estimated, legal reserves have been established in accordance with Statement No. 5. Onceestablished, reserves are adjusted when there is more information available or when an event occurs requiring achange.
22. Fair Value Disclosures
In accordance with Statement of Financial Accounting Standards No. 107, Disclosures about Fair Value ofFinancial Instruments, the Company is required to disclose the fair value of financial instruments for which it ispractical to estimate fair value. To obtain fair values, observable market prices are used if available. In someinstances, observable market prices are not readily available for certain financial instrument and fair value isdetermined using present value or other techniques appropriate for a particular financial instrument. Thesetechniques involve some degree of judgment and as a result are not necessarily indicative of the amounts theCompany would realize in a current market exchange. The use of different assumptions or estimation techniquesmay have a material effect on the estimated fair value amounts.
88

The following table provides the estimated fair values of financial instruments (dollars in thousands):
November 30, 2007 November 30, 2006
CarryingValue
EstimatedFair Value
CarryingValue
EstimatedFair Value
Financial AssetsCash and cash equivalents . . . . . . . . . . . . . . . . . . . . . . $ 8,787,095 $ 8,787,095 $ 874,357 $ 874,357Investment securities:
Available-for-sale . . . . . . . . . . . . . . . . . . . . . . . . $ 420,837 $ 420,837 $ 2,314 $ 2,314Held-to-maturity . . . . . . . . . . . . . . . . . . . . . . . . . $ 104,602 $ 100,769 $ 82,097 $ 82,241
Net loan receivables . . . . . . . . . . . . . . . . . . . . . . . . . . $23,037,451 $23,185,270 $22,910,267 $22,962,899Amounts due from asset securitization . . . . . . . . . . . . $ 3,093,472 $ 3,093,472 $ 3,169,895 $ 3,169,895Derivative financial instruments . . . . . . . . . . . . . . . . . $ 2,643 $ 2,643 $ 33,339 $ 33,339Financial LiabilitiesDeposits . . . . . . . . . . . . . . . . . . . . . . . . . . . . . . . . . . . . $24,725,401 $24,796,911 $13,343,859 $13,299,993Short-term borrowings . . . . . . . . . . . . . . . . . . . . . . . . $ 3,175,426 $ 3,175,426 $ 6,739,678 $ 6,739,678Long-term borrowings . . . . . . . . . . . . . . . . . . . . . . . . . $ 2,134,093 $ 2,091,902 $ 1,507,578 $ 1,548,885Derivative financial instruments . . . . . . . . . . . . . . . . . $ 19,532 $ 19,532 $ 27,895 $ 27,895
Cash and cash equivalents. The carrying value of cash and cash equivalents approximates fair value due tomaturities of less than three months.
Investment securities available-for-sale. The carrying values of investment securities classified asavailable-for-sale are recorded at their fair values.
Investment securities held-to-maturity. The estimated fair values of investment securities classified asheld-to-maturity are based on quoted market prices utilizing public information for the same or comparabletransactions or information provided through third-party advisors.
Net loan receivables. The Company’s loan receivables consist of loans held for sale and the loan portfolio,which includes loans to consumers and commercial loans. The carrying value of loans held for sale, whichconsists entirely of consumer loans, approximates fair value as a result of the short-term nature of these assets.To estimate the fair value of the remaining loan receivables, loans are aggregated into pools of similar loan types,characteristics and expected repayment terms. The fair values of the loans are estimated by discounting futurecash flows using a rate at which similar loans could be made under current market conditions.
Amounts due from asset securitization. The carrying values of amounts due from asset securitization arerecorded at their approximate fair values.
Deposits. The carrying values of money market deposit, non-interest bearing deposits, interest-bearingdemand deposits and savings accounts approximates fair value due to liquid nature of these deposits. For timedeposits for which readily available market rates do not exist, fair values are estimated by discounting future cashflows using market rates currently offered for deposits with similar remaining maturities.
Short-term borrowings. The carrying values of short-term borrowings approximate their fair values. TermFederal Funds purchased are short-term in nature and have maturities of less than one year. Other short-termborrowings have variable rates of interest and are assumed to approximate fair values due to their automaticability to reprice with changes in the market.
Long-term borrowings. The fair values of long-term borrowings are determined by discounting cash flowsof future interest accruals at market rates currently offered for borrowings with similar remaining maturities orrepricing terms. The carrying values of bank notes approximate their fair values due to the quarterly repricing of
89

interest rates to current market rates. The carrying values of secured and unsecured borrowings with variablerates are assumed to approximate fair values due to their automatic ability to reprice with changes in the market.
Derivative financial instruments. The Company’s interest rate risk management program is designed toreduce the volatility of earnings resulting from changes in interest rates by having a financing portfolio thatreflects the existing repricing schedules of the managed loan receivables while also considering the Company’sright, with notice to cardmembers, to reprice certain loans to a new interest rate in the future. To the extent thatasset and related financing repricing characteristics of a particular component of the portfolio are not matchedeffectively, the Company utilizes interest rate swap agreements to achieve its objective. Interest rate swapagreements are derivative financial instruments that are entered into with institutions that are established dealersand that maintain certain minimum credit criteria established by the Company.
The Company has entered into interest rate swap agreements with unrelated third parties as well as withMorgan Stanley. At November 30, 2007, agreements with Morgan Stanley were no longer isolated from othertransactions with unrelated parties. The table that follows summarizes the interest rate swap agreementsoutstanding (dollars in thousands):
NotionalAmount
WeightedAverageYears toMaturity
EstimatedFair
Value
November 30, 2007Interest rate swap agreements . . . . . . . . . . . . . . . . . . . . . . . . . . . . . . . . . . . . . . $1,000,500 10.1
Gross positive fair value . . . . . . . . . . . . . . . . . . . . . . . . . . . . . . . . . . . . . . $ 2,643Gross negative fair value . . . . . . . . . . . . . . . . . . . . . . . . . . . . . . . . . . . . . . (10,112)
Total interest rate swap agreements . . . . . . . . . . . . . . . . . . . . . . . . . . . . . . . . . . $1,000,500 10.1 $ (7,469)
November 30, 2006Interest rate swap agreements with Morgan Stanley . . . . . . . . . . . . . . . . . . . . . $3,875,470 2.4
Gross positive fair value . . . . . . . . . . . . . . . . . . . . . . . . . . . . . . . . . . . . . . $ 33,339Gross negative fair value . . . . . . . . . . . . . . . . . . . . . . . . . . . . . . . . . . . . . . (18,759)
Interest rate swap agreements with unrelated parties . . . . . . . . . . . . . . . . . . . . 1,192,639 3.1Gross positive fair value . . . . . . . . . . . . . . . . . . . . . . . . . . . . . . . . . . . . . . —Gross negative fair value . . . . . . . . . . . . . . . . . . . . . . . . . . . . . . . . . . . . . . (9,136)
Total interest rate swap agreements . . . . . . . . . . . . . . . . . . . . . . . . . . . . . . . . . . $5,068,109 2.5 $ 5,444
Gross positive fair values of interest rate swap agreements are recorded in other assets and gross negativefair values are reported in accrued expenses and other liabilities. None of the interest rate swap agreementsoutstanding at November 30, 2007 were entered into by the Company during 2007 and of the agreements withnotional amounts outstanding of $5.1 billion at November 30, 2006, $2.0 billion were entered into during 2006.For the years ended November 30, 2007, 2006 and 2005, other income included a loss of $18.8 million, a gain of$7.1 million and a loss of $1.2 million, respectively, related to the change in fair value of these contracts. For theyears ended November 30, 2007 and 2006, interest expense included amortization of $2.6 million and $0.4million, respectively, related to the fair value adjustment to interest-bearing deposits existing prior tode-designation and the basis adjustment existing on the hedged interest-bearing deposits relating to the risk beinghedged. There was no related amortization recorded during the year ended November 30, 2005 as the derivativeswere not de-designated until 2006.
At November 30, 2007, the Company had an outstanding foreign currency exchange contract with a notionalamount of £226.0 million, entered into during 2007 to economically hedge short-term funding provided to aforeign subsidiary of the Company with a non-dollar currency denomination, the borrowing of which iseliminated in consolidation. The fair value of the contract was a negative $9.4 million at November 30, 2007, andwas included in accrued expenses and other liabilities in the consolidated and combined statements of financial
90

condition. The Company recorded the related loss in other income. There were no foreign currency exchangecontracts outstanding at November 30, 2006 and 2005.
The Company early adopted Statement of Financial Accounting Standards No. 159, The Fair Value Optionfor Financial Assets and Financial Liabilities—Including an amendment of FASB Statement No. 115 (“StatementNo. 159”), as of December 1, 2006, but has not made any fair value elections with respect to any of its eligibleassets or liabilities as permitted under the provisions of Statement No. 159 as of November 30, 2007. Inconjunction with the adoption of Statement No. 159, the Company also early adopted Statement of FinancialAccounting Standards No. 157, Fair Value Measurements, which defines fair value, establishes a framework formeasuring fair value and expands disclosures about fair value measurements. The following tables presentinformation about the Company’s assets and liabilities measured at fair value on a recurring basis as ofNovember 30, 2007, and indicate the fair value hierarchy of the valuation techniques utilized by the Company todetermine such fair value. In general, fair values determined by Level 1 inputs utilize quoted prices (unadjusted)in active markets for identical assets or liabilities that the Company has the ability to access. Fair valuesdetermined by Level 2 inputs utilize inputs other than quoted prices included in Level 1 that are observable forthe asset or liability, either directly or indirectly. Level 2 inputs include quoted prices for similar assets andliabilities in active markets, and inputs other than quoted prices that are observable for the asset or liability, suchas interest rates and yield curves that are observable at commonly quoted intervals. Level 3 inputs areunobservable inputs for the asset or liability, and include situations where there is little, if any, market activity forthe asset or liability. In instances in which the inputs used to measure fair value may fall into different levels ofthe fair value hierarchy, the level in the fair value hierarchy within which the fair value measurement in itsentirety has been determined is based on the lowest level input that is significant to the fair value measurement inits entirety. The Company’s assessment of the significance of a particular input to the fair value measurement inits entirety requires judgment, and considers factors specific to the asset or liability. Disclosures concerningassets and liabilities measured at fair value are as follows:
Assets and Liabilities Measured at Fair Value on a Recurring Basis at November 30, 2007(dollars in thousands)
Quoted Prices inActive Markets
for IdenticalAssets (Level 1)
SignificantOther
ObservableInputs (Level 2)
SignificantUnobservable
Inputs (Level 3)
Balance atNovember 30,
2007
AssetsInvestment securities – available-for-sale . . . . . . . . . . . $ 1,295 $ 419,542 $ — $ 420,837Amounts due from asset securitization(1) . . . . . . . . . . . . $ — $ — $ 2,041,506 $ 2,041,506Derivative financial instruments . . . . . . . . . . . . . . . . . . $ — $ 2,643 $ — $ 2,643LiabilitiesDerivative financial instruments . . . . . . . . . . . . . . . . . . $ — $ 19,532 $ — $ 19,532
(1) Balances represent only the portion of amounts due from asset securitization measured at fair value.
Changes in Level 3 Assets and Liabilities Measured at Fair Value on a Recurring Basis(dollars in thousands)
Total Realizedand UnrealizedGains Included
in Income TotalRealized andUnrealized
Gains
Purchases,Sales, Other
Settlements andIssuances, net
Net TransfersIn and/or Out
of Level 3Balance at
November 30, 2007
Balance atNovember 30,
2006
Net Revaluationof Retained
Interests
AssetsAmounts due from asset
securitization(1) . . . . . . . . $ 2,153,754 $ 46,668 $ 47,206 $ (159,454) $ — $ 2,041,506
(1) Balances represent only the portion of amounts due from asset securitizations measured at fair value.
91

Of the assets for which the Company utilized significant Level 3 inputs to determine fair value and that werestill held by the Company at November 30, 2007, the unrealized gain for the twelve months ended November 30,2007 was $47.2 million. The Company recorded $46.7 million of this unrealized gain in securitization income inthe consolidated and combined statements of income and $0.5 million in other comprehensive income in theconsolidated and combined statements of financial condition.
Both observable and unobservable inputs may be used to determine the fair value of positions that theCompany has classified within the Level 3 category. As a result, the unrealized gains and losses for assets andliabilities within the Level 3 category presented in the tables above may include changes in fair value that wereattributable to both observable and unobservable inputs.
Amounts due from asset securitization for which the Company utilized Level 3 inputs to determine fairvalue primarily reflects the interest-only strip receivable. The interest-only strip receivable represents thecontractual right to receive excess spread from the trusts over the estimated life of the securitized loanreceivables. The Company estimates the fair value of the interest-only strip receivable based on the present valueof expected future cash flows using management’s best estimate of key assumptions, including forecastedinterest yield, loan losses and payment rates, the interest rate paid to investors, and a discount rate commensuratewith the risks involved.
The Company also has assets that under certain conditions are subject to measurement at fair value on anon-recurring basis. These assets include those associated with acquired businesses and acquired credit cardportfolios, including goodwill and other intangible assets. For these assets, measurement at fair value in periodssubsequent to their initial recognition is applicable if one or more is determined to be impaired. During the yearended November 30, 2007, the Company determined that the fair value of goodwill and intangible assetsassociated with the Goldfish and Liverpool Victoria acquisitions had declined below their carrying values. TheCompany estimated the fair values of these assets utilizing Level 3 inputs, specifically, discounted cash flowprojections. At November 30, 2007, the Company recorded a non-cash impairment charge of $391 million toother expense, the amount required to adjust these assets to their estimated fair values.
Assets Measured at Fair Value on a Nonrecurring Basis(dollars in thousands)
Balanceat
November 30,2007
QuotedPrices inActive
Marketsfor
IdenticalAssets
(Level 1)
SignificantOther
ObservableInputs
(Level 2)
SignificantUnobservable
Inputs(Level 3)
TotalLosses forthe YearEnded
November 30,2007
AssetsGoodwill . . . . . . . . . . . . . . . . . . . . . . . . . . . . . . $ — $ — $ — $ — $ (291,161)Other Intangibles . . . . . . . . . . . . . . . . . . . . . . . . $ 38,274 $ — $ — $ 38,274 (99,958)
$ (391,119)
23. Segment Disclosures
The Company’s business activities are managed in three segments, U.S. Card, Third-Party Payments andInternational Card.
• U.S. Card. The U.S. Card segment offers Discover Card-branded credit cards issued to individuals andsmall businesses over the Discover Network, which is the Company’s proprietary credit card networkin the United States. Also included within the U.S. Card segment are the Company’s other consumerproducts and services businesses, including prepaid and other consumer lending and deposit productsoffered through the Company’s subsidiary, Discover Bank.
92
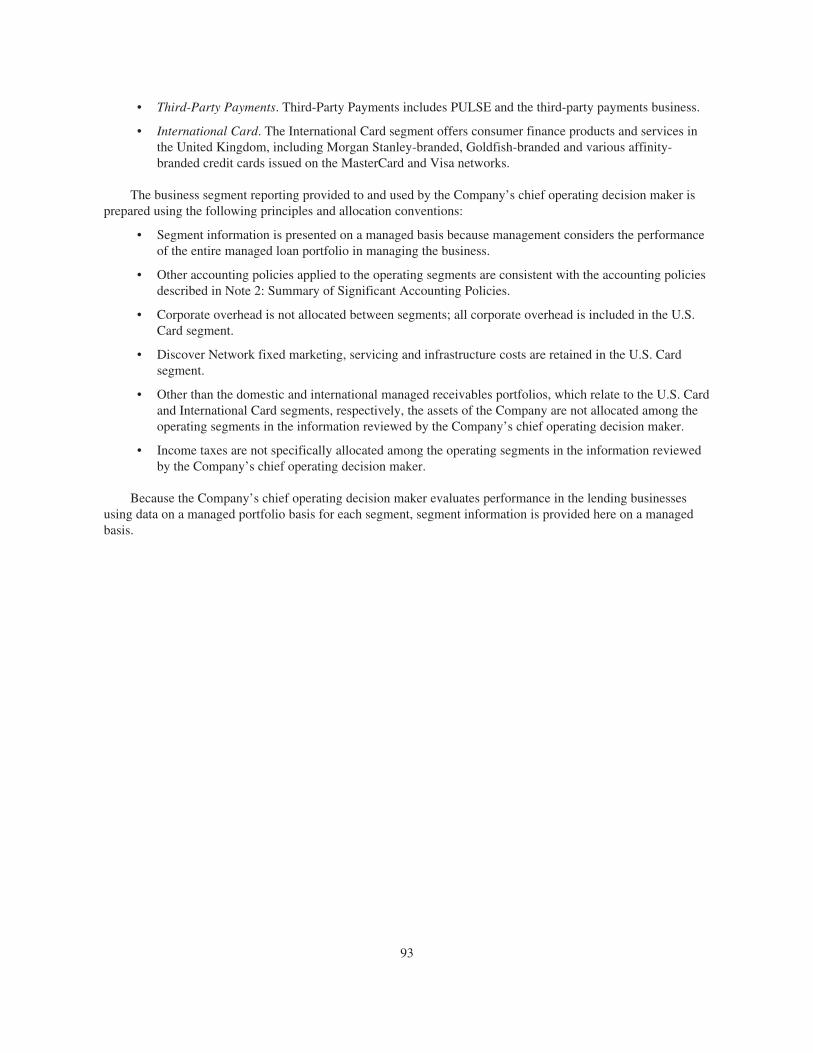
• Third-Party Payments. Third-Party Payments includes PULSE and the third-party payments business.
• International Card. The International Card segment offers consumer finance products and services inthe United Kingdom, including Morgan Stanley-branded, Goldfish-branded and various affinity-branded credit cards issued on the MasterCard and Visa networks.
The business segment reporting provided to and used by the Company’s chief operating decision maker isprepared using the following principles and allocation conventions:
• Segment information is presented on a managed basis because management considers the performanceof the entire managed loan portfolio in managing the business.
• Other accounting policies applied to the operating segments are consistent with the accounting policiesdescribed in Note 2: Summary of Significant Accounting Policies.
• Corporate overhead is not allocated between segments; all corporate overhead is included in the U.S.Card segment.
• Discover Network fixed marketing, servicing and infrastructure costs are retained in the U.S. Cardsegment.
• Other than the domestic and international managed receivables portfolios, which relate to the U.S. Cardand International Card segments, respectively, the assets of the Company are not allocated among theoperating segments in the information reviewed by the Company’s chief operating decision maker.
• Income taxes are not specifically allocated among the operating segments in the information reviewedby the Company’s chief operating decision maker.
Because the Company’s chief operating decision maker evaluates performance in the lending businessesusing data on a managed portfolio basis for each segment, segment information is provided here on a managedbasis.
93

The following table presents segment data on a managed basis (dollars in thousands):
Managed Basis
SecuritizationAdjustment(1)
GAAP Basis
For the Years Ended November 30, U.S. CardThird-Party
PaymentsInternational
Card Total Total
2007Interest income . . . . . . . . . . . . . . . $6,376,298 $ 2,376 $ 481,845 $6,860,519 $(3,972,350) $2,888,169Interest expense . . . . . . . . . . . . . . 2,729,065 19 246,704 2,975,788 (1,593,373) 1,382,415
Net interest income . . . . . . . 3,647,233 2,357 235,141 3,884,731 (2,378,977) 1,505,754Provision for loan losses . . . . . . . 1,853,396 — 317,446 2,170,842 (1,220,677) 950,165Other income . . . . . . . . . . . . . . . . 2,101,076 118,700 168,043 2,387,819 1,158,300 3,546,119Other expense(2) . . . . . . . . . . . . . . 2,390,463 84,097 681,952 3,156,512 — 3,156,512
Income (loss) before incometax expense(2) . . . . . . . . . . $1,504,450 $ 36,960 $(596,214) $ 945,196 $ — $ 945,196
2006Interest income . . . . . . . . . . . . . . . $5,748,698 $ 1,801 $ 416,986 $6,167,485 $(3,708,959) $2,458,526Interest expense . . . . . . . . . . . . . . 2,160,569 23 176,997 2,337,589 (1,397,549) 940,040
Net interest income . . . . . . . 3,588,129 1,778 239,989 3,829,896 (2,311,410) 1,518,486Provision for loan losses . . . . . . . 1,663,472 — 238,172 1,901,644 (1,146,007) 755,637Other income . . . . . . . . . . . . . . . . 2,097,676 110,700 165,160 2,373,536 1,165,403 3,538,939Other expense . . . . . . . . . . . . . . . . 2,381,880 83,529 254,074 2,719,483 — 2,719,483
Income (loss) before incometax expense . . . . . . . . . . . . $1,640,453 $ 28,949 $ (87,097) $1,582,305 $ — $1,582,305
2005(3)
Interest income . . . . . . . . . . . . . . . $5,409,381 $ 673 $ 294,343 $5,704,397 $(3,529,586) $2,174,811Interest expense . . . . . . . . . . . . . . 1,671,331 95 129,671 1,801,097 (1,024,618) 776,479
Net interest income . . . . . . . 3,738,050 578 164,672 3,903,300 (2,504,968) 1,398,332Provision for loan losses . . . . . . . 2,263,617 — 126,462 2,390,079 (1,511,593) 878,486Other income . . . . . . . . . . . . . . . . 1,753,828 92,143 97,691 1,943,662 993,375 2,937,037Other expense . . . . . . . . . . . . . . . . 2,272,126 92,866 167,635 2,532,627 — 2,532,627
Income (loss) before incometax expense . . . . . . . . . . . . $ 956,135 $ (145) $ (31,734) $ 924,256 $ — $ 924,256
(1) The Securitization Adjustment column presents the effect of loan securitizations by recharacterizing as securitization income the portionsof the following items that relate to the securitized loans: interest income, interest expense, provision for loan losses, discount andinterchange revenue and loan fee revenues. Securitization income is reported in other income.
(2) 2007 includes a $391 million pretax ($279 million after tax) non-cash impairment charge related to the Company’s International Cardsegment.
(3) PULSE was acquired in January 2005.
94

24. International Activities
The Company’s international activities consist entirely of consumer lending, originating from the UnitedKingdom. Selected financial data regarding the U.K. operations is provided in the table below (dollars inthousands):
For the Years Ended November 30,
2007 2006 2005
Total assets . . . . . . . . . . . . . . . . . . . . . . . . . . . . . . . . . . . . . . . . . . . . . . . . $4,062,920 $3,467,691 $2,260,998Total income(1) . . . . . . . . . . . . . . . . . . . . . . . . . . . . . . . . . . . . . . . . . . . . . . 473,203 419,610 256,457Loss before income tax benefit(2) . . . . . . . . . . . . . . . . . . . . . . . . . . . . . . . (596,214) (87,097) (31,734)Net loss(2) . . . . . . . . . . . . . . . . . . . . . . . . . . . . . . . . . . . . . . . . . . . . . . . . . . $ (385,457) $ (56,613) $ (21,641)
(1) Total income is the sum of interest income and other income.(2) 2007 includes a $391 million pretax ($279 million after tax) non-cash impairment charge related to the Company’s International Card
segment.
The provision for loan losses is allocated based on specific loss experience and risk characteristics ofinternational loan receivables. See Note 5: Loan Receivables for further information on international loanreceivables.
Prior to the Distribution, certain estimates and assumptions with regard to funding costs and capital wereassigned to the U.K. operations. Economic capital was computed based on an internal allocation methodologyand was the primary factor in the determination of funding requirements. Costs associated with U.K. fundinglevels were allocated at amounts approximating the costs incurred during those periods to obtain the funding.
25. Geographical Distribution of Loans
The Company originates credit card and other consumer loans primarily throughout the United States and toa lesser degree in the United Kingdom. The loan receivables are predominantly credit card loans. The geographicdistribution of the Company’s loan receivables was as follows (dollars in thousands):
November 30, 2007 November 30, 2006
LoanReceivables
Percentageof Total
LoanReceivables
Percentageof Total
Domestic:California . . . . . . . . . . . . . . . . . . . . . . . . . . . . . . . . . . . $ 2,091,029 8.7% $ 2,027,783 8.6%Texas . . . . . . . . . . . . . . . . . . . . . . . . . . . . . . . . . . . . . . . 1,628,695 6.8 1,685,358 7.1New York . . . . . . . . . . . . . . . . . . . . . . . . . . . . . . . . . . . 1,389,500 5.8 1,405,879 5.9Florida . . . . . . . . . . . . . . . . . . . . . . . . . . . . . . . . . . . . . . 1,303,160 5.4 1,216,199 5.1Illinois . . . . . . . . . . . . . . . . . . . . . . . . . . . . . . . . . . . . . . 1,110,425 4.6 1,125,900 4.8Pennsylvania . . . . . . . . . . . . . . . . . . . . . . . . . . . . . . . . . 986,965 4.1 981,693 4.1Ohio . . . . . . . . . . . . . . . . . . . . . . . . . . . . . . . . . . . . . . . . 912,000 3.8 918,009 3.9Michigan . . . . . . . . . . . . . . . . . . . . . . . . . . . . . . . . . . . . 769,693 3.2 787,767 3.3New Jersey . . . . . . . . . . . . . . . . . . . . . . . . . . . . . . . . . . 743,108 3.1 745,763 3.1Other States . . . . . . . . . . . . . . . . . . . . . . . . . . . . . . . . . . 9,896,542 41.5 9,895,893 41.7
Domestic . . . . . . . . . . . . . . . . . . . . . . . . . . . . . . . . 20,831,117 87.0 20,790,244 87.6International:
United Kingdom . . . . . . . . . . . . . . . . . . . . . . . . . . . . . . 3,123,178 13.0 2,952,506 12.4
Loan receivables . . . . . . . . . . . . . . . . . . . . . . $23,954,295 100.0% $23,742,750 100.0%
95
26. Related Party Transactions
Related Party Transactions with Morgan Stanley
Effective upon the Distribution on June 30, 2007, Morgan Stanley ceased to be a related party to theCompany. Prior to the Distribution, Morgan Stanley provided a variety of products and services to the Companyor on the Company’s behalf and the Company provided certain products and services to Morgan Stanley.Subsequent to the Distribution, certain arrangements with Morgan Stanley have continued in accordance with theTransition Services Agreement and other agreements by and between Morgan Stanley and the Company (seeForm 10, as amended). Transactions with Morgan Stanley subsequent to the Distribution are not isolated fromthose conducted with other third parties.
Information provided below includes the amounts of transactions with Morgan Stanley for the seven monthsended June 30, 2007 (the date of the Distribution) and the twelve months ended November 30, 2006 and 2005.Amounts due from or to Morgan Stanley are only provided as of November 30, 2006 as Morgan Stanley was nota related party as of November 30, 2007.
In 2006, the Company began purchasing Federal Funds from Morgan Stanley Bank. Interest expense onFederal Funds purchased from Morgan Stanley Bank was $29.5 million and $22.8 million for the years endedNovember 30, 2007 and 2006, respectively. At November 30, 2006, there were $3.0 billion in Federal Fundsfrom Morgan Stanley Bank reported in short-term borrowings in the combined statement of financial condition.
In 2006, the Company began participating in the Morgan Stanley Global Wealth Management Bank DepositProgram launched by Morgan Stanley DW Inc. (“MSDW”). Under the program, MSDW sweeps excess clientcash into interest-bearing deposit accounts at FDIC-insured banks participating in the program. The Companyincurred related servicing and administrative fees in the years ended November 30, 2007 and 2006 of $19.4million and $11.0 million, respectively. At November 30, 2006, the outstanding interest-bearing deposit balancerelated to the Morgan Stanley Global Wealth Management Bank Deposit Program was $1.9 billion.
The Company paid brokerage commissions to Morgan Stanley for the sales of certificates of deposit. Thesecommissions totaled $38.1 million, $5.6 million and $47.0 million for the years ended November 30, 2007, 2006and 2005, respectively. These commissions are amortized to interest expense over the lives of the relatedcertificates of deposit. At November 30, 2006, unamortized prepaid commissions on these certificates of depositwere $29.2 million, and were included in other assets in the combined statement of financial condition.Amortization of the prepaid commissions was $16.2 million, $27.6 million and $32.2 million for the years endedNovember 30, 2007, 2006 and 2005, respectively.
In 2007, 2006 and 2005, the Company paid underwriting fees on credit card securitizations to MorganStanley of $6.3 million, $11.3 million and $8.4 million, respectively. Amortization of such underwriting feesduring the same periods was $5.6 million, $9.0 million and $8.9 million, respectively. Deferred underwriting feesassociated with these expenses were $19.6 million at November 30, 2006, and were included in other assets inthe consolidated and combined statements of financial condition.
In 2007 and 2006, the Company sold $41.4 million and $255.5 million, respectively, of mortgage loans toMorgan Stanley Credit Corporation (“MSCC”). The gains recognized on these sales in 2007, 2006 and 2005 were$2.4 million, $7.4 million and $6.2 million, respectively. In most instances, these loans, when originated, wererecorded in loans held for sale until sold. At November 30, 2006, mortgage loans held for sale that weresubsequently sold to MSCC were $3.7 million.
In the ordinary course of business, the Company entered into interest rate swap and foreign currencyexchange contracts with various counterparties, including Morgan Stanley Capital Services Inc., a wholly-ownedsubsidiary of Morgan Stanley, which serves as Morgan Stanley’s principal U.S. swaps dealer, to economically
96

hedge interest rate and currency exchange risks as part of its risk management program and under termsconsistent with those that would have been offered to an unrelated third-party.
The Company had short-term and long-term debt obligations to Morgan Stanley prior to the Distributionwhich have all been repaid as of November 30, 2007. At November 30, 2006, the Company had short-termobligations to Morgan Stanley of $6.6 billion. Interest expense on short-term obligations to Morgan Stanley was$142.7 million, $159.9 million and $94.0 million for the years ended November 30, 2007, 2006 and 2005,respectively. At November 30, 2006, the Company had long-term obligations to Morgan Stanley of $1.3 billion.Interest expense on long-term obligations to Morgan Stanley was $31.1 million, $62.3 million and $48.9 millionfor the years ended November 30, 2007, 2006 and 2005, respectively.
MSCC provided transaction processing and other support services related to consumer loan products offeredby the Company. The costs of providing these services were included in information processing and othercommunications and amounted to $2.8 million, $7.8 million and $4.6 million for years ended November 30,2007, 2006 and 2005, respectively.
In 2006 and 2005, the Company recorded $2.6 million and $3.0 million, respectively, in professional feesfor services provided by Morgan Stanley for investment banking fees for acquisition-related costs of the Goldfishand PULSE acquisitions. There were no professional fees for services provided by Morgan Stanley in 2007.
In 2007, 2006 and 2005, the Company received $3.1 million, $4.9 million and $4.8 million, respectively, insublease rental income from Morgan Stanley. Morgan Stanley maintains offices at three Company-ownedlocations in Riverwoods, Illinois; New Albany, Ohio; and West Valley City, Utah.
In 2007, 2006 and 2005 the Company recorded $3.0 million, $4.7 million and $4.8 million, respectively, inrent expense for subleasing office space from Morgan Stanley in London, England and Glasgow, Scotland.
As a subsidiary of Morgan Stanley, the Company was charged for certain corporate functions such asCompany IT, Company Management, Finance, Legal and Compliance, and Strategy, Administration and other.The primary allocation methodologies utilized by Morgan Stanley included level of support, headcount and aformula that considered revenues, expenses and capital. Each corporate function separately determined themethodology to employ for their allocable expenses.
The table below summarizes intercompany expense allocations by functional area(1) (dollars in thousands):
For the Years Ended November 30,
2007 2006 2005
Company IT . . . . . . . . . . . . . . . . . . . . . . . . . . . . . . . . . . . . . . . . . . . . . . . . . . . . . . $ 2,608 $ 5,954 $ 6,713Company Management(2) . . . . . . . . . . . . . . . . . . . . . . . . . . . . . . . . . . . . . . . . . . . . 13,071 24,293 29,142Finance . . . . . . . . . . . . . . . . . . . . . . . . . . . . . . . . . . . . . . . . . . . . . . . . . . . . . . . . . . 13,973 21,615 27,108Legal and Compliance . . . . . . . . . . . . . . . . . . . . . . . . . . . . . . . . . . . . . . . . . . . . . . 7,021 8,637 13,957Strategy, Administration and other . . . . . . . . . . . . . . . . . . . . . . . . . . . . . . . . . . . . 14,944 30,242 20,026
Total Morgan Stanley allocations . . . . . . . . . . . . . . . . . . . . . . . . . . . . . . . . . $51,617 $90,741 $96,946
(1) Allocations based on percentage of total expenses of each functional area versus line item specific allocations. Majority of allocationsrelates to compensation expense.
(2) Represents allocations of Morgan Stanley senior management costs.
The Company provided corporate card services to Morgan Stanley, the outstanding balances of which wereincluded in Credit card loan receivables and totaled $14.4 million at November 30, 2006.
The Company included non-interest bearing amounts payable to Morgan Stanley in accrued expenses andother liabilities for expenses paid by Morgan Stanley on behalf of the Company including, but not limited to,
97

401(k) matching, amortization of compensation cost related to restricted stock grants, tax benefits for exercisedstock options and fees for management of the Morgan Stanley Global Wealth Management Bank DepositProgram. The balance payable to Morgan Stanley was $171.6 million at November 30, 2006.
At November 30, 2006, accrued expenses and other liabilities included federal and state income taxes duefrom Morgan Stanley of $19.8 million. At November 30, 2006, other assets included $2.4 million of interest duefrom Morgan Stanley related to the settlement of various tax matters.
The Company paid dividends to Morgan Stanley during the years ended November 30, 2007 and 2006 of$850.0 million and $500.0 million, respectively. The Company paid no dividends to Morgan Stanley during theyear ended November 30, 2005.
In conjunction with the Distribution, in June 2007 Morgan Stanley contributed the legal entities comprisingthe International Card segment to the Company and capital of $135.0 million, resulting in the capital levelviewed appropriate to support the Company as a stand-alone entity.
While a subsidiary of Morgan Stanley, the Company received an allocation of capital from Morgan Stanleyto maintain a level of capital that management believed was appropriate to support the International Cardsegment. For the years ended November 30, 2007 and 2006, capital allocated to the Company from MorganStanley was $43.8 million and $512.9 million, respectively. These amounts are reflected as contributions fromMorgan Stanley in the consolidated and combined statements of cash flows.
Other Related Party Transactions
In the ordinary course of business, the Company offers consumer loan products to its directors, executiveofficers and certain members of their immediate families. These products are offered on substantially the sameterms as those prevailing at the time for comparable transactions with unrelated parties, and these receivables areincluded in the loan receivables in the Company’s consolidated and combined statements of financial condition.They were not material to the Company’s financial position or results of operations.
98

27. Parent Company Condensed Financial Information
The following Parent Company financial statements are provided in accordance with Regulation S-X of theSEC which requires all issuers or guarantors of registered securities to include separate annual financialstatements.
Discover Financial Services(Parent Company Only)
Condensed Statements of Financial Condition
November 30,
2007 2006
(dollars in thousands)
AssetsCash and due from banks . . . . . . . . . . . . . . . . . . . . . . . . . . . . . . . . . . . . . . . . . . . . . . . . $ 73 $ 49Federal Funds sold . . . . . . . . . . . . . . . . . . . . . . . . . . . . . . . . . . . . . . . . . . . . . . . . . . . . . 530,600 —Interest-earning time deposits due from subsidiary . . . . . . . . . . . . . . . . . . . . . . . . . . . . 4,051 4,053Notes receivable from subsidiaries . . . . . . . . . . . . . . . . . . . . . . . . . . . . . . . . . . . . . . . . . 1,323,245 2,528,298Investments in subsidiaries . . . . . . . . . . . . . . . . . . . . . . . . . . . . . . . . . . . . . . . . . . . . . . . 4,476,419 5,674,263Premises and equipment, net . . . . . . . . . . . . . . . . . . . . . . . . . . . . . . . . . . . . . . . . . . . . . . 9 269Other assets . . . . . . . . . . . . . . . . . . . . . . . . . . . . . . . . . . . . . . . . . . . . . . . . . . . . . . . . . . . 127,400 113,055
Total assets . . . . . . . . . . . . . . . . . . . . . . . . . . . . . . . . . . . . . . . . . . . . . . . . . . . . . . . $6,461,797 $8,319,987
Liabilities and Stockholders’ EquityNon-interest bearing deposit accounts . . . . . . . . . . . . . . . . . . . . . . . . . . . . . . . . . . . . . . $ 651 $ 953Short-term borrowings . . . . . . . . . . . . . . . . . . . . . . . . . . . . . . . . . . . . . . . . . . . . . . . . . . — 1,928,562Long-term borrowings . . . . . . . . . . . . . . . . . . . . . . . . . . . . . . . . . . . . . . . . . . . . . . . . . . . 799,222 438,579Accrued expenses and other liabilities . . . . . . . . . . . . . . . . . . . . . . . . . . . . . . . . . . . . . . 62,502 177,121
Total liabilities . . . . . . . . . . . . . . . . . . . . . . . . . . . . . . . . . . . . . . . . . . . . . . . . . . . . 862,375 2,545,215Stockholders’ equity . . . . . . . . . . . . . . . . . . . . . . . . . . . . . . . . . . . . . . . . . . . . . . . . 5,599,422 5,774,772
Total liabilities and stockholders’ equity . . . . . . . . . . . . . . . . . . . . . . . . . . . . . . . . $6,461,797 $8,319,987
99

Discover Financial Services(Parent Company Only)
Condensed Statements of Income
For the Years Ended November 30,
2007 2006 2005
(dollars in thousands)
Interest income . . . . . . . . . . . . . . . . . . . . . . . . . . . . . . . . . . . . . . . . . . . . . . . . $103,320 $ 143,538 $108,298Interest expense . . . . . . . . . . . . . . . . . . . . . . . . . . . . . . . . . . . . . . . . . . . . . . . . 99,159 133,418 104,469
Net interest income . . . . . . . . . . . . . . . . . . . . . . . . . . . . . . . . . . . . . . . . . 4,161 10,120 3,829Dividends from subsidiaries . . . . . . . . . . . . . . . . . . . . . . . . . . . . . . . . . . . . . . 589,265 500,000 175,000Management fees from subsidiaries . . . . . . . . . . . . . . . . . . . . . . . . . . . . . . . . 31,374 25,441 27,993Other income . . . . . . . . . . . . . . . . . . . . . . . . . . . . . . . . . . . . . . . . . . . . . . . . . . 894 — 8
Total income . . . . . . . . . . . . . . . . . . . . . . . . . . . . . . . . . . . . . . . . . . 625,694 535,561 206,830Other expense
Employee compensation and benefits . . . . . . . . . . . . . . . . . . . . . . . . . . . 28,117 26,627 23,734Marketing and business development . . . . . . . . . . . . . . . . . . . . . . . . . . . 257 400 451Information processing and communications . . . . . . . . . . . . . . . . . . . . . 405 171 175Professional fees . . . . . . . . . . . . . . . . . . . . . . . . . . . . . . . . . . . . . . . . . . . 4,067 2,997 2,416Premises and equipment . . . . . . . . . . . . . . . . . . . . . . . . . . . . . . . . . . . . . 3,473 3,699 3,855Other . . . . . . . . . . . . . . . . . . . . . . . . . . . . . . . . . . . . . . . . . . . . . . . . . . . . 1,250 1,667 1,199
Total other expense . . . . . . . . . . . . . . . . . . . . . . . . . . . . . . . . . . . . . 37,569 35,561 31,830
Income before income tax benefit and equity in undistributed net income ofsubsidiaries . . . . . . . . . . . . . . . . . . . . . . . . . . . . . . . . . . . . . . . . . . . . . . . . . 588,125 500,000 175,000
Income tax benefit . . . . . . . . . . . . . . . . . . . . . . . . . . . . . . . . . . . . . . . . . . . . . . 505 — —Equity in undistributed net income of subsidiaries . . . . . . . . . . . . . . . . . . . . . — 576,616 402,915
Net income . . . . . . . . . . . . . . . . . . . . . . . . . . . . . . . . . . . . . . . . . . . $588,630 $1,076,616 $577,915
100

Discover Financial Services(Parent Company Only)
Condensed Statements of Cash Flows
For the Years Ended November 30,
2007 2006 2005
(dollars in thousands)Cash flows from operating activitiesNet income . . . . . . . . . . . . . . . . . . . . . . . . . . . . . . . . . . . . . . . . . . . . . . . . . $ 588,630 $1,076,616 $ 577,915Adjustments to reconcile net income to net cash provided by operating
activities:Non-cash charges included in net income:
Equity in undistributed earnings of subsidiaries . . . . . . . . . . . . — (576,616) (402,915)Compensation payable in common stock options . . . . . . . . . . . 35,710 — —Deferred income taxes . . . . . . . . . . . . . . . . . . . . . . . . . . . . . . . . (16,011) 4,465 (3,461)Depreciation and amortization . . . . . . . . . . . . . . . . . . . . . . . . . 45 8 17
Changes in assets and liabilities:(Increase) decrease in other assets . . . . . . . . . . . . . . . . . . . . . . . (3,862) 17,901 (8,322)(Decrease) increase in other liabilities and accrued
expenses . . . . . . . . . . . . . . . . . . . . . . . . . . . . . . . . . . . . . . . . . (114,548) 44,301 1,769
Net cash provided by operating activities . . . . . . . . . . . . . 489,964 566,675 165,003Cash flows from investing activitiesNet proceeds from (payments for):
(Increase) decrease in investment in subsidiaries . . . . . . . . . . . . . . . 1,241,781 — —(Increase) decrease in loans to subsidiaries . . . . . . . . . . . . . . . . . . . . (465,776) (44,403) 63,509Decrease in loans to Morgan Stanley . . . . . . . . . . . . . . . . . . . . . . . . 118,160 398,335 503,021Decrease in other loans . . . . . . . . . . . . . . . . . . . . . . . . . . . . . . . . . . . 1,460,066 3,712 106Purchases of premises and equipment . . . . . . . . . . . . . . . . . . . . . . . . 233 (256) (4)
Net cash provided by investing activities . . . . . . . . . . . . . 2,354,464 357,388 566,632Cash flows from financing activitiesNet (decrease) increase in short-term borrowings . . . . . . . . . . . . . . . . . . . (1,824,603) (424,028) (730,772)Proceeds from issuance of long-term debt and bank notes . . . . . . . . . . . . 799,204 — —Maturity of long-term borrowings . . . . . . . . . . . . . . . . . . . . . . . . . . . . . . . (438,579) — —Purchases of treasury stock . . . . . . . . . . . . . . . . . . . . . . . . . . . . . . . . . . . . (1,419) — —Net (decrease) increase in deposits . . . . . . . . . . . . . . . . . . . . . . . . . . . . . . (302) (462) (398)Capital contributions from Morgan Stanley . . . . . . . . . . . . . . . . . . . . . . . 31,041 — —Dividends paid to Morgan Stanley . . . . . . . . . . . . . . . . . . . . . . . . . . . . . . (850,000) — —Dividends paid . . . . . . . . . . . . . . . . . . . . . . . . . . . . . . . . . . . . . . . . . . . . . . (29,146) (500,000) —
Net cash used for financing activities . . . . . . . . . . . . . . . . (2,313,804) (924,490) (731,170)
Increase (decrease) in cash and cash equivalents . . . . . . . . . . . . . . . . . . . 530,624 (427) 465Cash and cash equivalents, at beginning of year . . . . . . . . . . . . . . . . . . . . 49 476 11
Cash and cash equivalents, at end of year . . . . . . . . . . . . . . . . . . . . . . . . . $ 530,673 $ 49 $ 476
Supplemental Disclosures:Cash paid during the year for:
Interest . . . . . . . . . . . . . . . . . . . . . . . . . . . . . . . . . . . . . . . . . . . . . . . . $ 87,639 $ 140,746 $ 97,349
Income taxes, net of income tax refunds . . . . . . . . . . . . . . . . . . . . . . $ 27,923 $ 17 $ (2,538)
Non-cash TransactionsCapital contributions (to) from Morgan Stanley . . . . . . . . . . . . . . . . $ 103,959 $ — $ —
101

28. Subsequent Events
On December 19, 2007, the Company declared a dividend of $0.06 per share. The cash dividend was paidon January 22, 2008 to stockholders of record at the close of business on January 3, 2008.
On February 7, 2008 the Company and Barclays Bank Plc entered into a definitive sale and purchaseagreement relating to the sale of £129 million of net assets (equivalent to approximately $258 million) of theCompany’s U.K. credit card business, which represented substantially all of the Company’s International Cardsegment and included $3.1 billion in owned loan receivables at November 30, 2007. The aggregate sale priceunder the agreement is £35 million (equivalent to approximately $70 million), payable in cash at closing andsubject to a post-closing adjustment. The closing is expected to occur by the end of the Company’s secondquarter of 2008. As a result, the International Card segment will be presented as discontinued operationsbeginning with first quarter 2008 reporting. The sale is subject to the satisfaction of a number of conditions,including clearance from the U.K. Office of Fair Trading, a minimum value of receivables to be transferred andconsents under material contracts. There can be no assurance that the sale will occur by the end of the secondquarter of 2008, if at all.
Based on the terms of the sale, the Company expects to record charges of approximately $240 to $270million pre-tax ($190 to $210 million after tax) in the first quarter of 2008 associated with classifying thesegment as held for sale, substantially all of which will be non-cash. These charges, the majority of which areexpected to be recognized in the first quarter of 2008, include approximately $5 million related to the terminationof certain contractual arrangements and approximately $7 million of employee-related costs. This will bepartially offset by the proceeds from the sale of other assets related to the U.K. business of approximately $45million.
29. Quarterly Results (unaudited) (dollars in thousands):
November 30,2007
August 31,2007
May 31,2007
February 28,2007
November 30,2006
August 31,2006
May 31,2006
February 28,2006
Interest income . . . . . . . . . . . . . . $ 748,889 $755,610 $703,365 $680,305 $622,166 $642,748 $607,181 $586,431Interest expense . . . . . . . . . . . . . . 400,734 361,469 336,253 283,959 243,518 250,440 217,336 228,746
Net interest income . . . . . . . . . 348,155 394,141 367,112 396,346 378,648 392,308 389,845 357,685Provision for loan losses . . . . . . . 339,916 211,576 203,287 195,386 239,693 231,614 129,502 154,828Other income . . . . . . . . . . . . . . . . 1,003,251 845,498 871,693 825,677 828,263 889,374 932,027 889,275Other expense(1) . . . . . . . . . . . . . . 1,099,495 698,849 702,992 655,176 781,677 682,537 648,034 607,235
Income (loss) before incometax expense (benefit)(1) . . . . (88,005) 329,214 332,526 371,461 185,541 367,531 544,336 484,897
Income tax expense (benefit)(1) . . (31,521) 126,974 123,284 137,829 (981) 126,138 201,058 179,474
Net income (loss)(1) . . . . . . . . . $ (56,484) $202,240 $209,242 $233,632 $186,522 $241,393 $343,278 $305,423
Basic earnings (loss) percommon share . . . . . . . . . . . . . $ (0.12) $ 0.42 $ 0.44 $ 0.49 $ 0.39 $ 0.51 $ 0.72 $ 0.64
Diluted earnings (loss) percommon share . . . . . . . . . . . . . $ (0.12) $ 0.42 $ 0.44 $ 0.49 $ 0.39 $ 0.51 $ 0.72 $ 0.64
(1) November 30, 2007 includes a $391 million pretax ($279 million after tax) non-cash impairment charge related to the Company’sInternational Card segment.
102

Market for Registrant’s Common Equity and Stock Performance Graph
Common Stock Market Prices and Dividends
Our common stock began trading “regular way” on the NYSE (ticker symbol DFS) on July 2, 2007. Theapproximate number of record holders of our common stock at January 31, 2008 was 94,150.
The following table sets forth the quarterly high and low stock prices as reported by the NYSE and thedividends declared by Discover Financial Services during the quarter indicated:
2007
Stock Price Cash DividendsDeclaredQuarter Ended High Low
August 31 . . . . . . . . . . . . . . . . . . . . . . . . . . . . . . . . . . . . . . . . . . . . $29.15 $20.35 —November 30 . . . . . . . . . . . . . . . . . . . . . . . . . . . . . . . . . . . . . . . . . $24.00 $15.72 $0.06
Discover Financial Services expects to continue its policy of paying regular cash dividends, although thereis no assurance as to future dividends because they are subject to board approval and depend on future earnings,capital requirements and financial condition.
Stock Performance Graph
The following graph compares the cumulative total stockholder return (rounded to the nearest whole dollar)of the Company’s common stock, the S&P 500 Stock Index and the S&P 500 Financials Index for the periodfrom July 2, 2007 through November 30, 2007. The graph assumes an initial investment of $100 on July 2, 2007,the date the Company began “regular way” trading on the NYSE following the Distribution. The cumulativereturns include stock price appreciation and assume full reinvestment of dividends. This graph does not forecastfuture performance of the Company’s common stock.
$0
$20
$40
$60
$80
$100
$120
Discover Financial Services
S&P 500 Index
S&P 500 Financials Index
7-02-07 11-30-0710-31-079-30-078-31-077-31-07
July 2, 2007 November 30, 2007
Discover Financial Services . . . . . . . . . . . . . . . . . . . . . . . . . . . . . . . . . $100.00 $63.36S&P 500 . . . . . . . . . . . . . . . . . . . . . . . . . . . . . . . . . . . . . . . . . . . . . . . . $100.00 $97.48S&P 500 Financials . . . . . . . . . . . . . . . . . . . . . . . . . . . . . . . . . . . . . . . $100.00 $84.67
103

BOARD OF DIRECTORS
Dennis D. DammermanChairman, Discover FinancialServices. Retired Vice Chairman,General Electric Company
Jeffrey S. AroninPresident and CEO,Ovation Pharmaceuticals, Inc.
Mary K. BushPresident, Bush International
Gregory C. CasePresident and CEO, Aon
Robert M. DevlinChairman, CurraghCapital Partners
Philip A. LaskawyRetired Chairman and CEO,Ernst & Young LLP
Michael H. MoskowRetired CEO, FederalReserve Bank of Chicago
David W. NelmsCEO, DiscoverFinancial Services
Michael L. RankowitzRetired, senior advisor toMorgan Stanley
E. Follin SmithRetired Executive Vice President,CFO and CAO,Constellation Energy Group
Lawrence A. WeinbachPartner, Yankee HillCapital Management LLC
EXECUTIVE OFFICERS
David W. NelmsChief Executive Officer
Roger C. HochschildPresident and ChiefOperating Officer
Roy A. GuthrieExecutive Vice President,Chief Financial Officer
Kathryn McNamara CorleyExecutive Vice President,General Counsel and Secretary
Margaret H. GeorgiadisExecutive Vice President,Chief Marketing Officer
Charlotte M. HoggSenior Vice President,International
Carlos MinettiExecutive Vice President,Cardmember Services andConsumer Banking
Diane E. OffereinsExecutive Vice President,Chief Technology Officer
James V. PanzarinoSenior Vice President,Chief Credit Risk Officer
Harit TalwarExecutive Vice President,Discover Network
PRIMARY INVESTOR CONTACT
Investor Relations2500 Lake Cook RoadRiverwoods, IL 60015Phone: [email protected]
FORM 10-K
A copy of our Annual Reporton Form 10-K for fiscal 2007filed with the SEC will befurnished without charge toany shareholder by contactingInvestor Relations (see above).
CERTIFICATIONS
We have included as exhibits toour Annual Report on Form 10-Kthe certifications of our ChiefExecutive Officer and ChiefFinancial Officer required underSection 302 of the Sarbanes-Oxley Act of 2002 to be filedwith the SEC regarding thequality of our public disclosure.
TRANSFER AGENT
Mellon Investor Services LLC200 W. Monroe StreetSuite 1590Chicago, IL 60606Phone: 1-866-258-6590Corporate Web site:www.melloninvestor.com/ISD
ANNUAL SHAREHOLDERS’ MEETING
The 2008 Annual Meeting ofShareholders of DiscoverFinancial Services will be heldon Thursday, April 10, 2008,at 9:00 AM CT at thecompany’s headquarters at2500 Lake Cook Road,Riverwoods, IL 60015.
Discover, Cashback Bonus, More,Motiva, Open Road, PULSE andthe other trademarks, logos andservice marks used in this FinancialAnnual Report are the trademarksof Discover Financial Services ortheir respective third-party owners.
104

2500 Lake Cook Road Riverwoods, IL 60015
www.discoverfinancial.com
©2
00
8 D
FS S
ervi
ces
LLC