disclaimer: this report prepared by the market … report on european electricity markets ... from...
TRANSCRIPT

1
DISCLAIMER: This report prepared by the Market Observatory for Energy of the European Commission aims at enhancing public access to information about prices of electricity in the Members States of the European Union. Our goal is to keep this information timely and accurate. If errors are brought to our attention, we will try to correct them. However the Commission accepts no responsibility or liability whatsoever with regard to the information contained in this publication.
Copyright notice: Reproduction is authorised provided the source is acknowledged. © European Commission, Directorate-General for Energy, Market Observatory for Energy, 2015 Commission européenne, B-1049 Bruxelles / Europese Commissie, B-1049 Brussel – Belgium E-mail: [email protected]

2
QUARTERLY REPORT ON EUROPEAN ELECTRICITY MARKETS
CONTENT
HIGHLIGHTS OF THE REPORT .............................................................................................. 3
EXECUTIVE SUMMARY ......................................................................................................... 4
1 ELECTRICITY DEMAND DRIVERS .................................................................................. 5
2 EVOLUTION OF COMMODITY AND POWER PRICES ..................................................... 7
2.1 Evolution of power prices, and the main factors affecting power generation costs ................................................................................................ 7
2.2 Comparisons of monthly electricity baseload prices on electricity markets ... 9
3 TRADED VOLUMES AND CROSS BORDER TRADE OF ELECTRICITY ........................... 14
3.1 Comparison of wholesale market trading platforms and the over-the-counter (OTC) markets .................................................................................... 14
3.2 Cross border trade of electricity ..................................................................... 15
4 REGIONAL WHOLESALE ELECTRICITY MARKETS ....................................................... 16
4.1 Central Western Europe (Austria, Belgium, France, Germany, the Netherlands, Switzerland) ............................................................................... 16
4.2 British Isles (UK, Ireland) ................................................................................. 17
4.3 Northern Europe (Denmark, Estonia, Finland, Latvia, Lithuania, Norway, Sweden) ........................................................................................................... 19
4.4 Apennine Peninsula (Italy) .............................................................................. 19
4.5 Iberian Peninsula (Spain and Portugal) .......................................................... 20
4.6 Central Eastern Europe (Czech Republic, Hungary, Poland, Romania, Slovakia, Slovenia) .......................................................................................... 21
4.7 South Eastern Europe (Greece) ....................................................................... 23
5 INTERNATIONAL OUTLOOK – COMPARING EU POWER PRICES WITH INTERNATIONAL PEERS ............................................................................................. 23
6 RETAIL ELECTRICITY PRICES IN THE EU ..................................................................... 25
7 GLOSSARY .................................................................................................................. 30

3
HIGHLIGHTS OF THE REPORT
Wholesale electricity prices decreased in the second quarter of 2015 and were lower than the typical
level seen in the last few years in most of the European markets.
Renewable power generation (wind, solar and biomass) continued to grow in most of the European
countries and together with hydro it assured 35% of the EU power generation in May 2015, contributing
to low wholesale electricity prices.
The Central West Europe power region switched to flow-based market coupling on 21 May 2015 and
this resulted in increasing cross border physical power flows in the region.
Further electricity infrastructure and interconnection developments are needed to reduce (or eliminate)
permanent price differentials in coupled regions, (e.g.: Baltic States in the Nordpool market or the
Iberian peninsula in the North West Europe region).
Natural gas continued to be squeezed out from the European power mix, giving up its share mainly in
favour of renewables, though some recent policy measures (e.g.: climate change levy increase in the UK)
may contribute to improve its relative position against coal.
Convergence of retail electricity prices across the EU could better be observed in the case of industrial
customers (especially large industrial customers) than households, primarily owing to less importance
of non-market elements in final prices and the lack of end-user price regulation.
Changes in different components of retail electricity prices (energy costs, network costs, taxes and
levies) can be significant, even over short time periods, following the implementation of energy policy
objectives.

4
EXECUTIVE SUMMARY
Electricity consumption in the EU remained practically unchanged in January-May 2015, compared to the
same period of the previous year, whereas economic growth in the EU-28 continued and GDP was up by 1.8% in the first half of 2015 in year-on year comparison. Decoupling of the evolution of electricity consumption from the economic growth in the EU continued in the first half of 2015.
The Platts' European Power Index (PEP), expressing the average evolution of the wholesale power prices in the
European markets, turned down again in the second quarter of 2015 and in May 2015 it fell almost to the lows registered in summer 2014. The combined share of hydro and renewable energy sources in the EU rose to 35% in May 2015, being the highest in the last ten years. Coal and natural gas prices continued their downward trend in the second quarter of 2015; reducing further power generation costs and putting downward pressure on wholesale electricity prices in many European markets.
Wholesale electricity prices decreased in the second quarter of 2015 and were lower than the typical
magnitude of local prices during the last few years in most of the European markets. In Germany the monthly baseload electricity price fell to twelve-year low in May 2015 (25 €/MWh), primarily owing to increasing wind and solar generation. In the Nordic markets significant hydro generation assured low wholesale electricity price levels, in contrast to the Iberian region, where low hydro generation resulted in relatively high prices.
In the UK the increase in the climate change levy resulted in a measurable increase in wholesale
electricity prices at the beginning of Q2 2015. Although the climate change levy impacted the competition
between coal and gas in the country's generation mx, giving support to gas fired generation, in most of the EU countries natural gas, being uncompetitive compared with other generation sources, continued to be gradually squeezed out from power generation, giving up its share mostly in favour of renewables.
On 21 May 2015 the Central Western Europe region switched to flow-based market coupling, enabling to
maximise cross border physical flows in the region. As data show, cross border flows significantly increased
from Germany to the Netherlands and from France to Belgium after the implementation of the flow-based coupling had taken place. However, in the North Western Europe coupled region there were still significant price differentials between national and regional prices, partly stemming from insufficient cross border power trade (e.g.: on the French-Spanish border), which points to the need of further integration of the electricity markets and reinforcing of interconnector capacities.
Over the last few years industrial retail electricity prices showed signs of gradual convergence across the
EU, especially in the case of customers having high annual electricity consumption. The share of non-
market elements, such as transmission and distribution cost, taxes and levies in the final electricity price is normally lower in the case of large customers, whereas the cost of energy is higher; enabling the retail prices to better track wholesale price developments. In the case of households retail electricity price convergence across the EU could hardly be observed, primarily owing to the high share of non-market elements in the final retail price and the existence of end-user price regulation in many EU member states.
The two maps at the end of the report present retail electricity prices paid by households and industrial
customers, having medium level of annual electricity consumption, in the second quarter of 2015.
Comparing the quarterly average wholesale and retail prices, there were significant differences in the price ranking across the EU, primarily owing to differences in the importance of network costs and taxes within final retail prices and the existence of retail price regulation in many countries, which factors might weaken the relation between wholesale and retail prices.
Looking at household retail electricity prices in European capital cities, it is important to note that behind
the change in the final retail prices over a given time period significant structural shifts within cost components (energy costs, network costs and taxes) might be hidden, as a result of the implementation of energy policy objectives.

5
1 Electricity demand drivers
As Figure 1 shows, the economic growth in the EU-28 continued in the second quarter of 2015, and GDP grew by 1.9% in year-on-year comparison, showing a slight acceleration in the growth rate compared to the previous quarters.
Electricity consumption in the EU-28 remained practically unchanged in the first five months of 2015 (255.9 TWh on monthly average) compared to the same period of 2014. However, it must be noted that decentralised forms of electricity generation do not appear in statistics provided by electricity transmission system operators, serving as the basis for electricity consumption statistics, thus the actual electricity consumption might be underestimated.
Figure 1 – EU 28 GDP Q/Q-4 change (%)
Source: Eurostat
Figure 2 and Figure 3 show the monthly deviation of actual Heating Degree Days (HDDs) in April-May 2015 and the monthly deviation of actual Cooling Degree Days (CDDs) in June 2015 from the long term average in the twenty-eight member states of the EU altogether.
In most of the member states actual HDDs were lower than the long term average in April 2015, implying that the weather was generally milder than usual. In May 2015, however, in more than half of the EU countries the HDDs were higher than the long term average, meaning that temperatures were lower than the long term seasonal average.
In June 2015, as the heating season was over in all Europe, it was rather meaningful to analyse cooling degree days, as in some member states hot weather has cooling-need-driven impact on residential electricity demand. In Spain and Portugal temperatures were significantly higher in June 2015 compared to the long term average, and this factor impacted their wholesale electricity markets as well (See Chapter 4.5).

6
Figure 2 – Deviation of actual Heating Degree Days (HDDs) from the long term average, in April and May
2015
Figure 3 - Deviation of actual Cooling Degree Days (CDDs) from the long term average, in June 2015
Source: Eurostat/JRC.
The colder is the weather, the higher is the number of HDDs; the warmer is the weather the higher is the number of CDDs.

7
2 Evolution of commodity and power prices
2.1 Evolution of power prices, and the main factors affecting power generation costs
Coal prices (as represented by CIF ARA contracts, an import price benchmark widely used in North-Western Europe), started to decrease again in the second quarter of 2015 after a temporary rebound in the first quarter of the year, mainly due to the oversupply in the global coal market, as some important coal consumer countries (e.g.: China) are supposed to consume less coal than it had previously been anticipated. The monthly average CIF ARA price was 52 €/Mt, being only slighlty higher than the trough observed in January 2015.
Natural gas prices (measured as import prices on the German border) were close to 20 €/MWh in the second quarter of 2015; and the impact of the fall in crude oil prices mostly appeared in the oil-indexed gas import contracts. However, it must be noted that as German border import gas prices largely depend on hub-priced (non-oil indexed) imports (e.g.: from Norway or the Netherlands), the extent of fall in crude oil prices could not be fully tracked in import gas prices. As a consequence of the increasing importance of market based hub priced contracts, volatility of crude oil prices had less impact on natural gas prices in Germay than it had a few years before.
The share of renewable energy sources reached the highest at EU level in May 2015 (35% of all generated power came from renewables, as Figure 4 shows) since the beginning of avialable time series, primarily owing to increasing wind and solar power generation in the majority of the member states and good hydro availability in many power regions in the EU.
The factors described above impacted electricity generation costs and generally the wholesale electricity price level in most of the EU markets, as the red curve in Figure 4 shows, representing the Platts Pan-European Power Index (PEP) used as an electricity price benchmark in Europe. The PEP index fall to 36 €/MWh .in May 2015, in the consequence of decreasing coal and gas prices and abundant renewable generation. Electricity prices in the EU have followed a decreasing trend for the last few years, primarily owing to limited demand for power and decreasing generating costs.
Figure 4 – Evolution of European average wholesale power prices compared with coal and gas prices and the
share of renewables in power generation
Source: Platts, BAFA, ENSTO-E Platts PEP: Pan European Power Index (in €/MWh) Coal CIF ARA: Principal coal import price benchmark in North Western Europe (in €/Mt) DE border imp. stands for long term contract based import natural gas price on the German border (in €/MWh) RES (renewables) includes hydro, wind, solar and biomass; RES share in the total power generation estimation for the EU-28 as a whole (right hand scale)
In March-May 2015 six commercial partner countries assured 96% of the EU's external hard coal imports (15, 330 Mt on monthly average in this period), namely Russia (28% of the total EU-28 imports in this period), Colombia (24%), the United States (20%), Australia (11%), South Africa (8%) and Indonesia (5%), as Figure 5 shows.
The amount of imported coal in the EU decreased by 4% in March-May 2015 in year-on-year comparison, however, by looking at different import sources significant differences could be observed in the change of import dynamics. Hard coal imports increased in this period by 38% from Indonesia, by 36% from Colombia and by 12% from Australia, whereas both from Russia and the United States it decreased by 18% and from South Africa imports decreased by more than 7%, in comparison to the same three month period of 2014.

8
Figure 5 – The most important Extra-EU coal import sources and monthly imported quantity in the EU-28
Source: Eurostat, COMEXT database
European emission allowance prices were fairly stable in the second quarter of 2015, staying in a narrow range of 7-8 €/tCO2e, as presented on Figure 6. Although EU policy developments on tackling the long prevailing situation on the carbon market (low prices, being unable to send meaningful market signals for low-carbon technology investements) would give a support on the long run to emission allowance prices, the currently low fossil fuel prices and electricity prices do not result in additional demand for allowances.
Figure 6 – Evolution of ETS emission allowance prices
Source: Platts
As Figure 7 and Figure 8 show, in the second quarter of 2015 clean spark spreads, measuring the profitability of gas-
fired power generation, increased in the UK compared to the previous quarter and fluctuated in a range of 10-15 €/MWh during most of the time in Q2 2015. In Germany however, gas fired generation remained unprofitable during Q2 2015, as German clean spark spreads clearly remained in the negative range. The difference in the profitability of gas fired generation in the UK and Germany can be explained by diverging wholesale electricity prices between the two countries: in the UK wholesale electricity prices went up, while in Germany they continued to decrease.
The difference between the wholesale price level in the two countries could also be tracked in the evolution of clean dark spreads, measuring the profitability of coal-fired generation: while in Germany coal fired generation assured only moderate profitability for power utilities, in the UK clean spark spreads were close to 30 €/MWh in the whole Q2 2015. In spite of having higher profitability than natural gas, the share of coal-fired generation decreased in Q2 2015 in the UK power mix, as it is explained in details in Chapter 4.2.

9
Figure 7 - Evolution of clean dark and clean spark spreads in the UK
Source: Platts
Figure 8 - Evolution of clean dark and clean spark spreads in Germany
Source: Platts
In Belgium and the Netherlands, where gas fired generation has significant share in the electricity mix, the profitability of gas firing was better than in Germany in Q2 2015, due to higher local wholesale electricity prices, though on quarterly average the clean spark spread remained in the negative range in both countries (-3.6 €/MWh and - 0.3 €/MWh, respectively). In Belgium in April 2015 the monthly average clean spark spread was positive (4 €/MWh), however, in May it fell below zero and the share of gas decreased in the Belgian power generation mix.
2.2 Comparisons of monthly electricity baseload day-ahead prices on electricity markets
As the next map (Figure 9) shows, there were significant price differences in the wholesale electricity prices across the EU in the second quarter of 2015, ranging from 22 €/MWh measured in Sweden to 58 €/MWh in the UK on quarterly average.
In comparison to the previous quarter the average wholesale electricity price decreased in the overall majority of the European markets; in the biggest extent in France (28%), Sweden (25%) and Romania (20%) In contrast, there were slight price increases in Portugal (6%), the UK (5%) and Spain (4%). In a year-on-year comparison, quarterly average wholesale electricity prices decreased in Q2 2015 by the most in Sweden (32%), Denmark (27%), Finland (25%),

10
Latvia and Lithuania (both 23%). In the UK however, a sharp turn-up in the quarterly wholesale electricity price could be observed (21%). More details on the drivers behind price changes in each market can be found in Chapter 4.
Although several market coupling areas exists in the EU, in some cases there were significant price differentials in the quarterly average price level between the participating markets in the second quarter of 2015. In Central and Eastern Europe (CEE - a coupling area comprising the Czech Republic, Slovakia, Hungary and Romania) electricity prices were well aligned. In contrast, In Central and Western Europe (CWE), Dutch and Belgian wholesale prices were traded on premium to the German-French peers during most of the time, in spite of switching to flow-based market coupling on 21 May 2015, which resulted in better cross border power flow supplies through the whole region (See Chapter 4.1).
Nordic markets were closely aligned to each other, having the cheapest wholesale price offers in the EU (with the exception of the Baltic States having a measurable premium to the other parts of the Nordpool coupled area). The Nordic region system price had a slight discount to Central and Western Europe. However, though being parts of the North-Western Europe (NWE) coupled area, the British Isles and the Iberian region had significant premiums to Central and Western Europe, primarily owing to less than optimal electricity interconnection capacities with other parts of the NWE coupled area.

11
Figure 9 – Comparison of average wholesale baseload electricity prices, first quarter of 2015
Source: European wholesale power exchanges

12
Figure 10 and Figure 11 show the evolution of monthly average baseload wholesale electricity prices in the main power regions in the EU; in parallel with the Platts European Power Index (PEP) since 2005. As Figure 10 shows, during the last few years Nordic markets proved to be the cheapest wholesale electricity price area in the EU (strongly influenced by hydro generation, which also resulted in high price volatility), while on the other hand, UK prices remained high compared to the continental peers. Central Western and Central Eastern Europe were affected by increasing renewable generation, resulting in slightly lower prices in both regions that the PEP index.
Price premium of the Italian market to the PEP benchmark significantly decreased during the last few years, primarily owing to increasing share of renewable generation sources (replacing fossil fuels) in the country's power generation mix. Spanish wholesale prices, similarly to the Nordic region, highly depend on hydro generation, resulting in high price volatility. In Greece the wholesale electricity price depends on the seasonal change in hydro generation and power imports from the neighbouring countries. Similarly to Italy, the importance of renewables is growing in Greece, aiming at reducing the structural dependence on power imports.
Figure 10 - Comparisons of the Platts PEP and monthly electricity baseload prices in regional electricity
markets (CWE, CEE, Nordpool and the UK)
Source: Platts, European power exchanges
Figure 11 - Comparisons of the Platts PEP and monthly electricity baseload prices in regional electricity
markets (Spain, Italy and Greece)
Source: Platts, European power exchanges
As it can be followed on Figure 12, wholesale electricity prices showed signs of convergence during the last few years,
as the price difference between the cheapest and most expensive wholesale electricity market decreased in the EU. However, differences between the price levels still remain and temporary price divergences may occur in the future, in the consequence of sudden shifts in local power demand and supply conditions, owing to changes in electricity mixes in different markets or availability of infrastructure and interconnection capacities.

13
Figure 12 Difference between the highest and the lowest regional wholesale electricity price
Source: European power exchanges, own computations. In April-June 2015 the cheapest market was Sweden in the EU, while the highest wholesale electrcity prices could be observed in the UK. It is important to note that not only the price range, but the location of the cheapest and the most expensive markets within the EU might change over the timespan presented on this chart.
As Figure 13 shows, the divergence between the main European regional benchmarks in second quarter of 2015, also presented on Figure 12, was primarily owing to rapidly decreasing prices in the Nordpool region, in the consequence of cheap domestic generation. CWE and CEE wholesale regional price benchmarks were below the PEP benchmark during the whole Q2 2015, while the UK had an average price premium of 20 €/MWh. The wholesale prices in Spain and Italy had increasing premiums over time in Q2 2015, while Greece had a constant premium (around 10 €/MWh).
Figure 13 Difference between the PEP index and the weekly regional wholesale electricity prices
Source: Platts, European power exchanges, own computations
Figure 14 shows the monthly ratio of actual hydro generation compared to the domestic consumption of a given region (Nordic region, CWE region and the Iberian region). Comparing the hydro generation to the consumption of electricity can give a good contribution to explain the evolution of the regional wholesale price level, especially in those countries or regions where hydro generation has an important role in the wholesale electricity price formation.
In Spain the ratio of hydro generation to electricity consumption decreased in the first half of 2015, and consequently the average wholesale price increased significantly. In the Nordic region high level of hydro reserves and generation resulted in low wholesale prices and good power exporting opportunities from the region (See Figure 16). In the CWE region, though hydro has a lower share, increasing hydro generation in countries with regions belonging to the Alpes also contributed to low regional price level.

14
Figure 14 – The ratio of hydro compared to the power consumption in different EU regions
Source: ENTSO-E
3 Traded volumes and cross border trade of electricity
3.1 Comparison of wholesale market trading platforms and the over-the-counter (OTC) markets
Figure 15 shows the comparison of traded volumes in different market segments in electricity trading on the most liquid electricity trading platforms in the EU. Besides the day-ahead markets, being analysed in details in the next chapter of this report, for the full analysis of the wholesale electricity trade we also look at the whole forward curve and the traded volumes on the so-called over-the-counter (OTC) markets, also providing information on bilateral trade contracts.
Traded volumes of day-ahead contracts cover only a minor part of the whole trade in many wholesale electricity markets in Europe. The volume of forward traded contracts outnumbered the day-ahead contracts in Germany and the Nordic markets (by respectively a magnitude of 5 and 2 in the second quarter of 2015). With the exception of Spain and the Nordic markets the volume of OTC trade was higher than that in the organised trading platforms.
There was a strong correlation between the evolution of traded volumes of electricity in all market segments between the first and the second quarter of 2015. In parallel with the seasonally decreasing electricity trade in Q2 2015 on the day-ahead markets, forward contract volumes and OTC contract volumes also decreased significantly compared to the first quarter of 2015.
The relation between the magnitudes of traded volumes on the organised markets (day-ahead and forward contracts) and on OTC markets can also influence the significance of different wholesale electricity prices observed in different forms of trade. If the volume of bilateral power trade is significantly higher in a given country than what we can see on the organised market, OTC prices, often based on confidential bilateral agreements, may differ from observable market prices, and thus other forms of price estimations (e.g.: OTC price assessments) might prove to be better proxies for wholesale electricity prices in the given country or market.

15
Figure 15 - Comparison of electricity traded volumes in some important day-ahead, forward and OTC
markets, first quarter of 2015
Source: Platts, wholesale power markets, Trayport and London Energy Brokers Association (LEBA)
3.2 Cross border trade of electricity
As Figure 16 shows, the Central Western Europe (CWE) power region could be characterised by increasing net power outflow position in the second quarter of 2015, mainly due to competitive wholesale electricity prices in the region which enabled power exports to the neighbouring regions, principally to the British Isles, Italy and Central and Eastern Europe.
Electricity exports from the Nordic region also picked up, as due to abundant hydro power generation local markets could be characterised by the cheapest wholesale electricity prices in the EU in Q2 2015.
Increasing import dependency in the Central Eastern Europe (CEE) region was the result of cheaper import alternatives compared to domestic generation, as in some countries (e.g.: Poland) domestic prices were significantly higher than in neighbouring countries.
As the UK wholesale electricity price premium to the continent continued to be significant (and widening) in Q2 2015, the British Isles were still in a strong net power importer position. Meanwhile in Italy the seasonally strong renewable generation managed to mitigate power import needs.
Figure 16 - EU cross border monthly physical flows by region
Source: ENTSO-E European countries are grouped in the following regions: Central Western Europe DE, NL, FR, LU, BE, AT, CH Nordic SE, FI, DK, NO Central Eastern Europe PL, CZ, HU, SK, HR, SI British Isles UK, IE Iberian-Peninsula ES, PT Apennine Peninsula IT South Eastern Europe RO, BG, GR, RS, BA, ME, FYROM, AL Baltic EE, LT, LV

16
4 Regional wholesale electricity markets
4.1 Central Western Europe (Austria, Belgium, France, Germany, the Netherlands, Switzerland)
As Figure 17 shows, the monthly average baseload day-ahead power price in the CWE region fell from 34 €/MWh in April 2015 to 27 €/MWh in May 2015, being the lowest monthly average in the last ten years. Although the average slightly rebounded in June 2015 (and rose to 30 €/MWh), it remained at very low levels compared to earlier periods.
The German day-ahead baseload wholesale electricicty price fell to twelve-year low in May 2015 (25 €/MWh), which was mainly due to the seasonally receding demand for power and abundant renewable power generation (accounting to more than 30% of the German power mix in this month for the first time ever). Besides increasing solar and wind power generation, high level of hydro reserves in the Alpes assured cheap generation sources in Germany, Austria and Switzerland. In this latter country the share of hydro in the power generation mix reached 71% in June 2015, being the highest in the last three years.
In France wholesale electricity prices decreased rapidly in April, as the winter period was over and heating related demand receded, as Figure 18 shows. As nuclear availability remained strong during the whole quarter in spite of the onset of the maintenance season and hydro generation remained high, the French wholesale electricity price remained close to the German benchmark in May and June 2015. Nuclear availability in the region was also influenced by the decommissioning of the Grafenrheinfeld nuclear power plant in Germany on 28 June 2015, as part of the country's energy transition process (Energiewende).
Belgium had to intensively rely on electricity imports, as due to the ongoing outages of its two nuclear reactors (Doel-3 and Tihange-2) domestic electricity generation decreased in the second quarter of 2015 compared to the same period of the previous year. The country imported around 27% of its electricity consumption in Q2 2015 from the neighbouring France and the Netherlands. In the Netherlands, where local power generation largely depends on natural gas, power consumption had been increasingly satisfied from import sources, mainly from Germany.
On 21 May 2015 the CWE region switched to flow-based market coupling, which resulted in increasing cross border flows between Germany/Austria, France and the Benelux states. As Figure 19 shows, power flows increased especially from Germany to the Netherlands and from the Netherlands and from France to Belgium after the new regional coupling concept had been implemented. As of mid-May the French power price recoupled with its German peer, and the Belgian-Dutch contracts had a significant premium to German-French price contracts.
Figure 17 - Monthly traded volumes and prices in Central Western Europe
Source: Platts, EPEX

17
Figure 18 - Weekly average wholesale power prices in the CWE region
Source: Platts.
Figure 19 – Weekly cross border physical power flows in the Central West European region
4.2 British Isles (UK, Ireland)
In the second quarter of 2015 the average monthly day-ahead wholesale price in the UK was the highest in the whole EU, ranging between 57-61 €/MWh. As Figure 20 shows, baseload power prices in the UK showed a one-off hike at the beginning of April 2015, mainly due to increase in the climate change levy1 in the energy sector. This measure also resulted in a price premium to the Irish market, which was completely the opposite compared to the previous quarters, when the wholesale price in Ireland was normally lower than in the UK. In Ireland the monthly average wholesale electricity price fluctuated in a narrow range of 48-54 €/MWh in Q2 2015, making the country the second highest priced market the EU.
Although in the second quarter of 2015 coal fired power generation had higher the profitability in the UK than gas-fired generation (as clean dark spreads were higher than clean spark spreads, see Figure 7), the share of coal in the UK power generation mix fell to 17% in June 2015 from 25% in March, while the share of natural gas changed adversely.
1 See more details in Quarterly Report on European Electricity Markets, Vol. 8 Issue 1.

18
This shift in the power mix shows, contrarily of what could be expected from the dark-spark spreads relation, the impact of the increase in the climate change levy, as clean spreads only include the emission allowance price and not the impact of the climate levy, to be paid on the top of the carbon price. As coal fired generation proportionally produces more emission than natural gas (per unit of generated power), the increase in the climate levy exerted significant influence on the gas-coal competition in the UK power generation mix, penalising the more emission-bound coal fired generation.
After the increase in the wholesale price at the beginning of April 2015, also supported by receding wind generation, the UK day-ahead contracts followed a decreasing path throughout the whole Q2 2015, as natural gas prices decreased in parallel with the seasonal drop for heating related demand and as wind power generation began to rebound.
In the consequence of permanently high and increasing UK electricity price premium to the continent, electricity flows from France were increasing in the first half of 2015, as Figure 21 shows. In the second quarter of the year the combined French and Dutch power export to the UK amounted to 2 TWh on monthly average, up from 1.7 TWh in the previous quarter.
As the share of renewable power generation (mainly wind) slightly receded in Q2 2015 compared to the previous quarter in the Irish generation mix, costlier fossil fuel sources took over the renewables' place, resulting in stable, slightly decreasing wholesale electricity prices, as natural gas and import coal sources became cheaper during the quarter.
Figure 20 - Daily average power prices in the UK and Ireland, impacted by gas prices
Source: Platts, SEMO
Figure 21 –Weekly average UK price premium to France and the flow of electricity from France to the UK

19
4.3 Northern Europe (Denmark, Estonia, Finland, Latvia, Lithuania, Norway, Sweden)
The monthly average wholesale system price in the Nordpoolspot market showed a significant fall in the first half of 2015, as Figure 22 shows, and the monthly average wholesale electricity price in June 2015 (14.4 €/MWh) was the lowest since July 2012. This steep price fall can mainly be explained by the increasing importance of hydro power generation in the regional electricity mix, leading to decreasing generation costs.
Besides Norway, where power is predominantly generated from hydro, other Nordic markets also experienced increasing shares of this generation source in Q2 2015. In Sweden the share of hydro amounted to 56% in the local generation mix in June 2015, which was the highest since October 2011. In parallel with this, the share of nuclear in the country's power generation fell to 28%, which was the lowest in the last five years.
In Finland the share of hydro in the power mix also rose to three-year high (34%). As the contribution of nuclear to Finnish generation also remained high, and renewables sources, mainly biomass, still accounted for about one sixth of the country's generation mix, the share of fossil fuel based generation fell below 10%, which could not be observed in the last five years. In the consequence of decreasing generation costs wholesale electricity prices fell to eight year low in June 2015 (21.5 €/MWh). Decreasing local generation costs also reduced power imports need in Finland.
In the three Baltic States, though the local wholesale price level was still higher than in other markets of the Nordic region, a measurable price decrease could be observed in comparison to previous quarters. Estonia could benefit from increasing power inflows from Finland, while the other two countries, Latvia and Lithuania, still had to rely on power imports from Russia and Belarus; due to the insufficient level of electricity interconnections with other Nordpool areas.
Although wholesale electricity prices fell to several year lows in many markets of Central Western and Central Eastern Europe, the cheapest prices in the whole EU could still be found in the Nordic countries in Q2 2015, providing for electricity export opportunities, which in June 2015 resulted in the highest monthly net power exporter position of the region since mid-2012.
Figure 22 - Monthly traded volumes and prices in Northern Europe
Source: Nordpool spot market
4.4 Apennine Peninsula (Italy)
Between April and June 2015 the Italian monthly average day-ahead baseload electricity price remained stable, in a narrow range of 47-48 €/MWh, being lower than in the average in first quarter of 2015, when it was above 50 €/MWh.
Behind this high degree of price stability slight changes in the power generation mix (the share of hydro rose from 14% to 22% and the share of fossil fuels decreased from 60% to 52% between March and June 2015) and decreasing power inflows from cheaper markets, such as Austria, France and Switzerland, could be observed. At the beginning of the summer period warmer than usual weather conditions resulted in increasing residential power demand for cooling needs.

20
The share of renewables (solar, wind, and biomass) assured 26% of the power generation mix in Italy in the second quarter of 2015, which is the highest share since the beginning of the available time series (January 2010). Increasing share of non-conventional generation sources can reduce the country's structural dependence on electricity imports. This was also reflected on the seasonal change of the net electricity import position of the country (See Figure 16), as during the summer period when solar power generation is high, Italy needs to import less electricity.
Although the wholesale system price was low in Q2 2015 compared to earlier periods, the Italian market still had a premium of 10-20 €/MWh in comparison to its aforementioned neighbours belonging to the Central Western Europe power area, despite the existing price coupling system between Italy and the CWE region.
Figure 23 - Monthly traded volumes and prices in Italy
Source: GME (IPEX)
4.5 Iberian Peninsula (Spain and Portugal)
Monthly average wholesale electricity prices in the Spanish and the Portuguese markets underwent significant increases during the second quarter of 2015. The monthly average baseload increased from 44 €/MWh in Spain and from 43 €/MWh in Portugal, to 55 €/MWh in both countries between March 2015 and June 2015. There were several reasons behind this increase on both the supply and the demand side of the electricity market.
In both countries the share of hydro power generation and the renewables (wind and solar together) decreased significantly in the second quarter of 2015, and at the same time the share of costlier fossil fuels (natural gas and coal) increased, replacing hydro and renewables, which resulted in rising generation costs and consequently higher wholesale electricity prices.
In Spain the country's nuclear power generation fleet operated on reduced availability (as Almaraz-2 nuclear reactor, having 1 GW thermal capacity, was permanently offline for maintenance works and was set to return only after the end of Q2 2015), and consequently, the share of nuclear in the generation mix fell to 16-17% in May-June 2015, being the lowest since June 2014.
On the demand side in June 2015 the weather turned warmer than seasonal average temperatures would imply, as it can be followed on the evolution of cooling degree days (See Figure 3) During the summer months cooling related demand for electricity significantly increases in Spain and Portugal, and the anticipation of a heat wave at beginning of July 2015 put an upward pressure on the day-ahead and forward electricity wholesale price contracts.
Contrarily to Central Western Europe, where wholesale electricity prices became lower in Q2 2015 due to the abundant power supply, prices in the Iberian markets went up, resulting in a widening price gap between Spain and France, reaching 16 €/MWh on quarterly average, and an even greater premium of 23 €/MWh in June 2015 alone, as Figure 25 shows.. Although the electricity interconnection between France and Spain has been reinforced in February 2015 and electricity flows between the two markets strongly correlate with the difference in wholesale prices, it seems that the existing capacities still do not suffice to enable cheaper import power sources to offer competitive alternative to domestic generation in Spain, pointing to the need of further developments in interconnection infrastructure.

21
Figure 24 - Monthly traded volumes and prices in the Iberian Peninsula
Source: Platts, OMEL
Figure 25 - Weekly average price difference between Spain and France and net electricity flow between the
two markets
Source: Platts, OMEL, ENTSO-E
4.6 Central Eastern Europe (Czech Republic, Hungary, Poland, Romania, Slovakia, Slovenia)
As Figure 26 shows, wholesale electricity prices in the CEE region were quite flat in April and May 2015. The baseload regional average contract was just above 30 €/MWh, reaching the lowest since May-June 2013, while the regional peakload contract fell to six-year lows.
This was mainly due to healthy power supply across the region, especially to good hydro availabilities in the Balkans, and increasing share of renewable generation the region and in Central Western Europe, assuring cheap power import opportunities. In June 2015 however, as the weather turned warmer in most of the region and hydro levels were set to decrease, power prices started to rebound.
The combined regional day-ahead traded volume of power continued its dynamic increase in the second quarter of 2015, reaching 6.8 TWh on monthly average which was 7.6% higher than in the second quarter of 2014.

22
Figure 26 - Monthly traded volumes and prices in Central Eastern Europe
Source: Regional power exchanges, Central and Eastern Europe (CEE)
As Figure 27 shows, in the second quarter of 2015 the wholesale electricity price was the highest in Poland in the CEE region, mainly due to the higher than expected amount of generating capacities taken offline, practically meaning unplanned outages on the top of planned maintenance activities. Wind generation has also been weaker than expected, resulting in a decreasing share of wind in the Polish electricity generation mix throughout the quarter.
Wholesale electricity prices in Hungary also had measurable premium to the German benchmark during Q2 2015, however, in May 2015 the monthly average baseload Hungarian contract fell below 30 €/MWh, for the first time since 2010, when the wholesale electricity trading platform in the country became operational.
Increasing share of renewables (mainly solar and biomass) in the Czech Republic and Slovakia helped in keeping local generation costs and wholesale electricity prices at low levels, closely tracking the price evolution in Germany. In Romania wholesale electricity prices were primary influenced by good seasonal hydro availability and increasing share of renewables in the power generation mix, assuring low wholesale electricity prices in the country and good export opportunities to the neighbouring markets.
Figure 27 - Regional weekly baseload price premiums or discounts to the German market
Source: Platts (EPEX), CEE Regional power exchanges

23
4.7 South Eastern Europe (Greece)
After following a decreasing trend in the first quarter of 2015, between April and June 2015 Greek day-ahead baseload and peakload monthly average wholesale power prices became fairly stable, staying in a narrow range of 47-50 €/MWh during the whole Q2 2015.
Although electricity consumption in Greece grew by more than 3% in Q2 2015 compared to the same period of the previous year, domestic power generation decreased by 8% during the same period, implying that Greece had to increasingly rely on electricity imports (900 GWh on monthly average), satisfying more than 24% of its quarterly electricity consumption from import sources. The country imported electricity mostly from Bulgaria, the Former Yugoslav Republic of Macedonia and Turkey.
The amount of generated power from hydro source decreased in the second quarter of 2015, as the drier season started after wet wintry period. On the other hand, renewable generation (solar and wind together) assured 27% of the domestic power mix in April 2015, being the highest share since the beginning of available time series. In May and June 2015 the share of renewables in the generation mix remained close to this historic high.
On the other hand, natural gas, once assuring 20-30% of domestic power generation in Greece, has gradually been squeezed out from the power mix, and its share fell to 7% in June 2015, being unprecedentedly low in the last five years. It seems that gas fired powered generation is losing ground against increasing renewables and competitive power imports, while lignite fired generation managed to keep its share (around 50% in Q2 2015) in the Greek power generation mix.
Figure 28 - Monthly traded volumes and prices in Greece
Source: DESMIE
5 International outlook – comparing EU power prices with international peers
As the next chart (Figure 29) shows, wholesale electricity prices in the US were generally below the European power benchmark, the PEP index. However, as in recent years wholesale electricity prices in Europe became lower, the difference between EU and US price benchmarks significantly decreased. Electricity prices in the US are predominantly influenced by the evolution of natural gas prices, and in high-gas priced periods (e.g.: under harsh winter conditions) US electricity prices might turn up sharply, as it happened several times during the last five years.
In Japan, after years of high wholesale electricity prices in the consequence of mothballing of the domestic nuclear power generation fleet and ramping up gas-fired generation, relying on expensive LNG imports, the wholesale electricity price fell below 100 €/MWh in the first half of 2015, as LNG import prices decreased in the Asia-Pacific region. This price level is of similar magnitude of that could be observed before the Fukushima nuclear incident. Recent news on restarting some nuclear reactors also exerted a downward pressure on Japanese wholesale electricity prices.
In Australia the average wholesale electricity price level was the lowest among the four regions presented on Figure 29. The country's power generation is largely based on cheap domestic coal. However, in 2012-2013 there was a

24
sharp turn-up in wholesale power prices as a special climate change tax was imposed, which in 2014 was abolished and the wholesale price returned to the pre-climate change-tax level.
Figure 29 - Comparison of the average US, Japanese, Australian and the European wholesale electricity
prices
Source: Platts, PEP: Pan-European Power index US electricity hubs including PJM West: Pennsylvania-Jersey-Massachusetts hub (Western part); ERCOT: Texas hub, JPEX, (Japan) and AEMO: Australian wholesale power market

25
6 Retail electricity prices in the EU
Figure 30 shows the convergence across the EU countries between retail electricity prices for household and industrial customers in three different consumption bands, using as metric the relative standard deviation of retail electricity prices in the twenty-eight EU member states. Relative standard deviation enables to compare the dispersion of values of different magnitudes, as by dividing the standard deviation by the average the impact of absolute values is eliminated, making possible the comparison of different time series on a single chart.
In the case of household customers retail prices for medium level of annual electricity consumption (between 2,500 kWh and 5,000 kWh - Band Dc) are presented, while for industrial customers both prices for medium level consumption (between 500 MWh and 2 000 MWh - Band Ic) and for large consumption (between 70 000 MWh and 150 000 MWh - Band IF) are shown. These annual consumption bands correspond to the retail price reporting system of Eurostat.
Retail prices paid by households include all taxes, while retail prices paid by industrial customers are prices without VAT and recoverable taxes and levies. Monthly retail electricity prices are estimated by using the Harmonised Consumer Price Indices (HICP) for the household prices and the Producer Price Indices (PPI) for the industrial customers, based on the time series of twice-yearly retail energy price data from Eurostat.
As Figure 30 shows, over the past few years retail electricity prices for large industrial customers showed a measurable degree of convergence, while in the case of industrial customers with medium level annual consumption this convergence was less visible. Larger customers might have stronger bargaining power at electricity purchase contracts, and in the case of large industrial customers non-market elements, such as network costs or taxes have lower share in the final price, and thus the impact of convergence of electricity prices at wholesale level could be better observed in retail prices than in the case of customers having lower annual electricity consumption.
In the case of household customers having medium level annual electricity consumption, retail prices in different member states did not show too many signs of convergence, mainly because of the higher share of the aforementioned non-market elements in the final price, if compared with industrial customers. Furthermore, less intensive competition for household customers and the existence of regulated retail prices might have also put an obstacle to better price convergence across the EU.
In the case of industrial customers having medium level annual electricity consumption the monthly ratio of the highest and the lowest price in the EU was 3.0 (Sweden: 6.2 Eurocent/kWh, Malta: 18.6 Eurocent/kWh), in the case of large industrial customers it was 3.1 (Sweden: 4.3 Eurocent/kWh, Malta: 13.6 Eurocent/kWh) and in the case of households it was 3.3 (Bulgaria: 9.4 Eurocent/kWh, Denmark: 30.6 Eurocent/kWh) in June 2015.
Figure 31 shows the retail electricity price element of the so-called Household Energy Price Index (HEPI), calculated with a methodology developed by Vaasaett on the basis of monthly collection of electricity invoices in the capital cities of the EU. In June 2015 the highest retail electricity price paid by households could be observed in Copenhagen (30.6 Eurocent/kWh), while the cheapest capital in the EU was Tallinn (10.6 Eurocent/kWh). Compared with June 2014, the biggest price increase could be observed in Athens (18.7%), while retail electricity prices decreased the most in Vienna (6.2%) and Budapest (6.1%).
Figure 32 shows the change in household retail electricity prices between June 2014 and 2015, expressed in Eurocent/kWh, and the contribution of cost components (energy costs, transmission and distribution costs, energy taxes and VAT) to the price change in most of European capital cities. In absolute terms, prices increased by the most in Madrid, primarily owing to the increase in the distribution cost component. In Vienna, where the biggest price decrease could be observed, the energy cost component fell significantly. In Rome and Copenhagen, where the final price only decreased slightly, energy taxes rose significantly while distribution costs decreased. In Athens the bulk of the increase in retail prices could be linked to increase in energy taxes, while in Prague distribution costs went up significantly.
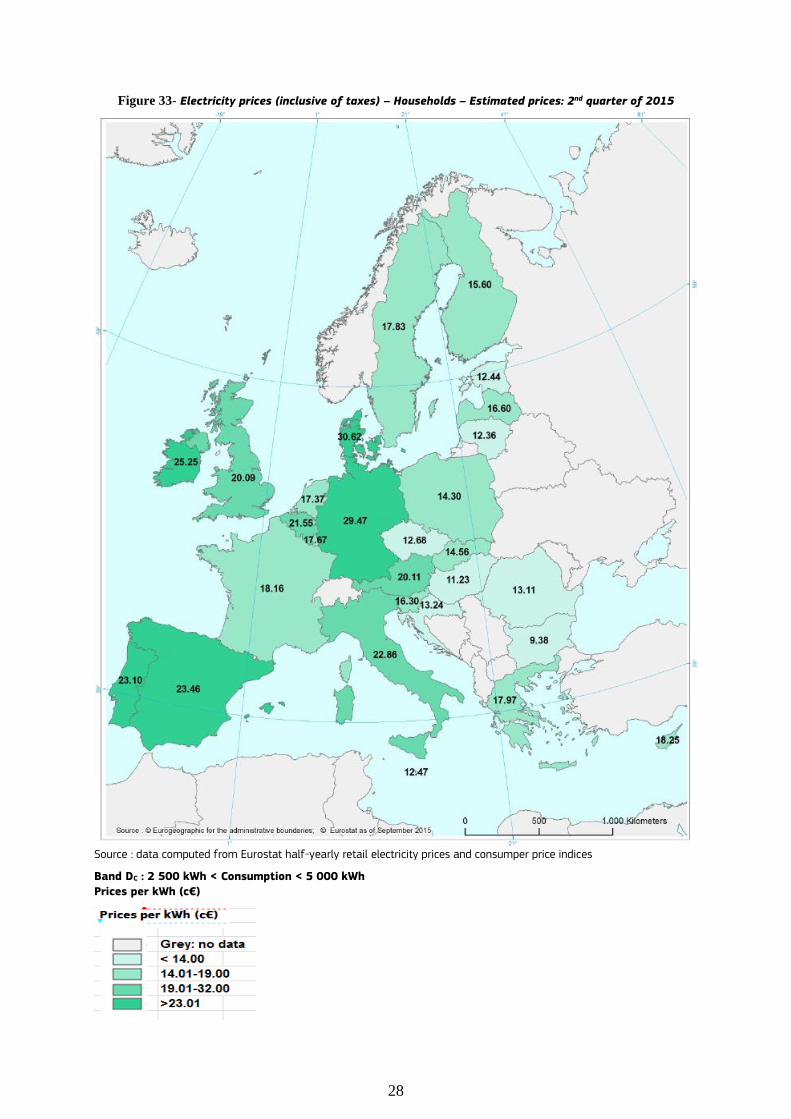
The two maps (Figure 33 and Figure 34 ) show the estimated quarterly average retail electricity prices paid by households and industrial customers, having medium level of annual electricity consumption, in the second quarter of 2015.

26
Figure 30 – Relative standard deviation of retail electricity prices in EU Member States in different
consumption groups
Source: Eurostat
Figure 31 – The Household Energy Price Index (HEPI) in European capital cities - Electricity prices in June
2015, and changes in household electricity prices compared to June 2014
Source: Vaasaett. No price data for March 2014 available for Tallin, Riga, Vilnius, Valetta, Sofia and Nicosia

27
Figure 32 – Change in electricity prices and their cost components in European capital cities, between June
2014 and June 2015, in Eurocent/kWh
Source: Vaasaett No data were alvailable for Nicosia, Riga, Sofia ,Tallinn, Vilnius and Valetta in June 2014
28
Figure 33- Electricity prices (inclusive of taxes) – Households – Estimated prices: 2nd quarter of 2015
Source : data computed from Eurostat half-yearly retail electricity prices and consumper price indices
Band DC : 2 500 kWh < Consumption < 5 000 kWh
Prices per kWh (c€)

29
Figure 34 – Electricity prices (without VAT and non-recoverable taxes) – Industrial consumers – Estimated
prices: 2nd quarter of 2015
Source : data computed from Eurostat half-yearly retail electricity prices and consumper price indices
Band IC : 500 MWh < Consumption < 2 000 MWh
Prices per kWh (c€)

30
7 Glossary
Backwardation occurs when the closer-to-maturity contract is priced higher than the contract which matures at a later
stage. Clean dark spreads are defined as the average difference between the price of coal and carbon emission, and the
equivalent price of electricity. If the level of dark spreads is above 0, coal power plant operators are competitive in the observed period. See dark spreads. Clean spark spreads are defined as the average difference between the cost of gas and emissions, and the equivalent
price of electricity. If the level of spark spreads is above 0, gas power plant operators are competitive in the observed period. See spark spreads. Contango: A situation of contango arises in the when the closer to maturity contract has a lower price than the contract
which is longer to maturity on the forward curve. Cooling degree days (CDDs) are defined in a similar manner as Heating Degree Days (HDDs); the higher the outdoor
temperature is, the higher is the number of CDDs. On those days, when the daily average outdoor temperature is higher than 21oC, CDD values are in the range of positive numbers, otherwise CDD equals zero. Dark spreads are reported as indicative prices giving the average difference between the cost of coal delivered ex-ship
and the power price. As such, they do not include operation, maintenance or transport costs. Spreads are defined for a coal-fired plant with 35 % efficiency. Dark spreads are given in this publication for UK and Germany, with the coal and power reference price as reported by Platts. Flow against price differentials (FAPDs): By combining hourly price and flow data, FAPDs are designed to give a
measure of the consistency of economic decisions of market participants in the context of close to real time operation of electrical systems. With the closure of the day-ahead markets (D-1), the prices for each hourly slot of day D are known by market participants. Based on the information from the power exchanges of two neighbouring areas, market participants can establish hourly price differentials. Later in D-1, market participants also nominate commercial schedules for day D. An event named 'flow against price differentials' (FAPD) occurs when commercial nominations for cross border capacities are such that power is set to flow from a higher price area to a lower price area. The FAPD chart in this quarterly report provides detailed information on adverse flows, presenting the ratio of the number of hours with adverse flows to the number of total trading hours in a quarter. Heating degree days (HDDs) express the severity of a meteorological condition for a given area and in a specific time
period. HDDs are defined relative to the outdoor temperature and to what is considered as comfortable room temperature. The colder is the weather, the higher is the number of HDDs. These quantitative indices are designed to reflect the demand for energy needed to heat a building. Spark spreads are reported as indicative prices giving the average difference between the cost of natural gas delivered
ex-ship and the power price. As such, they do not include operation, maintenance or transport costs. Spreads are defined for a gas-fired plant with 50 % efficiency. Spark spreads are given for UK and Germany in this publication, with the gas and power reference price as reported by Platts.
Tariff deficit expresses the difference between the price (called a tariff) that a regulated utility, such as an electricity
producer is allowed to charge and its generation cost per unit.