disclaimer - sinclair broadcast...
TRANSCRIPT


Disclaimer
1
Forward-Looking Statements:Certain statements and information in this communication may be deemed to be “forward-looking statements” within the meaning of the Federal Private Securities Litigation Reform Act of 1995.Forward-looking statements may include, but are not limited to, statements relating to Sinclair’s objectives, plans and strategies, and all statements (other than statements of historical facts) thataddress activities, events or developments that Sinclair intends, expects, projects, believes or anticipates will or may occur in the future. These statements are often characterized by terminology suchas “believe,” “hope,” “may,” “anticipate,” “should,” “intend,” “plan,” “will,” “expect,” “estimate,” “project,” “positioned,” “strategy” and similar expressions, and are based on assumptions andassessments made by Sinclair’s management in light of their experience and their perception of historical trends, current conditions, expected future developments, and other factors they believe tobe appropriate. Any forward-looking statements in this communication are made as of the date hereof, and Sinclair undertakes no duty to update or revise any such statements, whether as a result ofnew information, future events or otherwise. Forward-looking statements are not guarantees of future performance. Whether actual results will conform to expectations and predictions is subject toknown and unknown risks and uncertainties, including: risks and uncertainties discussed in the reports that Sinclair have filed with the Securities and Exchange Commission (the “SEC”); generaleconomic, market, or business conditions; risks associated with the ability to consummate the Fox Regional Sports Networks acquisition (the “RSN Acquisition”) and the timing of the closing of theRSN Acquisition; the risk that a regulatory approval that may be required for the proposed transaction is delayed, is not obtained or is obtained subject to conditions that are not anticipated; theability to successfully integrate RSN’s operations and employees; the ability to realize anticipated benefits of the RSN Acquisition; the potential impact of announcement of the RSN Acquisition onrelationships, including with employees, customers and competitors; and other circumstances beyond Sinclair’s control. Refer to the section entitled “Risk Factors” in Sinclair’s annual and quarterlyreports filed with the SEC for a discussion of important factors that could cause actual results, developments and business decisions to differ materially from forward-looking statements.

Note: Consolidated Sinclair. RSN unaudited financial statements.(1) Represents blended CY’17/’18 revenue and EBITDA for Sinclair and CY’18 revenue and EBITDA for the RSNs.
Local Sports and News Leader
2
Transformative Transaction
Pro forma CY 2018 revenue of $6.7B and EBITDA of $2.6B(1)
Leading platform of premium local sports and news content
Diversification of content sources and revenue
Acquiring Leader in RSNs
Diversified portfolio consisting of exclusive local media rights to 42 teams, 21 brands and 14 RSNs (excludes YES Network)
Strong EBITDA margins and free cash flow
Enhances Sinclair’s existing sports businesses (Marquee, Tennis Channel, Stadium and High School)
Complementary Offerings of Sports and News
Expanded focus on sports, generating ~60% of total CY 2018 pro forma revenue (and ~15% of pro forma revenue from news)
Local teams have loyal and consistent fan viewership
Legalized sports betting likely to deepen fan engagement and attract new advertisers
Complementary businesses and skillsets

(1) Includes Marquee and RSN portfolio.
Significant Value Creation
3
Implied transaction multiple of 6.5x (5.5x after benefit of tax attributes)
– CY 2019 projected EBITDA of $1.6B
– Closest pure-play comp trades at ~7.75x (MSGN)
– Excludes cost synergies
– Reflects $1.5B NPV of tax step-up ($2.4B gross value over 15 years)
~100% accretive to previous FCF guidance on a consolidated basis
– $12.00 per share for ’18/’19 on a pro forma basis
– $13.00 per share for ’19/’20 on a pro forma basis
Consolidated net leverage 4.7x (before preferred equity)
– RSN Sports Assets(1): net leverage of 4.8x (before preferred equity)
Long-term synergies from programming and production in excess of $100M
Very low required capex and high tax shield facilitates rapid deleveraging of consolidated company

Transaction Summary
$10.6B total enterprise value, all-cash transaction $9.6B purchase price adjusted for minority interests Creates fully siloed entity to acquire Fox RSNs; facilitates potential future RSN equity partnerships
Transaction Summary
4
(1) STGI and RSN debt commitments by JP Morgan Chase Bank, N.A., Deutsche Bank AG, Royal Bank of Canada and Bank of America, N.A. Merrill Lynch, Pierce, Fenner & Smith.
(2) Consolidated leverage based on CY’18 RSN EBITDA plus blended CY’17/CY’18 Sinclair covenant EBITDA. RSN entity-level leverage based on CY‘18 financials.
(3) Commitment provided by JPMorgan Funding.
SBGI Financial Considerations
$1.4B cash contributed to Diamond Sports Group, as buyer, in form of:• $0.7B cash• $0.7B of committed STGI incremental debt(1)
JV interest in Marquee Sports Network contributed Consolidated net leverage of 4.7x and 5.1x (including preferred equity)(2)
Approvals & Timing
DOJ approval Anticipated closing in Q3 2019
RSN Silo
Fox RSNs and Marquee Sports Network assets $8.2B of new debt(1)
$0.8B of balance sheet cash $1.0B of privately placed preferred equity of Diamond Sports Holdings, an indirect parent of Diamond
Sports Group,(3) a newly-formed and wholly-owned subsidiary of Sinclair $1.5B NPV of tax benefit ($2.4B gross value) Net leverage of 4.8x and 5.4x (including preferred equity)(2)
11-year weighted average remaining life of sports media rights contracts

Largest Collection of RSNs
Sinclair Assets
Source: SNL Kagan estimates. (1) Joint venture.(2) Excludes YES Network. (3) Excludes the Chicago Cubs, who will be covered by Marquee beginning in the 2020 MLB season.
14(2)Networks 4 1 21 1 17 11 1
74(2)
2018 Subscribers (Millions)
14 7 78 4 524 3N/A 7
(2)
Other Market Participants
5
14
4 4
16
7 2
1
12
4
2
4 1
42
15
85
2 2 2 2 2 1
(1) (3)
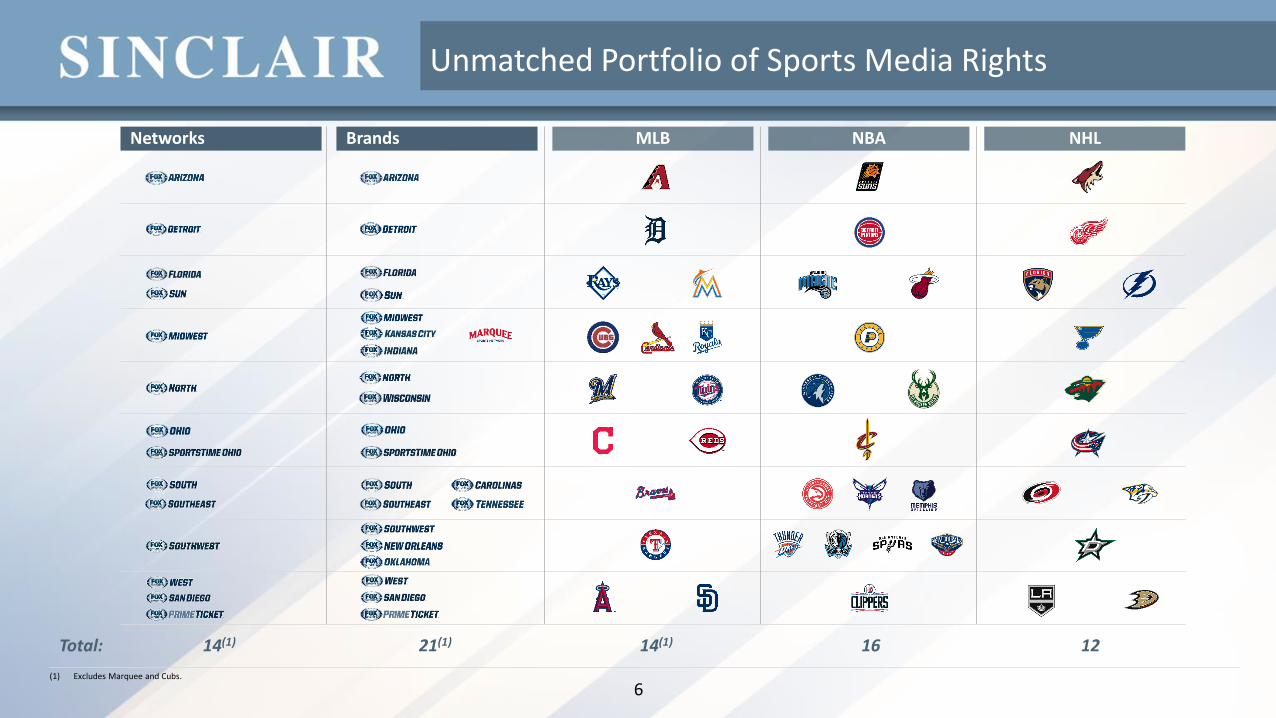
6(1) Excludes Marquee and Cubs.
Unmatched Portfolio of Sports Media Rights
Brands MLB NBA NHL
Total: 14(1) 16 12
Networks
14(1) 21(1)
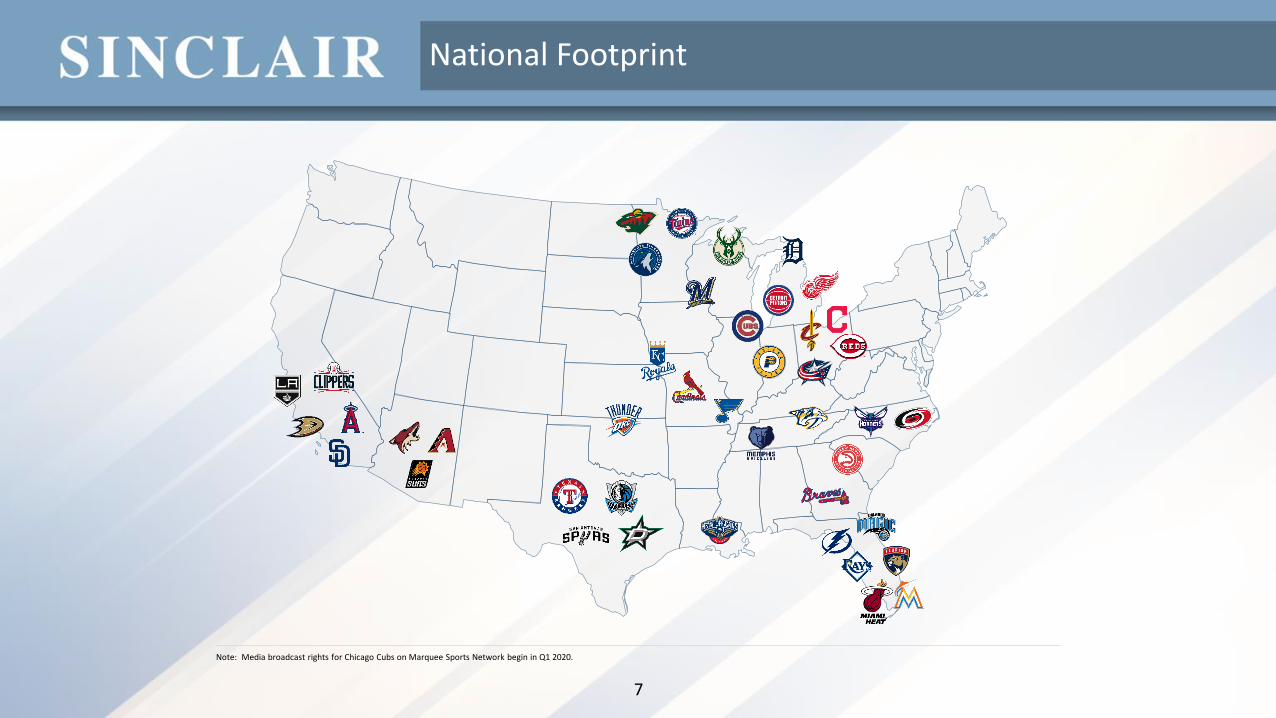
National Footprint
7
Note: Media broadcast rights for Chicago Cubs on Marquee Sports Network begin in Q1 2020.

Future Growth Opportunities
Exploiting Digital Rights
Sports Betting
Advertising
Drive streaming viewership onto new platforms and experiences
Penetrate vMVPDs to capture broadest consumer base• 4.5M+ vMVPD subs in FY 2018 with opportunities for expected growth
New technology-enabled viewing experiences will enhance product
Creation of digital branded apps (as Fox has done with “FOX Sports GO”)
“Sports bettors watch about twice as much sports coverage as non-bettors do. So it stands to reason that making it easier for people to become sports bettors will make them more likely to watch sports.” – The New York Times
“A 2016 survey by the American Gaming Association found that 84% of adults would be more likely to watch a game they weren’t previously when they bet on it.” – Forbes
“Media companies are already tossing around programming ideas and ways to incorporate more stats and betting options on their digital platforms.” – The Wall Street Journal
Sports betting apps already important to advertisers in states where legal
Potential upside to RSNs from content creation focused on sports betting / monetization of video rights
Advertising has been under monetized historically by RSNs
Live events with engaged, local viewers
Net political ad revenue for the RSN Portfolio ranged from only ~$1.5 – $3.5M in the last three fiscal years
8

RSNs are the Destination to Watch Local Games
Linear / TV Everywhere vMVPDs Other future delivery methods
Current Emerging Future
All DevicesStreaming via vMVPD
ServicesTV Everywhere
“Portable” Rights Nationwide
Dynamic Ad Insertion in Internet Streams
Note: While various exceptions and limitations are in place for each league, the chart above characterizes the majority of rights per league.
withLive TV
AR / VR
Social Media Other
9

1.5
%
1.0
%
0.5
%
0.3
%
0.2
%
(0.1
%)
0.0
%
0.1
%
0.1
%
0.1
%
0.1
%
0.0
%
(0.2
%)
(0.2
%)
(0.2
%)
(0.2
%)
(0.1
%)
(0.2
%)
(0.3
%)
(0.2
%)
(0.5
%)
(0.8
%)
(1.0
%)
(1.2
%)
(1.3
%)
(1.5
%)
(1.6
%)
(2.0
%)
(2.7
%)
(2.9
%)
(3.2
%)
(3.4
%)
(3.4
%)
(3.3
%)
(3.6
%)
(4.1
%)
(0.2
%)
(0.4
%)
(0.5
%)
(0.6
%)
(0.5
%)
(0.6
%)
(0.7
%)
(0.7
%)
(0.6
%)
(1.1
%)
(1.0
%)
(0.8
%)
(0.7
%)
(0.3
%)
0.2
%
(0.4
%)
(1.0
%)
(10.0%)
(8.0%)
(6.0%)
(4.0%)
(2.0%)
0.0%
2.0%
Q4 2010 Q4 2011 Q4 2012 Q4 2013 Q4 2014 Q4 2015 Q4 2016 Q4 2017 Q4 2018
The Pay-TV Bundle is Stable but Evolving
vMVPD included
vMVPD excluded
Year-over-Year Subscriber Growth
Source: Wall Street research.
10

2013 2014 2015 2016 2017 2018
Sports and News Live Viewership Growing Share
11
Source: Wall Street research, Nielsen NNTV. Data based on Program Level National Total Day Results; News includes all programs in the News, News Documentary and Political Genre; Sporting Events includes Sporting events only; All Other Content is the remaining content that is not included in the News and Sports Categories. Standard Calendar 1/1-12/31 each year; Viewing Hours = Average Audience (000) x Hours Broadcast.
Share of Live Viewing Hours, Adults 24-54
Sports & News: +26%
All Other Content: (6%)
0%

2,624 295
309 3,228
Local Sports Content Drives Consistent, High-Volume Viewership
Source: Nielsen and company materials.(1) Minutes consumed is defined as follows: (a) the average number of households viewing per minute aired multiplied by (b) the number of minutes aired of all games and TV show episodes during the respective season, in each case in the Detroit DMA. Number of minutes aired reflects longer (e.g., extra innings) or shorter games and the actual minutes of each TV show (including commercials).
12
Detroit Team Games – Total Minutes Consumed(1) Detroit Primetime Entertainment – Total Minutes Consumed(1)
Critical mass of highly popular, evergreen content
402
305 262
1,159 2,129
Remaining 7 of the top 10
primetime entertainment
shows
Total top 10 primetime
entertainment shows
151 81 70Games 22 28 24Episodes 141
#3 Show#2 ShowTop ShowTotal local game consumption
Minutes in millions Minutes in millions

Legalized Sports Betting Opportunity
Source: Wall Street Research and company materials.(1) Reflects 2017 MLB season and 2017-18 NBA and NHL seasons. Minutes consumed is defined as follows: (a) the avg. number of households viewing per min. aired multiplied by (b) the number of min. aired of all games during the respective season. Number of min. aired reflects longer (e.g., extra innings) or shorter games (including advertisements), not scheduled broadcast windows; Excludes YES and Cubs.
13
U.S. sports betting market poised for rapid expansion… ($B)
$0.5
$5.0
2018 2025
…presents substantial upside for media companies ($B)
$1.0
$0.3 $1.3
Advertising Sponsorships Proj. Media Spend
European participation is a roadmap for the US… …and the region is experimenting with tech convergence
RSN portfolio offers vast inventory of live sports(1)
25% 30%
60% 60% 65%
80%
90%
Projected sports betting media spend (2025E)
% of Total Revenue: 20% 5%
~40%
~45%
~35%
18 – 34 25 – 34 35 – 44
25%
Survey of bettors that placed an online-only sports bet (last 12 months) In-play betting participation by age group (2017) a proxy for engagement
Projected US sports betting revenue
~5,300 live events / year
24,000+ hours of new content / year
~675Mhours of content consumed
16 NBA teams
12 NHL teams
14 MLB teams
~4,600 professional games / year

Pro Forma Financial Profile
Note: RSN financials based on unaudited financial statements.(1) Represents blended CY’17/CY’18 metrics for Sinclair and CY’18 metrics for the RSNs. (2) Includes add-back for management fees paid to parent.(3) Based on commitment debt rates.
14
$1.15 –$1.22B
$1.20 –$1.30B
$1.15 – $1.22B $1.20 – $1.30B
$2.2B $2.4B
'18 / '19 '19 / '20 '18 / '19 '19 / '20
$2.8B
$3.8B
$2.8B
$6.7B
SBGI Standalone Pro Forma
Calendar Year EBITDA and Margin Profile(1) ($ in billions)
Calendar Year Total Revenue(1) ($ in billions)
FCF Per Share Guidance Update(3) ($ in billions, except per share)
$0.9B
$1.7B
$0.9B
$2.6B
SBGI Standalone Pro Forma
31% % Margin 39%
Distribution43%
Advertising51%
Other 6%
Distribution70%
Advertising27%
Other 3%
195%+
RSNs
Legacy Sinclair
RSNs
Legacy Sinclair
Calendar Year Total Revenue Mix(1)
SBGI Standalone Pro Forma
135%+
SBGI Standalone Pro Forma
Avg. FCF / share: $6.18 – $6.56 $6.45 – $6.99 $12.00 $13.00
RSNs
Legacy Sinclair
(2)

Leverage
Ratio
RSN Sports Assets
Gross Leverage 5.3x
Gross Leverage (including preferred equity) 5.9x
Net Leverage 4.8x
Net Leverage (including preferred equity) 5.4x
Consolidated
Net Leverage 4.7x
Net Leverage (including preferred equity) 5.1x
Financing Structure & Pro Forma Leverage
Note: RSN based on unaudited financial statements.(1) Simplified structure for presentation purposes.(2) Based on CY’18 leverageabe EBITDA of $1.6B which excludes EBITDA from non-wholly owned RSNs and, instead, includes cash distributions from non-wholly owned RSNs. (3) Based on CY’18 RSN attributable EBITDA of $1.6B plus blended CY’17/CY’18 Sinclair covenant EBITDA totaling $2.5B.
Illustrative Structure(1)
STGINew debt
$0.7B
Marquee
Intermediate Diamond Entities
Fox RSNs
Preferred Equity$1.0B
Term Loan: $3.3B
Secured Debt: 2.6B
Unsecured: 2.3B
$1.4B
+ Marquee
$1.4B
+ Marquee
15
Pro Forma Capitalization
(2)
(3)
Total New Debt: $8.2B
Diamond Sports Holdings
Byron Allen /
Other Investors

Key Highlights
Leading platform for local sports and news
Diversification of content sources and revenue
Extensive multi-platform expansion opportunities
Prime beneficiaries of emerging legalized sports betting mega trend
Substantial EBITDA and FCF accretion
16

Q&A
17