disclaimer: forward looking statements - kerrygroup.com · kerry –leading to better over the past...
TRANSCRIPT
Disclaimer: Forward Looking Statements
This presentation/announcement may contain forward looking statements with projections regarding, among other things, the
Group’s strategy, revenues, earnings, trading profit, trading margin, finance costs, tax rate, capital expenditure, dividends, cash
flow, net debt or other financial measures, the impact of foreign exchange fluctuations, the impact of raw material fluctuations
and other competitive pressures. These and other forward looking statements reflect management expectations based on
currently available data.
However, actual results will be influenced by, among other things, macro-economic conditions, food industry supply and
demand issues, foreign exchange fluctuations, raw material and commodity fluctuations, the successful acquisition and
integration of new businesses, the successful execution of business transformation programmes and other, as of today,
unknown factors. Therefore actual results may differ materially from these projections.
These forward looking statements speak only as of the date they were made and the Group undertakes no obligation to
publicly update any forward looking statement, whether as a result of new information, future events or otherwise.
2© Kerry 2018

Kerry Group at a GlanceUnique Positioning to Deliver on Today and Tomorrow’s Consumer Needs
4Financial Results as of FY2017 | Enterprise Value as of 16 February 2018
79% TASTE & NUTRITION
21% CONSUMER FOODS
24,000EMPLOYEES
130PRODUCTION
LOCATIONS
€17bnENTERPRISE
VALUE
#1PLAYERTASTE &
NUTRITION
€6.4bnREVENUE
CATEGORY LEADER
CONSUMER FOODS
€781mTRADING PROFIT
INNOVATION PARTNER
LEVERAGING CONSUMER
TRENDS88% TASTE & NUTRITION
12% CONSUMER FOODS
© Kerry 2018
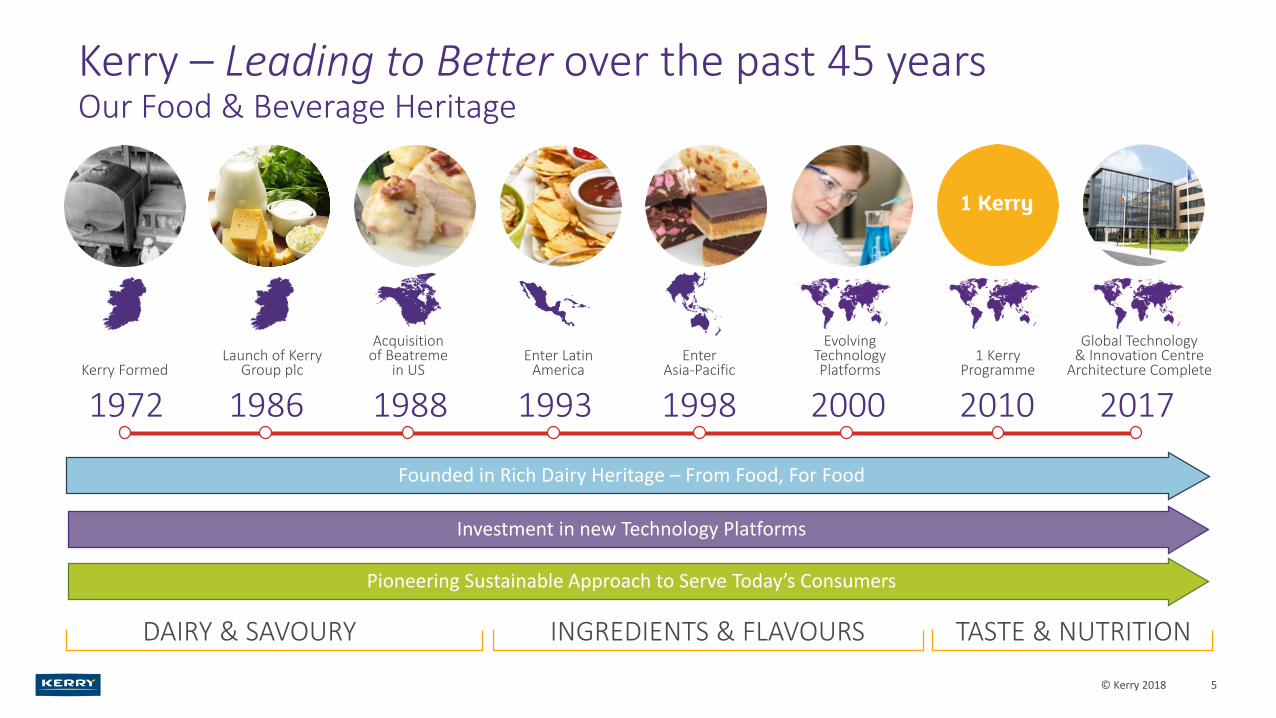
Kerry – Leading to Better over the past 45 yearsOur Food & Beverage Heritage
5
1972 1986 1988 1993 1998 2000 2010 2017Kerry Formed
Launch of Kerry Group plc
Acquisition of Beatreme
in USEnter Latin
AmericaEnter
Asia-Pacific
Evolving Technology Platforms
1 Kerry Programme
Global Technology & Innovation Centre
Architecture Complete
Founded in Rich Dairy Heritage – From Food, For Food
Investment in new Technology Platforms
Pioneering Sustainable Approach to Serve Today’s Consumers
DAIRY & SAVOURY INGREDIENTS & FLAVOURS TASTE & NUTRITION
© Kerry 2018
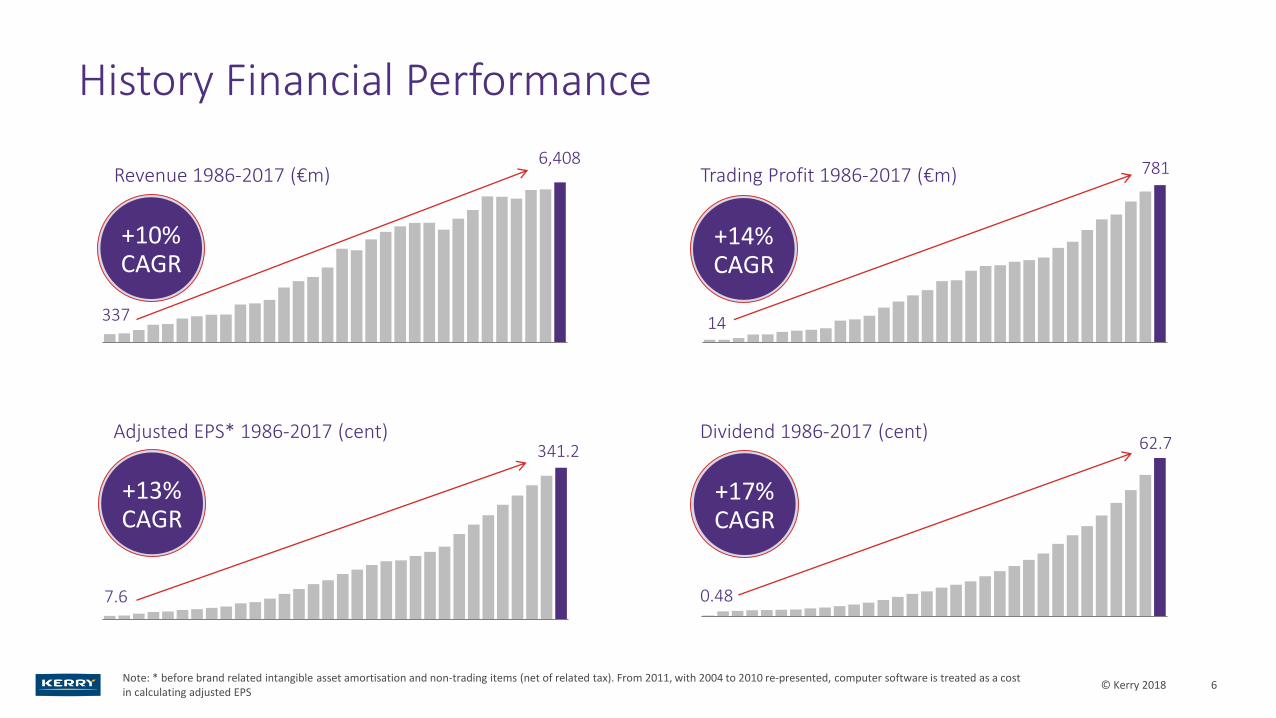
History Financial Performance
6
Revenue 1986-2017 (€m) Trading Profit 1986-2017 (€m)
Adjusted EPS* 1986-2017 (cent) Dividend 1986-2017 (cent)
+17%CAGR
+14%CAGR
+13%CAGR
+10%CAGR
337
6,408
0.48
62.7
7.6
341.2
14
781
Note: * before brand related intangible asset amortisation and non-trading items (net of related tax). From 2011, with 2004 to 2010 re-presented, computer software is treated as a cost in calculating adjusted EPS
© Kerry 2018
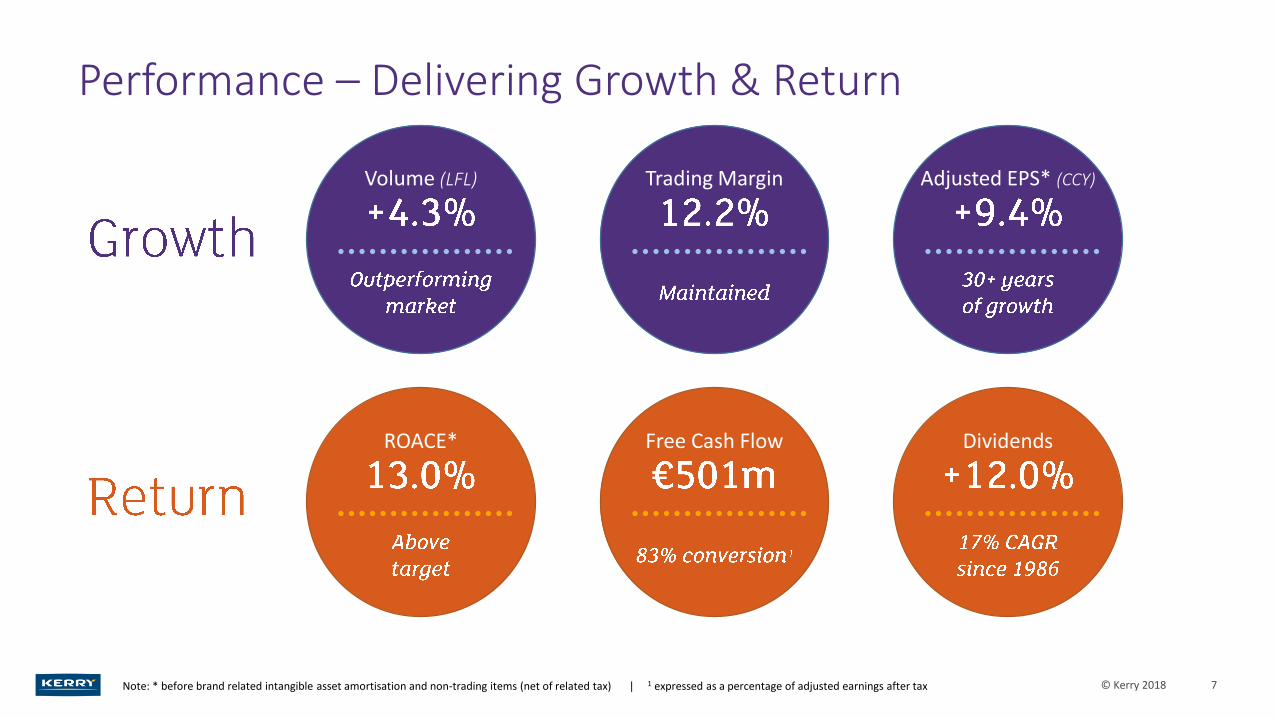
Performance – Delivering Growth & Return
7Note: * before brand related intangible asset amortisation and non-trading items (net of related tax) | 1 expressed as a percentage of adjusted earnings after tax
Adjusted EPS (CCY)
+9.4%Volume (LFL)
+4.3%Trading Margin
12.2%
Volume (LFL) Trading Margin Adjusted EPS* (CCY)
ROACE* Free Cash Flow Dividends
© Kerry 2018
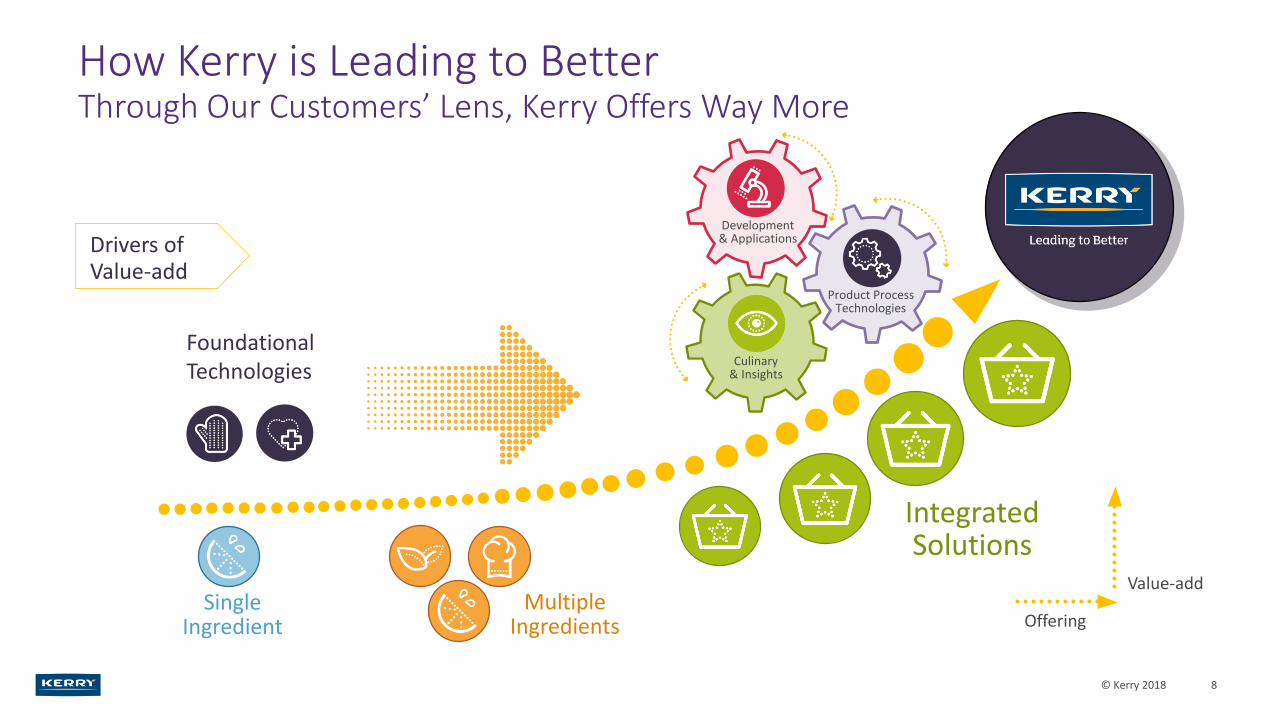
How Kerry is Leading to BetterThrough Our Customers’ Lens, Kerry Offers Way More
8
Integrated Solutions
Multiple Ingredients
Single Ingredient Offering
Value-add
Foundational Technologies
Drivers of Value-add
Culinary & Insights
Development & Applications
Product Process Technologies
© Kerry 2018

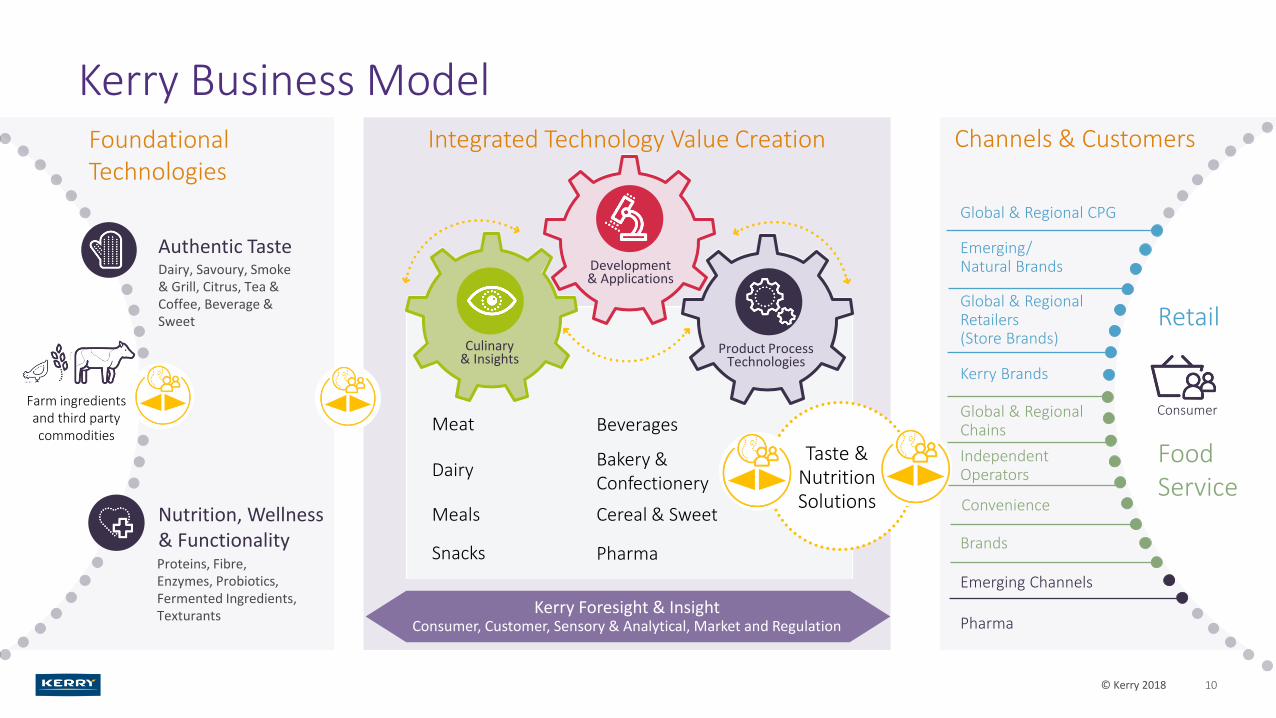
Kerry Business Model
9
Development & Applications
Culinary & Insights
Product Process Technologies
Taste & Nutrition Solutions
Authentic Taste
Nutrition, Wellness & Functionality
Retail & Foodservice
Kerry Foresight & InsightConsumer, Customer, Sensory & Analytical, Market and Regulation
Foundational Technologies
Integrated Technology Value Creation Channels & Customers
© Kerry 2018
Kerry Business Model
10
Global & Regional Chains
Channels & Customers
Global & Regional CPG
Emerging/Natural Brands
Global & Regional Retailers (Store Brands)
Kerry Brands
Independent Operators
Brands
Emerging Channels
Pharma
Convenience
Retail
FoodService
Consumer
Authentic TasteDairy, Savoury, Smoke & Grill, Citrus, Tea & Coffee, Beverage & Sweet
Farm ingredients and third party commodities
Foundational Technologies
Nutrition, Wellness & FunctionalityProteins, Fibre, Enzymes, Probiotics, Fermented Ingredients, Texturants
Meat
Dairy
Meals
Snacks
Beverages
Bakery & Confectionery
Cereal & Sweet
Pharma
Product Process Technologies
Development & Applications
Kerry Foresight & InsightConsumer, Customer, Sensory & Analytical, Market and Regulation
Taste & Nutrition Solutions
Culinary & Insights
Integrated Technology Value Creation
© Kerry 2018
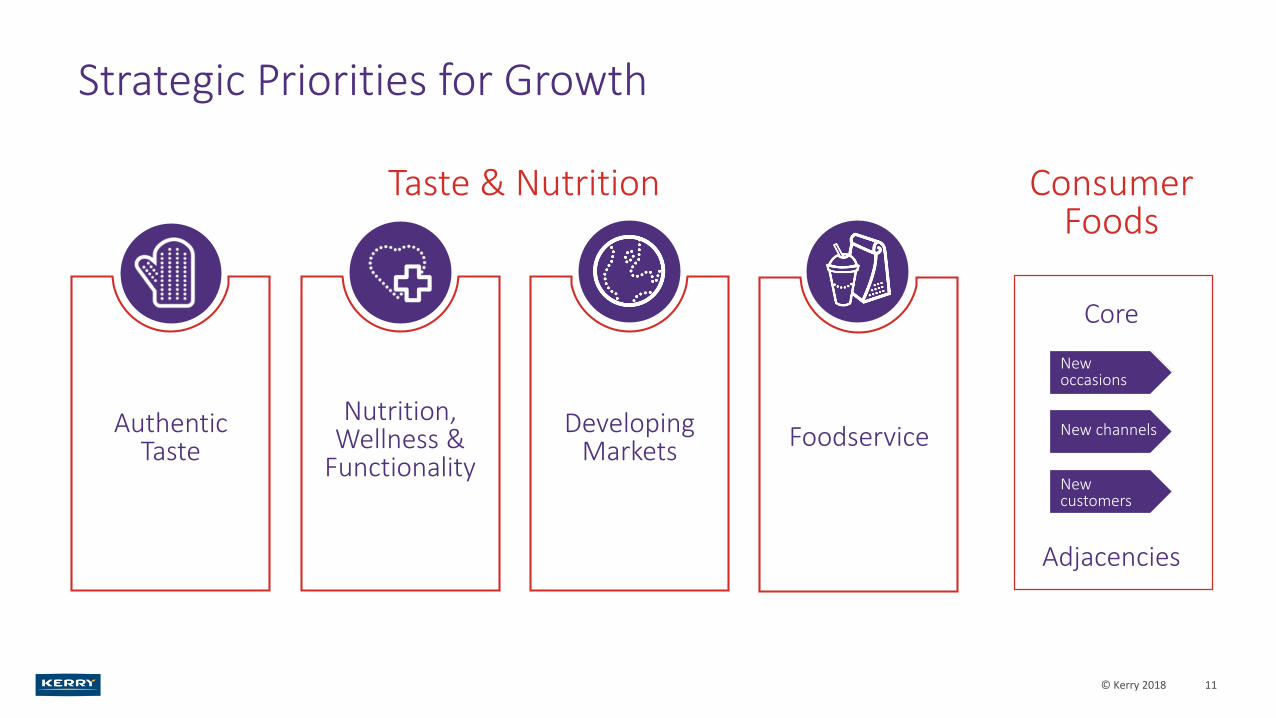
Strategic Priorities for Growth
11
Authentic Taste
Nutrition, Wellness &
Functionality
Developing Markets Foodservice
Taste & Nutrition Consumer Foods
Core
Adjacencies
New occasions
New channels
New customers
© Kerry 2018

Group Long Term Targets (2018–2022)On average across the 5 years
12
GrowthVolume Growth Margin Expansion
Taste & Nutrition 4% to 6% p.a. Taste & Nutrition 40 bps p.a.
Consumer Foods 2% to 3% p.a. Consumer Foods 20 bps p.a.
Group 3% to 5% p.a.** Group 30 bps p.a.
**Assumes 2% above market growth rate
Adjusted EPS* +10% p.a.
ReturnROACE 12%+ Cash conversion >80%
Relative TSR – outperforming peers
*Assumes constant currency I TSR = Total Shareholder Return I Cash conversion is expressed as a percentage of adjusted earnings after tax
Adjusted EPS and ROACE are calculated before brand related intangible asset amortisation and non-trading items (net of related tax)© Kerry 2018

Disciplined M&A
13
Developing Markets
Expand Routes to
Market
Nutrition, Wellness &
Functionality
Authentic Taste
Authentic Taste
Nutrition, Wellness & Functionality
Kerry Foresight & Insight
Consumer, Customer, Sensory & Analytical, Market and Regulation
Development & Applications
Culinary & Insights
Product Process Technologies
Foundational Technologies
Channel & Customers
Integrated Technology Value Creation
Retail &Foodservice
Consumer
Growth
Return
Margin
Right Strategy Right Impact
Taste & Nutrition Solutions
© Kerry 2018

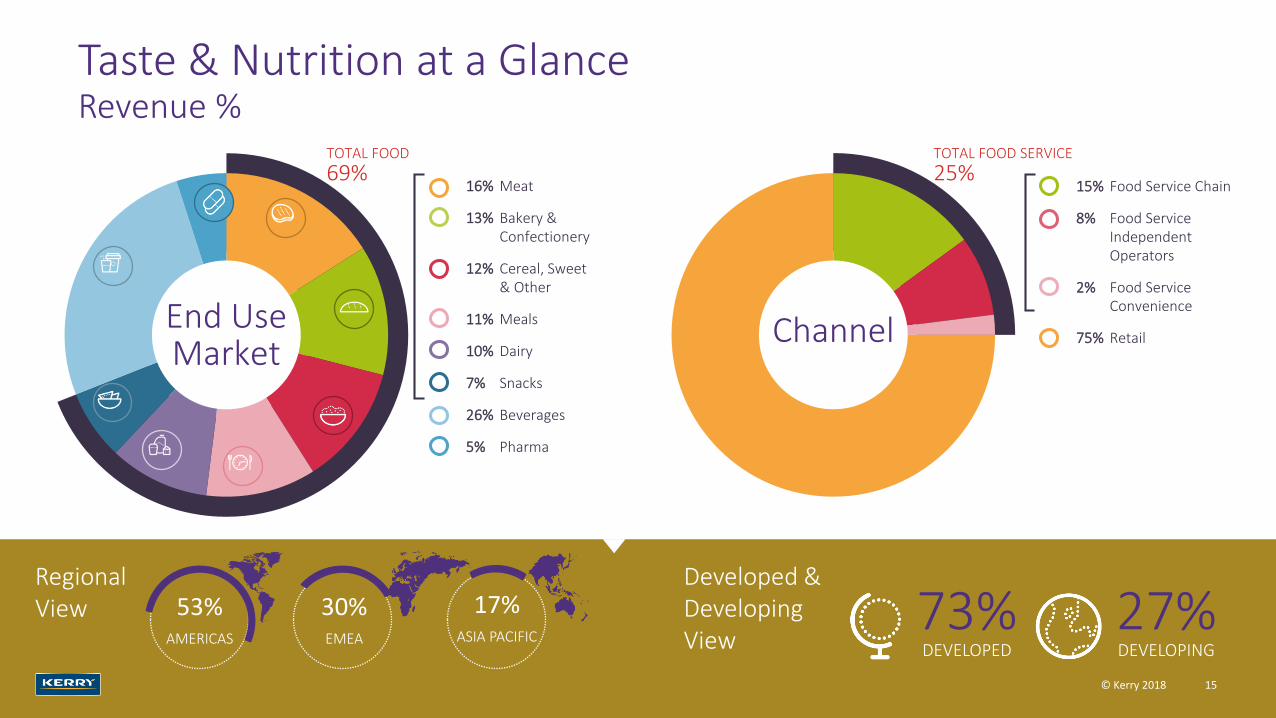
17%ASIA PACIFIC
30%EMEA
Taste & Nutrition at a GlanceRevenue %
53%AMERICAS
73%DEVELOPED
27%DEVELOPING
16% Meat
13% Bakery & Confectionery
12% Cereal, Sweet & Other
11% Meals
10% Dairy
7% Snacks
26% Beverages
5% Pharma
TOTAL FOOD
69%
End Use Market
TOTAL FOOD SERVICE
25%
Channel
15% Food Service Chain
8% Food Service Independent Operators
2% Food Service Convenience
75% Retail
Regional View
Developed & Developing View
15© Kerry 2018
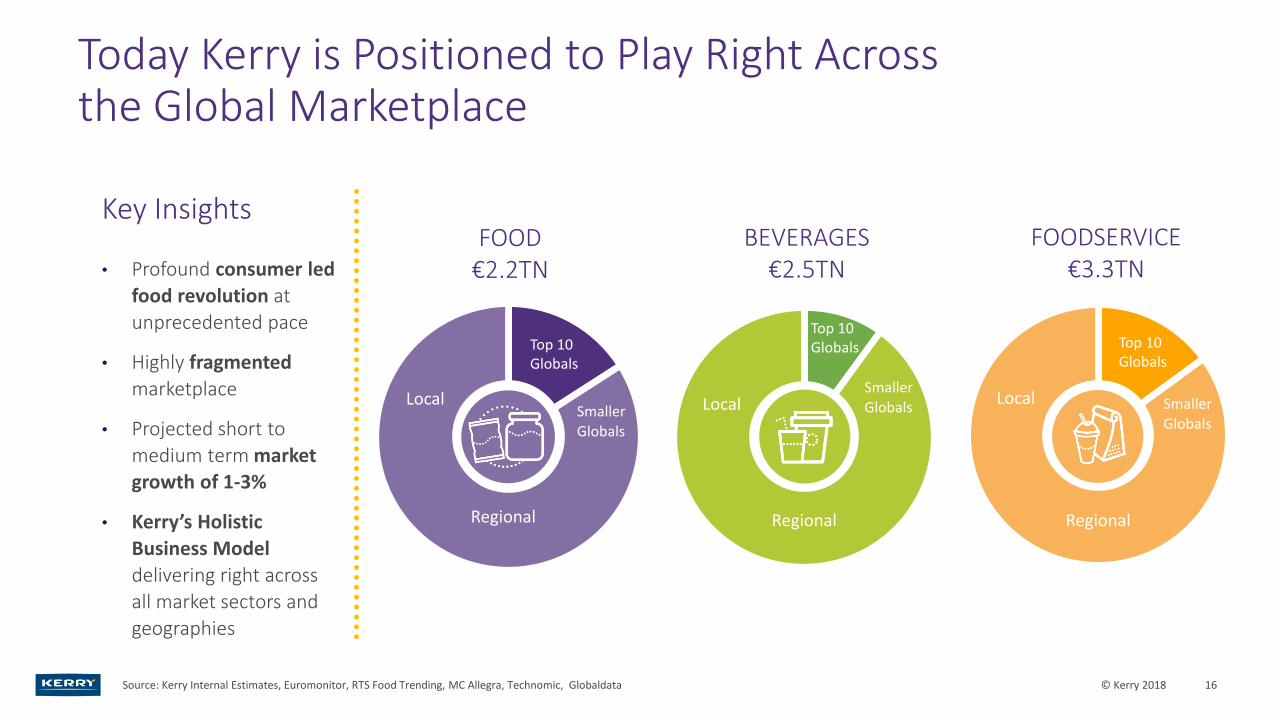
Today Kerry is Positioned to Play Right Across the Global Marketplace
16Source: Kerry Internal Estimates, Euromonitor, RTS Food Trending, MC Allegra, Technomic, Globaldata
Key Insights
• Profound consumer led
food revolution at unprecedented pace
• Highly fragmented
marketplace
• Projected short to
medium term market growth of 1-3%
• Kerry’s Holistic
Business Model
delivering right across all market sectors and
geographies
FOOD€2.2TN
BEVERAGES€2.5TN
FOODSERVICE€3.3TN
Top 10 Globals
Smaller Globals
Regional
Local
Top 10 Globals
Smaller Globals
Regional
Local
Top 10 Globals
Smaller Globals
Regional
Local
© Kerry 2018

Diversified Product Portfolio
17
Product Groups Product Sub-groups Market Position Competitors• Savoury & Dairy Flavour Solutions• Dairy Ingredients• Culinary Sauces• Culinary Ingredients• Snack Seasonings• Meat Coating Systems• Functional Meat Systems
• Enzymes• Fermented Ingredients• Protein Fractions• Prebiotics, Probiotics, & Metabolites• Nutritional Beverages• Nutrition Solutions• Emulsifiers & Texturants
• Sweet Flavours• Confections & Coated Sweets• Sweet Particulates• Chocolate & Compounds• Cereal Shapes & Agglomerates • Baked & Dough Sweet Products• Wet Sweet Systems
• Beverage Flavour Solutions• Sauces & Syrups• Tea & Coffee Concentrates• Beverage Ingredients & Extracts• Creamers & Whips
• Pharma Excipients• Cell Nutrition Proteins• Media Ingredients
Savoury & Dairy
• # 1 in America• # 1 in Europe• # 1 in Rest of World
• # 1 in specialty proteins globally• # 2 in emulsifiers globally
• # 1 in America• # 1 in Europe
• # 1 globally
• We are in 5 of the top ten blockbuster drugs
Cereal & Sweet
Beverage
Functional Ingredients & Nutrition
Pharma
© Kerry 2018
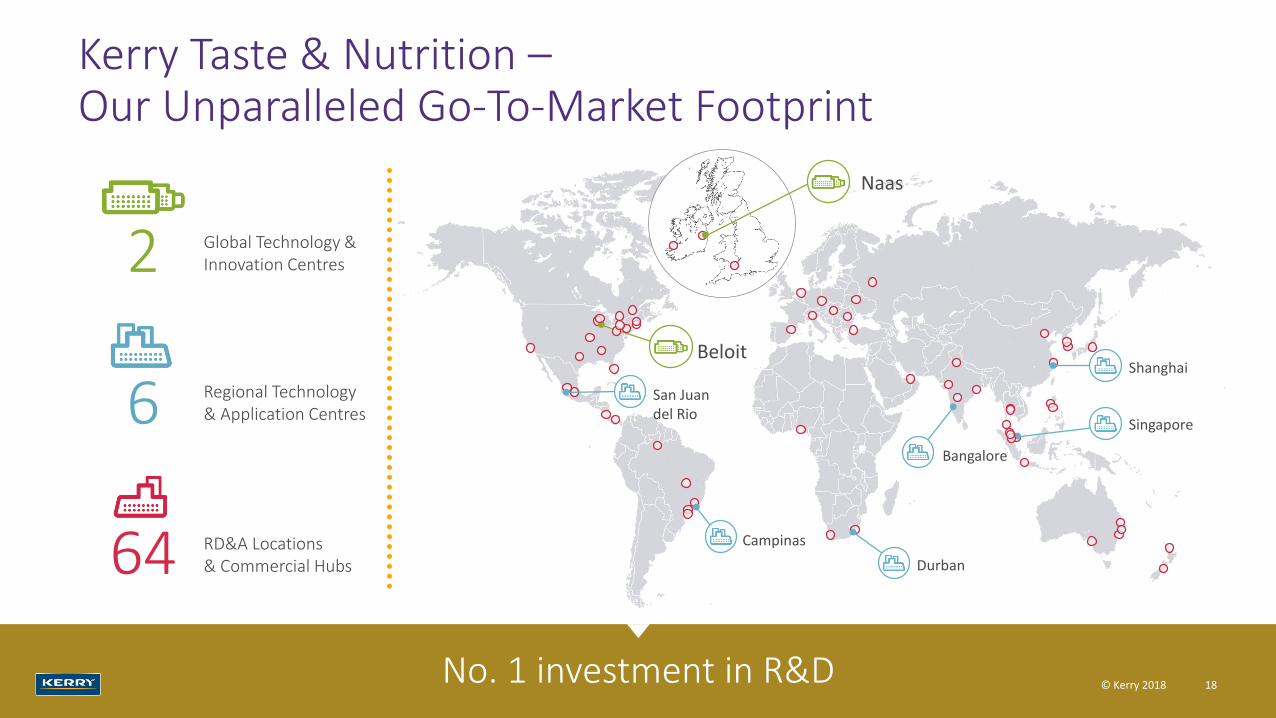
Kerry Taste & Nutrition –Our Unparalleled Go-To-Market Footprint
RD&A Locations & Commercial Hubs64
Regional Technology & Application Centres6
Global Technology & Innovation Centres2
18No. 1 investment in R&D
Naas
Beloit
Campinas
San Juan del Rio
Durban
Shanghai
Singapore
Bangalore
© Kerry 2018
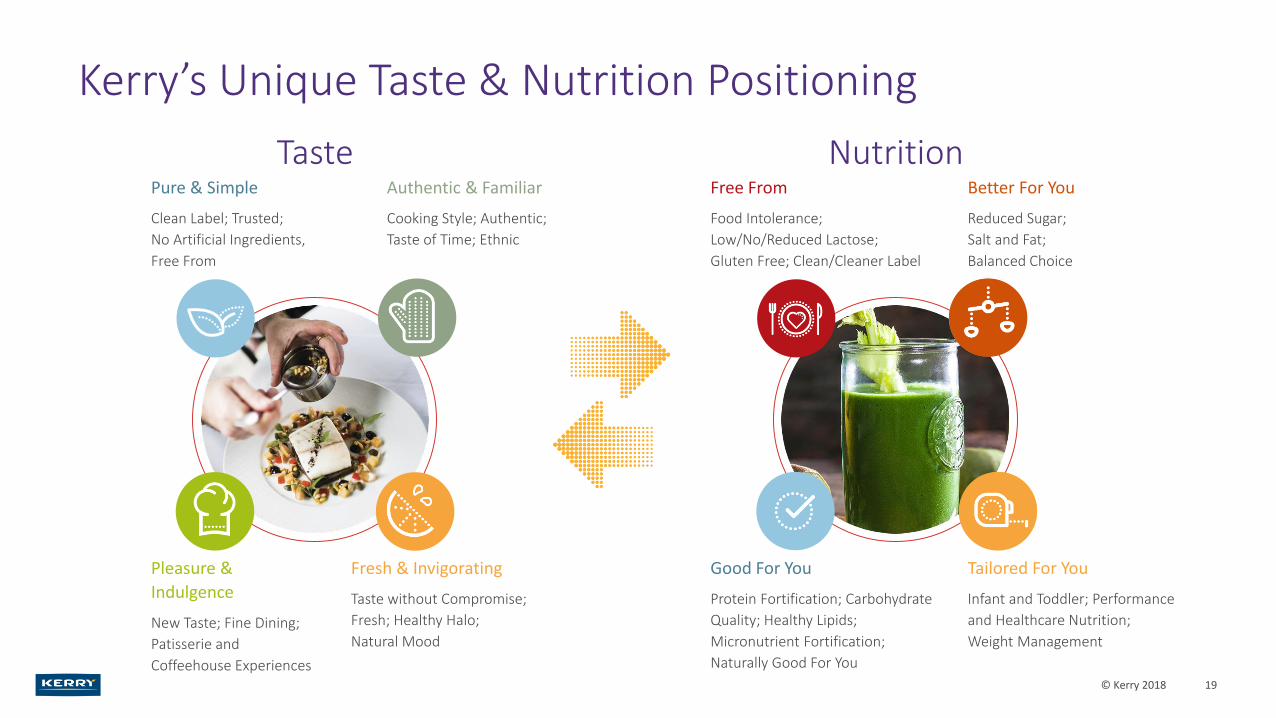
Kerry’s Unique Taste & Nutrition Positioning
19
Pure & Simple
Clean Label; Trusted;
No Artificial Ingredients,
Free From
Authentic & Familiar
Cooking Style; Authentic;
Taste of Time; Ethnic
Pleasure &
Indulgence
New Taste; Fine Dining;
Patisserie and
Coffeehouse Experiences
Fresh & Invigorating
Taste without Compromise;
Fresh; Healthy Halo;
Natural Mood
TasteFree From
Food Intolerance;
Low/No/Reduced Lactose;
Gluten Free; Clean/Cleaner Label
Better For You
Reduced Sugar;
Salt and Fat;
Balanced Choice
Tailored For You
Infant and Toddler; Performance
and Healthcare Nutrition;
Weight Management
Good For You
Protein Fortification; Carbohydrate
Quality; Healthy Lipids;
Micronutrient Fortification;
Naturally Good For You
Nutrition
© Kerry 2018
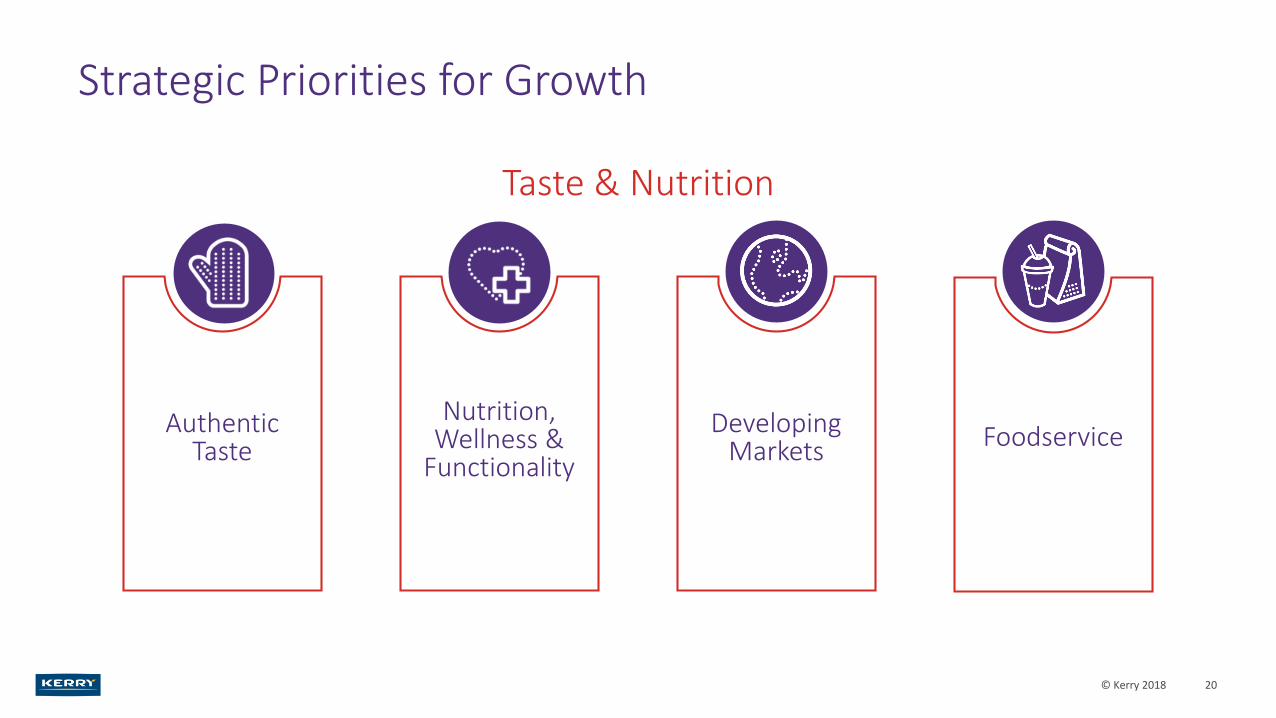
Strategic Priorities for Growth
20
Nutrition, Wellness &
Functionality
Taste & Nutrition
Authentic Taste FoodserviceDeveloping
Markets
© Kerry 2018

21

Consumer Foods at a Glance
22
Category Brands & Customers Channels
FOOD-TO-GOEVERYDAY FRESH
CONVENIENCE MEALSOLUTIONS
ONLINE
OUT OF HOME
SUPERMARKETS
CONVENIENCE/ HIGH STREET
© Kerry 2018
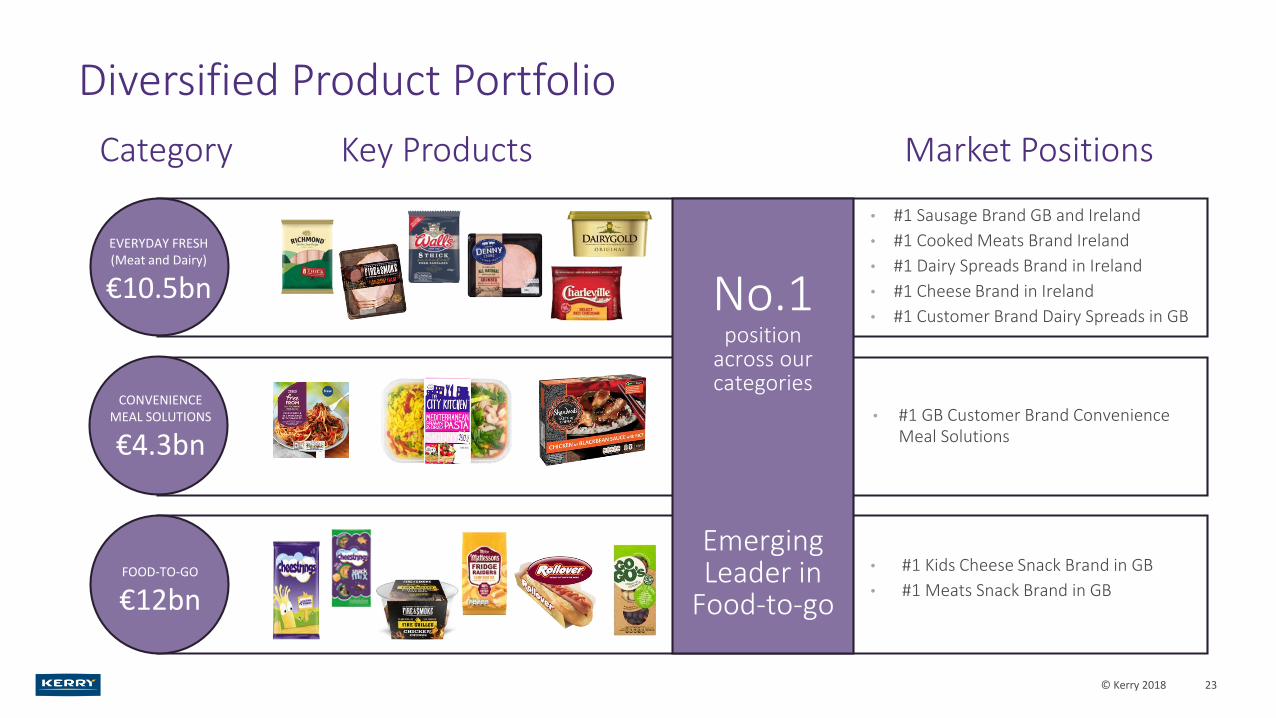
Diversified Product Portfolio
23
Category Key Products Market Positions
EVERYDAY FRESH(Meat and Dairy)
€10.5bn
CONVENIENCE MEAL SOLUTIONS
€4.3bn
FOOD-TO-GO
€12bn
• #1 Sausage Brand GB and Ireland
• #1 Cooked Meats Brand Ireland
• #1 Dairy Spreads Brand in Ireland
• #1 Cheese Brand in Ireland
• #1 Customer Brand Dairy Spreads in GB
• #1 GB Customer Brand Convenience Meal Solutions
• #1 Kids Cheese Snack Brand in GB
• #1 Meats Snack Brand in GB
No.1position
across our categories
Emerging Leader in
Food-to-go
© Kerry 2018
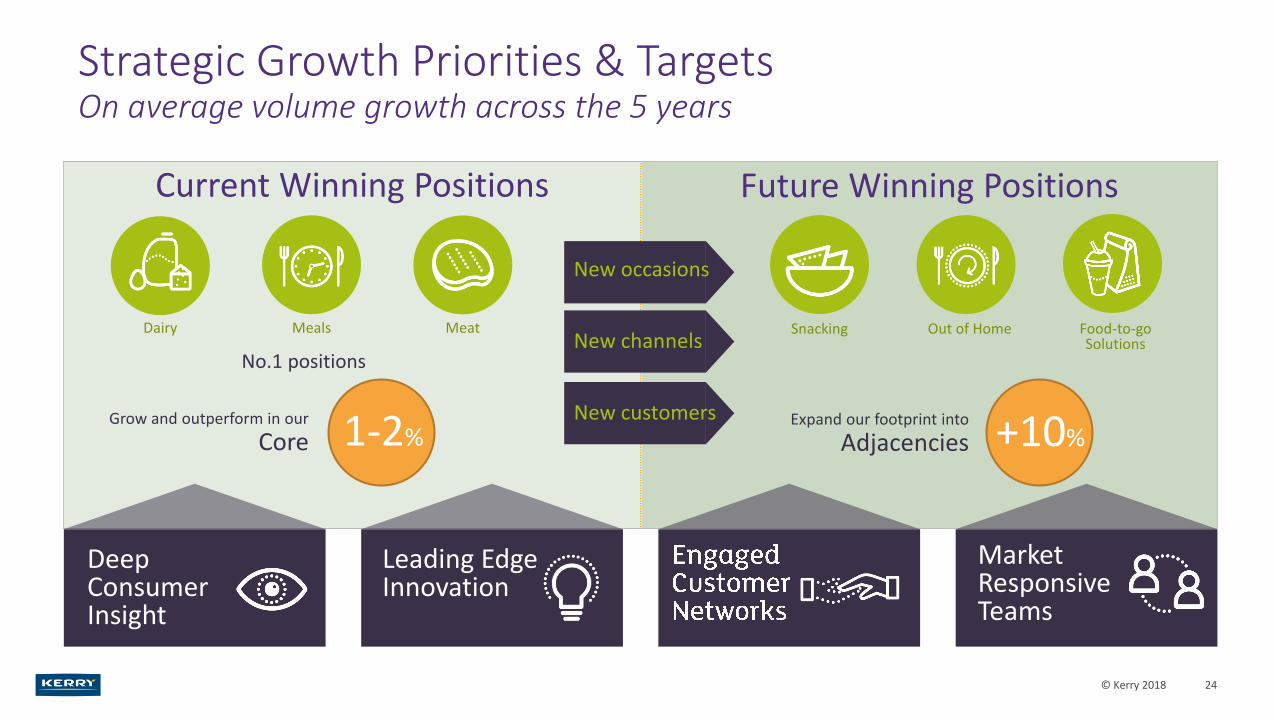
Strategic Growth Priorities & TargetsOn average volume growth across the 5 years
24
Current Winning Positions
1-2%Grow and outperform in our
No.1 positions
MeatMealsDairy
Core
Future Winning Positions
+10%
Snacking Out of Home Food-to-go Solutions
Expand our footprint into
Adjacencies
New occasions
New channels
New customers
Deep Consumer Insight
Leading Edge Innovation
Market Responsive Teams
© Kerry 2018

25

‘Securing Sustainable Growth’Embedding Sustainability in Our Business
Kerry’s sustainability plan represents a journey of continuous improvement
– an ongoing process and strategy to secure sustainable growth
It offers Kerry Group a framework through which to ensure the long-term development of the organisation by building competitiveness, while at the same time enhancing the quality of life and protecting our natural resources
• Integrated in 1 Kerry strategies and operational activities
• Directed and governed by our Kerry Sustainability Council
• Groupwide time-bound, quantified targets established to measure progress
ENVIRONMENT SUSTAINABILITY
MARKETPLACE SUSTAINABILITY
WORKPLACE SUSTAINABILITY
COMMUNITY SUSTAINABILITY
26SECURING SUSTAINABLE GROWTH
© Kerry 2018

Kerry’s ‘Towards 2020’ Programme
• A comprehensive programme for sustainable growth
• Four critical areas of focus which reflect global concerns and issues of material importance to our shareholders, employees
and suppliers, translated into actions that help direct our day-to-day activities
• Directed by Senior Leadership through the Kerry Sustainability Council, with functional responsibility for implementation
that embeds sustainability within the business
Environment
Climate Change
Resource Efficiency
Waste Reduction
Marketplace
Nutrition and Health
Responsible Sourcing
Product Quality
Workplace
Our People
Business Ethics
Health and Wellbeing
Community
Social Impact
Economic Development
Shared Purpose
27
Groupwide time-bound, quantified targets established to measure progress
© Kerry 2018
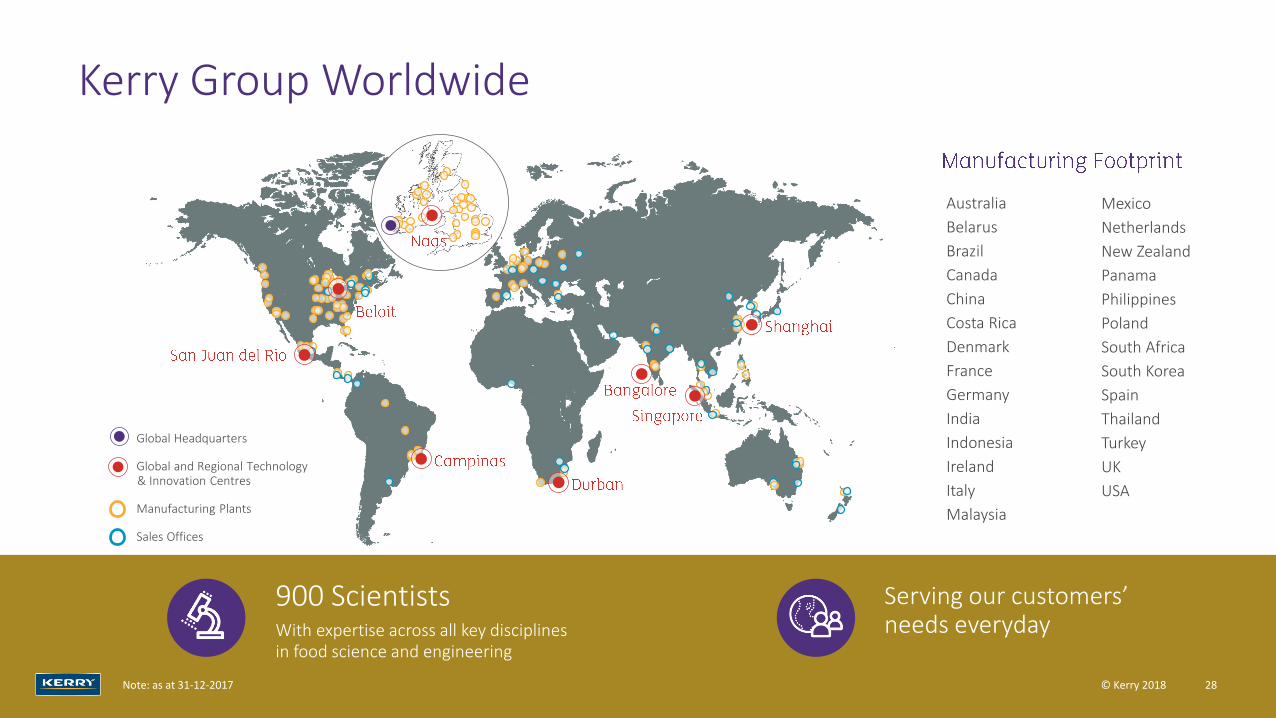
Kerry Group Worldwide
28
Serving our customers’ needs everyday
900 ScientistsWith expertise across all key disciplines in food science and engineering
Note: as at 31-12-2017
Australia
Belarus
Brazil
Canada
China
Costa Rica
Denmark
France
Germany
India
Indonesia
Ireland
Italy
Malaysia
Mexico
Netherlands
New Zealand
Panama
Philippines
Poland
South Africa
South Korea
Spain
Thailand
Turkey
UK
USA
Global Headquarters
Global and Regional Technology & Innovation Centres
Manufacturing Plants
Sales Offices
© Kerry 2018
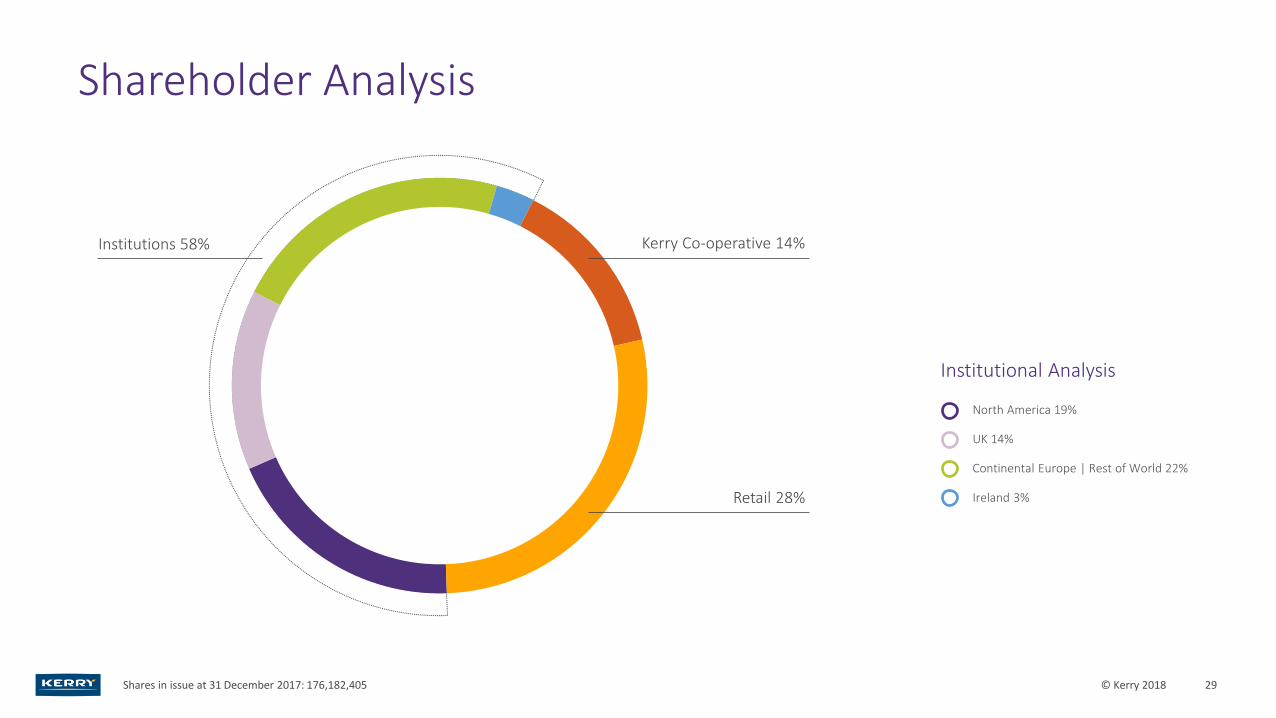
Shareholder Analysis
29
North America 19%
UK 14%
Continental Europe | Rest of World 22%
Ireland 3%
Institutional Analysis
Retail 28%
Kerry Co-operative 14%Institutions 58%
Shares in issue at 31 December 2017: 176,182,405 © Kerry 2018
