disaster risk profile – seychelles · united nations development programme . disaster risk...
TRANSCRIPT
UNITED NATIONS DEVELOPMENT PROGRAMME
Disaster risk profile of the Republic of Seychelles
prepared by Denis CHANG SENG Consultant Bonn, Germany And Richard GUILLANDE GEOSCIENCES CONSULTANTS sarl Paris, France July 2008
Tsunami Hazard Risk Tropical Cyclone Hazard Risk
2
Content of the report
Figures .................................................................................................................... 4 Abbreviations ............................................................................................................ 7
1 ACKNOWLEDGEMENT .............................................................................................. 8 2 BACKGROUND AND CONTEXT ................................................................................... 9 3 OBJECTIVE OF THE DISASTER RISK PROFILE STUDY. ................................................ 10 4 COUNTRY GEOGRAPHY, POPULATION, GEOLOGY AND CLIMATE OF SEYCHELLES ........... 10
4.1 Geography ................................................................................................... 10 4.2 Morphology of the main granitic Islands. .......................................................... 12 4.3 Geology and tectonics .................................................................................... 13 4.4 Population .................................................................................................... 13 4.5 Climate of the country ................................................................................... 15 4.6 History of major disasters in Seychelles ............................................................ 16
5 TSUNAMI HAZARD ................................................................................................ 18 5.1 Introduction ................................................................................................. 18 5.2 The December 2004 tsunami .......................................................................... 18
5.2.1 Propagation .............................................................................................. 18 5.2.2 Run-Up and Damages ................................................................................. 20
5.3 The September 2007 Indian Ocean Tsunami ..................................................... 23 5.4 Modelling ..................................................................................................... 24
5.4.1 ComMIT Model (Propagation and Inundation) ................................................. 24 5.4.2 Avi-Nami Model (Tsunami Generation and Propagation Model) .......................... 24
5.5 Tsunamis scenarios ....................................................................................... 25 5.5.1 Digital Elevation Models (DEM) .................................................................... 25 5.5.2 Potential Tsunami Scenarios ........................................................................ 25 5.5.3 Tsunami Generation Sources ....................................................................... 26 5.5.4 Tsunami Events ......................................................................................... 28 5.5.5 Sunda Arc - Sumatra Worse Case Scenario .................................................... 29 5.5.6 Makran Worse Case Scenario ....................................................................... 30
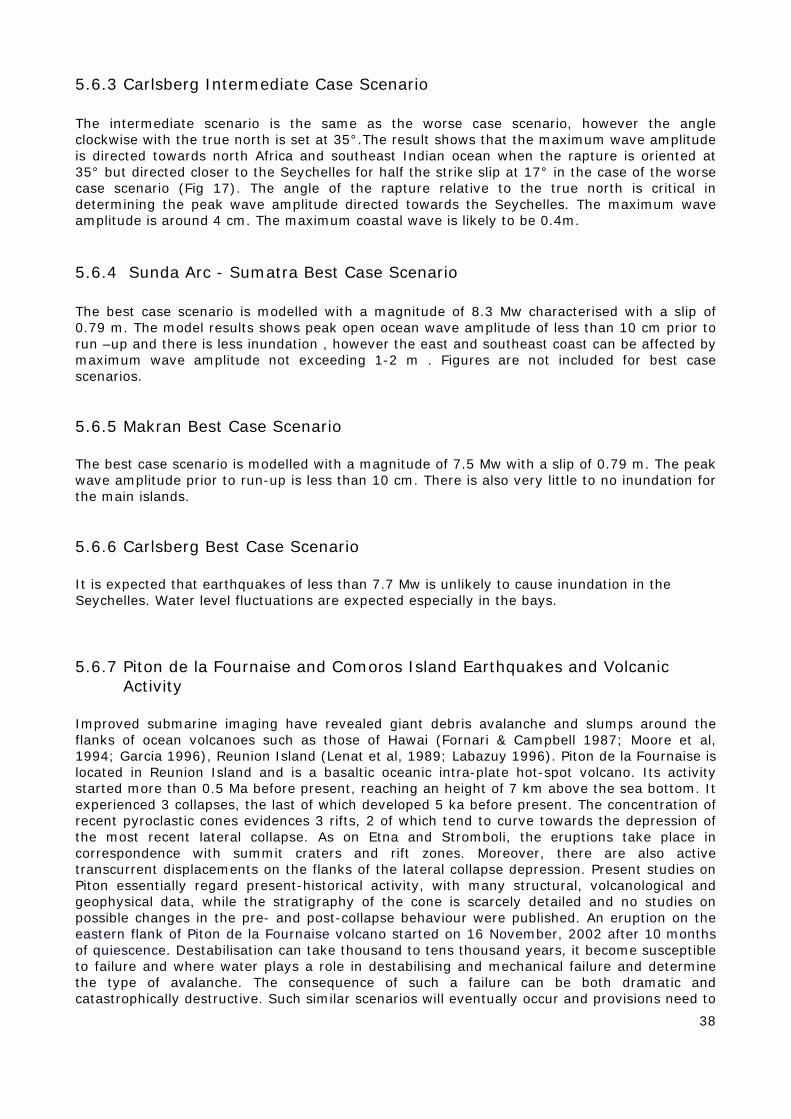
5.6 Carlsberg Worse Case Scenario ....................................................................... 34 5.6.1 Sunda Arc - Sumatra Intermediate Case Scenario .......................................... 36 5.6.2 Makran Intermediate Case Scenario ............................................................. 37 5.6.3 Carlsberg Intermediate Case Scenario .......................................................... 38 5.6.4 Sunda Arc - Sumatra Best Case Scenario ...................................................... 38 5.6.5 Makran Best Case Scenario ......................................................................... 38 5.6.6 Carlsberg Best Case Scenario ...................................................................... 38 5.6.7 Piton de la Fournaise and Comoros Island Earthquakes and Volcanic Activity ...... 38 5.6.8 Consolidated Tsunami Scenarios and Maximum Wave Amplitude Hazard ............ 39
5.7 Conclusion on Tsunami hazard modelling. ......................................................... 42 6 TROPICAL CYCLONES HAZARD ............................................................................... 43
6.1 Recent cyclones and storm surges on Seychelles ............................................... 43 6.2 Tropical Depression ‘Ikonjo’, 11-21st May 1990 .................................................. 43 6.3 Tropical Depression ‘01S’, 5th-9th September 2002 ............................................. 43 6.4 Intense Tropical Cyclone ‘Bondo’, 17th -26th December 2006 ................................ 45 6.5 Introduction ................................................................................................. 47 6.6 Tropical Cyclone Monitoring and Warning System in the Southwest Indian Ocean ... 48 6.7 Tropical Cyclone (TC) Hazard Risk Methodology ................................................. 49 6.8 Return Period of Probable Maximum Wind in the Seychelles Region ...................... 49 6.9 Tropical Cyclone Wind Hazard Zoning ............................................................... 53
6.9.1 Spatial cyclonic wind hazard zoning .............................................................. 53 6.9.2 Return Period of Average Probable Maximum Wind Speed ................................ 53
7 STORM SURGE HAZARD ........................................................................................ 56 7.1 Recent Storm Surges in Seychelles .................................................................. 56 7.2 Introduction ................................................................................................. 56 7.3 Storm Surge Modelling .................................................................................. 56
3
7.4 Storm Surge Hazard zoning ............................................................................ 57 8 RAINFALL ............................................................................................................ 60
8.1 Recent extreme rainfall events ........................................................................ 60 8.2 The August 1997/1998 El Nino Event ............................................................... 60 8.3 The December 28-30th 2004 Torrential Rainfall .................................................. 60 8.4 Introduction and Background .......................................................................... 61
9 FLOODS HAZARD .................................................................................................. 68 9.1 Hydrology of Seychelles ................................................................................. 68 9.2 Types of floods ............................................................................................. 71 9.3 Conditions of occurrence and causes ................................................................ 71
9.3.1 Seasons and rainfall events ......................................................................... 71 9.3.2 Non hydrological-meteorological factors and causes of floods ........................... 71
9.4 Flood prone areas, elements at risk and vulnerabilities ....................................... 72 9.4.1 Flood mapping in Seychelles ........................................................................ 72 9.4.2 Vulnerability factors ................................................................................... 74
10 – LANDSLIDES HAZARD .................................................................................... 77 10.1 Geological and hydrogeological settings ............................................................ 77 10.2 Types of ground movements ........................................................................... 78
10.2.1 Mudflows ............................................................................................... 78 10.2.2 Mass movements and landslip .................................................................. 79 10.2.3 Rockfall ................................................................................................. 81 10.2.4 Others, isolated block fall or earth slides .................................................... 83 10.2.5 Artificially created instabilities conditions ................................................... 83
10.3 Conditions of occurrence ................................................................................ 84 10.4 Geographical distribution of landslides ............................................................. 85 10.5 Vulnerability to landslides ............................................................................... 88
11 - FOREST FIRES HAZARD .................................................................................. 91 11.1 Distribution and causes of forest fires .............................................................. 91 11.2 Season and distribution of forest fires. ............................................................. 91 11.3 Factor for rockfall and erosion ......................................................................... 92 11.4 Forest fire risk reduction ................................................................................ 94
12 CLIMATE CHANGE ISSUES ................................................................................. 95 12.1 Climate Scenario Modelling ............................................................................. 95 12.2 Temperature ................................................................................................ 95 12.3 Rainfall ........................................................................................................ 96 12.4 Tropical Cyclone ........................................................................................... 97 12.5 Sea level rise issue ........................................................................................ 98
13 - VULNERABILITY OF MAIN INFRASTRUCTURES, LIFELINES AND UTILITIES TO NATURAL DISASTERS ............................................................................................... 101
13.1 Effects of August 1997 rainfall and floods. ...................................................... 101 13.2 Distribution of population ............................................................................. 101 13.3 Elements at risk and vulnerabilities ................................................................ 104 13.4 - Analysis of SEYPEC tank farm of Victoria. ..................................................... 109
14 KEY FINDINGS AND RECOMMENDATIONS FOR RISK REDUCTION .......................... 111 14.1 Key findings ............................................................................................... 111 14.2 Recommendations for Risk reduction ............................................................. 112 14.3 Recommandations for Flood risk. ................................................................... 112
14.3.1 Recommendations for storms and cyclones risk. ....................................... 113 14.4 Recommendations for ground movements and erosion risk. .............................. 114 14.5 Recommendations for tsunami risk. ............................................................... 114 14.6 General recommandations ............................................................................ 115
15 - DISASTER DATABASE ................................................................................... 119 16 GIS DATABASE .............................................................................................. 121 17 ANNEXES ...................................................................................................... 122
17.1 Compiled hydro meteorological data .............................................................. 122 17.2 Layers of the hazard mapping GIS database delivered to DRDM. ........................ 122 17.3 Best theoretical distribution curve for cyclone grid areas ................................... 124
18 REFERENCES ................................................................................................. 129
4
Figures Figure 1 : map of Seychelles archipelago (source Seychelles initial national communication 2000). ...................................................................................................................... 11Figure 2 : shaded relief heights of the islands of Mahé. 1 : area of Victoria city, 2 : area on international airport. ................................................................................................... 12Figure 3 : shaded relief heights of the islands of Praslin and la Digue. ................................ 13Figure 4 : The 26th December 2004 Indonesian tsunami travel time, maximum offshore wave height and affected areas. source:http://www.grid.unep.ch/product/map/images/tsunami_wave_propb.gif ................. 19Figure 5 : Tsunami signal at Point La Rue, Mahe Seychelles with tidal oscillations removed. .. 20Figure 6 : Map of 2004 tsunami impact on Mahé and Praslin Islands (Source: Jackson et al, 2005) ....................................................................................................................... 21Figure 7 : map of inundation limits of Dec. 2004 tsunami on Mahé Island. .......................... 22Figure 8 : mapped inundation limits of Dec. 2004 tsunami on Praslin and La Digue Islands. .. 23Figure 9 : Maximum wave amplitude distribution of 12th September 2007 earthquake .......... 24Figure 10: Filtered earthquake magnitudes greater than (a) 6.5Ms (b) 7.6Ms (c) 8.5 Ms and 9.0 Ms up to 30 km deep for the main Indian Ocean. Data source: The Integrated Tsunami Data Base software (ITDB/PAC, 2006/7) ....................................................................... 27Figure 11: Seismic hazard, largest earthquakes, plate boundaries and tsunami sources from (a) Sunda arc - Sumatra subduction Zone (b) Makran subduction zone (c) Carlsberg transform fault (d) Piton de la Fournaise, La Reunion and (e) Comoros. Source: (USGS) .................... 28Figure 12: Events for all tsunamis and major tsunamis with intensity (a) 1 (b) 2 and (c) 4 for the Sunda arc consisting of the three Sumatra subduction Zone. ....................................... 29Figure 13: Location time series propagation of Sunda Arc - Sumatra worse case scenario ..... 30Figure 14: Location time series propagation of Makran worse case scenario ........................ 31Figure 15: (a) Sunda Arc - Sumatra worse (9.2Mw) and (b) Makran worse case scenarios (8.8Mw) of maximum coastal wave amplitude for Mahe and Praslin Islands. ....................... 32Figure 16 : A close up view along the east coast of Mahe for Sunda Arc - Sumatra worse case scenario(9.2Mw). ....................................................................................................... 33Figure 17 : A close up view along the southwest coast of Mahe for Sunda Arc - Sumatra worse case scenario (9.2Mw). ............................................................................................... 33Figure 18 : Carlsberg 7.7Ms earthquake of 1983, rapture zone and finite fault model (USGS).
............................................................................................................................... 34Figure 19: Simulation of the open ocean maximum wave amplitude for earthquake at 10 km with angle of dip of 70°, strike slip of 35° W and a slip of 0.5 m. The rapture zone extends from -3.2° S to -4.2°S. Model run of Avi-Nami (IOC-UNESCO, 2006) .............................. 35Figure 20: Tsunami propagation for Carlsberg worse case scenario at (a) 15 minutes (b) 1 hour (c) 2.0 hours and (d) 3.0 using Avi-Nami model (IOC-UNESCO, 2006) ........................ 36Figure 21 : (a) Mahe-Sunda Arc - Sumatra intermediate (8.8 Mw) and (b) Mahe- Makran intermediate (8.3 Mw) case scenarios of maximum coastal wave amplitude. C and d shows scenarios for Praslin Island respectively. ........................................................................ 37Figure 22: Consolidated tsunami maximum wave hazard for Mahe Island ........................... 41Figure 23 : Consolidated tsunami maximum wave hazard for Praslin Island ........................ 41Figure 24 : Track and intensity of cyclonic system Ikonjo (Data Source: Meteo France La Reunion tropical cyclone database) ............................................................................... 43Figure 25: (a)Tropical depression 01 S track (b) Uprooted trees within the compounds of La Reserve Hotel Praslin and (c) 3 days accumulated rainfall (d) Level of damage assessed on Praslin as a result of the 6-8th September 2002 storm(Source: Chang Seng 2007) .............. 45Figure 26: (a) Intense tropical cyclone ‘Bondo’ track (b) satellite imagery (Meteorological Services, 2006) and (c) impact on Providence island (picture from Adrian Skerret ( Source: Chang Seng 2007) ..................................................................................................... 47Figure 27: Graphical classification of tropical disturbance adopted in the southwest Indian Ocean ...................................................................................................................... 49Figure 28: Example of the scan tropical cyclone radius of 1300 km centred from Mahe, Seychelles ................................................................................................................. 50
5
Figure 29: Estimated return period using the (a) Logarithmic (b) Log Pearson III distribution function fitting of average maximum wind speed in the 1300 km scan radius centred on Mahe, Seychelles ................................................................................................................. 52Figure 30: Frequency distribution of average maximum wind speed per grid box of 3˚X3˚ resolution from 3˚S-12˚S and 39˚-60˚ east in the southwest Indian Ocean. ...................... 53Figure 31: Cyclonic wind hazard zoning in the Seychelles region based on average maximum wind speed in knots indicated in shaded colours and estimated return period or frequency in bold text (Yrs) ........................................................................................................... 55Figure 32: Tropical cyclone ‘Bondo’ QScat estimated wind field and theoretical sea water circulation around the small island inhibiting the storm surge development. ........................ 57Figure 33: Storm surge hazard scenarios (s1 and s2) for Mahe, Farquhar and Aldabra group 59Figure 34: (a) 3 day accumulated rainfall from 28th-30th December (Source: Climate Centre, National Meteorological Services) and (b) flooding in Victoria, Mahe, Seychelles. ................. 61Figure 35 : yearly cumulated rainfall map for Mahé Island (source Seychelles Meteorological service). ................................................................................................................... 62Figure 36: CMAP mean STD of monthly (1979-2000) surface precipitation (mm/day) in the Southwest Indian Ocean. ............................................................................................ 63Figure 37 : Annual mean rainfall (1985-1996) for Mahe. .................................................. 64Figure 38: Probable 24 Hours Maximum Rainfall (mm) for selected station in each of the rainfall zones. The Seychelles International Airport 24 hours, 3 hours and 1 hour PMR is also shown. Farquhar PMR is not plotted .............................................................................. 65Figure 39: Rainfall hazard scenarios (S1, S2, S3, S4 and S5) for the 5-year return period probable maximum rainfall (PMR) in mm. ...................................................................... 67Figure 40 : main catchments on the Island of Mahé (Source V. Caze-Duvat, 2001). ............. 69Figure 41 : main catchments on the Island of Praslin and La Digue (Source V. Caze-Duvat, 2001). ...................................................................................................................... 70Figure 42 : distribution along years of recorded rainfall events (with damages) and unrecorded events (peak rainfall or discharges not recorded with damages) - analysed for Mahé island (data from Met Office and PUC water) ........................................................................... 71Figure 43 : channel draining a wetland in Silhouette island obstructed by reconstruction of a new beach at the outlet under the effect of SE monsoon (photo R. Guillande). .................... 72Figure 44 : flood prone areas on coastal zones of Mahé Island (corresponds to most of the coastal plains lying below the height 2 m. ...................................................................... 73Figure 45 : flood prone areas on coastal zones of Mahé Island (corresponds to most of the coastal plains lying below the height 2 m. ...................................................................... 74Figure 46 : old traditional practice of construction on pillars or elevated basements in colonial houses and cases close to rivers or beaches in low lands ................................................. 75Figure 47 : Absence of protection and basement at same elevation than ground level in recent construction. On the right the recent house was build on an elevated basement. ................. 75Figure 48 : medical centers in Silhouette (left) and La Digue (Right) both build on the beaches with ground basement at same level than natural soils. ................................................... 75Figure 49 : typical cross section of slope showing weathered boulders on top of slope and concentration of house at the toe (modified from SEYPEC 2005). ...................................... 77Figure 50 : inferred position of the great avalasse of 1862, from description in colonial archives.(source point area on the left is uncertain). ....................................................... 79Figure 51 : diagram showing the accumulation of mixed boulders and colluviums at the base of steeps granitic slope and accumulation of boulders at the toe of the slope, frequently observed on rocky shores (from Vista Do Mar SEYPEC report). ....................................................... 80Figure 52 : map of Vista do Mar landside and observed ground fractures (lines) (source SEYPEC, MLUH, SMURF) .............................................................................................. 80Figure 53 : hanging block along a road on a steep slope of Mahé island. ............................ 82Figure 54 : Landslip on a steep slope in a populated place of Mahé (photo DRDM). ............. 83Figure 55 : landslip above Beauvallon bay caused by destabilisation during earthwork for a new construction (photo R. GUILLANDE). ............................................................................. 84Figure 56 : frequency of landslides movements by month of the year based on record of historical ground movements (from 1862 to 2006). ......................................................... 85Figure 57 : location of the active Vista do Mar landslide ................................................... 86Figure 58 : distribution of landslides sites with impacts on human activities On Mahé Island. 87
6
Figure 59: distribution of landslides sites with impacts on human activities On Mahé Island. . 88Figure 60: typical construction not respecting distance to slope and base and stability angle of slope (photo R.Guillande). ........................................................................................... 90Figure 61 : seasonal distribution of forest fires on Praslin (from MOE database). ................. 92Figure 62 : burned scar transformed in a steep scarp where vegetation has disappeared letting place to rapid erosion and scouring around hanging blocks. The houses below are exposed to the rockfall. Praslin Island (photo R. Guillande). ............................................................. 93Figure 63 : rapid onset of erosion on a burned slope at North East point. Forest has disappeared and superficial soil is rapidly eroded. The phenomenon is probably accelerated by underneath groundwater flow which accelerates erosion of the red soils when reaching the surface (photo R. Guillande). ....................................................................................... 94Figure 64 : Global climate change warming effect on the cyclonic wind hazard zones based on of 5-10 % increase in average maximum wind speed. ..................................................... 98Figure 65: Inundation extent of global climate change warming effect of sea level rise of +0.6 m superimposed on mean high water mark of the DEM for Mahe Islands for the years 2050-2100. ....................................................................................................................... 99Figure 66: Inundation extent of global climate change warming effect of sea level rise of +0.6 m superimposed on mean high water mark of the DEM for Praslin, La Digue, Curieuse Island group for the years 2050-2100. ................................................................................... 99Figure 67 : population by districts and population density on the island of Mahé. ............... 102Figure 68 : population by districts and population density on the island of Praslin and La Digue.
............................................................................................................................. 103Figure 69 : Map buildings on Mahé with respect to potentially floodable zone. ................... 105Figure 70 : Map buildings on Praslin and La Digue with respect to potentially floodable zone.
............................................................................................................................. 106Figure 71 : map of building exposed in potentially floodable zone of Victoria area (reclaimed lands off the shore would be also concerned as they are generally less than 2 m above high tide level. ................................................................................................................ 106Figure 72 : location of hotels, guest houses, restaurant and other sites related to tourism activities on the island of Mahé (data GIS dept., MND). ................................................. 107Figure 73 : location of hotels, guest houses, restaurant and other sites related to tourism activities on the island of Praslin and La Digue (data GIS dept., MND). ............................ 108Figure 74 : location of SEYPEC facility to the east of Victoria city on a reclaimed area. ....... 109Figure 75 : maximum wave amplitude on the Victoria port for a Boxing day like tsunami arriving at high tide on the Seychelles. White polygon indicates SEYPEC tank farm. The SEYPEC site is in the range of water altitude from 2 to 3 m above high tide level. ......................... 110Figure 76 : intensity and damage scale fopr flash floods to qualify magnitude and map geographic distribution of an flood (from Guillande at al. 2003). ..................................... 116Figure 77 : coupled topography and bathymetry of a sector in the Morbihan gulf (France). Ground resolution is 1 m. .......................................................................................... 118Figure 78 : graphical user interface of the Disasters database developed with Microsoft Access.
............................................................................................................................. 120Figure 79 : menu interface for creation of a new record in the database. .......................... 120Figure 80 : menu interface for selection of past events using multi-criteria analysis. .......... 121Figure 81: Theoretical distribution for square grid c21 ................................................... 124Figure 82: Theoretical distribution for square grid c20 ................................................... 124Figure 83: Theoretical distribution for square grid c19 ................................................... 125Figure 84: Theoretical distribution for square grid c18 ................................................... 125Figure 85: Theoretical distribution for square grid c17 ................................................... 126Figure 86: Theoretical distribution for square grid c14 ................................................... 126Figure 87: Theoretical distribution for square grid c13 ................................................... 127Figure 88: Theoretical distribution for square grid c12 ................................................... 127Figure 89: Theoretical distribution for square grid c10 ................................................... 128Figure 90: Theoretical distribution for square grid c9 ..................................................... 128
7
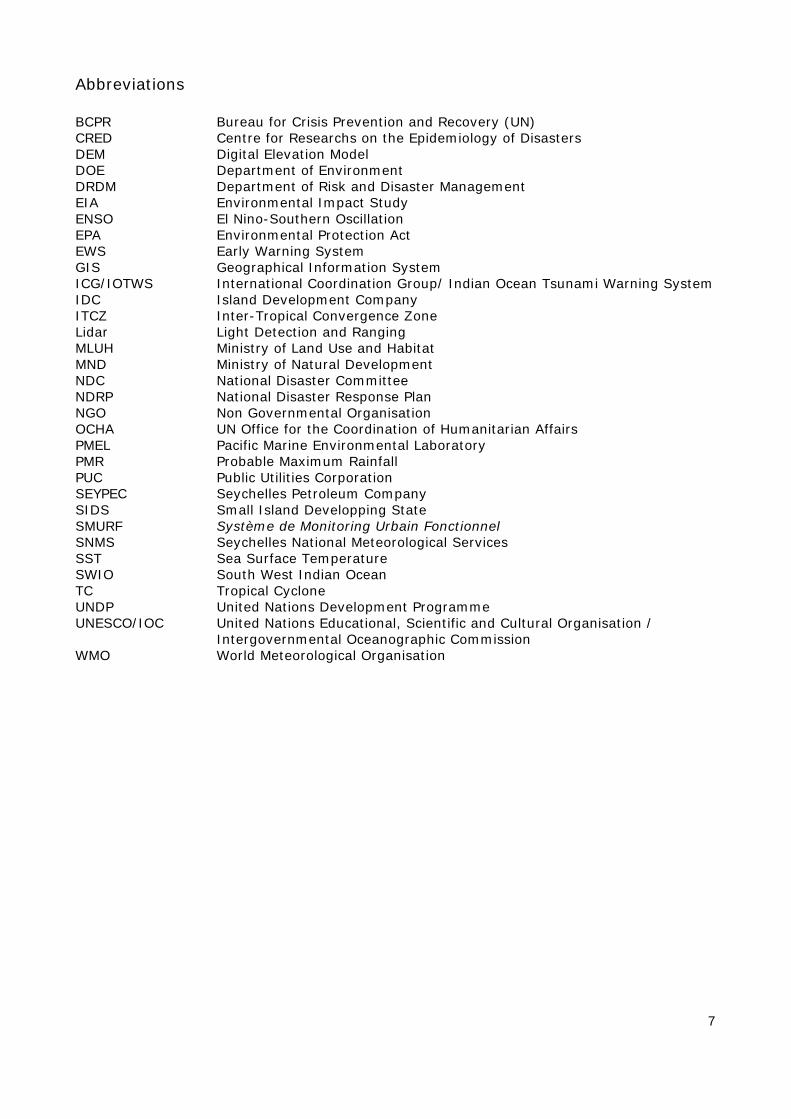
Abbreviations BCPR Bureau for Crisis Prevention and Recovery (UN) CRED Centre for Researchs on the Epidemiology of Disasters DEM Digital Elevation Model DOE Department of Environment DRDM Department of Risk and Disaster Management EIA Environmental Impact Study ENSO El Nino-Southern Oscillation EPA Environmental Protection Act EWS Early Warning System GIS Geographical Information System ICG/IOTWS International Coordination Group/ Indian Ocean Tsunami Warning System IDC Island Development Company ITCZ Inter-Tropical Convergence Zone Lidar Light Detection and Ranging MLUH Ministry of Land Use and Habitat MND Ministry of Natural Development NDC National Disaster Committee NDRP National Disaster Response Plan NGO Non Governmental Organisation OCHA UN Office for the Coordination of Humanitarian Affairs PMEL Pacific Marine Environmental Laboratory PMR Probable Maximum Rainfall PUC Public Utilities Corporation SEYPEC Seychelles Petroleum Company SIDS Small Island Developping State SMURF Système de Monitoring Urbain Fonctionnel SNMS Seychelles National Meteorological Services SST Sea Surface Temperature SWIO South West Indian Ocean TC Tropical Cyclone UNDP United Nations Development Programme UNESCO/IOC United Nations Educational, Scientific and Cultural Organisation /
Intergovernmental Oceanographic Commission WMO World Meteorological Organisation
8
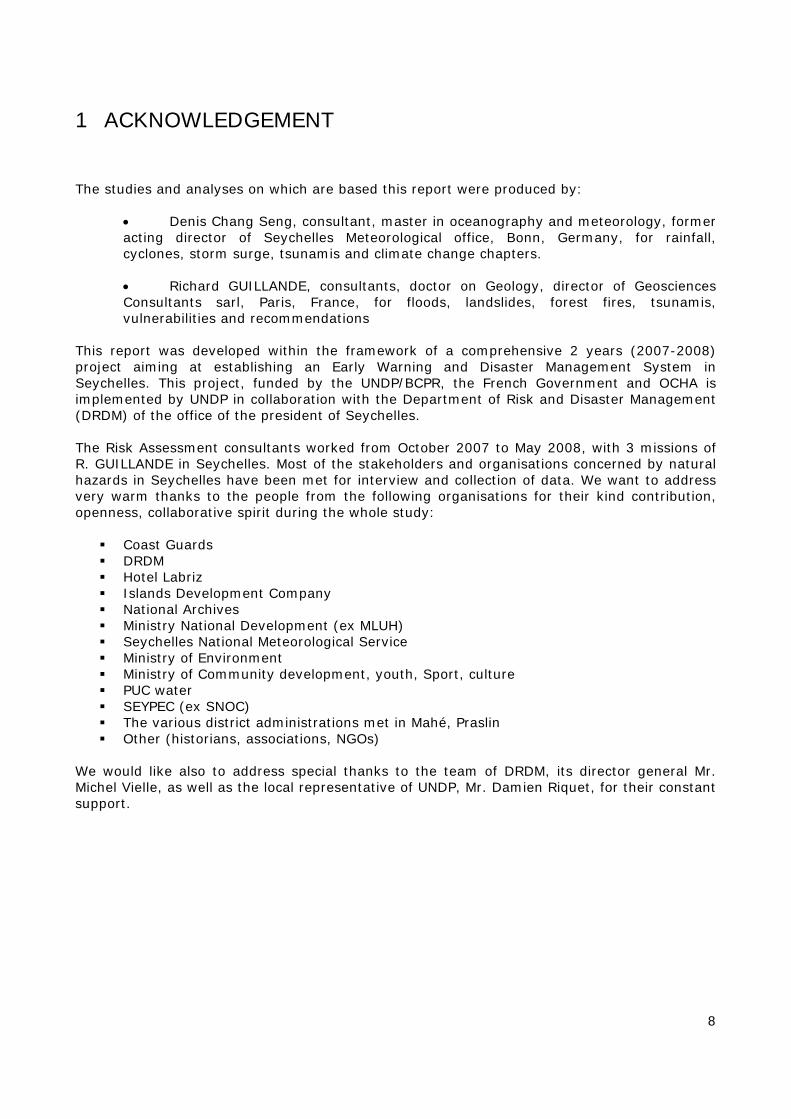
1 ACKNOWLEDGEMENT The studies and analyses on which are based this report were produced by:
• Denis Chang Seng, consultant, master in oceanography and meteorology, former acting director of Seychelles Meteorological office, Bonn, Germany, for rainfall, cyclones, storm surge, tsunamis and climate change chapters. • Richard GUILLANDE, consultants, doctor on Geology, director of Geosciences Consultants sarl, Paris, France, for floods, landslides, forest fires, tsunamis, vulnerabilities and recommendations
This report was developed within the framework of a comprehensive 2 years (2007-2008) project aiming at establishing an Early Warning and Disaster Management System in Seychelles. This project, funded by the UNDP/BCPR, the French Government and OCHA is implemented by UNDP in collaboration with the Department of Risk and Disaster Management (DRDM) of the office of the president of Seychelles. The Risk Assessment consultants worked from October 2007 to May 2008, with 3 missions of R. GUILLANDE in Seychelles. Most of the stakeholders and organisations concerned by natural hazards in Seychelles have been met for interview and collection of data. We want to address very warm thanks to the people from the following organisations for their kind contribution, openness, collaborative spirit during the whole study:
Coast Guards DRDM Hotel Labriz Islands Development Company National Archives Ministry National Development (ex MLUH) Seychelles National Meteorological Service Ministry of Environment Ministry of Community development, youth, Sport, culture PUC water SEYPEC (ex SNOC) The various district administrations met in Mahé, Praslin Other (historians, associations, NGOs)
We would like also to address special thanks to the team of DRDM, its director general Mr. Michel Vielle, as well as the local representative of UNDP, Mr. Damien Riquet, for their constant support.
9
2 BACKGROUND AND CONTEXT If we look at the number of victims caused by natural disasters since the arrival of a significant population three centuries ago (see chapter 4.6, table 2), the Seychelles can be considered as one of the safest countries on the Indian Ocean. Although the country had experienced some severe weather conditions and floods during the summer of 1997, a real conscience of vulnerability to natural disasters rose after the December 2004 tsunami impact and the effects of cyclone Bondo on the outer Islands of Farqhuar and Providence in December 2006. A National Disaster Committee (NDC) was created in Seychelles in 1995. It exists in the President’s Office to look into all natural disasters which may hit Seychelles and its prime objectives are prevention and preparation of a National Disaster Response Plan (NDPR). The President sometimes chairs the meetings of the NDC whenever the situation is catastrophic and warrants such high level strategic leadership. The NDC is under the chairmanship of the Principal Secretary of the President’s Office; and it comprises members such as Principal Secretaries of key ministries as well as high-ranking officers in charge of the essential services such as Met Office, Police and Defence Force, environment, etc. The Department of Risk and Disaster Management (DRDM) of Seychelles was created in October 2004 as the National Disaster Secretariat for the NDC. Two months later the tsunami impacted Seychelles. The then National Disaster Secretariat was upgraded as the Department of Risk and Disaster Management in December 2006. The Department, then, started to be headed by a Principal Secretary, assisted by a Director General and now a director for impact assessment. The UNDP’s Early Warning and Disaster Management Systems’ Project was the result of the Flash Appeal made in Seychelles after the 2004 Tsunami. A Project Document was signed between UNDP and the Government of Seychelles in April 2006. The United Nations Development Programme (UNDP) is supporting the Government of the Seychelles in the development of a comprehensive Early Warning and Disaster Management system in the country with specific activities that started in 2007:
• Capacity Assessment • Risk Assessment (the present study). • Contingency Planning • Early Warning System • Disaster Management Policy • District Contingency Planning • Public Awareness • Disaster Risk Reduction mainstreaming • Capacity Building
One of the first steps in the process of establishing the appropriate mechanisms at national and local level was a comprehensive risk analysis of the Seychelles
to determine the nature of the hazards and vulnerabilities that need to be addressed.
10
3 OBJECTIVE OF THE DISASTER RISK PROFILE STUDY The Disaster Risk Profile is the main deliverable of the Risk assessment study. This document aims at:
Supporting the DRDM in the establishment of an early warning and disaster management system;
Identifying and describing major past disasters that stroke the country and need to be addressed;
Creating a profile of natural disasters impact on Seychelles; Producing scenarios and trends concerning hazard and vulnerability projections with
regards to climate change impact; Providing tools and guidelines to DRDM to monitor and prevent disasters, reduce the
vulnerability of elements at risk. Hazards to be covered by the consultancy:
• Tsunamis • Storms (cyclones, storm surge). • heavy rainfalls and floods • ground movements and landslides • forest fires.
4 COUNTRY GEOGRAPHY, POPULATION, GEOLOGY AND CLIMATE OF SEYCHELLES
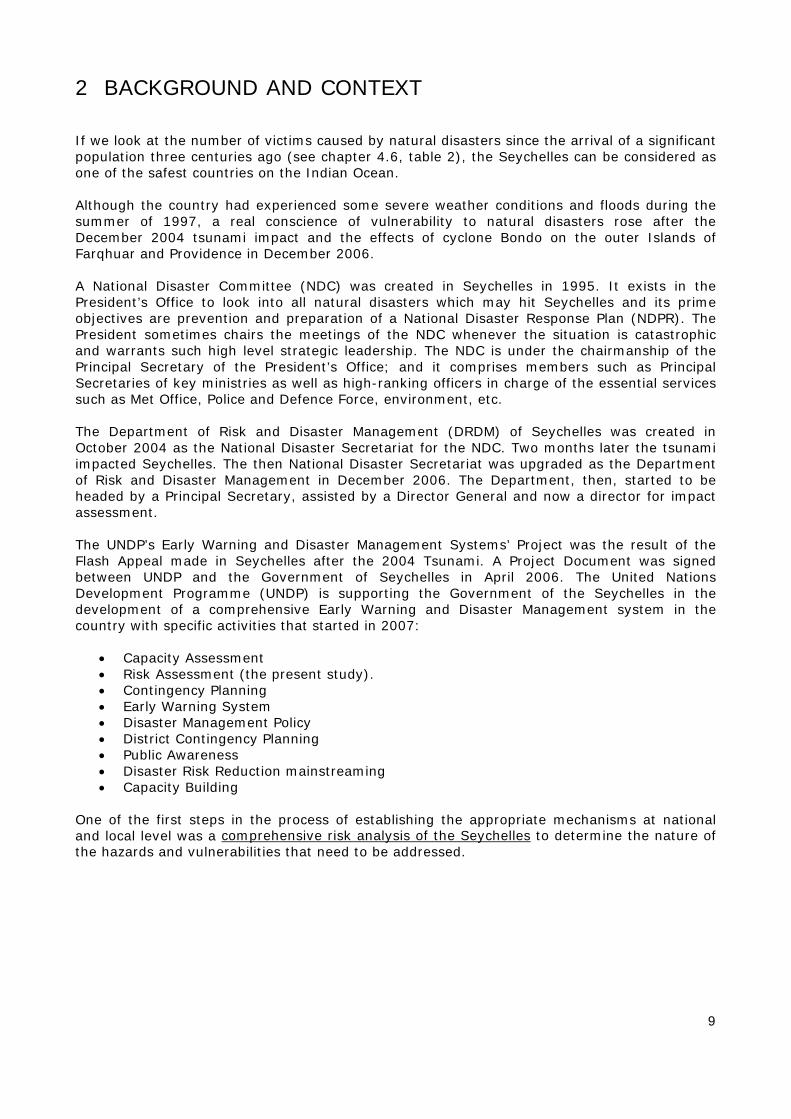
4.1 Geography The Seychelles archipelago is the most extended of the Indian Ocean. The archipelago is made up of 115 islands scattered over an exclusive economic zone covering an area of 1.374 million square kilometres, situated to the west of the Indian Ocean between 4 and 9 degrees south of the equator. The total land area is 455.3 square kilometres. The archipelago is divided into two distinct groups of islands: the granitic group, 43 islands in all, with mountainous peaks and narrow coastal lands, and the low-lying islands, all coralline numbering 72. All the 43 granitic islands are found within a radius of 50 kilometres from Mahe (Figure 1-1). With a land area of 148 square kilometres, Mahe, the seat of the government, constitutes about one-third of the total land area. The two other islands of major importance as regards to size and population are Praslin and La Digue, 33.6 km and 48 km from Mahe, respectively. Of the coral islands, Aldabra is the largest and furthest, located 1,150 km to the southwest. The granitic islands are of Precambrian origin, formed from the break-up of Gondwanaland, by tectonic activity. The granitic islands rise from the Seychelles Bank, a sunken micro-continent and shoal area of about 31,000 square kilometres, with depths ranging up to 60 meters. Many islands in the group are characterised by a very narrow coastal plateau, which rarely rises 2m above sea level. The plateaux consist of calcareous reef material, which builds up as sand dunes and pocket beaches known as "anses". Mahe has about 36 kilometres of sandy beaches. The total coastline of Seychelles is estimated at 491 km . The plateau area on the islands where most of the development including tourism, transport and housing is located, is small,
11
the largest occurring on Praslin and La Digue. The 397 km of surfaced roads (MISD, 1999), servicing the transport sector, run mostly on the coastal zone, hugging the coastline. The coral islands, which are more recent, consist of two types: low sand cays such as Bird and Denis, and elevated reef limestone like the Aldabra group (Stoddart, 1984). They are generally low-lying, average altitude of 2-6 m above mean sea level, although sand dunes on some islands may reach as high as 32 meters. Sand cays however, rarely rise above 1m of mean sea level.
Figure 1 : map of Seychelles archipelago (source Seychelles initial national communication 2000).
12
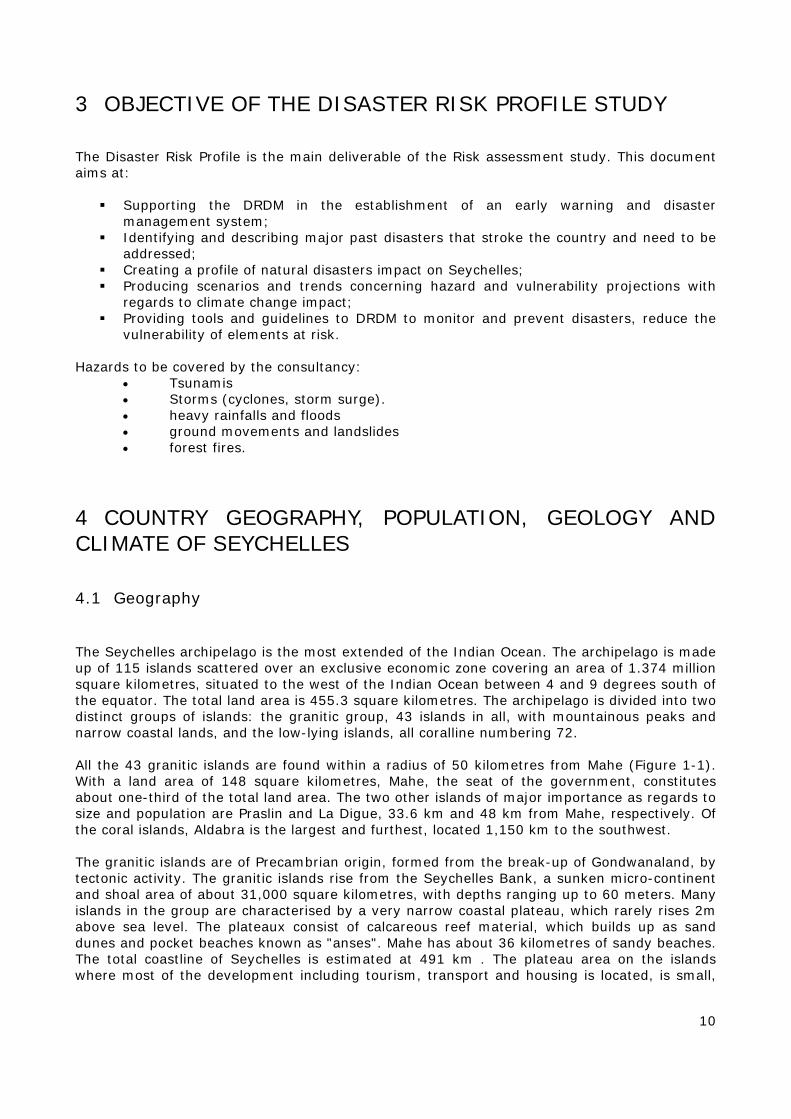
4.2 Morphology of the main granitic Islands. The main granitic Island of the Mahé group is the most inhabited of the Seychelles population have all a similar configuration with central mountainous crest and steep slopes of both sides. Hill slopes can be very steep on all islands. The inner plains, plateaux are rare and narrow. The coastal plains are generally a few tens to a few hundreds meters large. On some portions there is no coastal strip and abrupt cliffs or huge rocks chaos fall directly into the sea. This configuration has since a long time pushed the population to colonize the slopes and high lands where possible. During the last decades, the lack of constructible terrain has obliged the government to create new spaces with reclaimed lands, most of them being installed on the eastern reef plateau between Victoria and the international airport.
Figure 2 : shaded relief heights of the islands of Mahé. 1 : area of Victoria city, 2 : area on international airport.
13
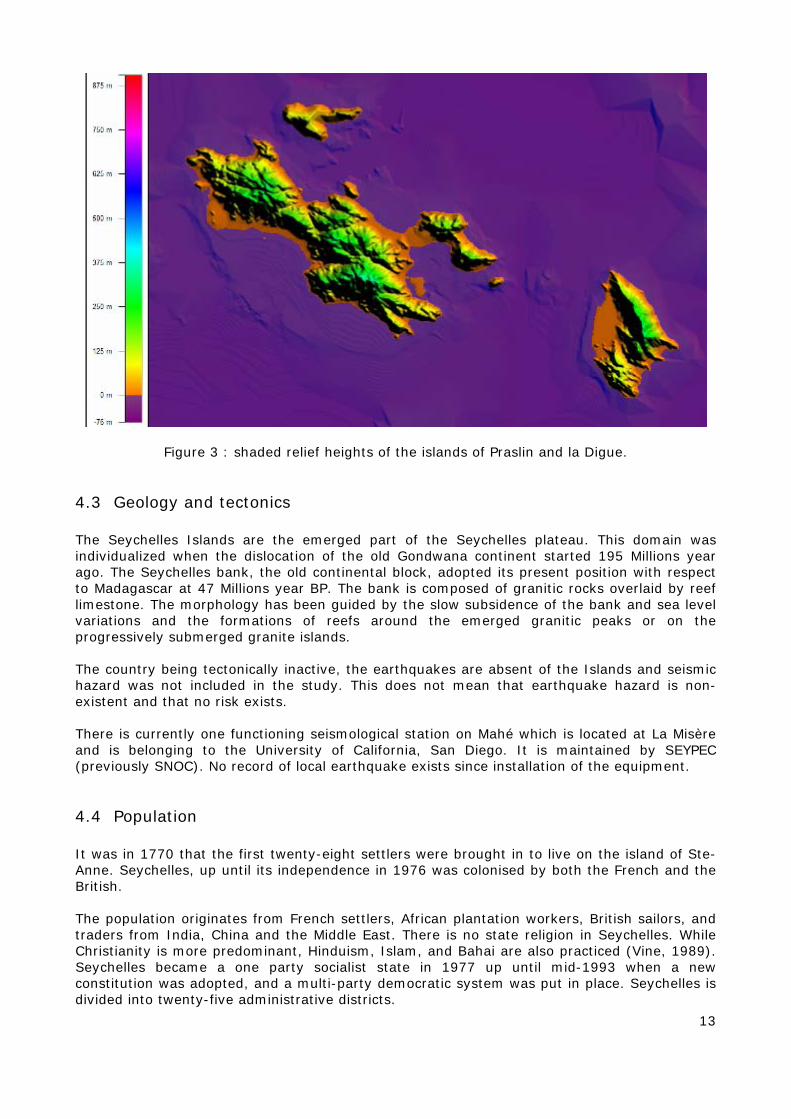
Figure 3 : shaded relief heights of the islands of Praslin and la Digue.
4.3 Geology and tectonics The Seychelles Islands are the emerged part of the Seychelles plateau. This domain was individualized when the dislocation of the old Gondwana continent started 195 Millions year ago. The Seychelles bank, the old continental block, adopted its present position with respect to Madagascar at 47 Millions year BP. The bank is composed of granitic rocks overlaid by reef limestone. The morphology has been guided by the slow subsidence of the bank and sea level variations and the formations of reefs around the emerged granitic peaks or on the progressively submerged granite islands. The country being tectonically inactive, the earthquakes are absent of the Islands and seismic hazard was not included in the study. This does not mean that earthquake hazard is non-existent and that no risk exists. There is currently one functioning seismological station on Mahé which is located at La Misère and is belonging to the University of California, San Diego. It is maintained by SEYPEC (previously SNOC). No record of local earthquake exists since installation of the equipment.
4.4 Population It was in 1770 that the first twenty-eight settlers were brought in to live on the island of Ste- Anne. Seychelles, up until its independence in 1976 was colonised by both the French and the British. The population originates from French settlers, African plantation workers, British sailors, and traders from India, China and the Middle East. There is no state religion in Seychelles. While Christianity is more predominant, Hinduism, Islam, and Bahai are also practiced (Vine, 1989). Seychelles became a one party socialist state in 1977 up until mid-1993 when a new constitution was adopted, and a multi-party democratic system was put in place. Seychelles is divided into twenty-five administrative districts.
14
On Mahe, areas urban to Victoria, the capital city, can be described as the narrow corridor of coastal plain to the south and uphill settlements to the north and west of the city. Internal migration in the Seychelles has not yet created a sizeable new urban working class. Also there have been considerable changes of internal and inter-island mobility patterns over the last few years. Migration from Praslin and La Digue to Mahe has also been significant, the three main driving forces being employment, education and housing. The return to multiparty democracy and privatisation of the economy has resulted in a positive international migration into the country.
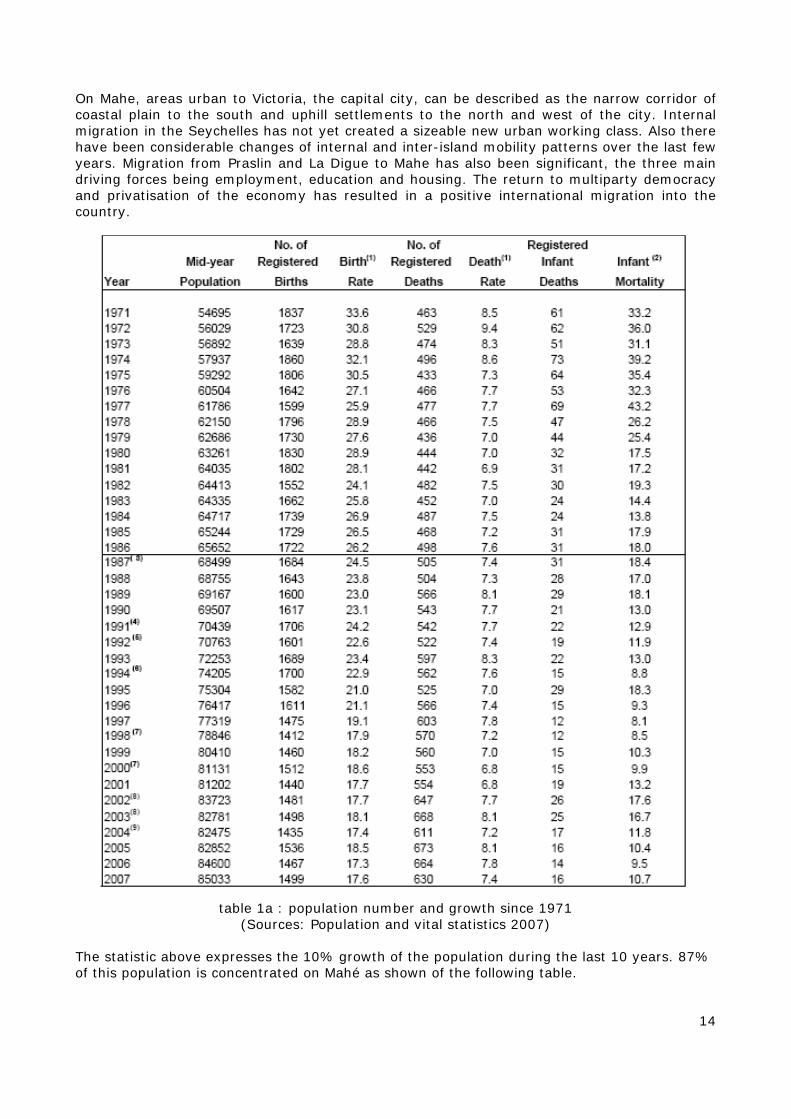
table 1a : population number and growth since 1971
(Sources: Population and vital statistics 2007)
The statistic above expresses the 10% growth of the population during the last 10 years. 87% of this population is concentrated on Mahé as shown of the following table.

15
Geographical Distribution
2003 2004 2005 2006
Mahe
72.400 72.100 72.400 73.900
Praslin 7.200
7.200 7.200 7.400
La Digue & Outer Islands
3.200
3.200 3.200 3.300
Table 1b: geographical distribution of population on the main Islands of the Seychelles.
4.5 Climate of the country Temperature and humidity remain generally high throughout the year with a mean temperature of 26.90 C, and humidity of 80%. Daytime maximum is about 5.0 C. warmer than night minimum temperatures. There is very little seasonal variation. From May to October, the Southeast trades usually result in relatively cooler and drier conditions. The period October to May is considered as the cyclone season for the Southwest Indian Ocean. The tropical cyclones are usually formed within the ITCZ, where the sea surface temperature is at least 28 0 C. Located just south of the equator, Mahe and other main granitic islands are not within the direct track of the tropical cyclones. At latitude zero, Coriolis force is also zero and this makes it physically impossible for the tropical cyclone to develop or cross the equator. However, all the islands of the archipelago are affected by the feeder-bands of tropical cyclones in the region and this can result in gale-force winds, flash floods and severe thunderstorm activity. During the Southern summer, the wind is predominantly north-westerly. Originating from the high-pressure ridge of the Arabian Peninsula, it brings in warmer air with very high moisture content, which is characteristic of Seychelles weather at that time of the year, whether or not there is a tropical cyclone in the South-West Indian Ocean. The length of the dry season also varies significantly throughout the Seychelles archipelago. Southeast Trade winds from May to October result in drier but cooler conditions to most of the Seychelles archipelago. However, in the northeast atolls of Bird Island (1973 mm) and Denis Island, the mean annual rainfall is twice as high (1973 mm & 1730 mm respectively) as in the Southwest atolls of Aldabra (984.5 mm) and Assumption (867 mm). Both spatial and temporal precipitation variability is affected by tropical cyclones. The pattern of the mean annual rainfall over Mahe island shows a higher mean rainfall along the mountainous area, and lower mean rainfall along he northern and southern tips of the island. The rainfall over Mahe exhibits large variations on all time scale ranging from a day to intra-seasonal, inter-annual, decadal and even in century scales. The year-to-year variations or otherwise known as inter-annual variability has the most profound effect on the socio-economic activities. The variability is linked to that of the global circulation like the El Nino and La Nina Southern Oscillation (ENSO). Dry conditions are more common during the Southern winter, can result in severe water shortage affecting agriculture and all other sectors of the economy (Payet, 1998).
16
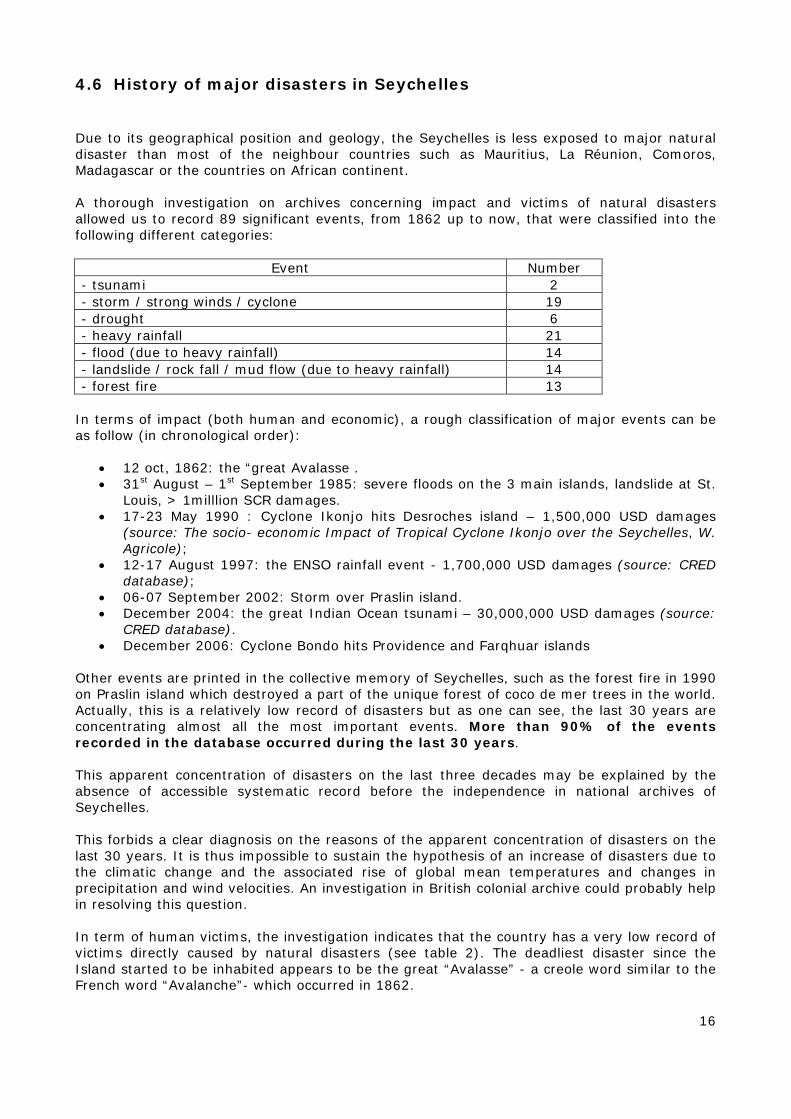
4.6 History of major disasters in Seychelles Due to its geographical position and geology, the Seychelles is less exposed to major natural disaster than most of the neighbour countries such as Mauritius, La Réunion, Comoros, Madagascar or the countries on African continent. A thorough investigation on archives concerning impact and victims of natural disasters allowed us to record 89 significant events, from 1862 up to now, that were classified into the following different categories:
Event Number - tsunami 2 - storm / strong winds / cyclone 19 - drought 6 - heavy rainfall 21 - flood (due to heavy rainfall) 14 - landslide / rock fall / mud flow (due to heavy rainfall) 14 - forest fire 13
In terms of impact (both human and economic), a rough classification of major events can be as follow (in chronological order):
• 12 oct, 1862: the “great Avalasse . • 31st August – 1st September 1985: severe floods on the 3 main islands, landslide at St.
Louis, > 1milllion SCR damages. • 17-23 May 1990 : Cyclone Ikonjo hits Desroches island – 1,500,000 USD damages
(source: The socio- economic Impact of Tropical Cyclone Ikonjo over the Seychelles, W. Agricole);
• 12-17 August 1997: the ENSO rainfall event - 1,700,000 USD damages (source: CRED database);
• 06-07 September 2002: Storm over Praslin island. • December 2004: the great Indian Ocean tsunami – 30,000,000 USD damages (source:
CRED database). • December 2006: Cyclone Bondo hits Providence and Farqhuar islands
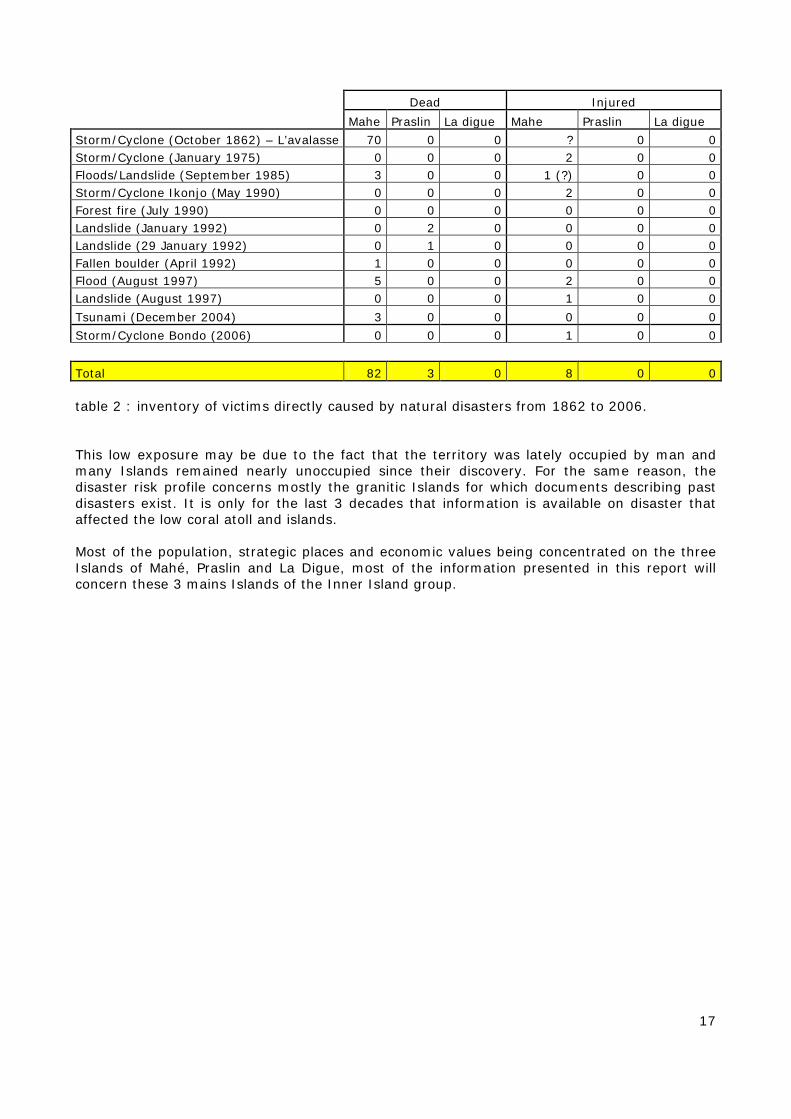
Other events are printed in the collective memory of Seychelles, such as the forest fire in 1990 on Praslin island which destroyed a part of the unique forest of coco de mer trees in the world. Actually, this is a relatively low record of disasters but as one can see, the last 30 years are concentrating almost all the most important events. More than 90% of the events recorded in the database occurred during the last 30 years. This apparent concentration of disasters on the last three decades may be explained by the absence of accessible systematic record before the independence in national archives of Seychelles. This forbids a clear diagnosis on the reasons of the apparent concentration of disasters on the last 30 years. It is thus impossible to sustain the hypothesis of an increase of disasters due to the climatic change and the associated rise of global mean temperatures and changes in precipitation and wind velocities. An investigation in British colonial archive could probably help in resolving this question. In term of human victims, the investigation indicates that the country has a very low record of victims directly caused by natural disasters (see table 2). The deadliest disaster since the Island started to be inhabited appears to be the great “Avalasse” - a creole word similar to the French word “Avalanche”- which occurred in 1862.
17
Dead Injured Mahe Praslin La digue Mahe Praslin La digue Storm/Cyclone (October 1862) – L’avalasse 70 0 0 ? 0 0 Storm/Cyclone (January 1975) 0 0 0 2 0 0 Floods/Landslide (September 1985) 3 0 0 1 (?) 0 0 Storm/Cyclone Ikonjo (May 1990) 0 0 0 2 0 0 Forest fire (July 1990) 0 0 0 0 0 0 Landslide (January 1992) 0 2 0 0 0 0 Landslide (29 January 1992) 0 1 0 0 0 0 Fallen boulder (April 1992) 1 0 0 0 0 0 Flood (August 1997) 5 0 0 2 0 0 Landslide (August 1997) 0 0 0 1 0 0 Tsunami (December 2004) 3 0 0 0 0 0 Storm/Cyclone Bondo (2006) 0 0 0 1 0 0 Total 82 3 0 8 0 0 table 2 : inventory of victims directly caused by natural disasters from 1862 to 2006. This low exposure may be due to the fact that the territory was lately occupied by man and many Islands remained nearly unoccupied since their discovery. For the same reason, the disaster risk profile concerns mostly the granitic Islands for which documents describing past disasters exist. It is only for the last 3 decades that information is available on disaster that affected the low coral atoll and islands. Most of the population, strategic places and economic values being concentrated on the three Islands of Mahé, Praslin and La Digue, most of the information presented in this report will concern these 3 mains Islands of the Inner Island group.
18
5 TSUNAMI HAZARD
5.1 Introduction Since the Dec. 2004 Indian ocean tsunami, this hazard has become a major concern for all countries of the Indian Ocean. Tsunamis are a series of ocean waves of extremely long wavelength of the order of 200-500 km and long period of 10 minutes to 2 hours generated in a body of water by an impulsive disturbance such as submarine earthquakes, undersea landslides , volcanoes, and impacts of objects from space. The name ‘tsunami’ is derived from the two Japanese words ‘tsu’ and nami’ which means harbour waves. Tsunami travels with high speed over transoceanic distances with limited energy loss. It is normally characterized with four processes which are the initiation, split, amplification and run-up. Tsunami causes death and extensive damage near the coastal regions. The tsunami height depends very much on the local topography of sea bottom near coastline. Tsunamis occur rarely in the Indian Ocean, but two of the worst in history happened there in the 19th and 21st centuries. The only officially identified tsunami observed in Seychelles prior to the 2004 tsunami Indian Ocean was the event cause by the 27th August 1883 Krakatoa eruption in Java. An unidentified source found in national archives reported waves of 2.5 feet (76cm) above usual high spring tides, receding in 15 minutes and then returning. Unusual waves continued for more than 1 day only varying in time. No damages were caused by this event.
5.2 The December 2004 tsunami
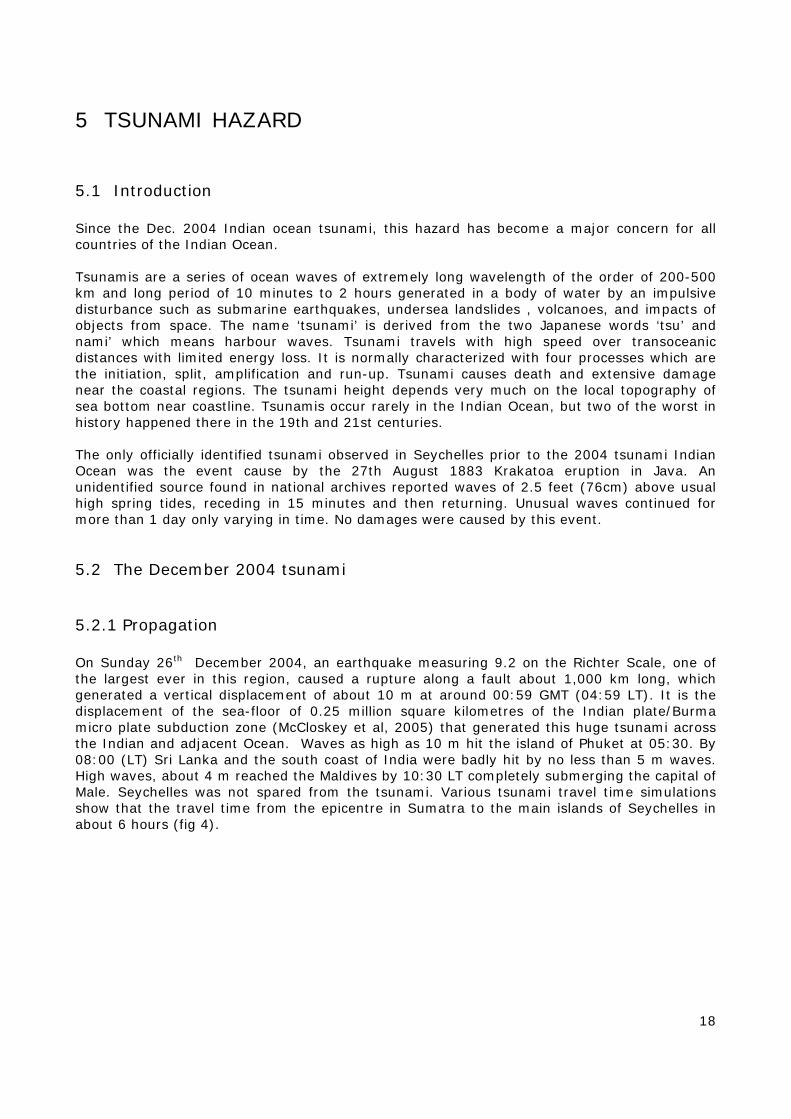
5.2.1 Propagation On Sunday 26th December 2004, an earthquake measuring 9.2 on the Richter Scale, one of the largest ever in this region, caused a rupture along a fault about 1,000 km long, which generated a vertical displacement of about 10 m at around 00:59 GMT (04:59 LT). It is the displacement of the sea-floor of 0.25 million square kilometres of the Indian plate/Burma micro plate subduction zone (McCloskey et al, 2005) that generated this huge tsunami across the Indian and adjacent Ocean. Waves as high as 10 m hit the island of Phuket at 05:30. By 08:00 (LT) Sri Lanka and the south coast of India were badly hit by no less than 5 m waves. High waves, about 4 m reached the Maldives by 10:30 LT completely submerging the capital of Male. Seychelles was not spared from the tsunami. Various tsunami travel time simulations show that the travel time from the epicentre in Sumatra to the main islands of Seychelles in about 6 hours (fig 4).
19
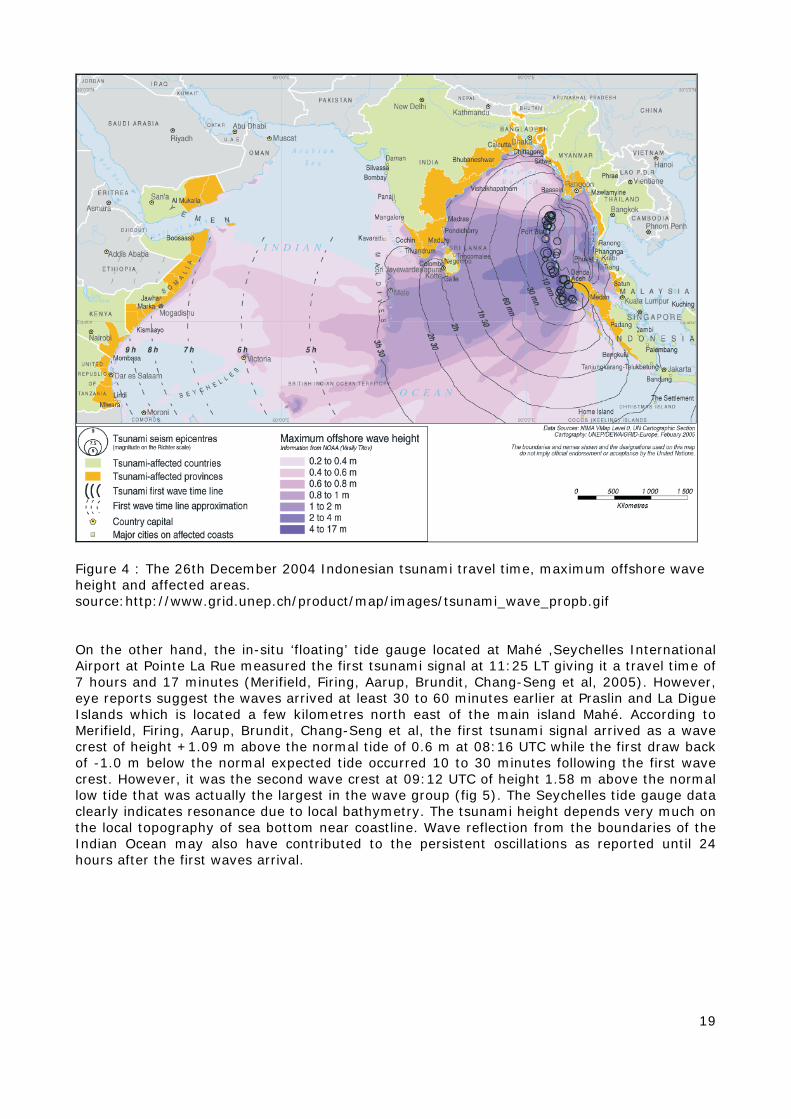
Figure 4 : The 26th December 2004 Indonesian tsunami travel time, maximum offshore wave height and affected areas. source:http://www.grid.unep.ch/product/map/images/tsunami_wave_propb.gif On the other hand, the in-situ ‘floating’ tide gauge located at Mahé ,Seychelles International Airport at Pointe La Rue measured the first tsunami signal at 11:25 LT giving it a travel time of 7 hours and 17 minutes (Merifield, Firing, Aarup, Brundit, Chang-Seng et al, 2005). However, eye reports suggest the waves arrived at least 30 to 60 minutes earlier at Praslin and La Digue Islands which is located a few kilometres north east of the main island Mahé. According to Merifield, Firing, Aarup, Brundit, Chang-Seng et al, the first tsunami signal arrived as a wave crest of height +1.09 m above the normal tide of 0.6 m at 08:16 UTC while the first draw back of -1.0 m below the normal expected tide occurred 10 to 30 minutes following the first wave crest. However, it was the second wave crest at 09:12 UTC of height 1.58 m above the normal low tide that was actually the largest in the wave group (fig 5). The Seychelles tide gauge data clearly indicates resonance due to local bathymetry. The tsunami height depends very much on the local topography of sea bottom near coastline. Wave reflection from the boundaries of the Indian Ocean may also have contributed to the persistent oscillations as reported until 24 hours after the first waves arrival.
20
Figure 5 : Tsunami signal at Point La Rue, Mahe Seychelles with tidal oscillations removed.
Source: (Merifiled, Firing, Aarup, Brundit, Chang Seng et al, 2005)
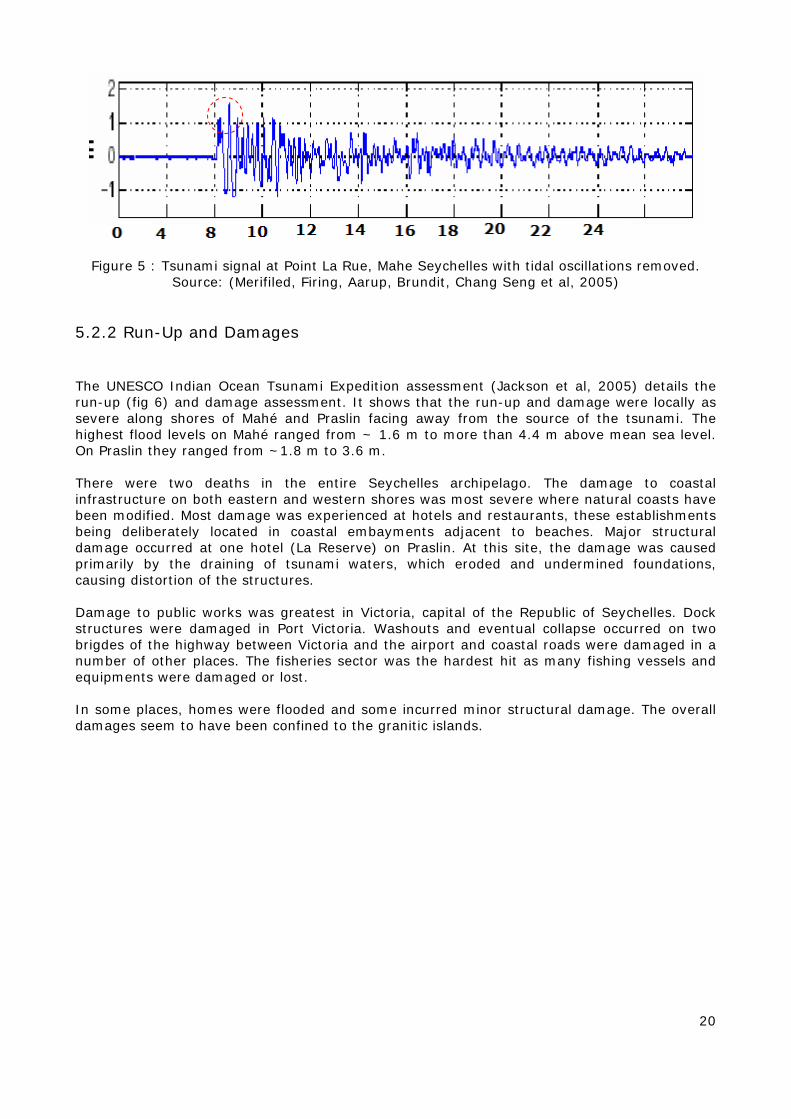
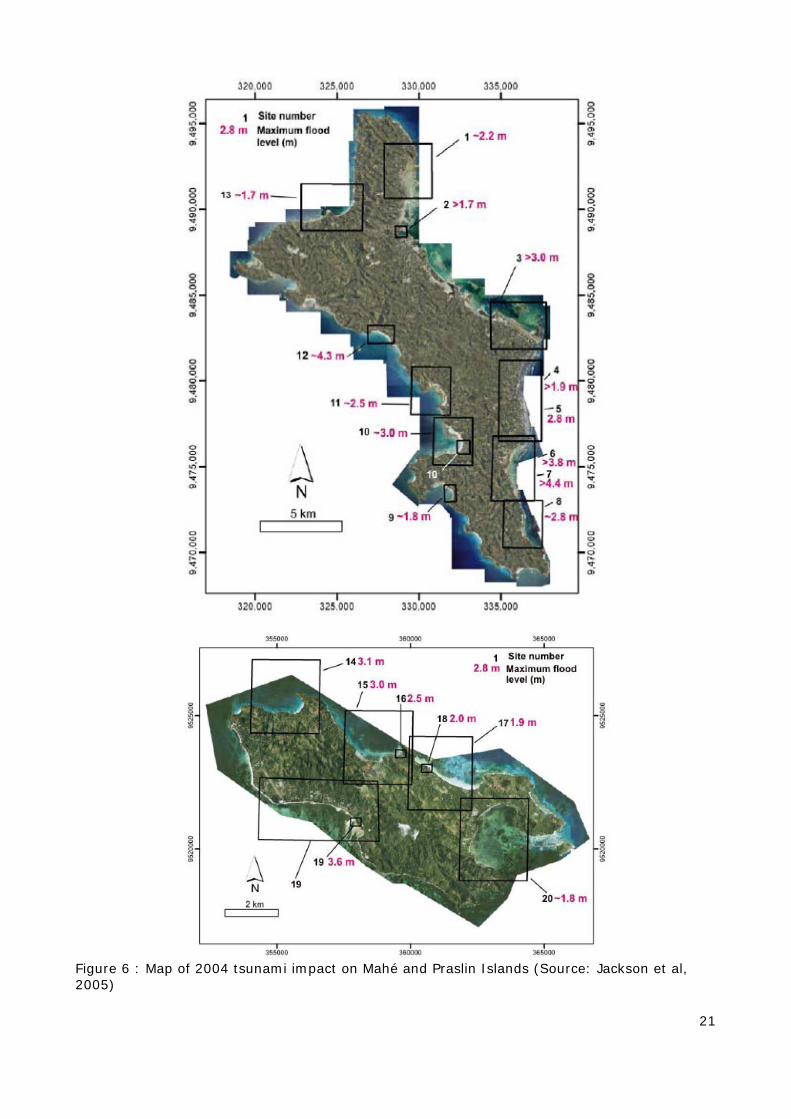
5.2.2 Run-Up and Damages The UNESCO Indian Ocean Tsunami Expedition assessment (Jackson et al, 2005) details the run-up (fig 6) and damage assessment. It shows that the run-up and damage were locally as severe along shores of Mahé and Praslin facing away from the source of the tsunami. The highest flood levels on Mahé ranged from ~ 1.6 m to more than 4.4 m above mean sea level. On Praslin they ranged from ~1.8 m to 3.6 m. There were two deaths in the entire Seychelles archipelago. The damage to coastal infrastructure on both eastern and western shores was most severe where natural coasts have been modified. Most damage was experienced at hotels and restaurants, these establishments being deliberately located in coastal embayments adjacent to beaches. Major structural damage occurred at one hotel (La Reserve) on Praslin. At this site, the damage was caused primarily by the draining of tsunami waters, which eroded and undermined foundations, causing distortion of the structures. Damage to public works was greatest in Victoria, capital of the Republic of Seychelles. Dock structures were damaged in Port Victoria. Washouts and eventual collapse occurred on two brigdes of the highway between Victoria and the airport and coastal roads were damaged in a number of other places. The fisheries sector was the hardest hit as many fishing vessels and equipments were damaged or lost. In some places, homes were flooded and some incurred minor structural damage. The overall damages seem to have been confined to the granitic islands.
21
Figure 6 : Map of 2004 tsunami impact on Mahé and Praslin Islands (Source: Jackson et al, 2005)
22
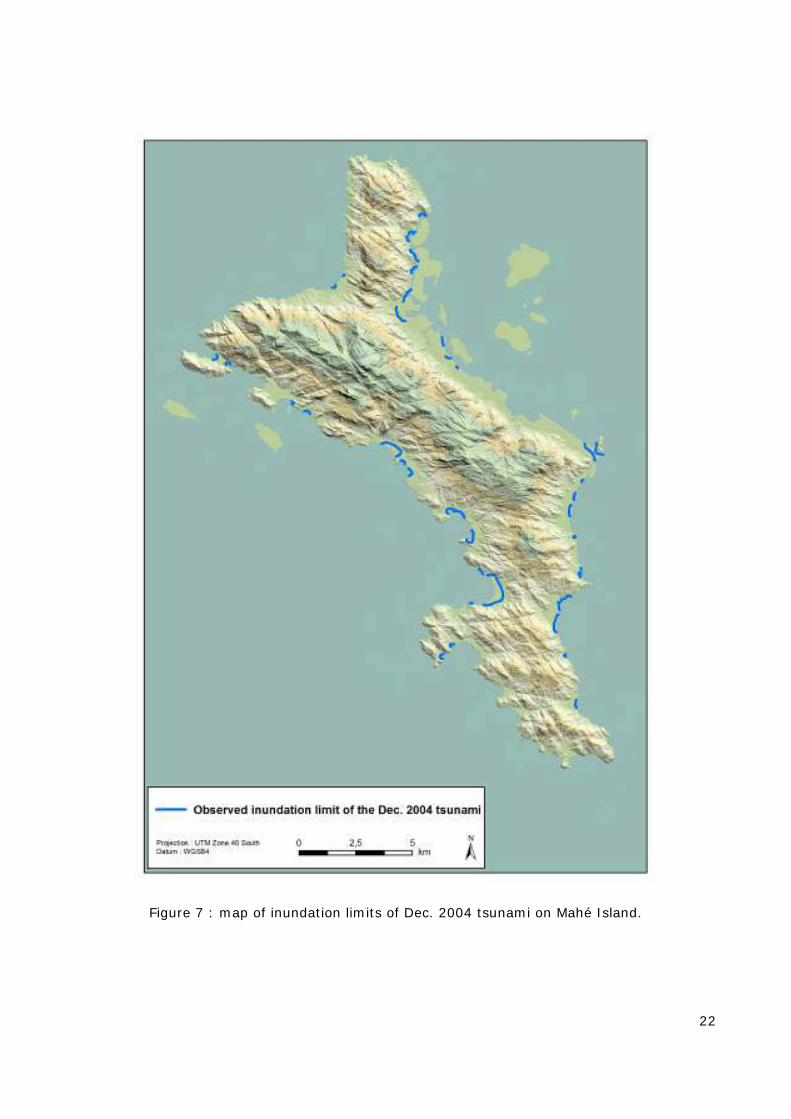
Figure 7 : map of inundation limits of Dec. 2004 tsunami on Mahé Island.
23
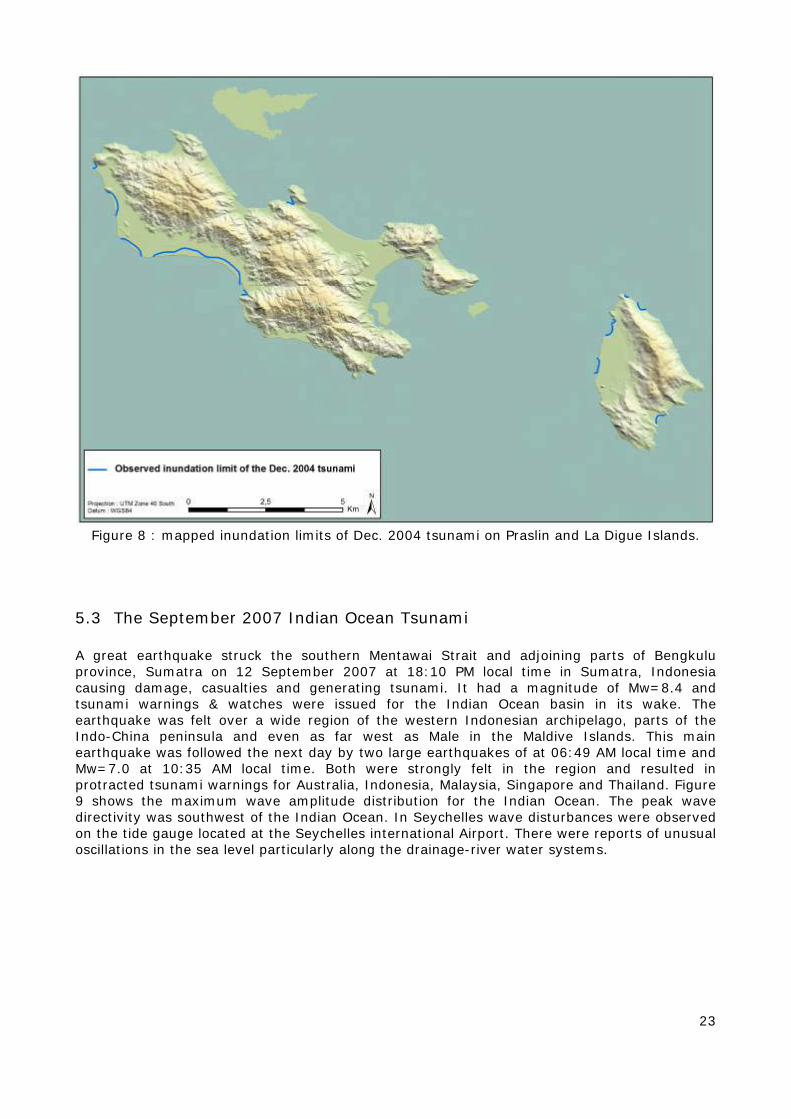
Figure 8 : mapped inundation limits of Dec. 2004 tsunami on Praslin and La Digue Islands.
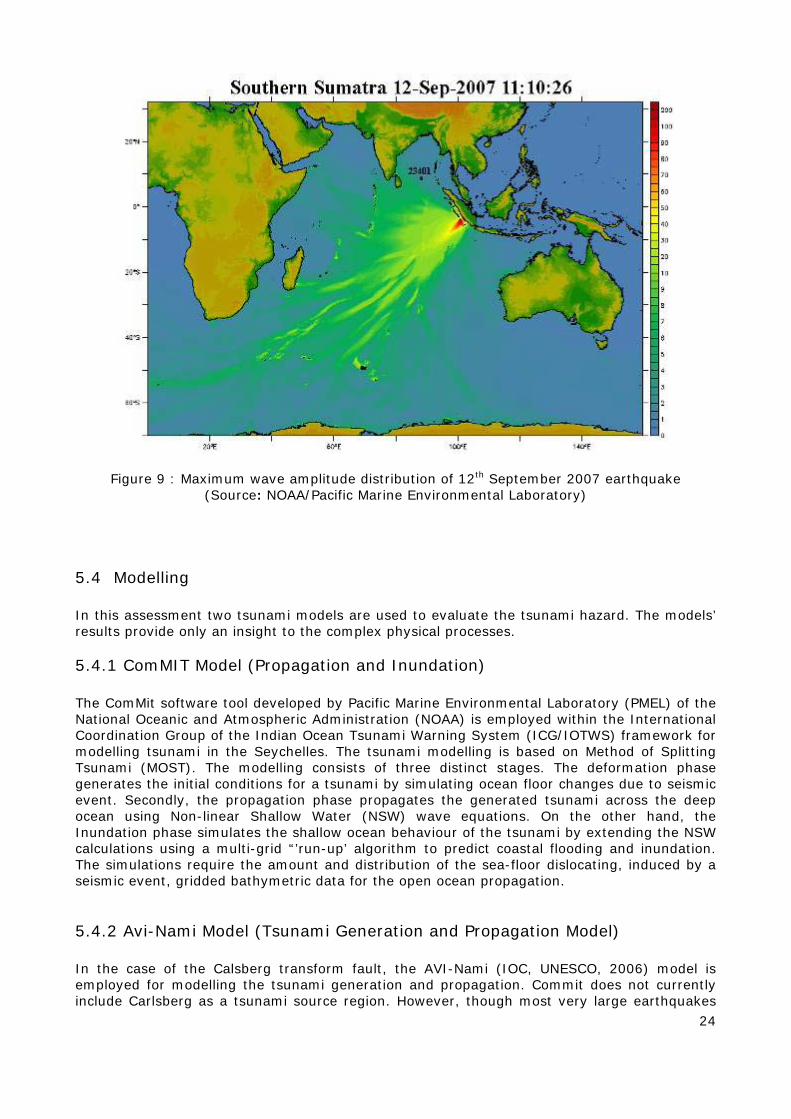
5.3 The September 2007 Indian Ocean Tsunami A great earthquake struck the southern Mentawai Strait and adjoining parts of Bengkulu province, Sumatra on 12 September 2007 at 18:10 PM local time in Sumatra, Indonesia causing damage, casualties and generating tsunami. It had a magnitude of Mw=8.4 and tsunami warnings & watches were issued for the Indian Ocean basin in its wake. The earthquake was felt over a wide region of the western Indonesian archipelago, parts of the Indo-China peninsula and even as far west as Male in the Maldive Islands. This main earthquake was followed the next day by two large earthquakes of at 06:49 AM local time and Mw=7.0 at 10:35 AM local time. Both were strongly felt in the region and resulted in protracted tsunami warnings for Australia, Indonesia, Malaysia, Singapore and Thailand. Figure 9 shows the maximum wave amplitude distribution for the Indian Ocean. The peak wave directivity was southwest of the Indian Ocean. In Seychelles wave disturbances were observed on the tide gauge located at the Seychelles international Airport. There were reports of unusual oscillations in the sea level particularly along the drainage-river water systems.
24
Figure 9 : Maximum wave amplitude distribution of 12th September 2007 earthquake (Source: NOAA/Pacific Marine Environmental Laboratory)
5.4 Modelling In this assessment two tsunami models are used to evaluate the tsunami hazard. The models’ results provide only an insight to the complex physical processes.
5.4.1 ComMIT Model (Propagation and Inundation) The ComMit software tool developed by Pacific Marine Environmental Laboratory (PMEL) of the National Oceanic and Atmospheric Administration (NOAA) is employed within the International Coordination Group of the Indian Ocean Tsunami Warning System (ICG/IOTWS) framework for modelling tsunami in the Seychelles. The tsunami modelling is based on Method of Splitting Tsunami (MOST). The modelling consists of three distinct stages. The deformation phase generates the initial conditions for a tsunami by simulating ocean floor changes due to seismic event. Secondly, the propagation phase propagates the generated tsunami across the deep ocean using Non-linear Shallow Water (NSW) wave equations. On the other hand, the Inundation phase simulates the shallow ocean behaviour of the tsunami by extending the NSW calculations using a multi-grid “’run-up’ algorithm to predict coastal flooding and inundation. The simulations require the amount and distribution of the sea-floor dislocating, induced by a seismic event, gridded bathymetric data for the open ocean propagation.
5.4.2 Avi-Nami Model (Tsunami Generation and Propagation Model) In the case of the Calsberg transform fault, the AVI-Nami (IOC, UNESCO, 2006) model is employed for modelling the tsunami generation and propagation. Commit does not currently include Carlsberg as a tsunami source region. However, though most very large earthquakes
25
capable of generating tsunamis occur at plate boundaries, intraplate activity, or activity related to diffuse plate boundaries can lead to major earthquakes with magnitudes greater than 8.0 Mw. Examples include the 1998 Balleny Island event near the Australian-Antarctic-Pacific triple junction, and historical events near the Indian-Australian diffuse boundary in the Indian Ocean. The open ocean maximum amplitude is compared with the other scenarios.
5.5 Tsunamis scenarios
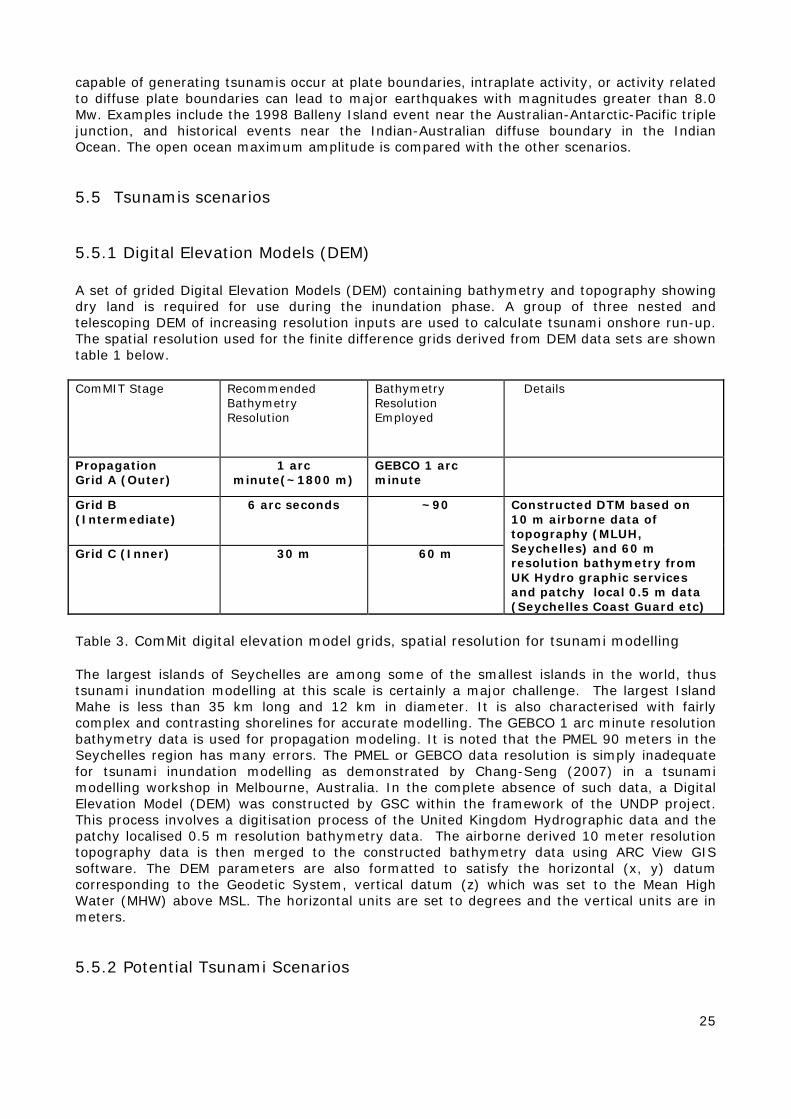
5.5.1 Digital Elevation Models (DEM) A set of grided Digital Elevation Models (DEM) containing bathymetry and topography showing dry land is required for use during the inundation phase. A group of three nested and telescoping DEM of increasing resolution inputs are used to calculate tsunami onshore run-up. The spatial resolution used for the finite difference grids derived from DEM data sets are shown table 1 below. ComMIT Stage Recommended
Bathymetry Resolution
Bathymetry Resolution Employed
Details
Propagation Grid A (Outer)
1 arc minute(~1800 m)
GEBCO 1 arc minute
Grid B (Intermediate)
6 arc seconds ~90 Constructed DTM based on 10 m airborne data of topography (MLUH, Seychelles) and 60 m resolution bathymetry from UK Hydro graphic services and patchy local 0.5 m data (Seychelles Coast Guard etc)
Grid C (Inner) 30 m 60 m
Table 3. ComMit digital elevation model grids, spatial resolution for tsunami modelling The largest islands of Seychelles are among some of the smallest islands in the world, thus tsunami inundation modelling at this scale is certainly a major challenge. The largest Island Mahe is less than 35 km long and 12 km in diameter. It is also characterised with fairly complex and contrasting shorelines for accurate modelling. The GEBCO 1 arc minute resolution bathymetry data is used for propagation modeling. It is noted that the PMEL 90 meters in the Seychelles region has many errors. The PMEL or GEBCO data resolution is simply inadequate for tsunami inundation modelling as demonstrated by Chang-Seng (2007) in a tsunami modelling workshop in Melbourne, Australia. In the complete absence of such data, a Digital Elevation Model (DEM) was constructed by GSC within the framework of the UNDP project. This process involves a digitisation process of the United Kingdom Hydrographic data and the patchy localised 0.5 m resolution bathymetry data. The airborne derived 10 meter resolution topography data is then merged to the constructed bathymetry data using ARC View GIS software. The DEM parameters are also formatted to satisfy the horizontal (x, y) datum corresponding to the Geodetic System, vertical datum (z) which was set to the Mean High Water (MHW) above MSL. The horizontal units are set to degrees and the vertical units are in meters.
5.5.2 Potential Tsunami Scenarios
26
The tsunami threats are analysed using high, intermediate and low scenarios for various moment magnitude earthquakes. The tsunami generation scenarios are based on realistic geophysical parameters for each potential source zone. The worse case scenario earthquake simulations are based on historical events with close attention on the degree of fault slip which in all cases is limited to less than 11.0 metes. For instance, the largest modelled earthquake in Makran is set to 8.8 Mw with a slip of 8.8 metes. Modelling earthquake with a magnitude greater than 8.8Mw appears to cause the slip to be larger than 15 m and this would be largely unrealistic. The tsunami scenario assessment includes peak wave amplitude in the open ocean prior to run-up, propagation time series for various locations in the Seychelles, maximum flood level, and inundation and tsunami risk zones. The results are also compared were possible with other tsunami observed in the region or locally in Seychelles to assess the accuracy of the various model output.
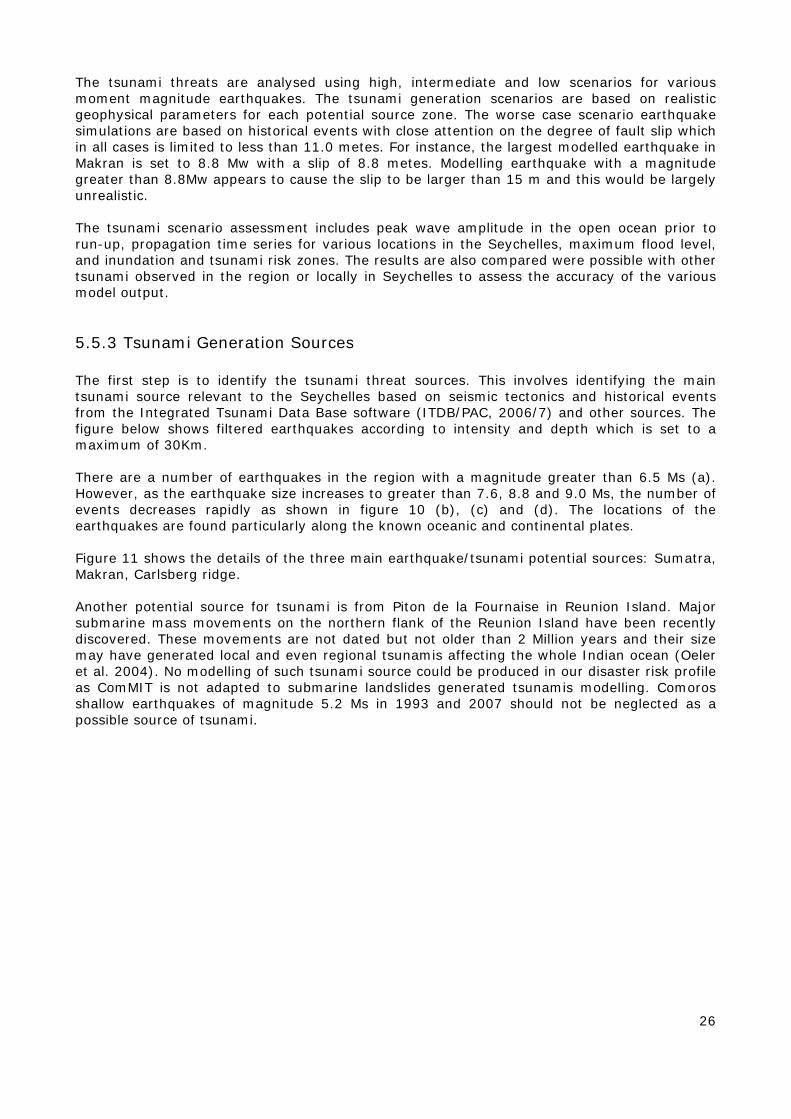
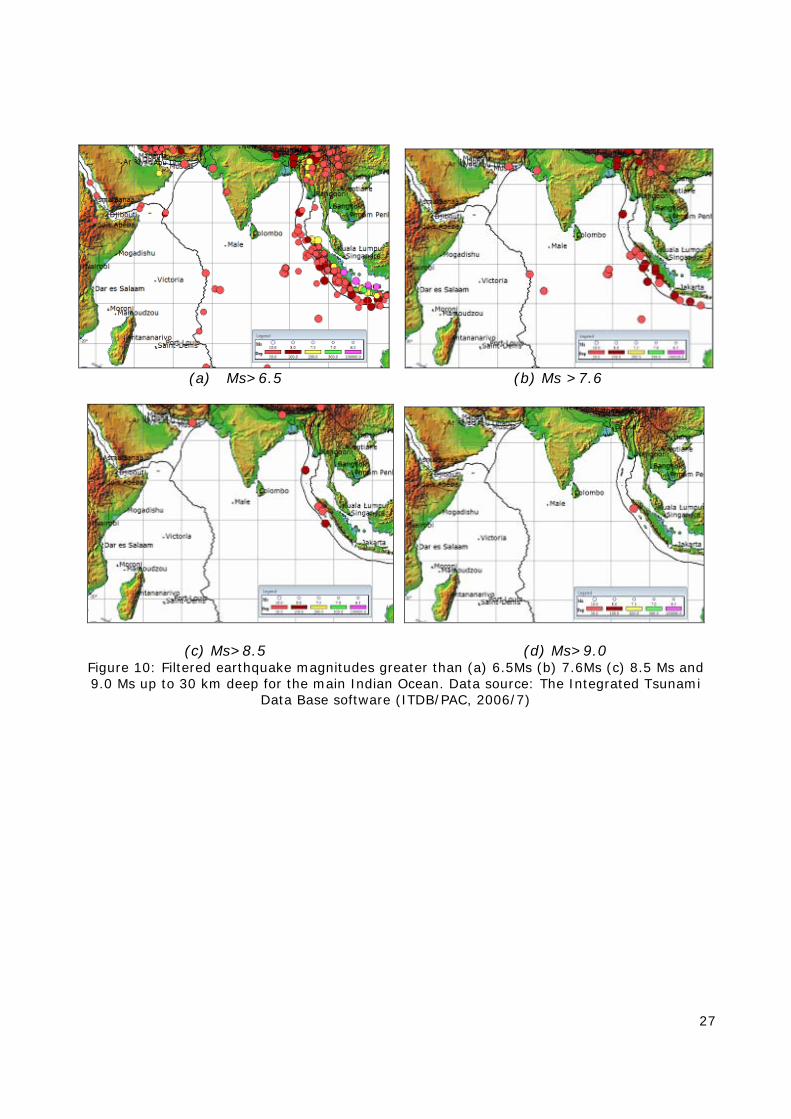
5.5.3 Tsunami Generation Sources The first step is to identify the tsunami threat sources. This involves identifying the main tsunami source relevant to the Seychelles based on seismic tectonics and historical events from the Integrated Tsunami Data Base software (ITDB/PAC, 2006/7) and other sources. The figure below shows filtered earthquakes according to intensity and depth which is set to a maximum of 30Km. There are a number of earthquakes in the region with a magnitude greater than 6.5 Ms (a). However, as the earthquake size increases to greater than 7.6, 8.8 and 9.0 Ms, the number of events decreases rapidly as shown in figure 10 (b), (c) and (d). The locations of the earthquakes are found particularly along the known oceanic and continental plates. Figure 11 shows the details of the three main earthquake/tsunami potential sources: Sumatra, Makran, Carlsberg ridge. Another potential source for tsunami is from Piton de la Fournaise in Reunion Island. Major submarine mass movements on the northern flank of the Reunion Island have been recently discovered. These movements are not dated but not older than 2 Million years and their size may have generated local and even regional tsunamis affecting the whole Indian ocean (Oeler et al. 2004). No modelling of such tsunami source could be produced in our disaster risk profile as ComMIT is not adapted to submarine landslides generated tsunamis modelling. Comoros shallow earthquakes of magnitude 5.2 Ms in 1993 and 2007 should not be neglected as a possible source of tsunami.
27
(a) Ms>6.5 (b) Ms >7.6
(c) Ms>8.5 (d) Ms>9.0 Figure 10: Filtered earthquake magnitudes greater than (a) 6.5Ms (b) 7.6Ms (c) 8.5 Ms and 9.0 Ms up to 30 km deep for the main Indian Ocean. Data source: The Integrated Tsunami
Data Base software (ITDB/PAC, 2006/7)
28
Figure 11: Seismic hazard, largest earthquakes, plate boundaries and tsunami sources from (a) Sunda arc - Sumatra subduction Zone (b) Makran subduction zone (c) Carlsberg transform fault (d) Piton de la Fournaise, La Reunion and (e) Comoros. Source: (USGS)
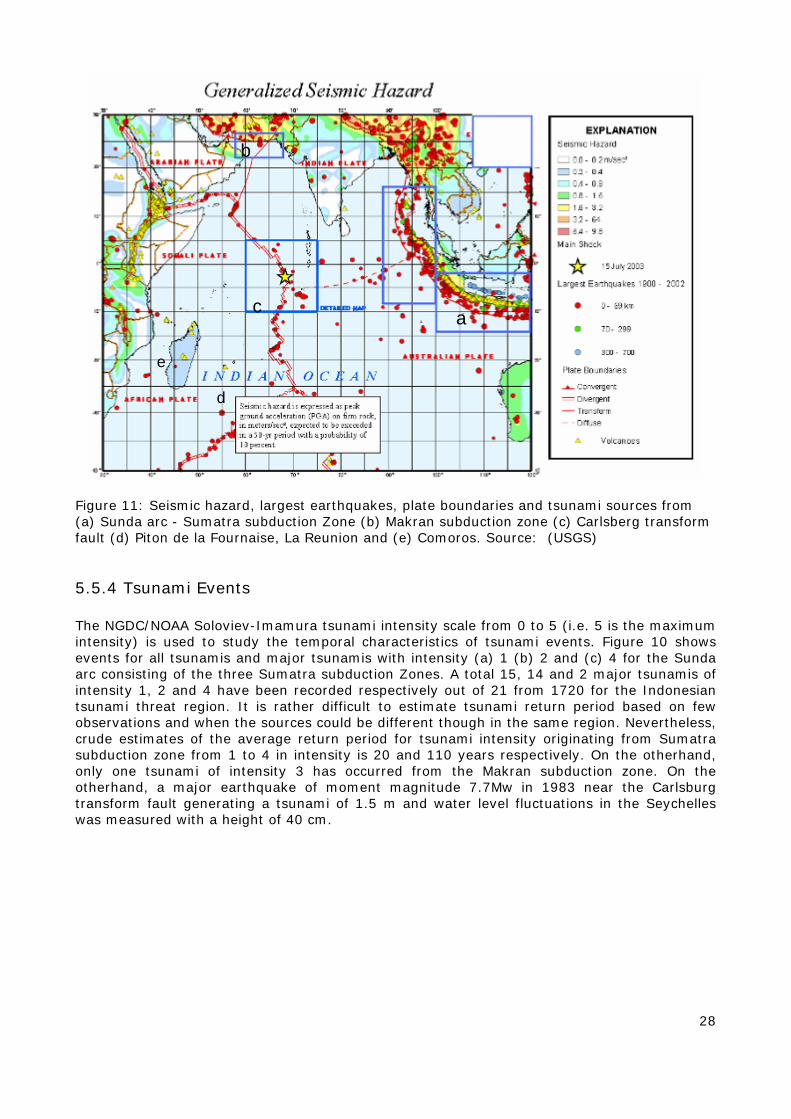
5.5.4 Tsunami Events The NGDC/NOAA Soloviev-Imamura tsunami intensity scale from 0 to 5 (i.e. 5 is the maximum intensity) is used to study the temporal characteristics of tsunami events. Figure 10 shows events for all tsunamis and major tsunamis with intensity (a) 1 (b) 2 and (c) 4 for the Sunda arc consisting of the three Sumatra subduction Zones. A total 15, 14 and 2 major tsunamis of intensity 1, 2 and 4 have been recorded respectively out of 21 from 1720 for the Indonesian tsunami threat region. It is rather difficult to estimate tsunami return period based on few observations and when the sources could be different though in the same region. Nevertheless, crude estimates of the average return period for tsunami intensity originating from Sumatra subduction zone from 1 to 4 in intensity is 20 and 110 years respectively. On the otherhand, only one tsunami of intensity 3 has occurred from the Makran subduction zone. On the otherhand, a major earthquake of moment magnitude 7.7Mw in 1983 near the Carlsburg transform fault generating a tsunami of 1.5 m and water level fluctuations in the Seychelles was measured with a height of 40 cm.
a
b
c
d
e
29
Figure 12: Events for all tsunamis and major tsunamis with intensity (a) 1 (b) 2 and (c) 4 for the Sunda arc consisting of the three Sumatra subduction Zone.
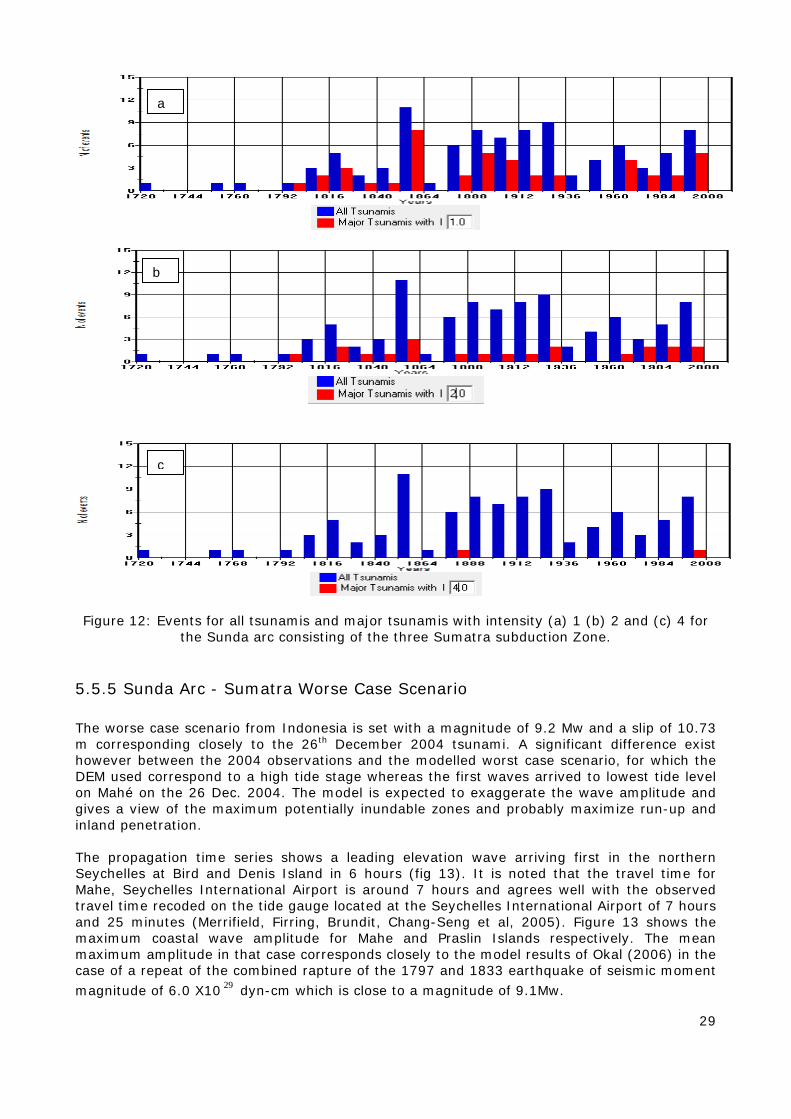
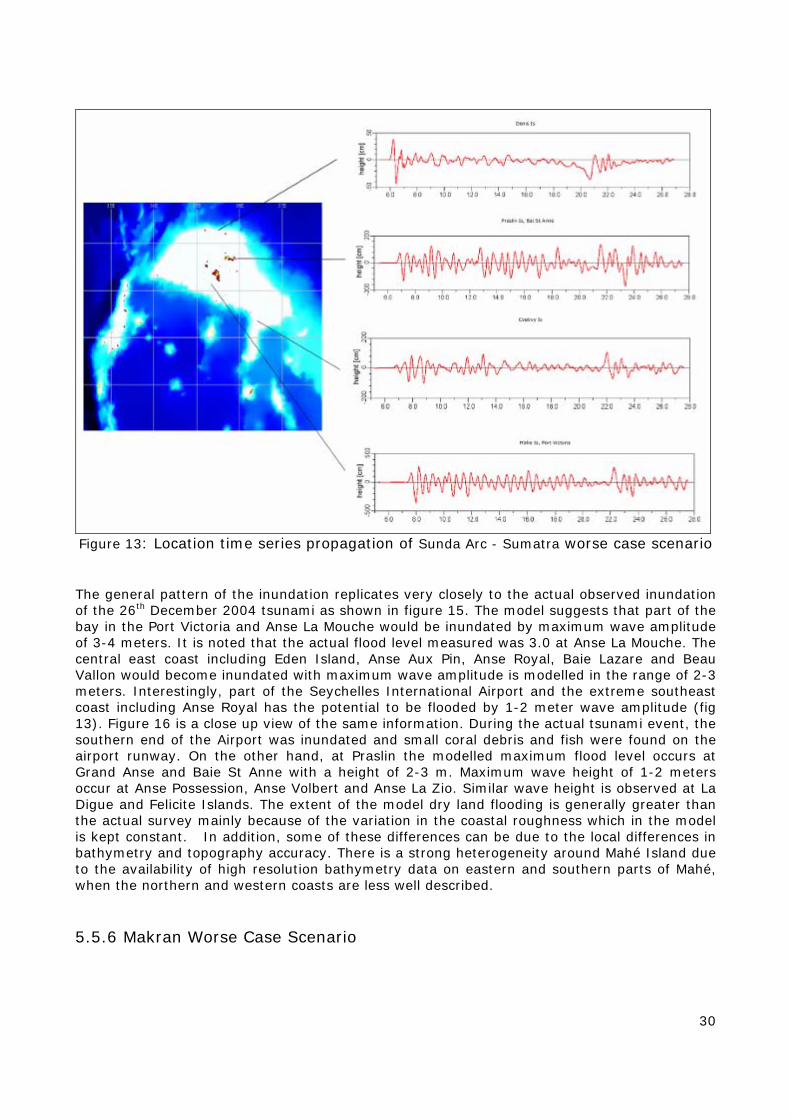
5.5.5 Sunda Arc - Sumatra Worse Case Scenario The worse case scenario from Indonesia is set with a magnitude of 9.2 Mw and a slip of 10.73 m corresponding closely to the 26th December 2004 tsunami. A significant difference exist however between the 2004 observations and the modelled worst case scenario, for which the DEM used correspond to a high tide stage whereas the first waves arrived to lowest tide level on Mahé on the 26 Dec. 2004. The model is expected to exaggerate the wave amplitude and gives a view of the maximum potentially inundable zones and probably maximize run-up and inland penetration. The propagation time series shows a leading elevation wave arriving first in the northern Seychelles at Bird and Denis Island in 6 hours (fig 13). It is noted that the travel time for Mahe, Seychelles International Airport is around 7 hours and agrees well with the observed travel time recoded on the tide gauge located at the Seychelles International Airport of 7 hours and 25 minutes (Merrifield, Firring, Brundit, Chang-Seng et al, 2005). Figure 13 shows the maximum coastal wave amplitude for Mahe and Praslin Islands respectively. The mean maximum amplitude in that case corresponds closely to the model results of Okal (2006) in the case of a repeat of the combined rapture of the 1797 and 1833 earthquake of seismic moment magnitude of 6.0 X10 29 dyn-cm which is close to a magnitude of 9.1Mw.
c
b
a
30
Figure 13: Location time series propagation of Sunda Arc - Sumatra worse case scenario The general pattern of the inundation replicates very closely to the actual observed inundation of the 26th December 2004 tsunami as shown in figure 15. The model suggests that part of the bay in the Port Victoria and Anse La Mouche would be inundated by maximum wave amplitude of 3-4 meters. It is noted that the actual flood level measured was 3.0 at Anse La Mouche. The central east coast including Eden Island, Anse Aux Pin, Anse Royal, Baie Lazare and Beau Vallon would become inundated with maximum wave amplitude is modelled in the range of 2-3 meters. Interestingly, part of the Seychelles International Airport and the extreme southeast coast including Anse Royal has the potential to be flooded by 1-2 meter wave amplitude (fig 13). Figure 16 is a close up view of the same information. During the actual tsunami event, the southern end of the Airport was inundated and small coral debris and fish were found on the airport runway. On the other hand, at Praslin the modelled maximum flood level occurs at Grand Anse and Baie St Anne with a height of 2-3 m. Maximum wave height of 1-2 meters occur at Anse Possession, Anse Volbert and Anse La Zio. Similar wave height is observed at La Digue and Felicite Islands. The extent of the model dry land flooding is generally greater than the actual survey mainly because of the variation in the coastal roughness which in the model is kept constant. In addition, some of these differences can be due to the local differences in bathymetry and topography accuracy. There is a strong heterogeneity around Mahé Island due to the availability of high resolution bathymetry data on eastern and southern parts of Mahé, when the northern and western coasts are less well described.
5.5.6 Makran Worse Case Scenario
31
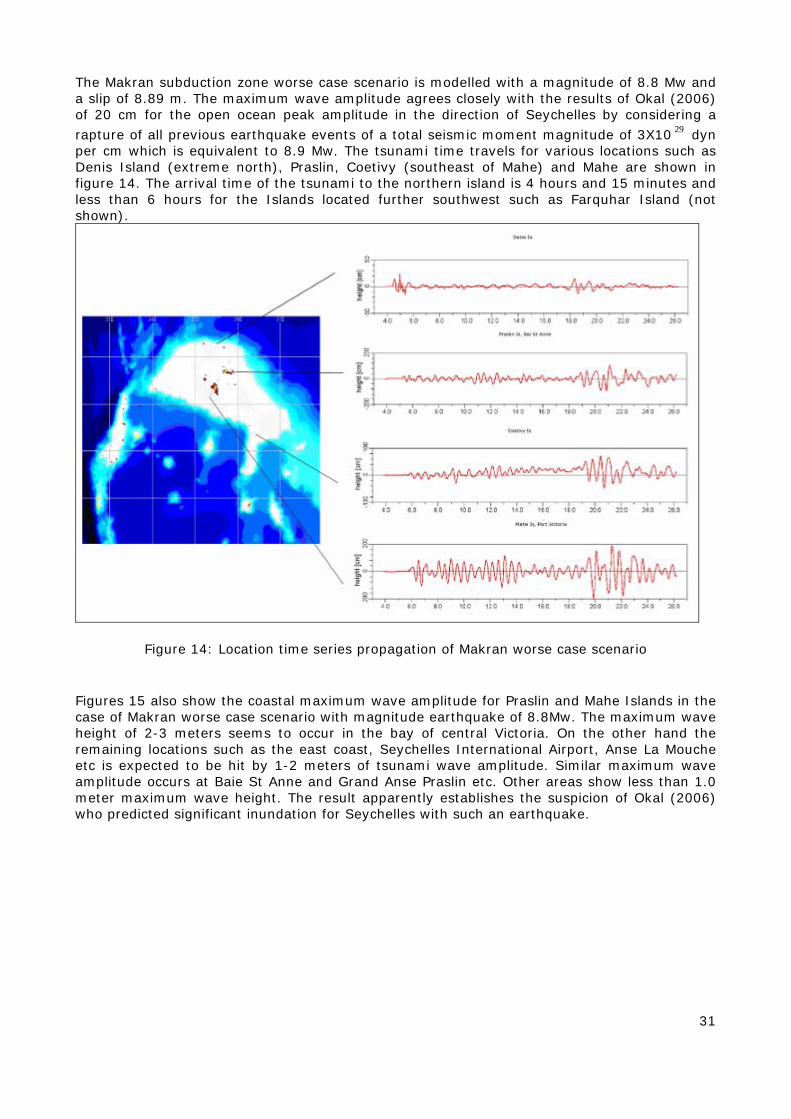
The Makran subduction zone worse case scenario is modelled with a magnitude of 8.8 Mw and a slip of 8.89 m. The maximum wave amplitude agrees closely with the results of Okal (2006) of 20 cm for the open ocean peak amplitude in the direction of Seychelles by considering a rapture of all previous earthquake events of a total seismic moment magnitude of 3X10 29 dyn per cm which is equivalent to 8.9 Mw. The tsunami time travels for various locations such as Denis Island (extreme north), Praslin, Coetivy (southeast of Mahe) and Mahe are shown in figure 14. The arrival time of the tsunami to the northern island is 4 hours and 15 minutes and less than 6 hours for the Islands located further southwest such as Farquhar Island (not shown).
Figure 14: Location time series propagation of Makran worse case scenario Figures 15 also show the coastal maximum wave amplitude for Praslin and Mahe Islands in the case of Makran worse case scenario with magnitude earthquake of 8.8Mw. The maximum wave height of 2-3 meters seems to occur in the bay of central Victoria. On the other hand the remaining locations such as the east coast, Seychelles International Airport, Anse La Mouche etc is expected to be hit by 1-2 meters of tsunami wave amplitude. Similar maximum wave amplitude occurs at Baie St Anne and Grand Anse Praslin etc. Other areas show less than 1.0 meter maximum wave height. The result apparently establishes the suspicion of Okal (2006) who predicted significant inundation for Seychelles with such an earthquake.
32
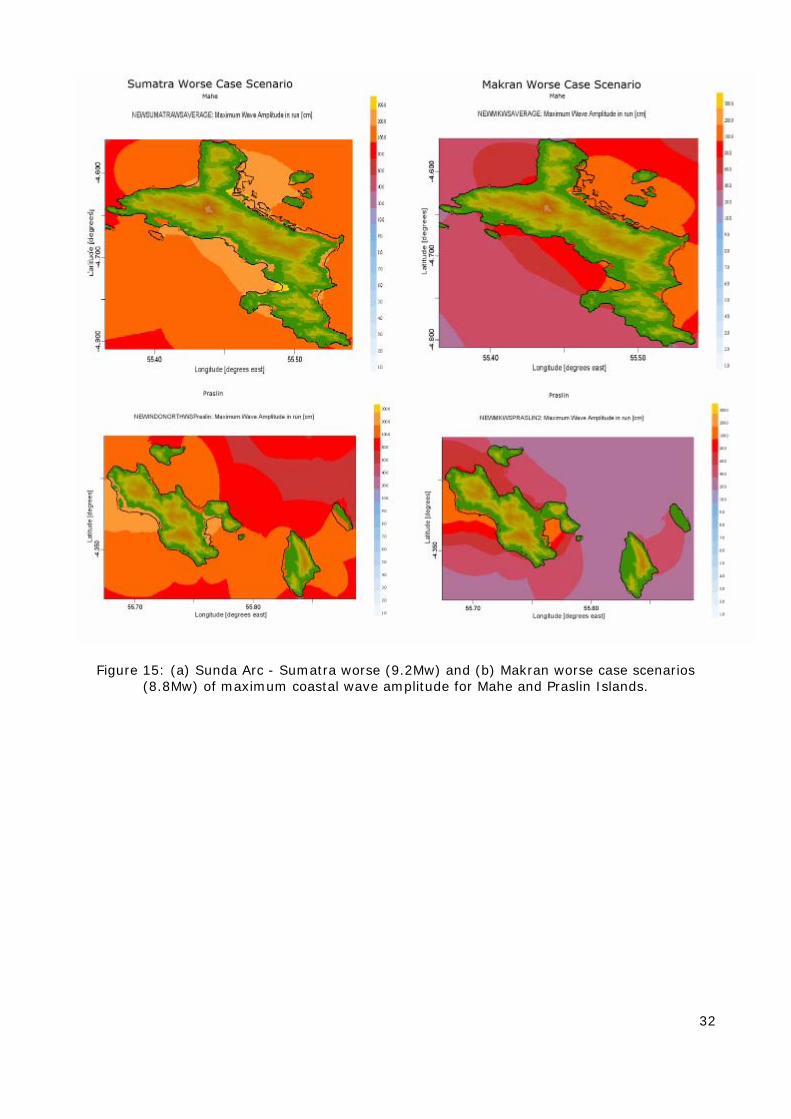
Figure 15: (a) Sunda Arc - Sumatra worse (9.2Mw) and (b) Makran worse case scenarios (8.8Mw) of maximum coastal wave amplitude for Mahe and Praslin Islands.
33
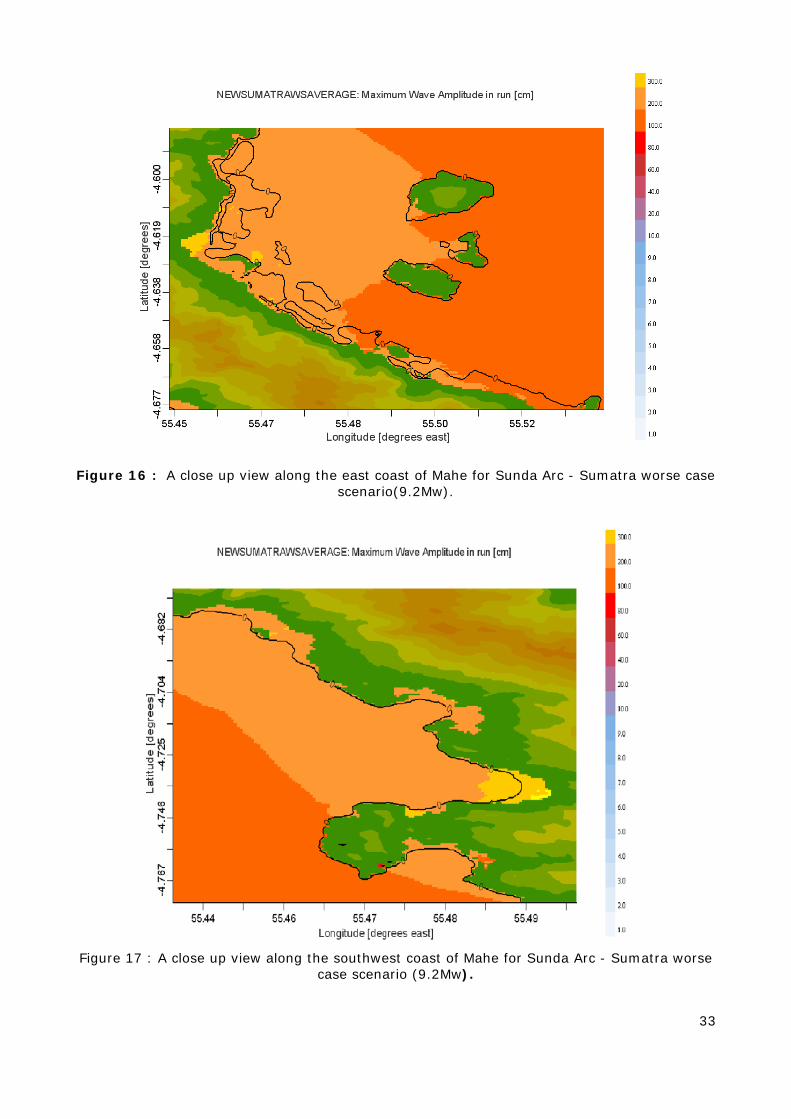
Figure 16 : A close up view along the east coast of Mahe for Sunda Arc - Sumatra worse case scenario(9.2Mw).
Figure 17 : A close up view along the southwest coast of Mahe for Sunda Arc - Sumatra worse
case scenario (9.2Mw).
34
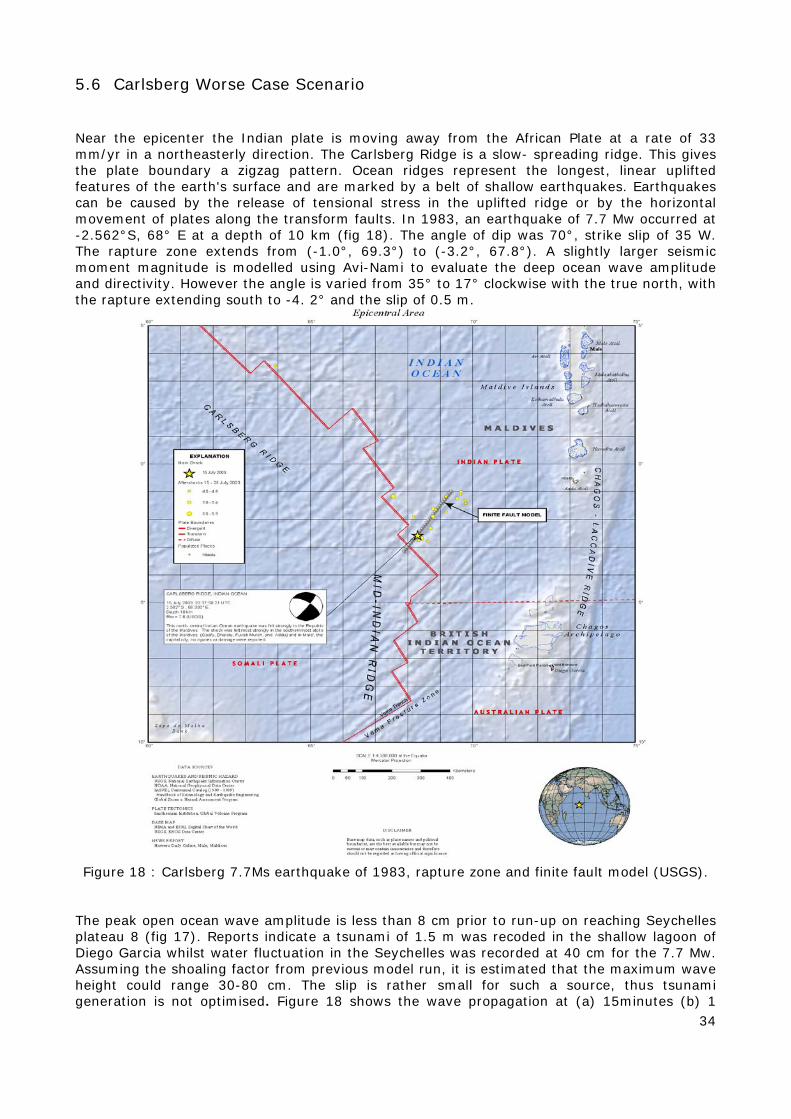
5.6 Carlsberg Worse Case Scenario Near the epicenter the Indian plate is moving away from the African Plate at a rate of 33 mm/yr in a northeasterly direction. The Carlsberg Ridge is a slow- spreading ridge. This gives the plate boundary a zigzag pattern. Ocean ridges represent the longest, linear uplifted features of the earth's surface and are marked by a belt of shallow earthquakes. Earthquakes can be caused by the release of tensional stress in the uplifted ridge or by the horizontal movement of plates along the transform faults. In 1983, an earthquake of 7.7 Mw occurred at -2.562°S, 68° E at a depth of 10 km (fig 18). The angle of dip was 70°, strike slip of 35 W. The rapture zone extends from (-1.0°, 69.3°) to (-3.2°, 67.8°). A slightly larger seismic moment magnitude is modelled using Avi-Nami to evaluate the deep ocean wave amplitude and directivity. However the angle is varied from 35° to 17° clockwise with the true north, with the rapture extending south to -4. 2° and the slip of 0.5 m.
Figure 18 : Carlsberg 7.7Ms earthquake of 1983, rapture zone and finite fault model (USGS).
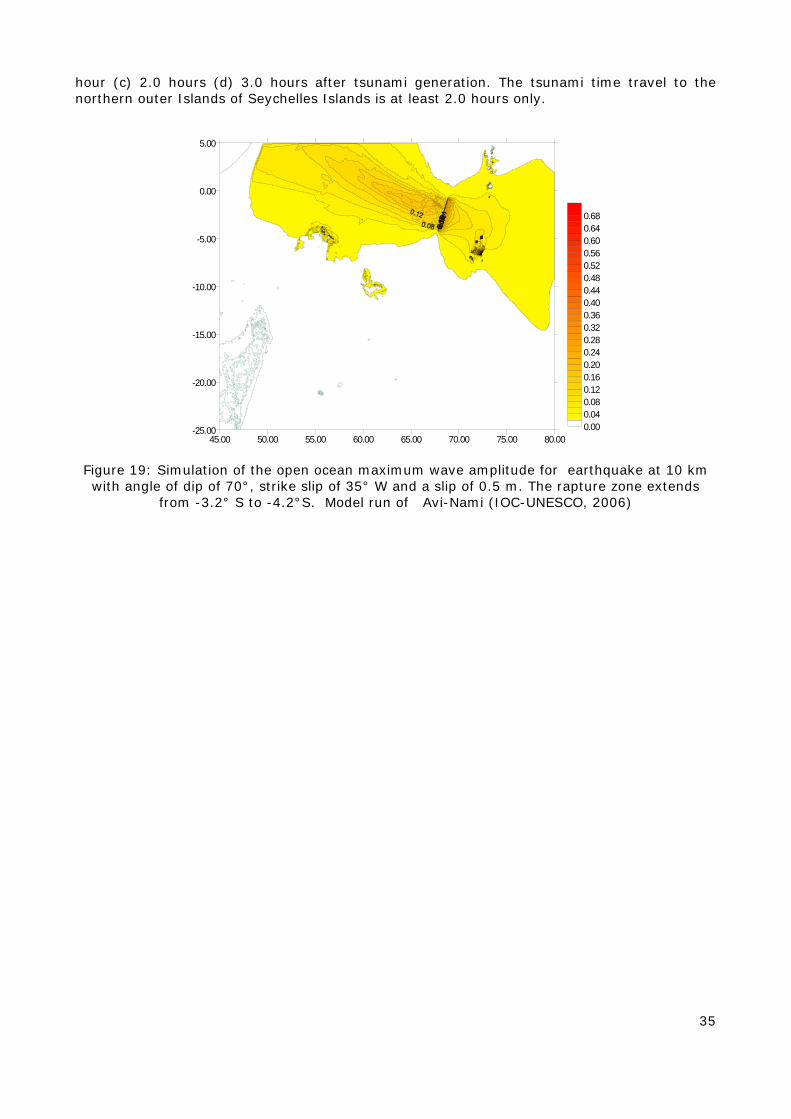
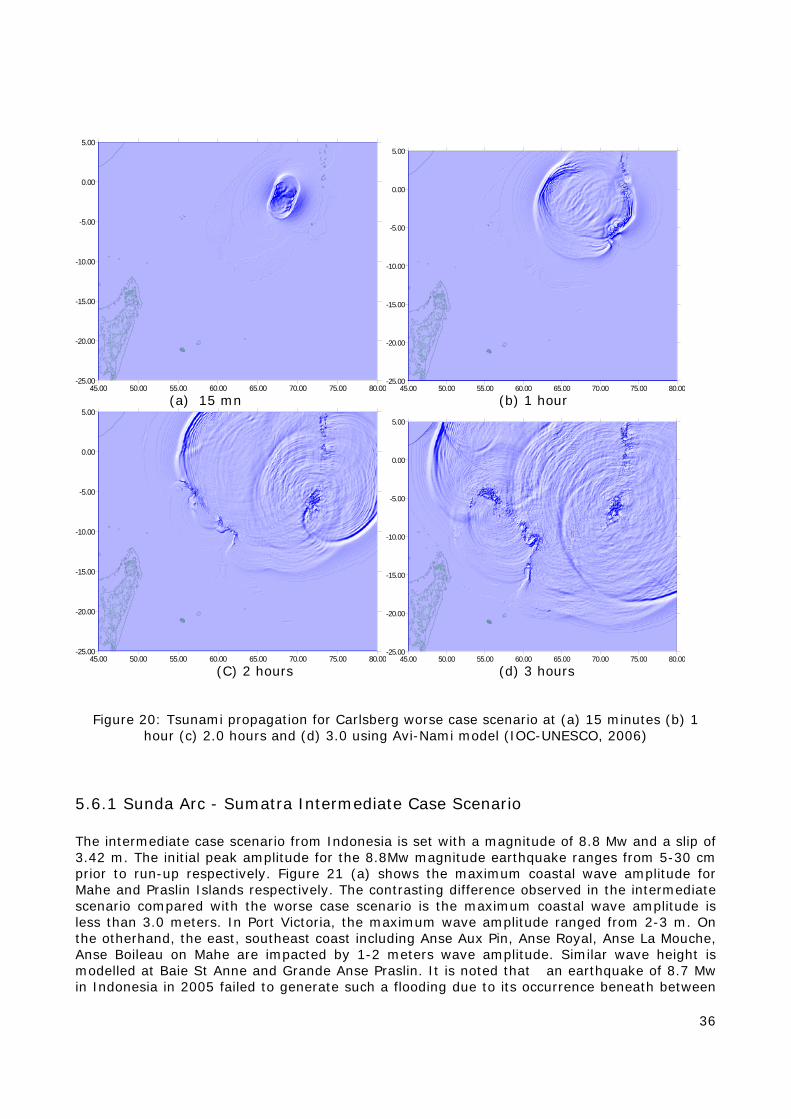
The peak open ocean wave amplitude is less than 8 cm prior to run-up on reaching Seychelles plateau 8 (fig 17). Reports indicate a tsunami of 1.5 m was recoded in the shallow lagoon of Diego Garcia whilst water fluctuation in the Seychelles was recorded at 40 cm for the 7.7 Mw. Assuming the shoaling factor from previous model run, it is estimated that the maximum wave height could range 30-80 cm. The slip is rather small for such a source, thus tsunami generation is not optimised. Figure 18 shows the wave propagation at (a) 15minutes (b) 1
35
hour (c) 2.0 hours (d) 3.0 hours after tsunami generation. The tsunami time travel to the northern outer Islands of Seychelles Islands is at least 2.0 hours only.
45.00 50.00 55.00 60.00 65.00 70.00 75.00 80.00-25.00
-20.00
-15.00
-10.00
-5.00
0.00
5.00
0.000.040.080.120.160.200.240.280.320.360.400.440.480.520.560.600.640.68
Figure 19: Simulation of the open ocean maximum wave amplitude for earthquake at 10 km with angle of dip of 70°, strike slip of 35° W and a slip of 0.5 m. The rapture zone extends
from -3.2° S to -4.2°S. Model run of Avi-Nami (IOC-UNESCO, 2006)
Mahe
36
45.00 50.00 55.00 60.00 65.00 70.00 75.00 80.00-25.00
-20.00
-15.00
-10.00
-5.00
0.00
5.00
45.00 50.00 55.00 60.00 65.00 70.00 75.00 80.00-25.00
-20.00
-15.00
-10.00
-5.00
0.00
5.00
(a) 15 mn (b) 1 hour
45.00 50.00 55.00 60.00 65.00 70.00 75.00 80.00-25.00
-20.00
-15.00
-10.00
-5.00
0.00
5.00
45.00 50.00 55.00 60.00 65.00 70.00 75.00 80.00-25.00
-20.00
-15.00
-10.00
-5.00
0.00
5.00
(C) 2 hours (d) 3 hours
Figure 20: Tsunami propagation for Carlsberg worse case scenario at (a) 15 minutes (b) 1 hour (c) 2.0 hours and (d) 3.0 using Avi-Nami model (IOC-UNESCO, 2006)
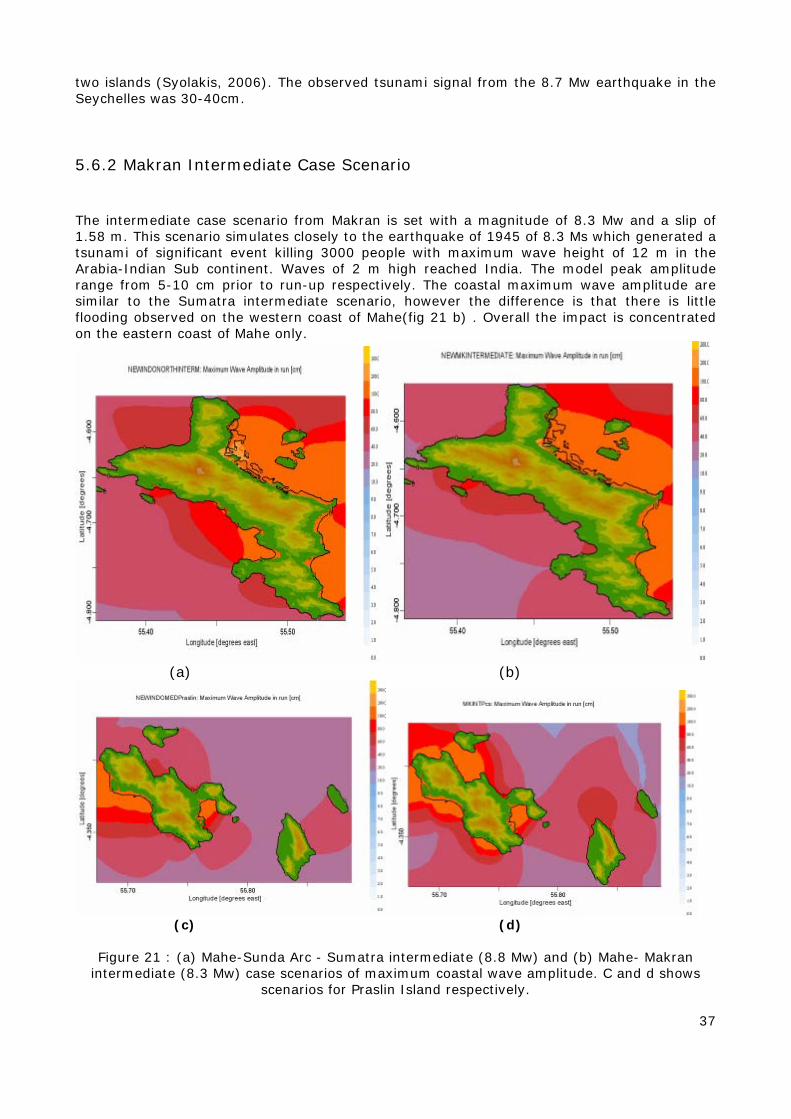
5.6.1 Sunda Arc - Sumatra Intermediate Case Scenario The intermediate case scenario from Indonesia is set with a magnitude of 8.8 Mw and a slip of 3.42 m. The initial peak amplitude for the 8.8Mw magnitude earthquake ranges from 5-30 cm prior to run-up respectively. Figure 21 (a) shows the maximum coastal wave amplitude for Mahe and Praslin Islands respectively. The contrasting difference observed in the intermediate scenario compared with the worse case scenario is the maximum coastal wave amplitude is less than 3.0 meters. In Port Victoria, the maximum wave amplitude ranged from 2-3 m. On the otherhand, the east, southeast coast including Anse Aux Pin, Anse Royal, Anse La Mouche, Anse Boileau on Mahe are impacted by 1-2 meters wave amplitude. Similar wave height is modelled at Baie St Anne and Grande Anse Praslin. It is noted that an earthquake of 8.7 Mw in Indonesia in 2005 failed to generate such a flooding due to its occurrence beneath between
37
two islands (Syolakis, 2006). The observed tsunami signal from the 8.7 Mw earthquake in the Seychelles was 30-40cm.
5.6.2 Makran Intermediate Case Scenario The intermediate case scenario from Makran is set with a magnitude of 8.3 Mw and a slip of 1.58 m. This scenario simulates closely to the earthquake of 1945 of 8.3 Ms which generated a tsunami of significant event killing 3000 people with maximum wave height of 12 m in the Arabia-Indian Sub continent. Waves of 2 m high reached India. The model peak amplitude range from 5-10 cm prior to run-up respectively. The coastal maximum wave amplitude are similar to the Sumatra intermediate scenario, however the difference is that there is little flooding observed on the western coast of Mahe(fig 21 b) . Overall the impact is concentrated on the eastern coast of Mahe only.
(a) (b)
(c) (d)
Figure 21 : (a) Mahe-Sunda Arc - Sumatra intermediate (8.8 Mw) and (b) Mahe- Makran
intermediate (8.3 Mw) case scenarios of maximum coastal wave amplitude. C and d shows scenarios for Praslin Island respectively.
38
5.6.3 Carlsberg Intermediate Case Scenario The intermediate scenario is the same as the worse case scenario, however the angle clockwise with the true north is set at 35°.The result shows that the maximum wave amplitude is directed towards north Africa and southeast Indian ocean when the rapture is oriented at 35° but directed closer to the Seychelles for half the strike slip at 17° in the case of the worse case scenario (Fig 17). The angle of the rapture relative to the true north is critical in determining the peak wave amplitude directed towards the Seychelles. The maximum wave amplitude is around 4 cm. The maximum coastal wave is likely to be 0.4m.
5.6.4 Sunda Arc - Sumatra Best Case Scenario The best case scenario is modelled with a magnitude of 8.3 Mw characterised with a slip of 0.79 m. The model results shows peak open ocean wave amplitude of less than 10 cm prior to run –up and there is less inundation , however the east and southeast coast can be affected by maximum wave amplitude not exceeding 1-2 m . Figures are not included for best case scenarios.
5.6.5 Makran Best Case Scenario The best case scenario is modelled with a magnitude of 7.5 Mw with a slip of 0.79 m. The peak wave amplitude prior to run-up is less than 10 cm. There is also very little to no inundation for the main islands.
5.6.6 Carlsberg Best Case Scenario It is expected that earthquakes of less than 7.7 Mw is unlikely to cause inundation in the Seychelles. Water level fluctuations are expected especially in the bays.
5.6.7 Piton de la Fournaise and Comoros Island Earthquakes and Volcanic Activity
Improved submarine imaging have revealed giant debris avalanche and slumps around the flanks of ocean volcanoes such as those of Hawai (Fornari & Campbell 1987; Moore et al, 1994; Garcia 1996), Reunion Island (Lenat et al, 1989; Labazuy 1996). Piton de la Fournaise is located in Reunion Island and is a basaltic oceanic intra-plate hot-spot volcano. Its activity started more than 0.5 Ma before present, reaching an height of 7 km above the sea bottom. It experienced 3 collapses, the last of which developed 5 ka before present. The concentration of recent pyroclastic cones evidences 3 rifts, 2 of which tend to curve towards the depression of the most recent lateral collapse. As on Etna and Stromboli, the eruptions take place in correspondence with summit craters and rift zones. Moreover, there are also active transcurrent displacements on the flanks of the lateral collapse depression. Present studies on Piton essentially regard present-historical activity, with many structural, volcanological and geophysical data, while the stratigraphy of the cone is scarcely detailed and no studies on possible changes in the pre- and post-collapse behaviour were published. An eruption on the eastern flank of Piton de la Fournaise volcano started on 16 November, 2002 after 10 months of quiescence. Destabilisation can take thousand to tens thousand years, it become susceptible to failure and where water plays a role in destabilising and mechanical failure and determine the type of avalanche. The consequence of such a failure can be both dramatic and catastrophically destructive. Such similar scenarios will eventually occur and provisions need to
39
be made for mitigating its effects (McGuire, 2003). The lateral collapse could be favourable to volcanogenic tsunamis. Some 5 % of all tsunamis are volcanogenic and at least one fifth of these results from volcanic landsides (Smith & Shepherd 1996) when 0.5 km 3 debris avalanche entered the sea to create typical 9 m high tsunami (Belousove 1994). However, it is now well established that such landslide generated tsunamis may be catastrophic for a limited range due to lack of far field directivity (Okal, 2006) compared to earthquake generated tsunamis which can travel long distances without little loss of energy. Therefore, predicting such complex lateral collapse and slide generated tsunami is certainly beyond the scope of this work and is equally at the forefront of current tsunami research. Nevertheless, a crude estimate of the travel time is about 2.5 hours. The largest earthquake recorded in the Comoros Islands is 5.2 Mw at a depth of 10 km in 1993 and very recently in 2007 at -12.78 S, 44.77 E and -12.18 S, 46.48 E respectively. At this point it is very unlikely that a tsunami of far field characteristic will be generated due to lack of earthquake-tsunami generation mechanisms.
5.6.8 Consolidated Tsunami Scenarios and Maximum Wave Amplitude Hazard
Table 4 summarises the tsunami scenarios for the tsunami hazard sources. The integrated tsunami hazard scenarios can be illustrated by simply considering the envelope of all the case scenarios as shown in figure 22 and 23 for Mahe and Praslin respectively. All other scenarios tend to envelop within this distribution and intensity.
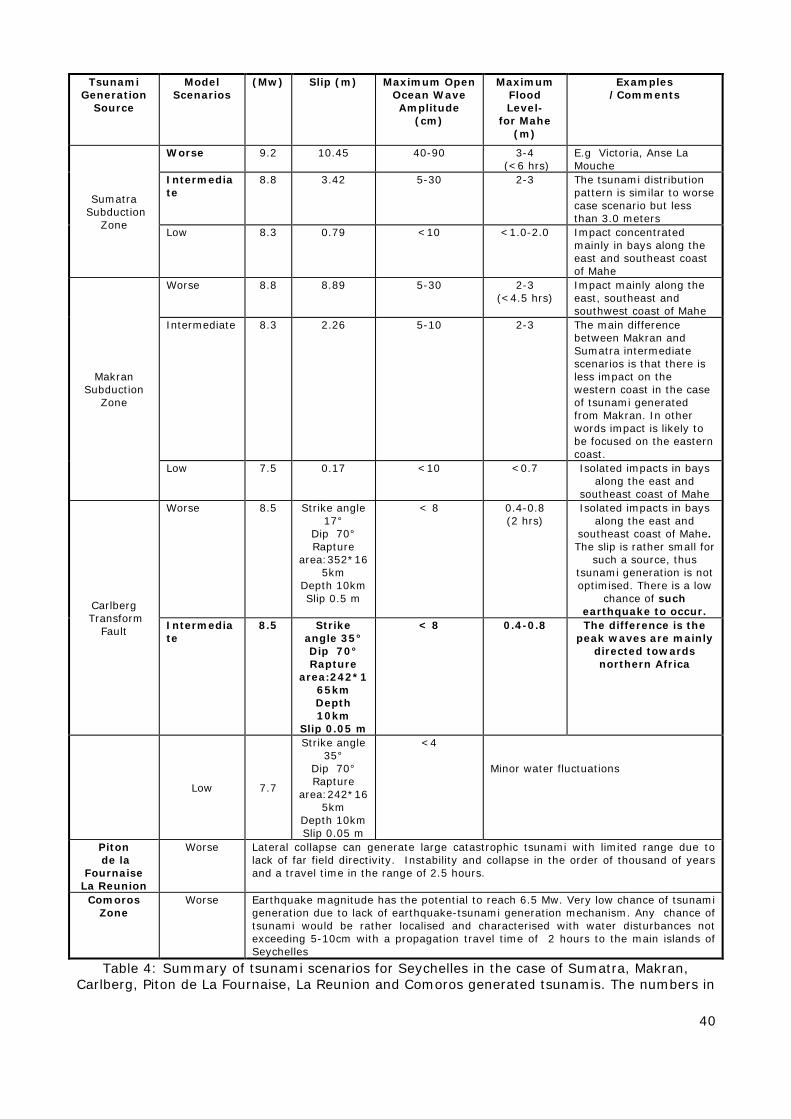
40
Table 4: Summary of tsunami scenarios for Seychelles in the case of Sumatra, Makran, Carlberg, Piton de La Fournaise, La Reunion and Comoros generated tsunamis. The numbers in
Tsunami Generation
Source
Model Scenarios
(Mw) Slip (m)
Maximum Open Ocean Wave Amplitude
(cm)
Maximum Flood Level-
for Mahe (m)
Examples /Comments
Sumatra Subduction
Zone
Worse 9.2 10.45 40-90 3-4 (<6 hrs)
E.g Victoria, Anse La Mouche
Intermediate
8.8 3.42 5-30 2-3 The tsunami distribution pattern is similar to worse case scenario but less than 3.0 meters
Low 8.3 0.79 <10 <1.0-2.0 Impact concentrated mainly in bays along the east and southeast coast of Mahe
Makran Subduction
Zone
Worse 8.8 8.89 5-30 2-3 (<4.5 hrs)
Impact mainly along the east, southeast and southwest coast of Mahe
Intermediate 8.3 2.26 5-10 2-3 The main difference between Makran and Sumatra intermediate scenarios is that there is less impact on the western coast in the case of tsunami generated from Makran. In other words impact is likely to be focused on the eastern coast.
Low 7.5 0.17 <10 <0.7 Isolated impacts in bays along the east and
southeast coast of Mahe
Carlberg Transform
Fault
Worse 8.5 Strike angle 17°
Dip 70° Rapture
area:352*165km
Depth 10km Slip 0.5 m
< 8 0.4-0.8 (2 hrs)
Isolated impacts in bays along the east and
southeast coast of Mahe. The slip is rather small for
such a source, thus tsunami generation is not optimised. There is a low
chance of such earthquake to occur.
Intermediate
8.5 Strike angle 35° Dip 70° Rapture
area:242*165km Depth 10km
Slip 0.05 m
< 8 0.4-0.8
The difference is the peak waves are mainly
directed towards northern Africa
Low 7.7
Strike angle 35°
Dip 70° Rapture
area:242*165km
Depth 10km Slip 0.05 m
<4 Minor water fluctuations
Piton de la
Fournaise La Reunion
Worse Lateral collapse can generate large catastrophic tsunami with limited range due to lack of far field directivity. Instability and collapse in the order of thousand of years and a travel time in the range of 2.5 hours.
Comoros Zone
Worse Earthquake magnitude has the potential to reach 6.5 Mw. Very low chance of tsunami generation due to lack of earthquake-tsunami generation mechanism. Any chance of tsunami would be rather localised and characterised with water disturbances not exceeding 5-10cm with a propagation travel time of 2 hours to the main islands of Seychelles
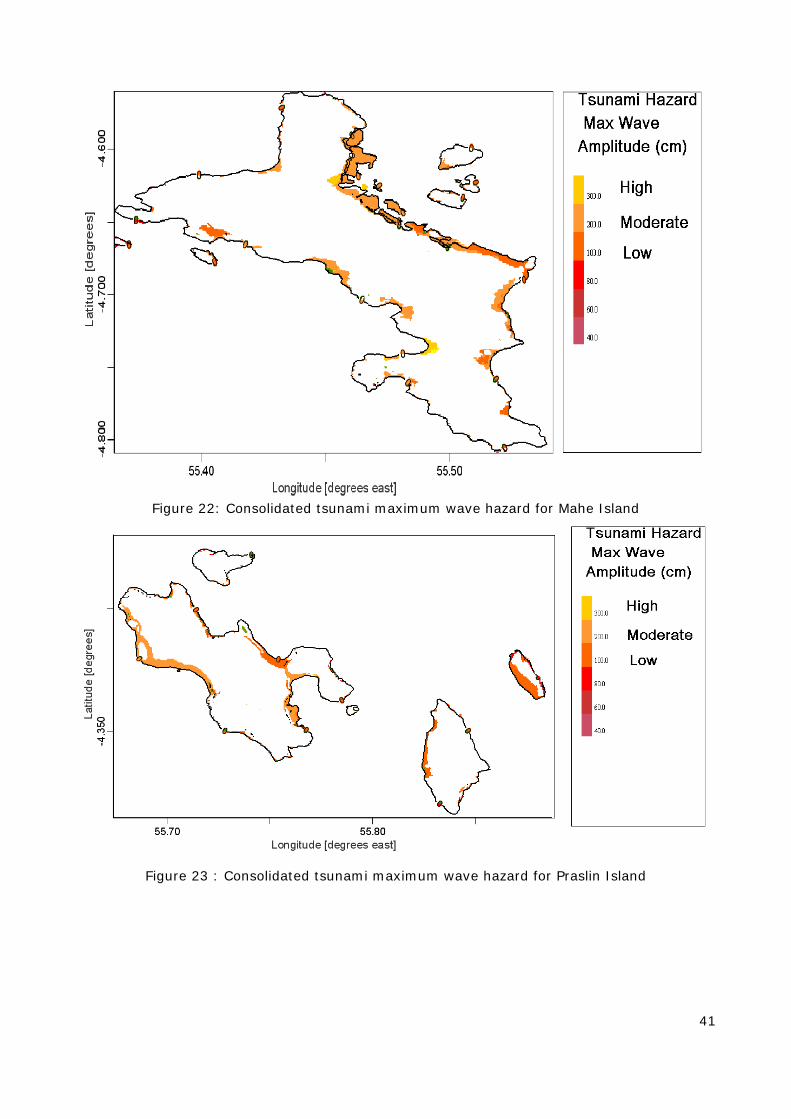
41
Figure 22: Consolidated tsunami maximum wave hazard for Mahe Island
Figure 23 : Consolidated tsunami maximum wave hazard for Praslin Island

42
5.7 Conclusion on Tsunami hazard modelling. The preceding results show that the main threat comes from the Indonesia subduction zone and potentially also from the Makran subduction zone. As it was observed during the 2004 Indian Ocean tsunami in Sri Lanka, La Réunion and other islands, the wrapping of waves around the island can generate higher waves on the western sides of the Islands of Seychelles. This was confirmed by field observations in 2004 on Mahé (Jackson et al. 2005). There are still uncertainties concerning the results of the ComMIT tool with the Makran source as waves seem to be exaggeratedly high and a second modelling too should be used for confirmation. Further studies for the Makran hypothesis have to be done as results based on other grids with the same model produced significantly lower impact on the Seychelles. The modelling exercise revealed also that inundation by a major tsunami similar to the Dec. 2004, but with highest waves hitting Mahé at usual high tide instead of low tide would probably flood most of the lowlands and reclaimed areas along the Eastern coast of Mahé. Evidence is shown that there is a dangerous concentration of nearly all the strategic facilities of Mahé (and Seychelles) in lowlands exposed to tsunami flooding. Back up or reserve sites both for storage and for production of energy should be considered to reduce the vulnerability of the industrial and activities reclaimed areas south of Victoria. It can be noticed also that huge housing development programmes are ongoing on reclaimed areas north of Victoria and these areas are in the same situation of high exposure to tsunami flooding in case of major event.
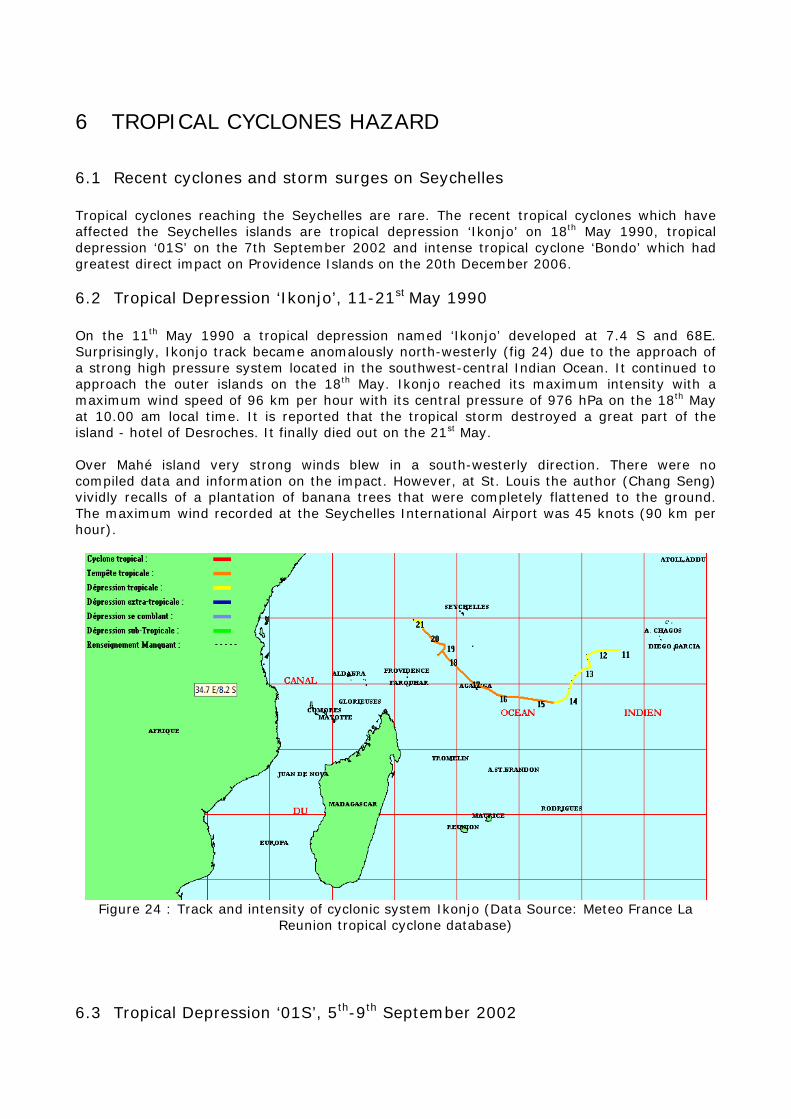
6 TROPICAL CYCLONES HAZARD
6.1 Recent cyclones and storm surges on Seychelles Tropical cyclones reaching the Seychelles are rare. The recent tropical cyclones which have affected the Seychelles islands are tropical depression ‘Ikonjo’ on 18th May 1990, tropical depression ‘01S’ on the 7th September 2002 and intense tropical cyclone ‘Bondo’ which had greatest direct impact on Providence Islands on the 20th December 2006.
6.2 Tropical Depression ‘Ikonjo’, 11-21st May 1990 On the 11th May 1990 a tropical depression named ‘Ikonjo’ developed at 7.4 S and 68E. Surprisingly, Ikonjo track became anomalously north-westerly (fig 24) due to the approach of a strong high pressure system located in the southwest-central Indian Ocean. It continued to approach the outer islands on the 18th May. Ikonjo reached its maximum intensity with a maximum wind speed of 96 km per hour with its central pressure of 976 hPa on the 18th May at 10.00 am local time. It is reported that the tropical storm destroyed a great part of the island - hotel of Desroches. It finally died out on the 21st May. Over Mahé island very strong winds blew in a south-westerly direction. There were no compiled data and information on the impact. However, at St. Louis the author (Chang Seng) vividly recalls of a plantation of banana trees that were completely flattened to the ground. The maximum wind recorded at the Seychelles International Airport was 45 knots (90 km per hour).
Figure 24 : Track and intensity of cyclonic system Ikonjo (Data Source: Meteo France La
Reunion tropical cyclone database)
6.3 Tropical Depression ‘01S’, 5th-9th September 2002
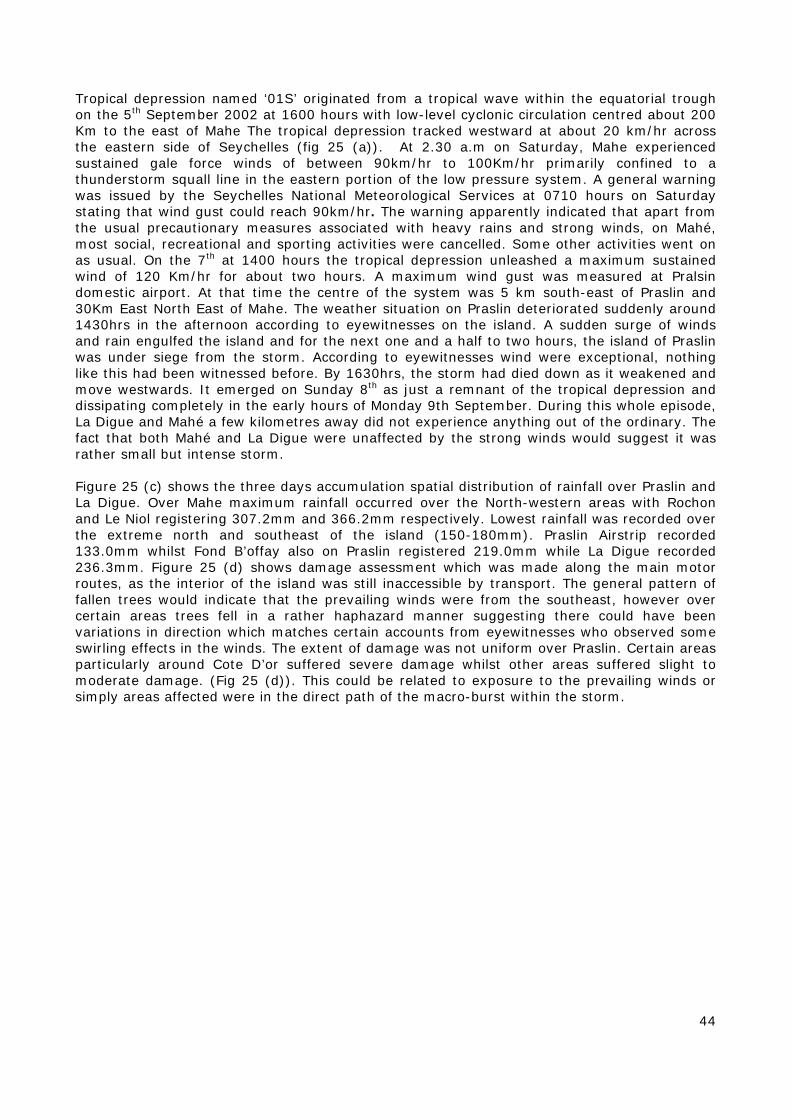
44
Tropical depression named ‘01S’ originated from a tropical wave within the equatorial trough on the 5th September 2002 at 1600 hours with low-level cyclonic circulation centred about 200 Km to the east of Mahe The tropical depression tracked westward at about 20 km/hr across the eastern side of Seychelles (fig 25 (a)). At 2.30 a.m on Saturday, Mahe experienced sustained gale force winds of between 90km/hr to 100Km/hr primarily confined to a thunderstorm squall line in the eastern portion of the low pressure system. A general warning was issued by the Seychelles National Meteorological Services at 0710 hours on Saturday stating that wind gust could reach 90km/hr. The warning apparently indicated that apart from the usual precautionary measures associated with heavy rains and strong winds, on Mahé, most social, recreational and sporting activities were cancelled. Some other activities went on as usual. On the 7th at 1400 hours the tropical depression unleashed a maximum sustained wind of 120 Km/hr for about two hours. A maximum wind gust was measured at Pralsin domestic airport. At that time the centre of the system was 5 km south-east of Praslin and 30Km East North East of Mahe. The weather situation on Praslin deteriorated suddenly around 1430hrs in the afternoon according to eyewitnesses on the island. A sudden surge of winds and rain engulfed the island and for the next one and a half to two hours, the island of Praslin was under siege from the storm. According to eyewitnesses wind were exceptional, nothing like this had been witnessed before. By 1630hrs, the storm had died down as it weakened and move westwards. It emerged on Sunday 8th as just a remnant of the tropical depression and dissipating completely in the early hours of Monday 9th September. During this whole episode, La Digue and Mahé a few kilometres away did not experience anything out of the ordinary. The fact that both Mahé and La Digue were unaffected by the strong winds would suggest it was rather small but intense storm. Figure 25 (c) shows the three days accumulation spatial distribution of rainfall over Praslin and La Digue. Over Mahe maximum rainfall occurred over the North-western areas with Rochon and Le Niol registering 307.2mm and 366.2mm respectively. Lowest rainfall was recorded over the extreme north and southeast of the island (150-180mm). Praslin Airstrip recorded 133.0mm whilst Fond B’offay also on Praslin registered 219.0mm while La Digue recorded 236.3mm. Figure 25 (d) shows damage assessment which was made along the main motor routes, as the interior of the island was still inaccessible by transport. The general pattern of fallen trees would indicate that the prevailing winds were from the southeast, however over certain areas trees fell in a rather haphazard manner suggesting there could have been variations in direction which matches certain accounts from eyewitnesses who observed some swirling effects in the winds. The extent of damage was not uniform over Praslin. Certain areas particularly around Cote D’or suffered severe damage whilst other areas suffered slight to moderate damage. (Fig 25 (d)). This could be related to exposure to the prevailing winds or simply areas affected were in the direct path of the macro-burst within the storm.
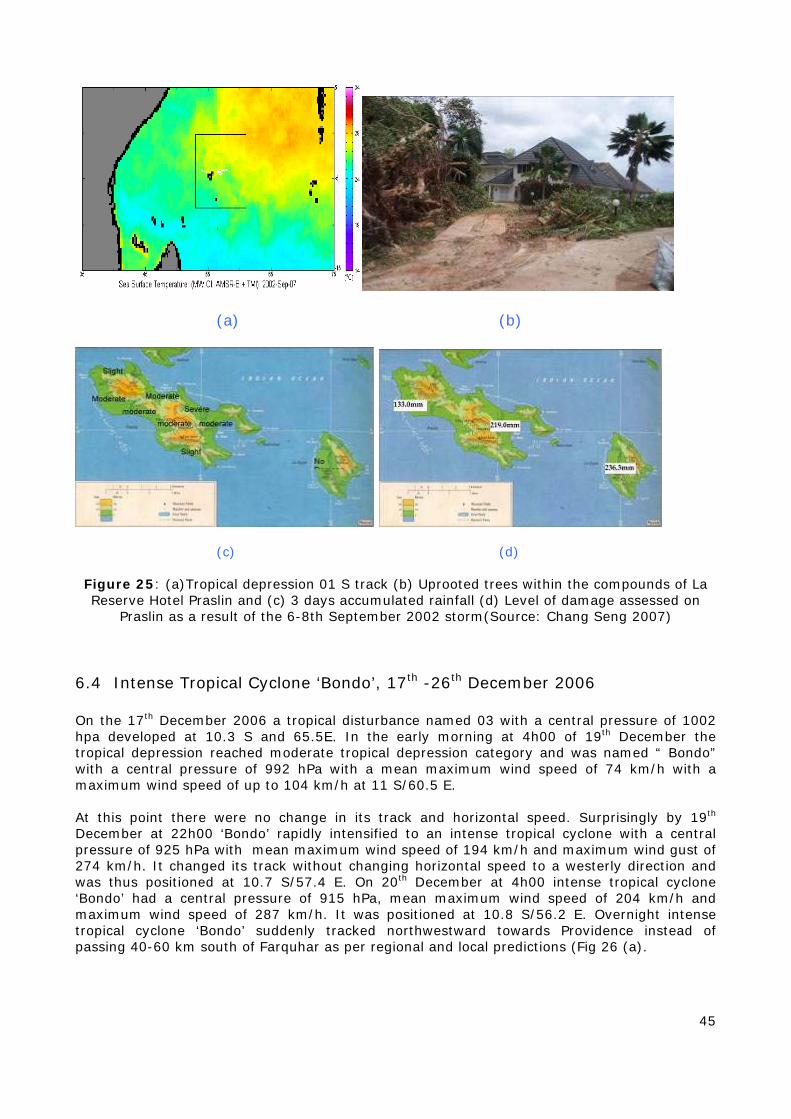
45
(a) (b)
(c) (d) Figure 25: (a)Tropical depression 01 S track (b) Uprooted trees within the compounds of La Reserve Hotel Praslin and (c) 3 days accumulated rainfall (d) Level of damage assessed on
Praslin as a result of the 6-8th September 2002 storm(Source: Chang Seng 2007)
6.4 Intense Tropical Cyclone ‘Bondo’, 17th -26th December 2006 On the 17th December 2006 a tropical disturbance named 03 with a central pressure of 1002 hpa developed at 10.3 S and 65.5E. In the early morning at 4h00 of 19th December the tropical depression reached moderate tropical depression category and was named “ Bondo” with a central pressure of 992 hPa with a mean maximum wind speed of 74 km/h with a maximum wind speed of up to 104 km/h at 11 S/60.5 E. At this point there were no change in its track and horizontal speed. Surprisingly by 19th December at 22h00 ‘Bondo’ rapidly intensified to an intense tropical cyclone with a central pressure of 925 hPa with mean maximum wind speed of 194 km/h and maximum wind gust of 274 km/h. It changed its track without changing horizontal speed to a westerly direction and was thus positioned at 10.7 S/57.4 E. On 20th December at 4h00 intense tropical cyclone ‘Bondo’ had a central pressure of 915 hPa, mean maximum wind speed of 204 km/h and maximum wind speed of 287 km/h. It was positioned at 10.8 S/56.2 E. Overnight intense tropical cyclone ‘Bondo’ suddenly tracked northwestward towards Providence instead of passing 40-60 km south of Farquhar as per regional and local predictions (Fig 26 (a).
(a)
46
Overall, cyclone ‘Bondo” becomes the first intense tropical cyclone in recent history to make direct and full impact on the outer islands of Providence and Farquhar islands (Fig 26 a, b and c). On the 21st December, it started to move away from Providence and was positioned at 9.7/52.2 E moving now WNW with a mean wind speed of 167 km/h and maximum of 235 km/h. By 10h00 its mean maximum wind speed was 176 km/h, and maximum of 248 km/h. It started to slow down to 34 km/h and further decelerated to 26 km/h at 16h00. At 22h00 it was downgraded to tropical cyclone strength with a central pressure of 955 hPa, mean maximum wind speed of 148 km/h and maximum of 209 km/h. At this point it started recurve to take a SW direction. On Monday 25th December, at 22h00 it made landfall over Northeast Madagascar at 16.3S/46.2 E. It then moved SSW and on the 26th December at 16h00, Bondo became a tropical disturbance. Intense tropical cyclone ‘Bondo’ also caused moderate rainfall and strong surges in wind extending up to the inner islands such as Mahe, Praslin and La Digue. Intense tropical cyclone ‘Bondo’ also caused rough seas. It also generated sea swells with height 0.5 to 3.0 m which approached Mahe and the inner islands from southeast, southwest and northwest. These cyclone generated swells combined with locally generated wind waves plus a maximum high tide of 1.8 meters caused some coastal inundation, damages and beach erosion. The high wave impact was officially reported and documented around south, southwest and northwest of Mahe between the 22nd to 24th December 2006. Evacuation by Island Development Company (IDC) of workers were carried out during the night of 20th December on Farqhuar Island, unfortunately no evacuation was carried out Providence Island were the 8 workers had no possibility to evacuate or shelter but to hide in a concrete water tank which was completely drained out. The three main reasons for no evacuation on Providence Island were argued in terms of (1) not enough time to carry out the evacuation as a result of unexpected cyclone trajectory (2) lack of proper response and communication throughout the government and IDC administrative levels (3) extreme ocean conditions could have proved very risky as there were no aircraft landing facilities on the Island. This combination of conditions illustrates the fragility of Seychelles beaches and shores which are not currently submitted to strong seas conditions and suffer immediately of significant damages at the first unusual waves intensities.
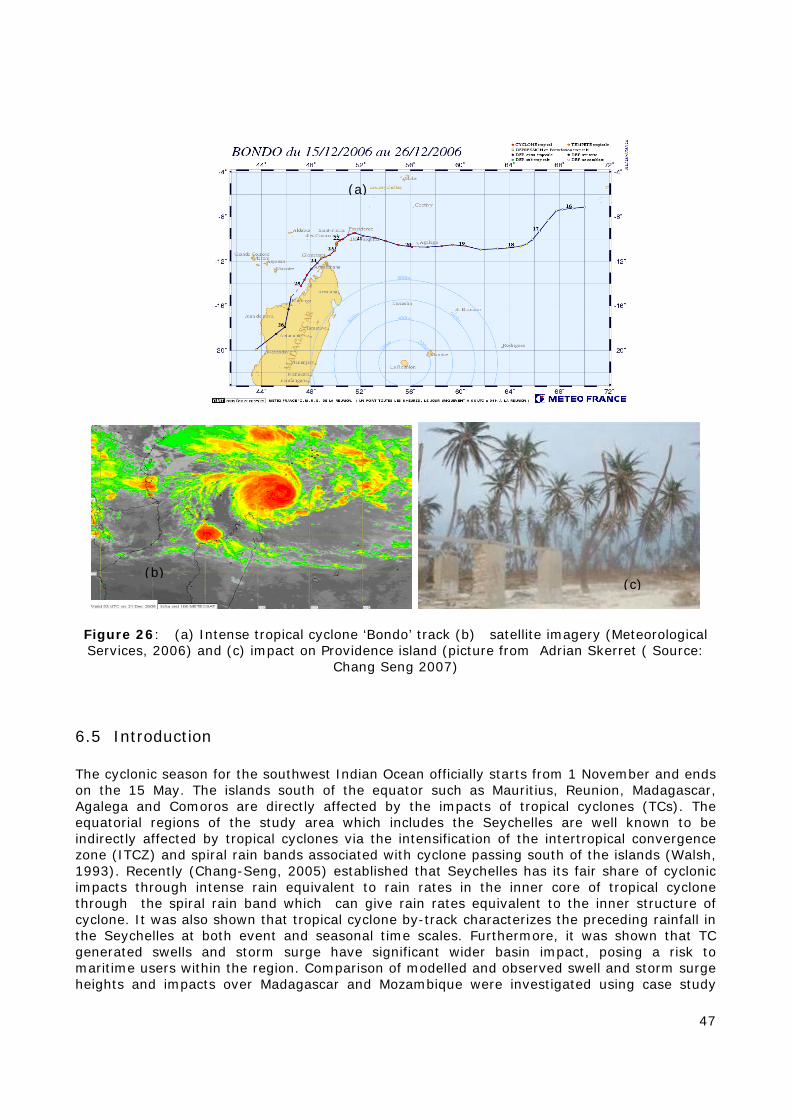
47
Figure 26: (a) Intense tropical cyclone ‘Bondo’ track (b) satellite imagery (Meteorological Services, 2006) and (c) impact on Providence island (picture from Adrian Skerret ( Source:
Chang Seng 2007)
6.5 Introduction The cyclonic season for the southwest Indian Ocean officially starts from 1 November and ends on the 15 May. The islands south of the equator such as Mauritius, Reunion, Madagascar, Agalega and Comoros are directly affected by the impacts of tropical cyclones (TCs). The equatorial regions of the study area which includes the Seychelles are well known to be indirectly affected by tropical cyclones via the intensification of the intertropical convergence zone (ITCZ) and spiral rain bands associated with cyclone passing south of the islands (Walsh, 1993). Recently (Chang-Seng, 2005) established that Seychelles has its fair share of cyclonic impacts through intense rain equivalent to rain rates in the inner core of tropical cyclone through the spiral rain band which can give rain rates equivalent to the inner structure of cyclone. It was also shown that tropical cyclone by-track characterizes the preceding rainfall in the Seychelles at both event and seasonal time scales. Furthermore, it was shown that TC generated swells and storm surge have significant wider basin impact, posing a risk to maritime users within the region. Comparison of modelled and observed swell and storm surge heights and impacts over Madagascar and Mozambique were investigated using case study
(a)
(b) (c)
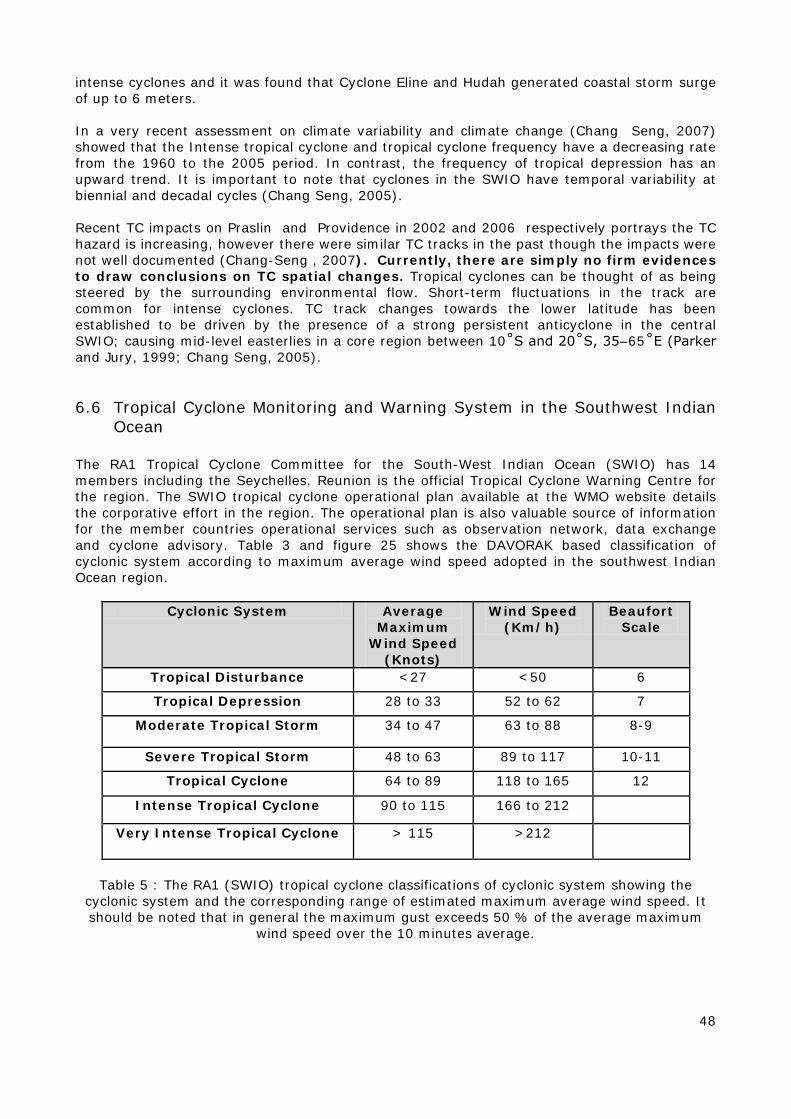
48
intense cyclones and it was found that Cyclone Eline and Hudah generated coastal storm surge of up to 6 meters. In a very recent assessment on climate variability and climate change (Chang Seng, 2007) showed that the Intense tropical cyclone and tropical cyclone frequency have a decreasing rate from the 1960 to the 2005 period. In contrast, the frequency of tropical depression has an upward trend. It is important to note that cyclones in the SWIO have temporal variability at biennial and decadal cycles (Chang Seng, 2005). Recent TC impacts on Praslin and Providence in 2002 and 2006 respectively portrays the TC hazard is increasing, however there were similar TC tracks in the past though the impacts were not well documented (Chang-Seng , 2007). Currently, there are simply no firm evidences to draw conclusions on TC spatial changes. Tropical cyclones can be thought of as being steered by the surrounding environmental flow. Short-term fluctuations in the track are common for intense cyclones. TC track changes towards the lower latitude has been established to be driven by the presence of a strong persistent anticyclone in the central SWIO; causing mid-level easterlies in a core region between 10˚S and 20˚S, 35–65˚E (Parker and Jury, 1999; Chang Seng, 2005).
6.6 Tropical Cyclone Monitoring and Warning System in the Southwest Indian Ocean
The RA1 Tropical Cyclone Committee for the South-West Indian Ocean (SWIO) has 14 members including the Seychelles. Reunion is the official Tropical Cyclone Warning Centre for the region. The SWIO tropical cyclone operational plan available at the WMO website details the corporative effort in the region. The operational plan is also valuable source of information for the member countries operational services such as observation network, data exchange and cyclone advisory. Table 3 and figure 25 shows the DAVORAK based classification of cyclonic system according to maximum average wind speed adopted in the southwest Indian Ocean region.
Cyclonic System Average Maximum
Wind Speed (Knots)
Wind Speed (Km/h)
Beaufort Scale
Tropical Disturbance <27 <50 6
Tropical Depression 28 to 33 52 to 62 7
Moderate Tropical Storm 34 to 47 63 to 88 8-9
Severe Tropical Storm 48 to 63 89 to 117 10-11
Tropical Cyclone 64 to 89 118 to 165 12
Intense Tropical Cyclone 90 to 115 166 to 212
Very Intense Tropical Cyclone > 115 >212
Table 5 : The RA1 (SWIO) tropical cyclone classifications of cyclonic system showing the
cyclonic system and the corresponding range of estimated maximum average wind speed. It should be noted that in general the maximum gust exceeds 50 % of the average maximum
wind speed over the 10 minutes average.
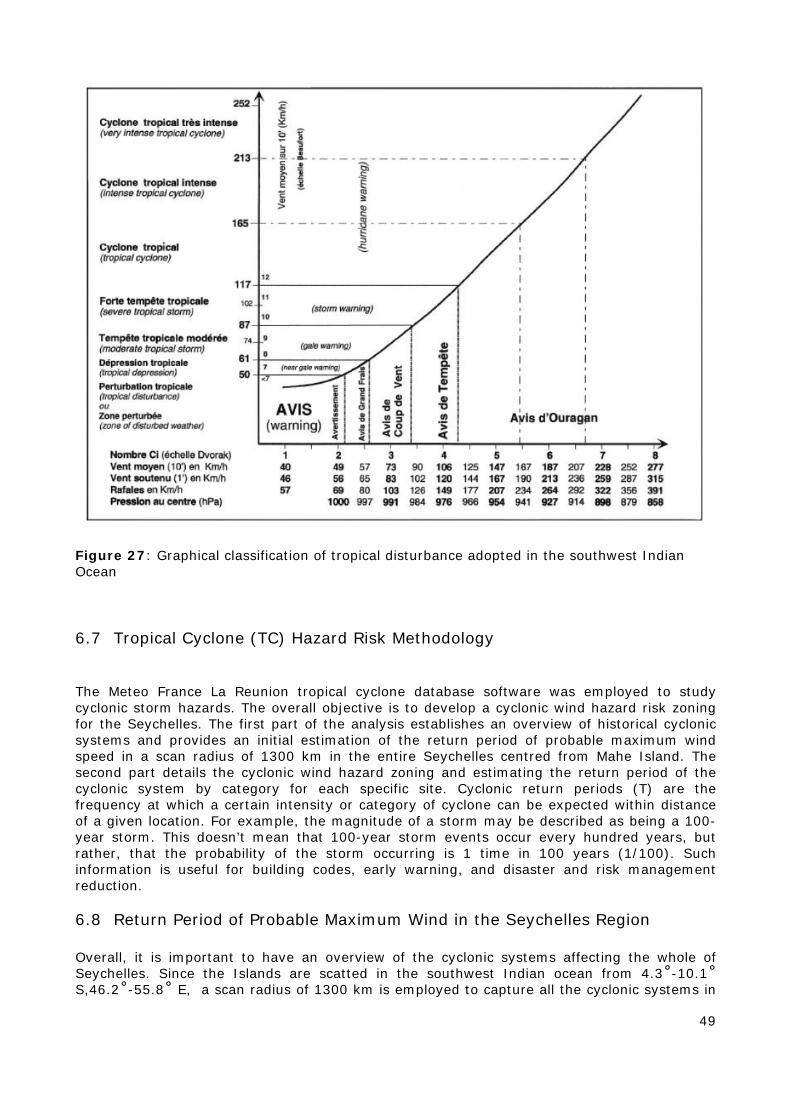
49
Figure 27: Graphical classification of tropical disturbance adopted in the southwest Indian Ocean
6.7 Tropical Cyclone (TC) Hazard Risk Methodology
The Meteo France La Reunion tropical cyclone database software was employed to study cyclonic storm hazards. The overall objective is to develop a cyclonic wind hazard risk zoning for the Seychelles. The first part of the analysis establishes an overview of historical cyclonic systems and provides an initial estimation of the return period of probable maximum wind speed in a scan radius of 1300 km in the entire Seychelles centred from Mahe Island. The second part details the cyclonic wind hazard zoning and estimating the return period of the cyclonic system by category for each specific site. Cyclonic return periods (T) are the frequency at which a certain intensity or category of cyclone can be expected within distance of a given location. For example, the magnitude of a storm may be described as being a 100-year storm. This doesn’t mean that 100-year storm events occur every hundred years, but rather, that the probability of the storm occurring is 1 time in 100 years (1/100). Such information is useful for building codes, early warning, and disaster and risk management reduction.
6.8 Return Period of Probable Maximum Wind in the Seychelles Region Overall, it is important to have an overview of the cyclonic systems affecting the whole of Seychelles. Since the Islands are scatted in the southwest Indian ocean from 4.3˚-10.1˚ S,46.2˚-55.8˚ E, a scan radius of 1300 km is employed to capture all the cyclonic systems in
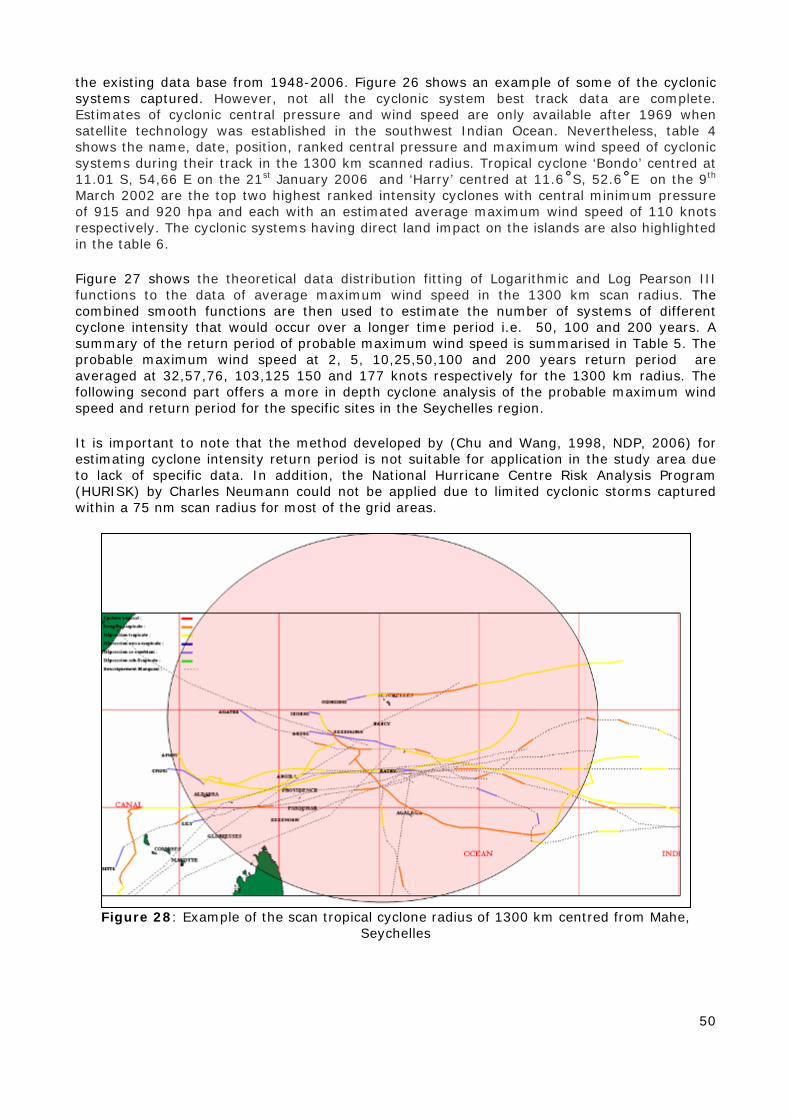
50
the existing data base from 1948-2006. Figure 26 shows an example of some of the cyclonic systems captured. However, not all the cyclonic system best track data are complete. Estimates of cyclonic central pressure and wind speed are only available after 1969 when satellite technology was established in the southwest Indian Ocean. Nevertheless, table 4 shows the name, date, position, ranked central pressure and maximum wind speed of cyclonic systems during their track in the 1300 km scanned radius. Tropical cyclone ‘Bondo’ centred at 11.01 S, 54,66 E on the 21st January 2006 and ‘Harry’ centred at 11.6˚S, 52.6˚E on the 9th March 2002 are the top two highest ranked intensity cyclones with central minimum pressure of 915 and 920 hpa and each with an estimated average maximum wind speed of 110 knots respectively. The cyclonic systems having direct land impact on the islands are also highlighted in the table 6.
Figure 27 shows the theoretical data distribution fitting of Logarithmic and Log Pearson III functions to the data of average maximum wind speed in the 1300 km scan radius. The combined smooth functions are then used to estimate the number of systems of different cyclone intensity that would occur over a longer time period i.e. 50, 100 and 200 years. A summary of the return period of probable maximum wind speed is summarised in Table 5. The probable maximum wind speed at 2, 5, 10,25,50,100 and 200 years return period are averaged at 32,57,76, 103,125 150 and 177 knots respectively for the 1300 km radius. The following second part offers a more in depth cyclone analysis of the probable maximum wind speed and return period for the specific sites in the Seychelles region.
It is important to note that the method developed by (Chu and Wang, 1998, NDP, 2006) for estimating cyclone intensity return period is not suitable for application in the study area due to lack of specific data. In addition, the National Hurricane Centre Risk Analysis Program (HURISK) by Charles Neumann could not be applied due to limited cyclonic storms captured within a 75 nm scan radius for most of the grid areas.
Figure 28: Example of the scan tropical cyclone radius of 1300 km centred from Mahe,
Seychelles
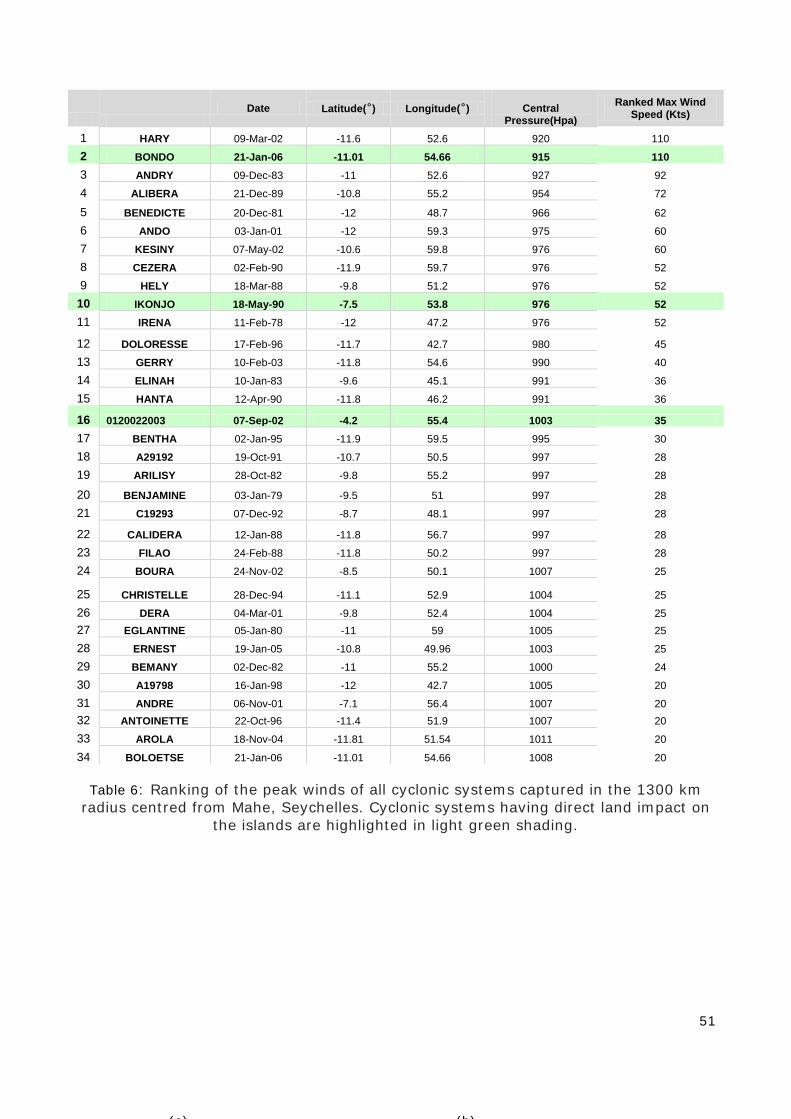
51
Date Latitude(˚) Longitude(˚)
Central
Pressure(Hpa) Ranked Max Wind
Speed (Kts)
1 HARY 09-Mar-02 -11.6 52.6 920 110
2 BONDO 21-Jan-06 -11.01 54.66 915 110 3 ANDRY 09-Dec-83 -11 52.6 927 92
4 ALIBERA 21-Dec-89 -10.8 55.2 954 72
5 BENEDICTE 20-Dec-81 -12 48.7 966 62
6 ANDO 03-Jan-01 -12 59.3 975 60
7 KESINY 07-May-02 -10.6 59.8 976 60
8 CEZERA 02-Feb-90 -11.9 59.7 976 52
9 HELY 18-Mar-88 -9.8 51.2 976 52
10 IKONJO 18-May-90 -7.5 53.8 976 52 11 IRENA 11-Feb-78 -12 47.2 976 52
12 DOLORESSE 17-Feb-96 -11.7 42.7 980 45
13 GERRY 10-Feb-03 -11.8 54.6 990 40
14 ELINAH 10-Jan-83 -9.6 45.1 991 36
15 HANTA 12-Apr-90 -11.8 46.2 991 36
16 0120022003 07-Sep-02 -4.2 55.4 1003 35 17 BENTHA 02-Jan-95 -11.9 59.5 995 30
18 A29192 19-Oct-91 -10.7 50.5 997 28
19 ARILISY 28-Oct-82 -9.8 55.2 997 28
20 BENJAMINE 03-Jan-79 -9.5 51 997 28
21 C19293 07-Dec-92 -8.7 48.1 997 28
22 CALIDERA 12-Jan-88 -11.8 56.7 997 28
23 FILAO 24-Feb-88 -11.8 50.2 997 28
24 BOURA 24-Nov-02 -8.5 50.1 1007 25
25 CHRISTELLE 28-Dec-94 -11.1 52.9 1004 25
26 DERA 04-Mar-01 -9.8 52.4 1004 25 27 EGLANTINE 05-Jan-80 -11 59 1005 25
28 ERNEST 19-Jan-05 -10.8 49.96 1003 25
29 BEMANY 02-Dec-82 -11 55.2 1000 24
30 A19798 16-Jan-98 -12 42.7 1005 20
31 ANDRE 06-Nov-01 -7.1 56.4 1007 20 32 ANTOINETTE 22-Oct-96 -11.4 51.9 1007 20
33 AROLA 18-Nov-04 -11.81 51.54 1011 20
34 BOLOETSE 21-Jan-06 -11.01 54.66 1008 20
Table 6: Ranking of the peak winds of all cyclonic systems captured in the 1300 km radius centred from Mahe, Seychelles. Cyclonic systems having direct land impact on
the islands are highlighted in light green shading.
(a) (b)
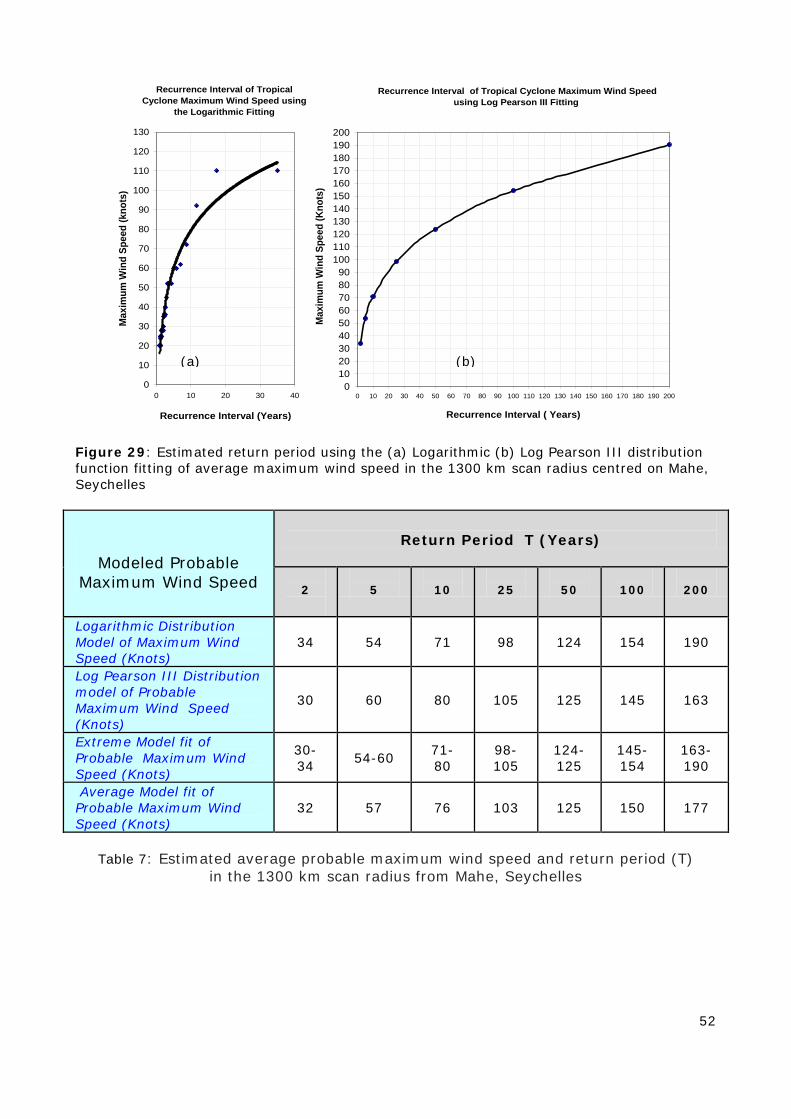
52
Recurrence Interval of Tropical Cyclone Maximum Wind Speed using
the Logarithmic Fitting
0
10
20
30
40
50
60
70
80
90
100
110
120
130
0 10 20 30 40
Recurrence Interval (Years)
Max
imum
Win
d Sp
eed
(kno
ts)
Recurrence Interval of Tropical Cyclone Maximum Wind Speed using Log Pearson III Fitting
0102030405060708090
100110120130140150160170180190200
0 10 20 30 40 50 60 70 80 90 100 110 120 130 140 150 160 170 180 190 200
Recurrence Interval ( Years)
Max
imum
Win
d Sp
eed
(Kno
ts)
Figure 29: Estimated return period using the (a) Logarithmic (b) Log Pearson III distribution function fitting of average maximum wind speed in the 1300 km scan radius centred on Mahe, Seychelles
Modeled Probable
Maximum Wind Speed
Return Period T (Years)
2
5
10
25
50
100
200
Logarithmic Distribution Model of Maximum Wind Speed (Knots)
34 54 71 98 124 154 190
Log Pearson III Distribution model of Probable Maximum Wind Speed (Knots)
30 60 80 105 125 145 163
Extreme Model fit of Probable Maximum Wind Speed (Knots)
30-34 54-60 71-
80 98-105
124-125
145-154
163-190
Average Model fit of Probable Maximum Wind Speed (Knots)
32 57 76 103 125 150 177
Table 7: Estimated average probable maximum wind speed and return period (T)
in the 1300 km scan radius from Mahe, Seychelles
(a) (b)
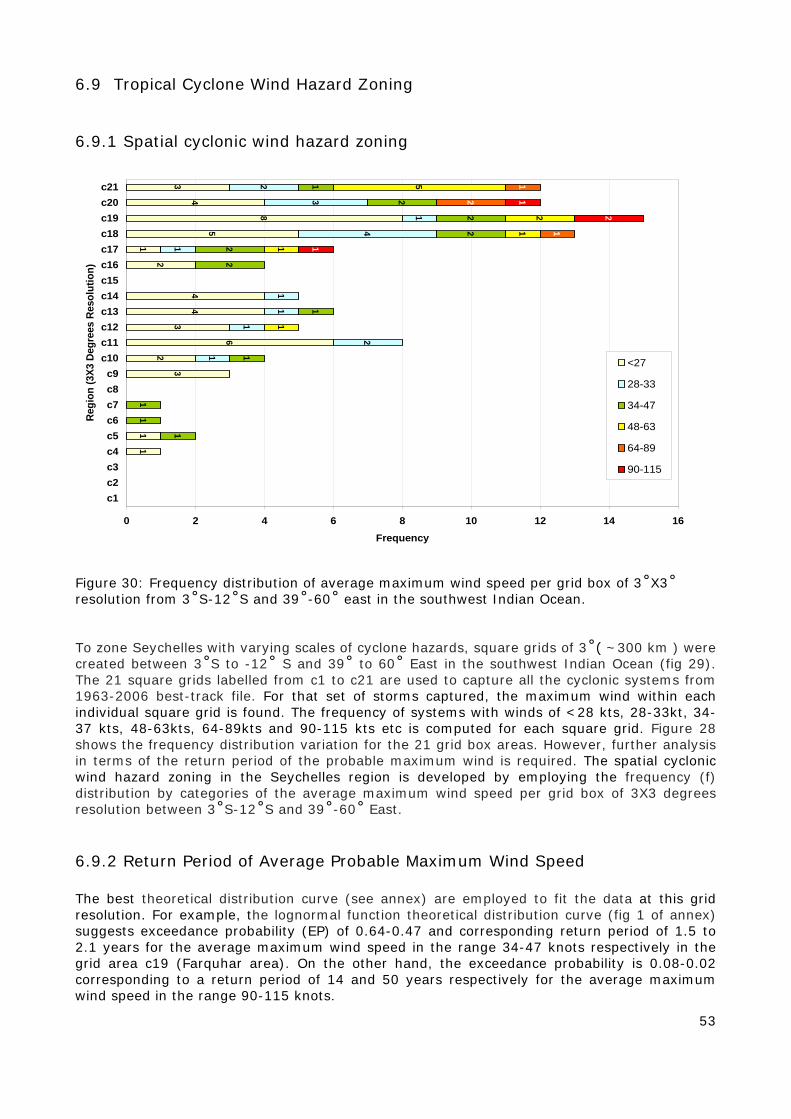
53
6.9 Tropical Cyclone Wind Hazard Zoning
6.9.1 Spatial cyclonic wind hazard zoning
11
3
2
6
3
44
2
1
5
8
4
3
1
2
1
11
1
4
1
3
2
1
11
1
1
22
22
2
1
11
1
2
5
1
2
1
1
2
1
0 2 4 6 8 10 12 14 16
c1c2c3c4c5c6c7c8c9
c10c11c12c13c14c15c16c17c18c19c20c21
Regi
on (3
X3 D
egre
es R
esol
utio
n)
Frequency
<27
28-33
34-47
48-63
64-89
90-115
Figure 30: Frequency distribution of average maximum wind speed per grid box of 3˚X3˚ resolution from 3˚S-12˚S and 39˚-60˚ east in the southwest Indian Ocean. To zone Seychelles with varying scales of cyclone hazards, square grids of 3˚( ~300 km ) were created between 3˚S to -12˚ S and 39˚ to 60˚ East in the southwest Indian Ocean (fig 29). The 21 square grids labelled from c1 to c21 are used to capture all the cyclonic systems from 1963-2006 best-track file. For that set of storms captured, the maximum wind within each individual square grid is found. The frequency of systems with winds of <28 kts, 28-33kt, 34-37 kts, 48-63kts, 64-89kts and 90-115 kts etc is computed for each square grid. Figure 28 shows the frequency distribution variation for the 21 grid box areas. However, further analysis in terms of the return period of the probable maximum wind is required. The spatial cyclonic wind hazard zoning in the Seychelles region is developed by employing the frequency (f) distribution by categories of the average maximum wind speed per grid box of 3X3 degrees resolution between 3˚S-12˚S and 39˚-60˚ East.
6.9.2 Return Period of Average Probable Maximum Wind Speed The best theoretical distribution curve (see annex) are employed to fit the data at this grid resolution. For example, the lognormal function theoretical distribution curve (fig 1 of annex) suggests exceedance probability (EP) of 0.64-0.47 and corresponding return period of 1.5 to 2.1 years for the average maximum wind speed in the range 34-47 knots respectively in the grid area c19 (Farquhar area). On the other hand, the exceedance probability is 0.08-0.02 corresponding to a return period of 14 and 50 years respectively for the average maximum wind speed in the range 90-115 knots.
54
The estimated return period of various categories of cyclonic storm from tropical disturbance, depression, moderate tropical depression, severe tropical storm, cyclone and intense tropical cyclone are presented in the spatial maps (annex). Details of the interpretation of the maps are summarised in the following section. It is also noted that no cyclonic system has yet reached very intense category in the study area. However, as expected there are only a few storms captured in the 34-year record for the other grid boxes located equator wards. Therefore, the fitting of a theoretical distribution function to the data to estimate various return periods is problematic for a cyclone frequency of less than five for a number of grid box areas (i.e. c1, c2, c3, c4, c5, c6, c7c9, c10 and c16). Therefore, the only solution is to show the frequency of cyclonic systems captured at these sites rather than attempt to estimate the return period (T) through theoretical distribution curves. Therefore, the cyclonic frequency for the above sites are indicated as f1, f2 f3 etc on the spatial maps of return period in years by cyclonic category. For instance grid box c5 representing Mahe group is assigned with f1 indicating that one cyclonic storm with an average maximum wind speed reaching 34-47 knot (68-94 km/h) had entered the area in the last 34 years. Indeed, the actual event was associated with the severe tropical storm which affected severely Praslin on the 7th September 2002. It was centred at 4.2S, 55.4 east with a central pressure of 1002hpa and with an estimated average maximum wind speed of 35 knots. Overall, considering all the above factors Seychelles region can be classified with 6 distinct cyclonic wind hazard zones (fig 31). On average, the top cyclonic wind hazard zone is indicated with red shading which includes grid boxes c17 (i.e. Aldabra group), c19 (Farquhar group) and c20. The highest wind hazard zone is characterised with category 5;intense tropical cyclone with average maximum wind speed ranging from 90-115 kts (180-212 km/h) and return period of 14-50 years. However, it is noted that c19 representing Farquhar group is the highest ranking cyclone hazard area in the entire of the Seychelles region. This implies intense tropical cyclone like “Bondo”’ with average maximum wind speed topping 115 knots (230 Km/h) is likely to have a return period of 50 years. Therefore, such extreme event has a 2% exceedance probability of occurrence annually. The second highest cyclone hazard zone is indicated by orange shading which extends to include grid boxes c16 and c17. It is defined by category 4; tropical cyclones with average maximum wind speed ranging from 64-89 knots (118-165 km/h) and return period of 4-10 years. The third highest cyclone hazard zone is indicated with yellow shading which extends to include grid area c12. It is characterised with category 3; severe tropical storms with average maximum wind speed ranging from 48-63 knots (89-117 km/h) and return period of 2-4 years. The fourth highest cyclone hazard zone is indicated with green shading extending further to include grid boxes c5 (Mahe group), c6, c7, c10, c13 and c16. It is characterised with at least one category 2 tropical depression of wind speed between 33-47 knots (63-88 km/h).The fifth cyclone wind hazard zone is indicated with light blue shading which extends to include grid boxes c11, and c14. It is characterised with at least one category 1; tropical disturbance of wind speed between 28-33 knots (51-62 km/h). The sixth cyclone hazard zone is indicated with light yellow shading and extends to include c4 and c9 grid boxes. It is characterised with an average maximum wind speed of less than 28 knots (51 km/h). The areas c1, c2, c3, c8 and c15 are classified with no to lowest cyclone hazard zone. Therefore, the cyclonic wind hazard analysis suggests at least six possible cyclone scenarios in the Seychelles region.
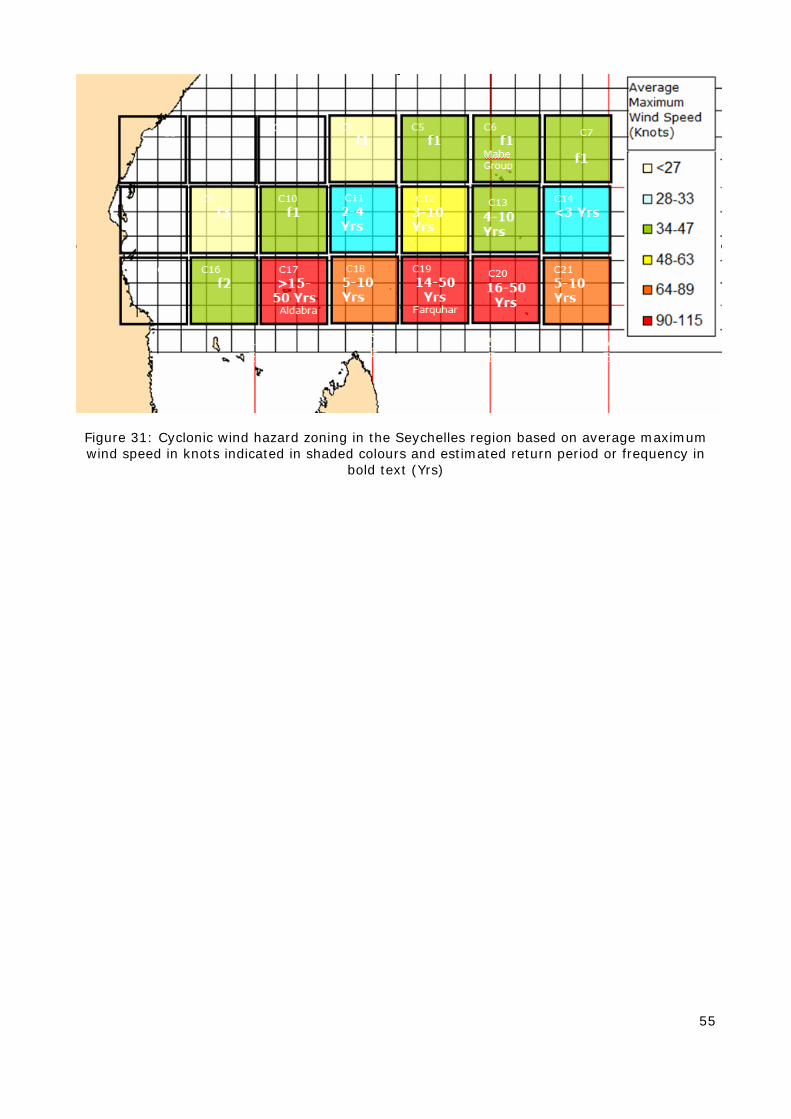
55
Figure 31: Cyclonic wind hazard zoning in the Seychelles region based on average maximum wind speed in knots indicated in shaded colours and estimated return period or frequency in
bold text (Yrs)
56
7 STORM SURGE HAZARD
7.1 Recent Storm Surges in Seychelles An operational US Navy ocean wave model (WW3: wave watch 3) indicated the likely occurrence of a low to moderate storm surge in the range of 2.5 m during landfall of intense tropical cyclone Bondo over Providence Island in December 2006. However, to this day no actual event of cyclone generated storm surge has been observed or recorded in the Seychelles. Nevertheless, the potential for cyclone-generated storm surge is addressed here.
7.2 Introduction When a tropical cyclone makes landfall there is often a sudden rise of sea level that moves inland. This inland-moving water can have huge impacts on the coastal environment and habitat. However calculating wave properties near TC is often difficult. The primary difficulty is that the wind speeds increase from the outer limits of the tropical cyclone to the eye wall. It is also difficult to find the fetch area were the winds are constant in speed and direction. Nevertheless, reasonable estimates of cyclone generated storm surge heights are crucial for the evaluation of coastal impacts (Chang-Seng, 2005). Therefore, cyclonic generated storm surge scenarios for the main islands are developed based on the cyclonic wind hazard zone as storm surge occurs when tropical cyclone makes landfall only.
7.3 Storm Surge Modelling Storm surge is dependent on the wind fetch area, local pressure, open sea wind waves, astronomical tides and local coastal features. Therefore, a 2-D storm surge model (Chang-Seng, 2005) is employed to estimate the total storm surge which is a combination of surge effects ( ),( maxUhsη ), inverse barometric effect )( xib P∆η , and extreme astronomical tides
( mlowmhigh−η ) and for each selected cyclonic wind hazard risk zone.
i.e Tη = )( xib P∆η + ),( maxUhsη ± mlowmhigh−η
Where h is considered here as the average bathymetry over a 2 km transect from the east-
west coastline and u max is the cyclone average maximum wind speed.
The critical factor inhibiting an ideal storm surge is the relative size of the land to act as a water barrier. It is noted that on landfall, intense cyclones have generated up to 6.0 m storm surge over the Madagascar (Jury and Naerra, 1997, Chang-Seng, 2005) with an extended coastline of say length L. However the landfall impact of intense tropical cyclone ‘Bondo’ over Providence Island apparently failed to generate such a classical storm surge. It is thought that the sea water tends to diverge out around the limited coastal length (x) rather than pile up to cause a wall of water to move inland since x<L (fig 30). Therefore, a correction factor (k) is needed to estimate realistic storm surge for the relatively small Islands based on the relation between the observed storm surge ( Tη ) in the region and the length of the coastline (L). The computed k values are 0.2 and 0.1 for a 35 km and 15 km coastline respectively. For instance, the application of the coastal configuration factor (k) yields a more realistic estimate of the total storm surge of 0.8-2.7 m over Providence Island which is in close agreement with the US Navy wave watch model (WW3).
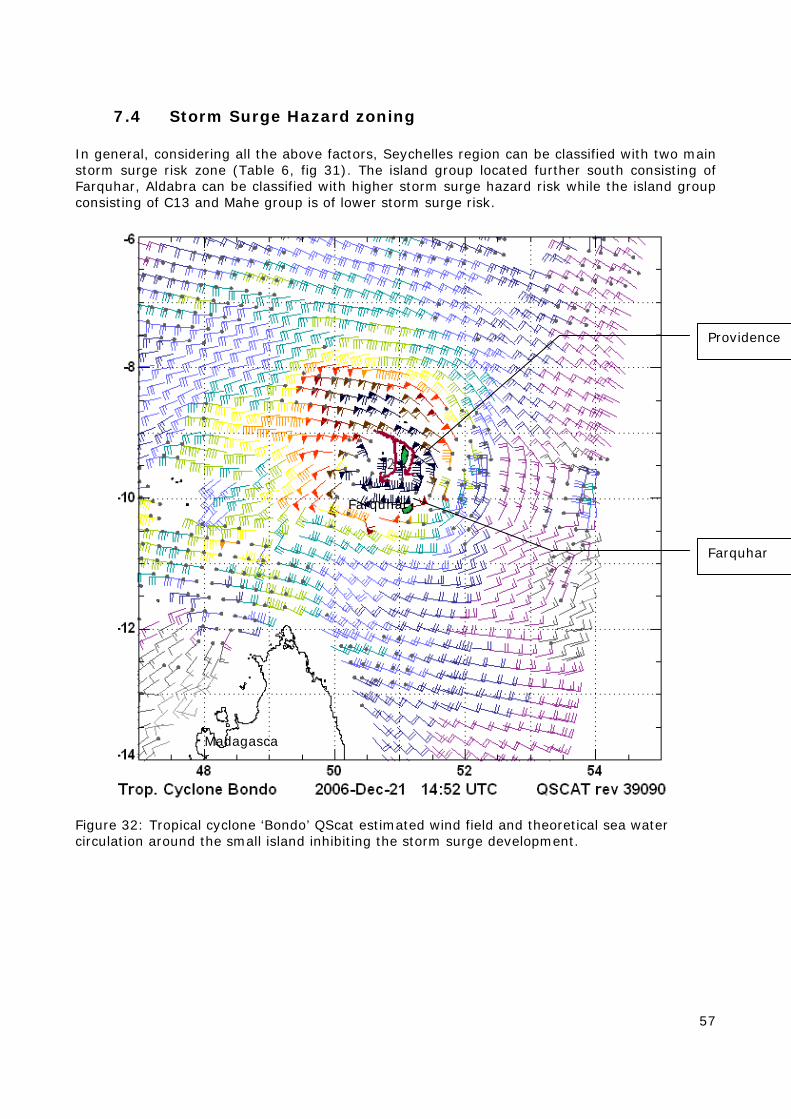
57
7.4 Storm Surge Hazard zoning In general, considering all the above factors, Seychelles region can be classified with two main storm surge risk zone (Table 6, fig 31). The island group located further south consisting of Farquhar, Aldabra can be classified with higher storm surge hazard risk while the island group consisting of C13 and Mahe group is of lower storm surge risk.
Figure 32: Tropical cyclone ‘Bondo’ QScat estimated wind field and theoretical sea water circulation around the small island inhibiting the storm surge development.
Farquhar
Madagascar
Providence
Farquhar
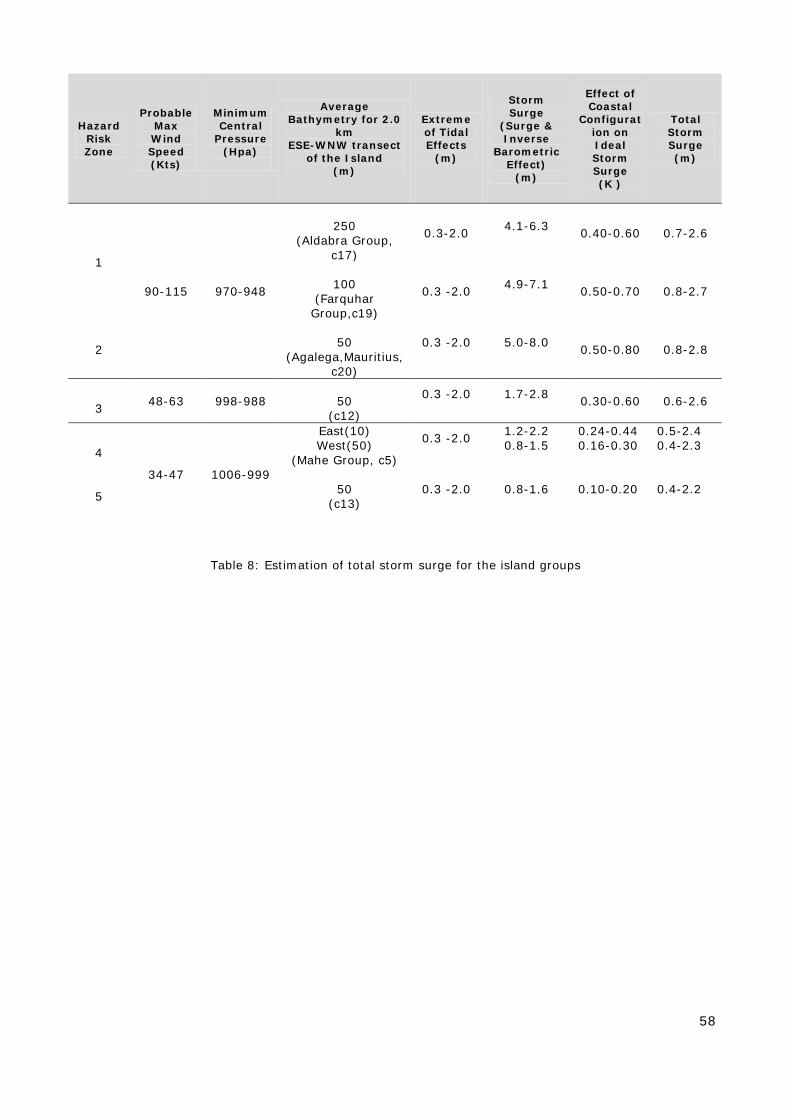
58
Hazard Risk Zone
Probable Max Wind Speed (Kts)
Minimum Central
Pressure (Hpa)
Average Bathymetry for 2.0
km ESE-WNW transect
of the Island (m)
Extreme of Tidal Effects
(m)
Storm Surge
(Surge & Inverse
Barometric Effect)
(m)
Effect of Coastal
Configuration on Ideal Storm Surge (K )
Total Storm Surge (m)
1
90-115 970-948
250
(Aldabra Group, c17)
0.3-2.0 4.1-6.3 0.40-0.60 0.7-2.6
100
(Farquhar Group,c19)
0.3 -2.0 4.9-7.1 0.50-0.70 0.8-2.7
2
50
(Agalega,Mauritius,c20)
0.3 -2.0
5.0-8.0 0.50-0.80 0.8-2.8
3
48-63 998-988
50
(c12)
0.3 -2.0
1.7-2.8 0.30-0.60 0.6-2.6
4
34-47
1006-999
East(10) West(50)
(Mahe Group, c5)
0.3 -2.0
1.2-2.2 0.8-1.5
0.24-0.44 0.16-0.30
0.5-2.4 0.4-2.3
5
50
(c13)
0.3 -2.0
0.8-1.6
0.10-0.20
0.4-2.2
Table 8: Estimation of total storm surge for the island groups
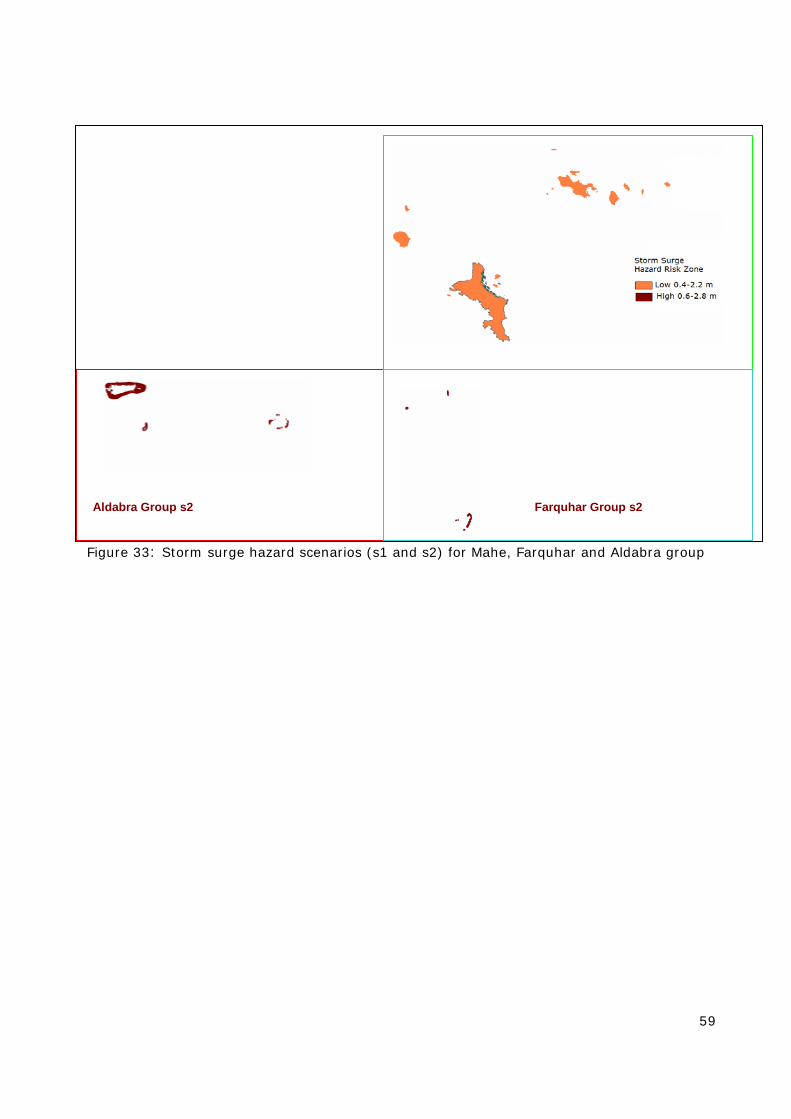
59
Figure 33: Storm surge hazard scenarios (s1 and s2) for Mahe, Farquhar and Aldabra group
Aldabra Group s2
Mahe Group s1
Farquhar Group s2
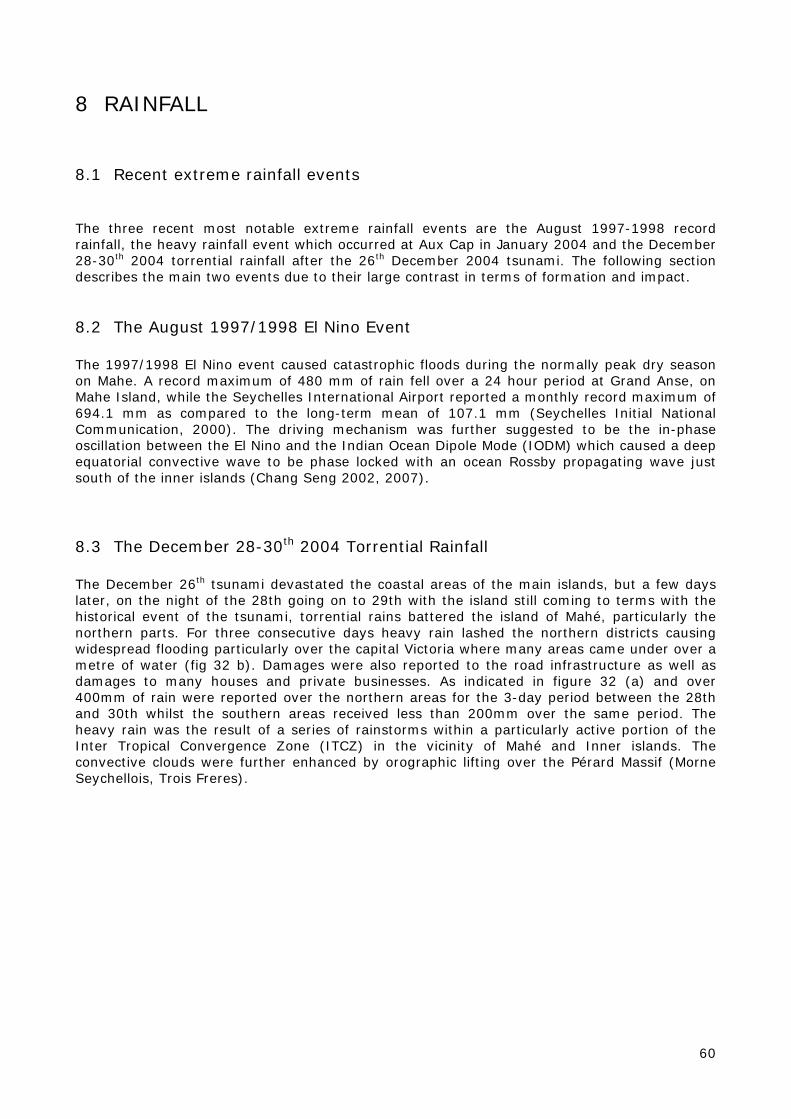
60
8 RAINFALL
8.1 Recent extreme rainfall events The three recent most notable extreme rainfall events are the August 1997-1998 record rainfall, the heavy rainfall event which occurred at Aux Cap in January 2004 and the December 28-30th 2004 torrential rainfall after the 26th December 2004 tsunami. The following section describes the main two events due to their large contrast in terms of formation and impact.
8.2 The August 1997/1998 El Nino Event The 1997/1998 El Nino event caused catastrophic floods during the normally peak dry season on Mahe. A record maximum of 480 mm of rain fell over a 24 hour period at Grand Anse, on Mahe Island, while the Seychelles International Airport reported a monthly record maximum of 694.1 mm as compared to the long-term mean of 107.1 mm (Seychelles Initial National Communication, 2000). The driving mechanism was further suggested to be the in-phase oscillation between the El Nino and the Indian Ocean Dipole Mode (IODM) which caused a deep equatorial convective wave to be phase locked with an ocean Rossby propagating wave just south of the inner islands (Chang Seng 2002, 2007).
8.3 The December 28-30th 2004 Torrential Rainfall The December 26th tsunami devastated the coastal areas of the main islands, but a few days later, on the night of the 28th going on to 29th with the island still coming to terms with the historical event of the tsunami, torrential rains battered the island of Mahé, particularly the northern parts. For three consecutive days heavy rain lashed the northern districts causing widespread flooding particularly over the capital Victoria where many areas came under over a metre of water (fig 32 b). Damages were also reported to the road infrastructure as well as damages to many houses and private businesses. As indicated in figure 32 (a) and over 400mm of rain were reported over the northern areas for the 3-day period between the 28th and 30th whilst the southern areas received less than 200mm over the same period. The heavy rain was the result of a series of rainstorms within a particularly active portion of the Inter Tropical Convergence Zone (ITCZ) in the vicinity of Mahé and Inner islands. The convective clouds were further enhanced by orographic lifting over the Pérard Massif (Morne Seychellois, Trois Freres).
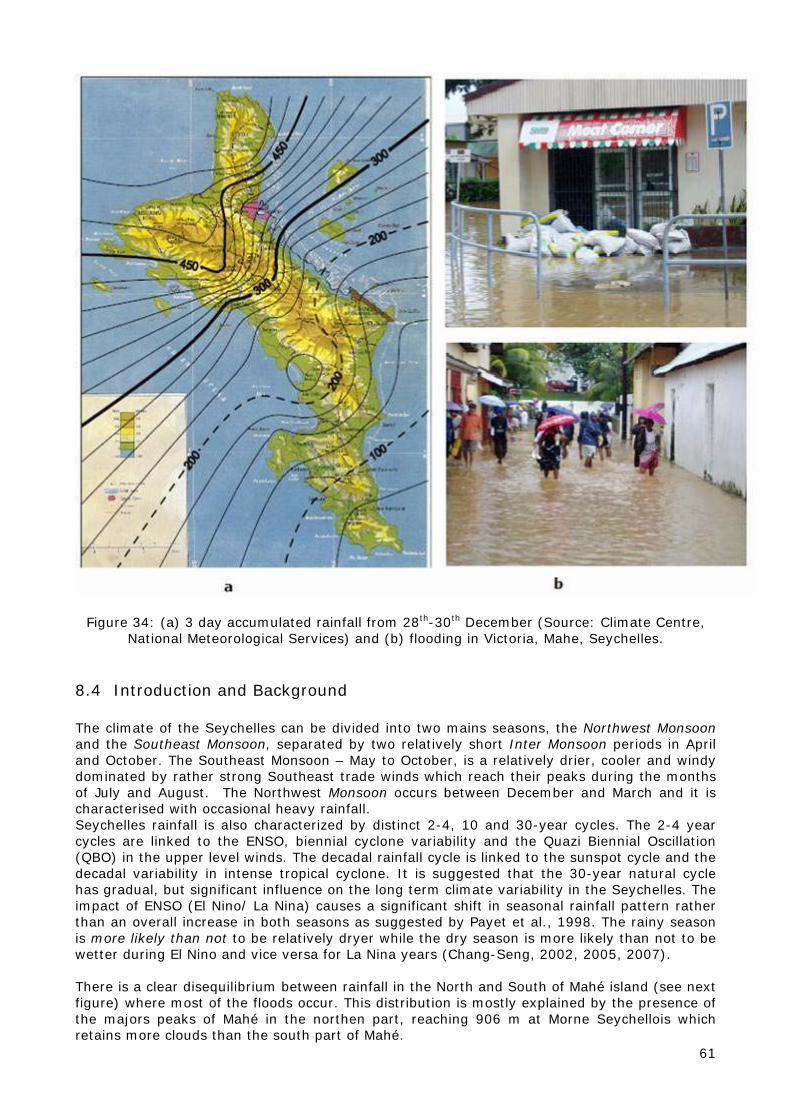
61
Figure 34: (a) 3 day accumulated rainfall from 28th-30th December (Source: Climate Centre, National Meteorological Services) and (b) flooding in Victoria, Mahe, Seychelles.
8.4 Introduction and Background The climate of the Seychelles can be divided into two mains seasons, the Northwest Monsoon and the Southeast Monsoon, separated by two relatively short Inter Monsoon periods in April and October. The Southeast Monsoon – May to October, is a relatively drier, cooler and windy dominated by rather strong Southeast trade winds which reach their peaks during the months of July and August. The Northwest Monsoon occurs between December and March and it is characterised with occasional heavy rainfall. Seychelles rainfall is also characterized by distinct 2-4, 10 and 30-year cycles. The 2-4 year cycles are linked to the ENSO, biennial cyclone variability and the Quazi Biennial Oscillation (QBO) in the upper level winds. The decadal rainfall cycle is linked to the sunspot cycle and the decadal variability in intense tropical cyclone. It is suggested that the 30-year natural cycle has gradual, but significant influence on the long term climate variability in the Seychelles. The impact of ENSO (El Nino/ La Nina) causes a significant shift in seasonal rainfall pattern rather than an overall increase in both seasons as suggested by Payet et al., 1998. The rainy season is more likely than not to be relatively dryer while the dry season is more likely than not to be wetter during El Nino and vice versa for La Nina years (Chang-Seng, 2002, 2005, 2007). There is a clear disequilibrium between rainfall in the North and South of Mahé island (see next figure) where most of the floods occur. This distribution is mostly explained by the presence of the majors peaks of Mahé in the northen part, reaching 906 m at Morne Seychellois which retains more clouds than the south part of Mahé.
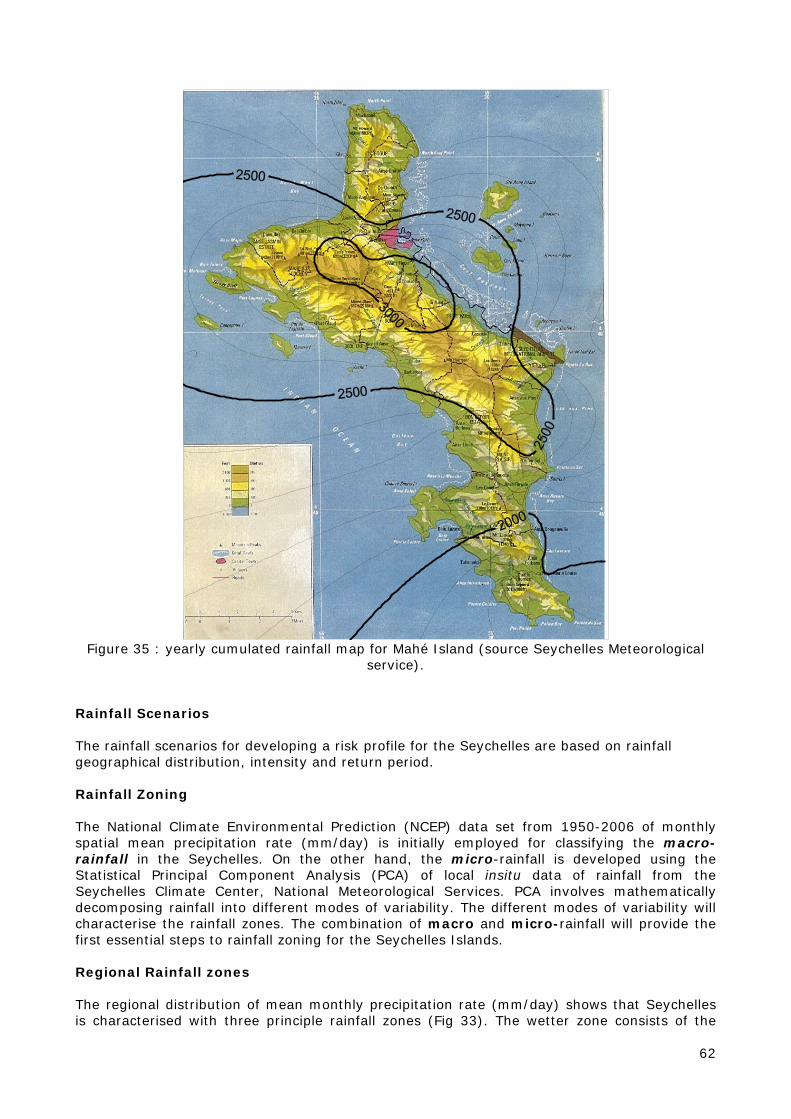
62
Figure 35 : yearly cumulated rainfall map for Mahé Island (source Seychelles Meteorological
service).
Rainfall Scenarios The rainfall scenarios for developing a risk profile for the Seychelles are based on rainfall geographical distribution, intensity and return period. Rainfall Zoning The National Climate Environmental Prediction (NCEP) data set from 1950-2006 of monthly spatial mean precipitation rate (mm/day) is initially employed for classifying the macro-rainfall in the Seychelles. On the other hand, the micro-rainfall is developed using the Statistical Principal Component Analysis (PCA) of local insitu data of rainfall from the Seychelles Climate Center, National Meteorological Services. PCA involves mathematically decomposing rainfall into different modes of variability. The different modes of variability will characterise the rainfall zones. The combination of macro and micro-rainfall will provide the first essential steps to rainfall zoning for the Seychelles Islands. Regional Rainfall zones The regional distribution of mean monthly precipitation rate (mm/day) shows that Seychelles is characterised with three principle rainfall zones (Fig 33). The wetter zone consists of the
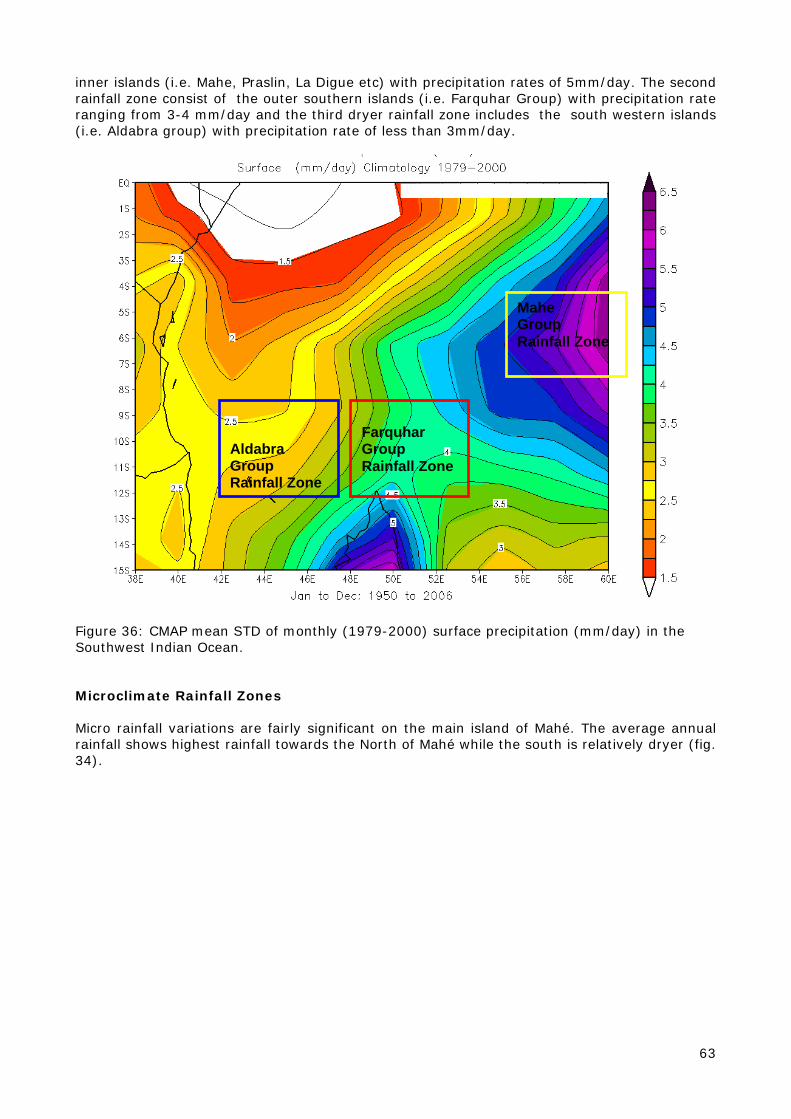
63
inner islands (i.e. Mahe, Praslin, La Digue etc) with precipitation rates of 5mm/day. The second rainfall zone consist of the outer southern islands (i.e. Farquhar Group) with precipitation rate ranging from 3-4 mm/day and the third dryer rainfall zone includes the south western islands (i.e. Aldabra group) with precipitation rate of less than 3mm/day.
Figure 36: CMAP mean STD of monthly (1979-2000) surface precipitation (mm/day) in the Southwest Indian Ocean. Microclimate Rainfall Zones Micro rainfall variations are fairly significant on the main island of Mahé. The average annual rainfall shows highest rainfall towards the North of Mahé while the south is relatively dryer (fig. 34).
Aldabra Group Rainfall Zone
Farquhar Group Rainfall Zone
Mahe Group Rainfall Zone
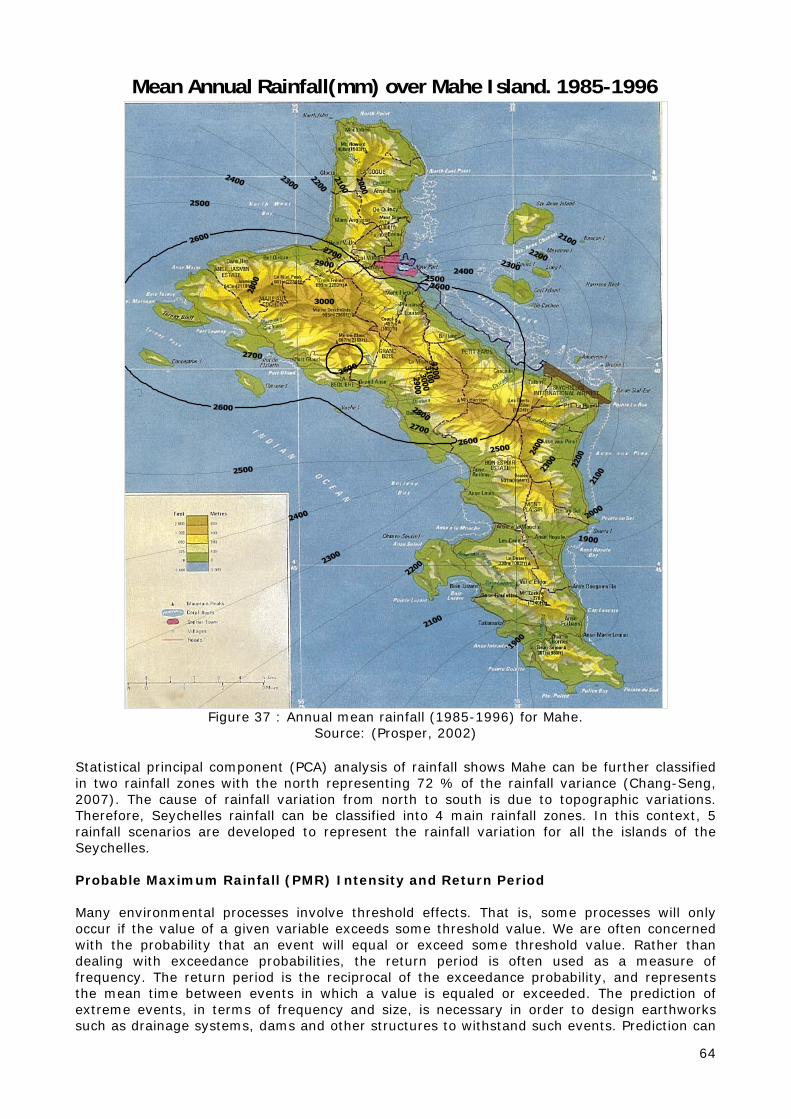
64
Mean Annual Rainfall(mm) over Mahe Island. 1985-1996
Figure 37 : Annual mean rainfall (1985-1996) for Mahe.
Source: (Prosper, 2002)
Statistical principal component (PCA) analysis of rainfall shows Mahe can be further classified in two rainfall zones with the north representing 72 % of the rainfall variance (Chang-Seng, 2007). The cause of rainfall variation from north to south is due to topographic variations. Therefore, Seychelles rainfall can be classified into 4 main rainfall zones. In this context, 5 rainfall scenarios are developed to represent the rainfall variation for all the islands of the Seychelles. Probable Maximum Rainfall (PMR) Intensity and Return Period Many environmental processes involve threshold effects. That is, some processes will only occur if the value of a given variable exceeds some threshold value. We are often concerned with the probability that an event will equal or exceed some threshold value. Rather than dealing with exceedance probabilities, the return period is often used as a measure of frequency. The return period is the reciprocal of the exceedance probability, and represents the mean time between events in which a value is equaled or exceeded. The prediction of extreme events, in terms of frequency and size, is necessary in order to design earthworks such as drainage systems, dams and other structures to withstand such events. Prediction can
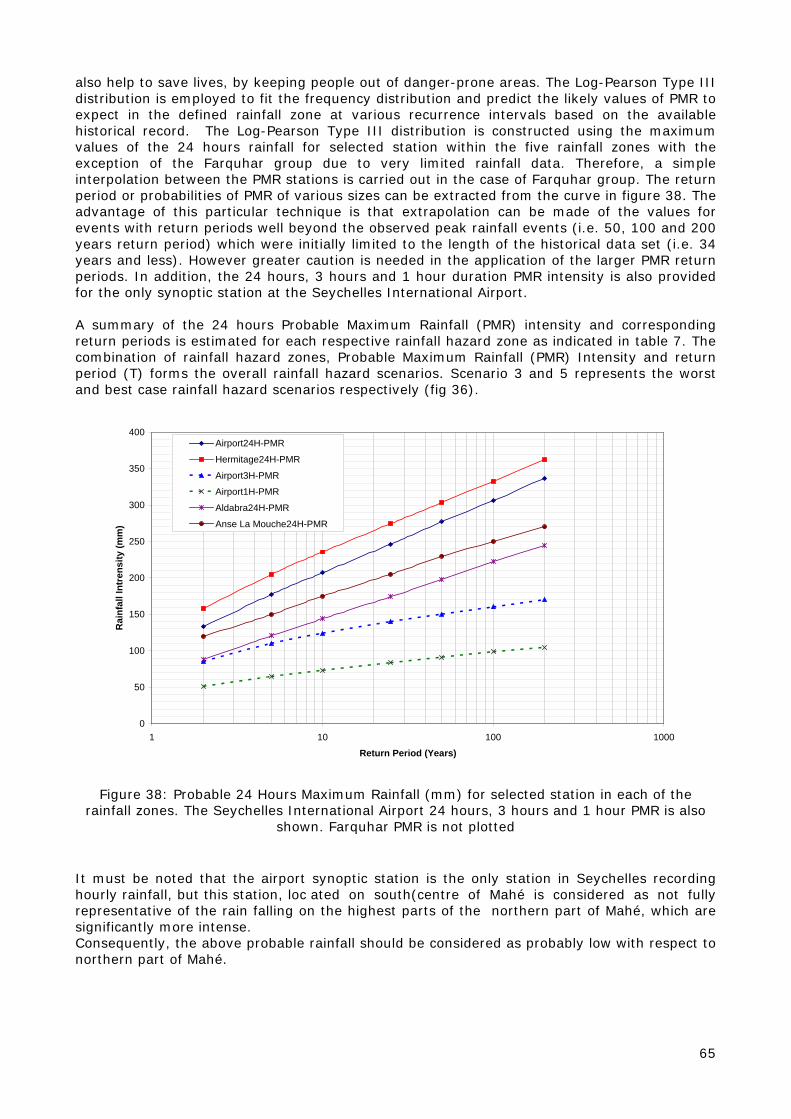
65
also help to save lives, by keeping people out of danger-prone areas. The Log-Pearson Type III distribution is employed to fit the frequency distribution and predict the likely values of PMR to expect in the defined rainfall zone at various recurrence intervals based on the available historical record. The Log-Pearson Type III distribution is constructed using the maximum values of the 24 hours rainfall for selected station within the five rainfall zones with the exception of the Farquhar group due to very limited rainfall data. Therefore, a simple interpolation between the PMR stations is carried out in the case of Farquhar group. The return period or probabilities of PMR of various sizes can be extracted from the curve in figure 38. The advantage of this particular technique is that extrapolation can be made of the values for events with return periods well beyond the observed peak rainfall events (i.e. 50, 100 and 200 years return period) which were initially limited to the length of the historical data set (i.e. 34 years and less). However greater caution is needed in the application of the larger PMR return periods. In addition, the 24 hours, 3 hours and 1 hour duration PMR intensity is also provided for the only synoptic station at the Seychelles International Airport. A summary of the 24 hours Probable Maximum Rainfall (PMR) intensity and corresponding return periods is estimated for each respective rainfall hazard zone as indicated in table 7. The combination of rainfall hazard zones, Probable Maximum Rainfall (PMR) Intensity and return period (T) forms the overall rainfall hazard scenarios. Scenario 3 and 5 represents the worst and best case rainfall hazard scenarios respectively (fig 36).
0
50
100
150
200
250
300
350
400
1 10 100 1000
Return Period (Years)
Rai
nfal
l Int
rens
ity (m
m)
Airport24H-PMR
Hermitage24H-PMR
Airport3H-PMR
Airport1H-PMR
Aldabra24H-PMR
Anse La Mouche24H-PMR
Figure 38: Probable 24 Hours Maximum Rainfall (mm) for selected station in each of the rainfall zones. The Seychelles International Airport 24 hours, 3 hours and 1 hour PMR is also
shown. Farquhar PMR is not plotted It must be noted that the airport synoptic station is the only station in Seychelles recording hourly rainfall, but this station, loc ated on south(centre of Mahé is considered as not fully representative of the rain falling on the highest parts of the northern part of Mahé, which are significantly more intense. Consequently, the above probable rainfall should be considered as probably low with respect to northern part of Mahé.
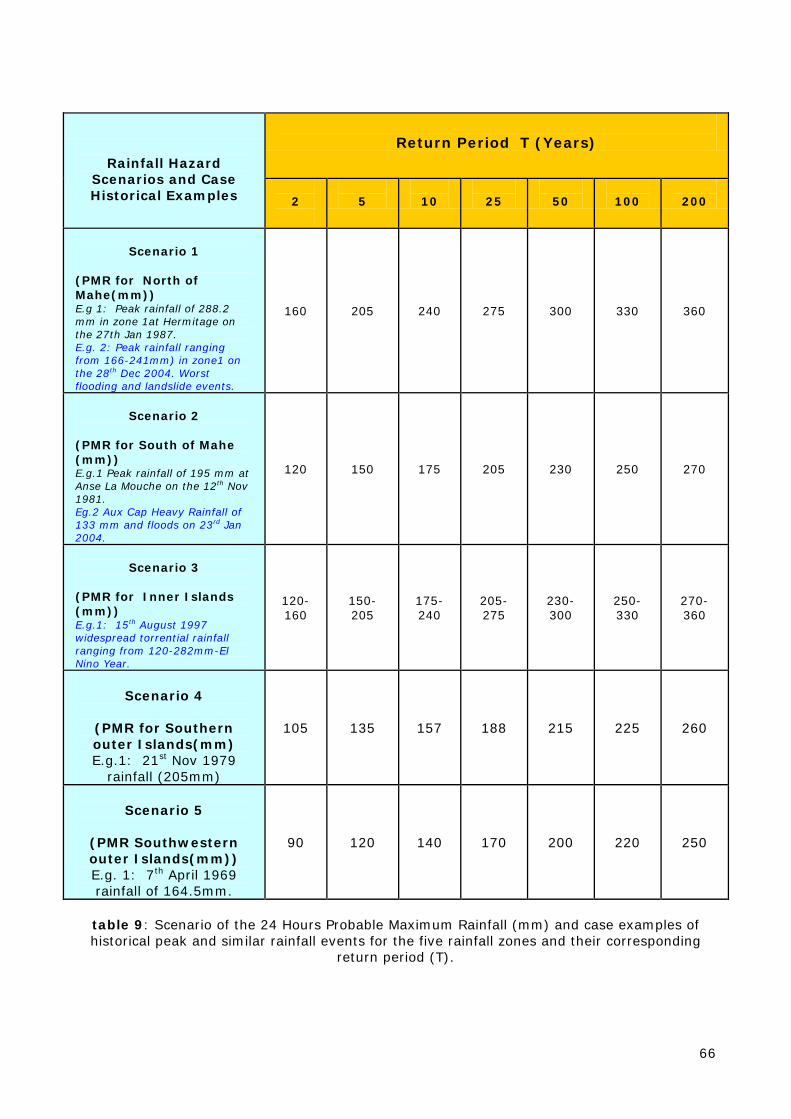
66
Rainfall Hazard
Scenarios and Case Historical Examples
Return Period T (Years)
2
5
10
25
50
100
200
Scenario 1
(PMR for North of Mahe(mm)) E.g 1: Peak rainfall of 288.2 mm in zone 1at Hermitage on the 27th Jan 1987. E.g. 2: Peak rainfall ranging from 166-241mm) in zone1 on the 28th Dec 2004. Worst flooding and landslide events.
160 205 240 275 300 330 360
Scenario 2
(PMR for South of Mahe (mm)) E.g.1 Peak rainfall of 195 mm at Anse La Mouche on the 12th Nov 1981. Eg.2 Aux Cap Heavy Rainfall of 133 mm and floods on 23rd Jan 2004.
120 150 175 205 230 250 270
Scenario 3
(PMR for Inner Islands (mm)) E.g.1: 15th August 1997 widespread torrential rainfall ranging from 120-282mm-El Nino Year.
120-160
150-205
175-240
205-275
230-300
250-330
270-360
Scenario 4
(PMR for Southern outer Islands(mm) E.g.1: 21st Nov 1979
rainfall (205mm)
105 135 157 188 215 225 260
Scenario 5
(PMR Southwestern outer Islands(mm)) E.g. 1: 7th April 1969 rainfall of 164.5mm.
90 120 140 170 200 220 250
table 9: Scenario of the 24 Hours Probable Maximum Rainfall (mm) and case examples of historical peak and similar rainfall events for the five rainfall zones and their corresponding
return period (T).
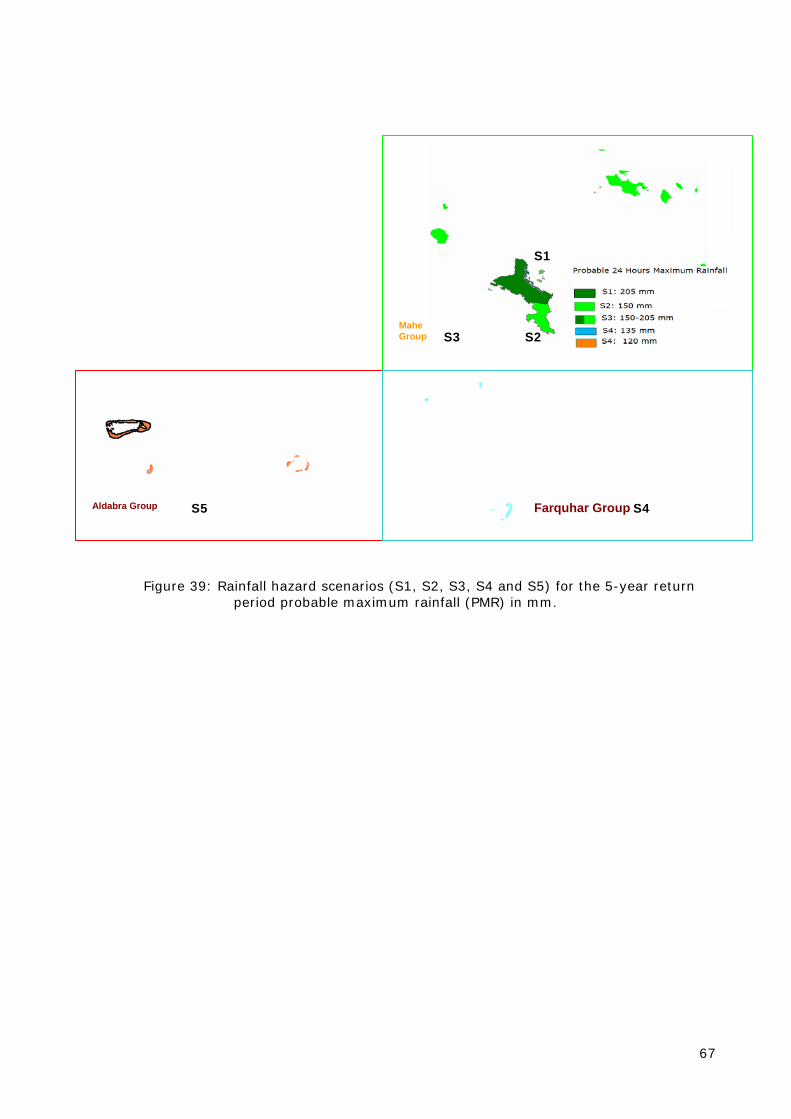
67
Figure 39: Rainfall hazard scenarios (S1, S2, S3, S4 and S5) for the 5-year return period probable maximum rainfall (PMR) in mm.
Aldabra Group Farquhar Group
Mahe Group
S1
S2
S4 S5
S3
68
9 FLOODS HAZARD The study of disasters in Seychelles has revealed a number of floods which concerned mostly the main populated Islands of Mahé, Praslin and La digue.
9.1 Hydrology of Seychelles The hydrology of Seychelles is known mostly for the main three granitic islands of Mahé, Praslin and La Digue. The flat coral Island have poor or no hydrologic data. They are not submitted to floods caused by heavy rainfalls but they are exposed to storms surges and submersion by sea level rise. The main Island of Mahé is characterized by 20 small and steep catchments. The steep slopes are found on both sides of the peaks in the central chain, with maximum slopes from 12,5% up to 25%. The lengths of the main rivers do not exceed 4 km on Mahé and 3,5 km on Praslin. The hydrographic basin surfaces are all smaller than 10 km². Flows and run-off of the rivers are quite well correlated to the rainfall intensity. However, infiltration, run-off coefficients are poorly known and studied. January is the month of the year with the most floods recorded but exceptions exist with some floods recorded from May to October during the SE monsoon. The most dramatic floods experienced b the country occurred in August 1997 in a season which is normally dry. The average yearly discharge for the major rivers is always inferior to 1 m3/s and closer to 0,5 m3/S for the major watershed of Mahé (Mare aux Cochon river) but huge values have bee recorded by gauges of PUC water corporation. During the August 1997 floods, a discharge of more than 76 m3/s was recorded on the Cascade river station.
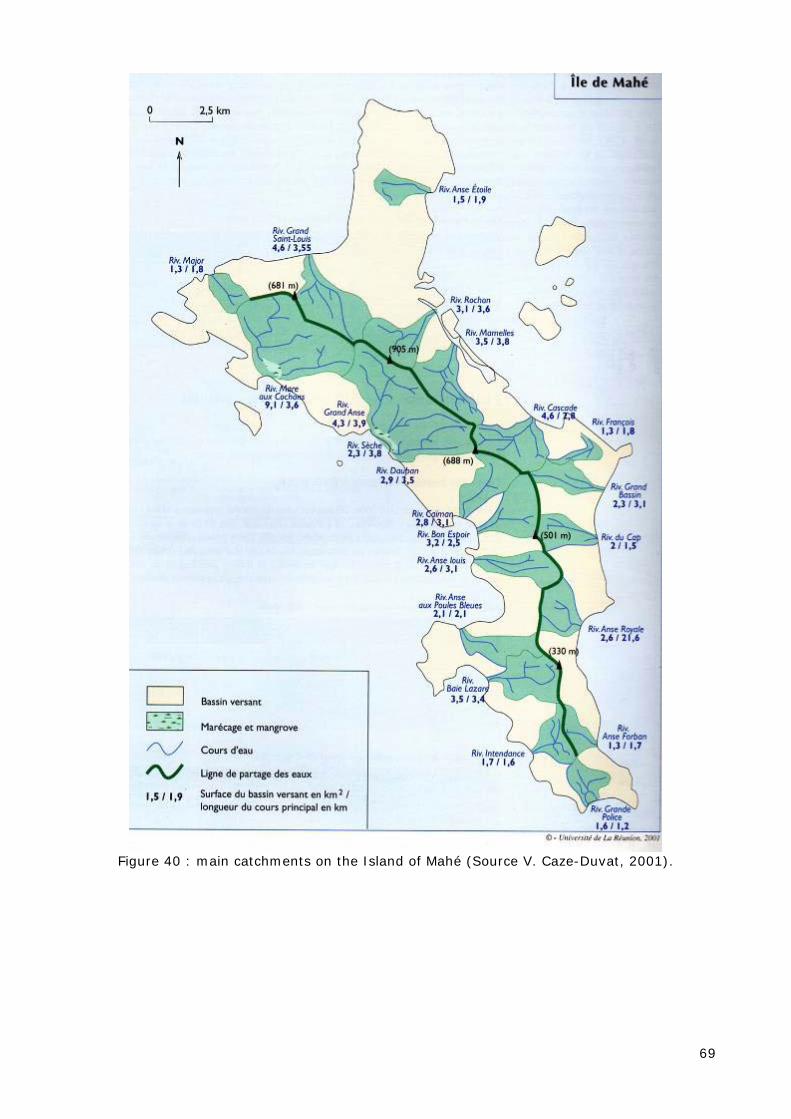
69
Figure 40 : main catchments on the Island of Mahé (Source V. Caze-Duvat, 2001).
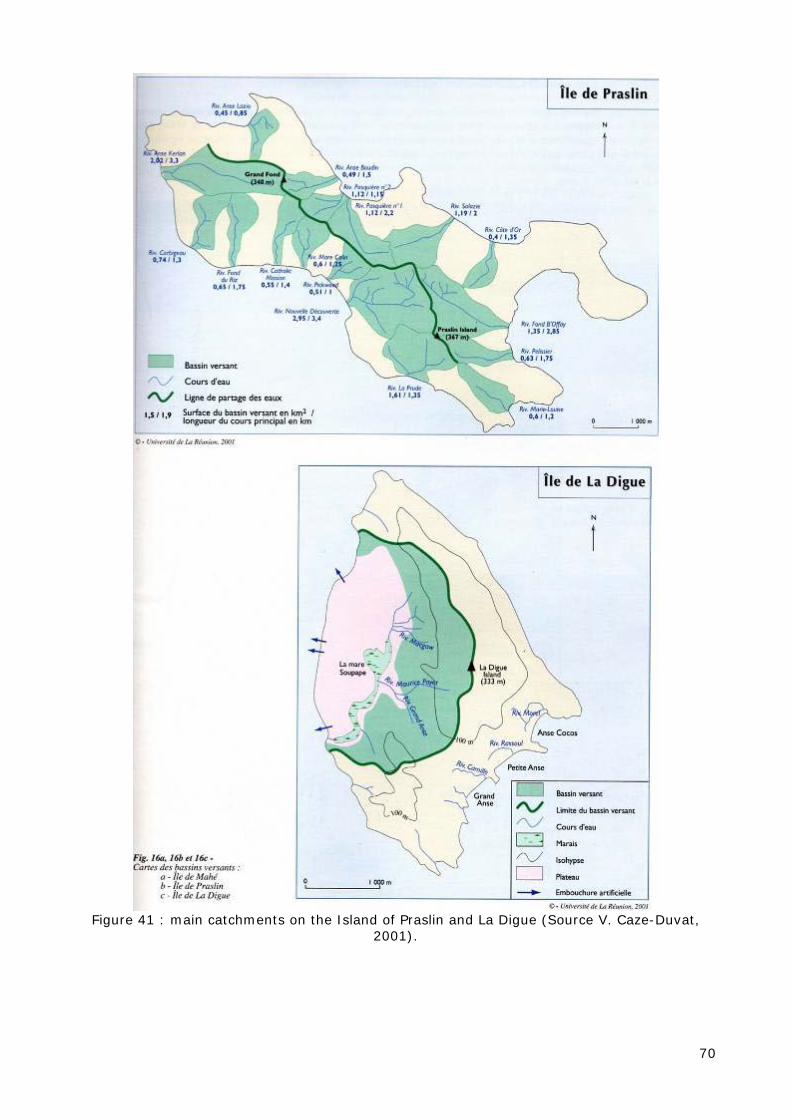
70
Figure 41 : main catchments on the Island of Praslin and La Digue (Source V. Caze-Duvat,
2001).
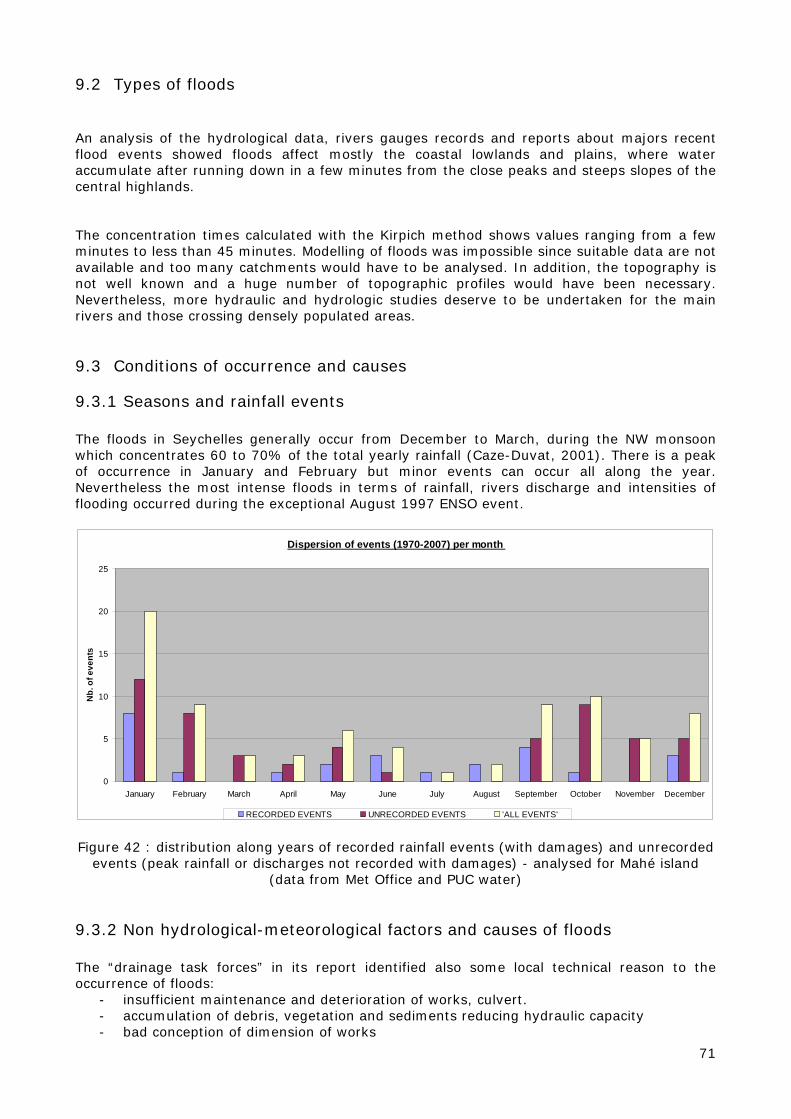
71
9.2 Types of floods An analysis of the hydrological data, rivers gauges records and reports about majors recent flood events showed floods affect mostly the coastal lowlands and plains, where water accumulate after running down in a few minutes from the close peaks and steeps slopes of the central highlands. The concentration times calculated with the Kirpich method shows values ranging from a few minutes to less than 45 minutes. Modelling of floods was impossible since suitable data are not available and too many catchments would have to be analysed. In addition, the topography is not well known and a huge number of topographic profiles would have been necessary. Nevertheless, more hydraulic and hydrologic studies deserve to be undertaken for the main rivers and those crossing densely populated areas.
9.3 Conditions of occurrence and causes
9.3.1 Seasons and rainfall events The floods in Seychelles generally occur from December to March, during the NW monsoon which concentrates 60 to 70% of the total yearly rainfall (Caze-Duvat, 2001). There is a peak of occurrence in January and February but minor events can occur all along the year. Nevertheless the most intense floods in terms of rainfall, rivers discharge and intensities of flooding occurred during the exceptional August 1997 ENSO event.
Dispersion of events (1970-2007) per month
0
5
10
15
20
25
January February March April May June July August September October November December
Nb.
of e
vent
s
RECORDED EVENTS UNRECORDED EVENTS 'ALL EVENTS'
Figure 42 : distribution along years of recorded rainfall events (with damages) and unrecorded events (peak rainfall or discharges not recorded with damages) - analysed for Mahé island
(data from Met Office and PUC water)
9.3.2 Non hydrological-meteorological factors and causes of floods The “drainage task forces” in its report identified also some local technical reason to the occurrence of floods:
- insufficient maintenance and deterioration of works, culvert. - accumulation of debris, vegetation and sediments reducing hydraulic capacity - bad conception of dimension of works
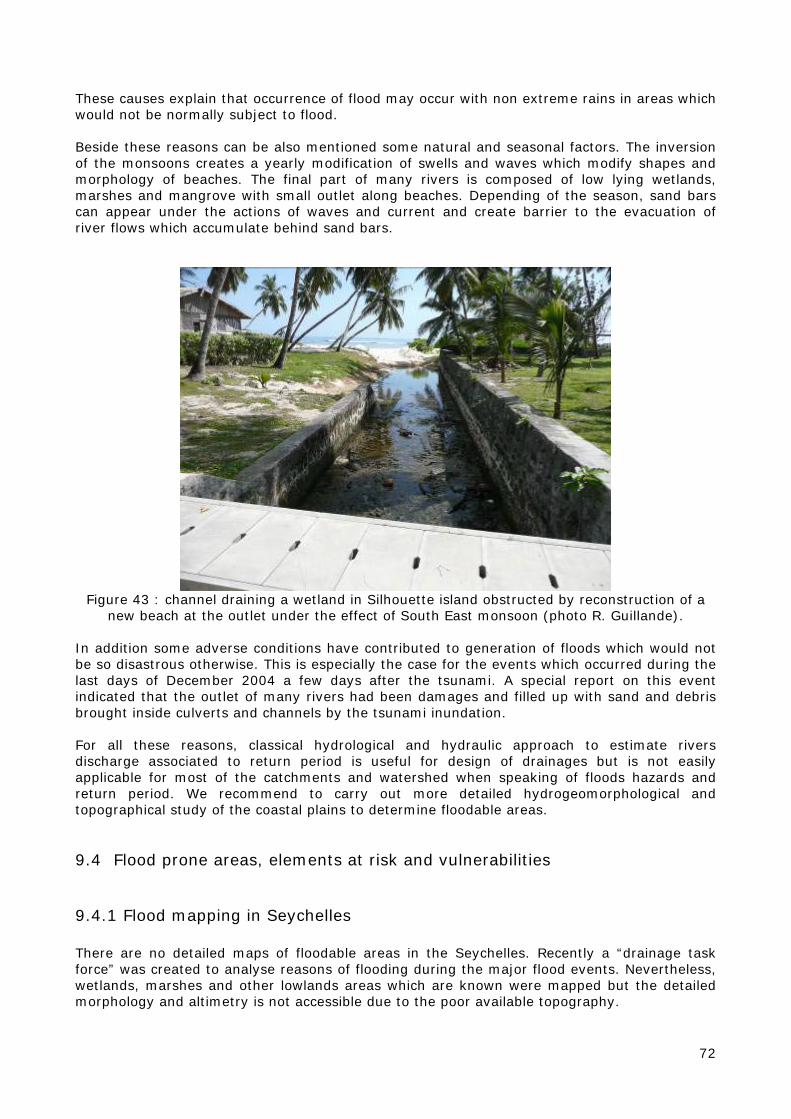
72
These causes explain that occurrence of flood may occur with non extreme rains in areas which would not be normally subject to flood. Beside these reasons can be also mentioned some natural and seasonal factors. The inversion of the monsoons creates a yearly modification of swells and waves which modify shapes and morphology of beaches. The final part of many rivers is composed of low lying wetlands, marshes and mangrove with small outlet along beaches. Depending of the season, sand bars can appear under the actions of waves and current and create barrier to the evacuation of river flows which accumulate behind sand bars.
Figure 43 : channel draining a wetland in Silhouette island obstructed by reconstruction of a
new beach at the outlet under the effect of South East monsoon (photo R. Guillande).
In addition some adverse conditions have contributed to generation of floods which would not be so disastrous otherwise. This is especially the case for the events which occurred during the last days of December 2004 a few days after the tsunami. A special report on this event indicated that the outlet of many rivers had been damages and filled up with sand and debris brought inside culverts and channels by the tsunami inundation. For all these reasons, classical hydrological and hydraulic approach to estimate rivers discharge associated to return period is useful for design of drainages but is not easily applicable for most of the catchments and watershed when speaking of floods hazards and return period. We recommend to carry out more detailed hydrogeomorphological and topographical study of the coastal plains to determine floodable areas.
9.4 Flood prone areas, elements at risk and vulnerabilities
9.4.1 Flood mapping in Seychelles There are no detailed maps of floodable areas in the Seychelles. Recently a “drainage task force” was created to analyse reasons of flooding during the major flood events. Nevertheless, wetlands, marshes and other lowlands areas which are known were mapped but the detailed morphology and altimetry is not accessible due to the poor available topography.
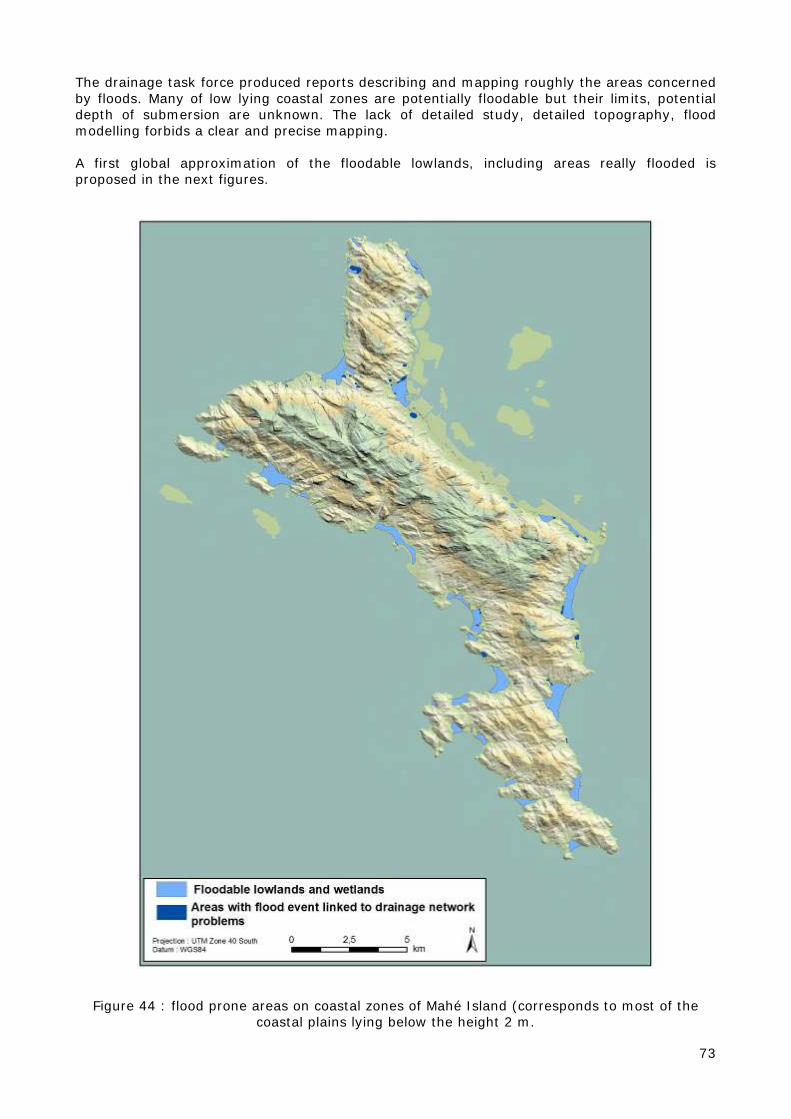
73
The drainage task force produced reports describing and mapping roughly the areas concerned by floods. Many of low lying coastal zones are potentially floodable but their limits, potential depth of submersion are unknown. The lack of detailed study, detailed topography, flood modelling forbids a clear and precise mapping. A first global approximation of the floodable lowlands, including areas really flooded is proposed in the next figures.
Figure 44 : flood prone areas on coastal zones of Mahé Island (corresponds to most of the coastal plains lying below the height 2 m.

74
Figure 45 : flood prone areas on coastal zones of Mahé Island (corresponds to most of the coastal plains lying below the height 2 m.
9.4.2 Vulnerability factors Some widespread factors which increase the vulnerability to flood hazard have been identified thanks to the field visits and interviews of specialists:
- Installation and settlements inside of the rim of wetlands of former wetlands, floodable areas, sometime reclaimed (in this last case insufficient drainage conception is added as human factors). In that case, it is difficult to invoke extreme conditions as constructions are installed in floodable areas sometime with no protection and no elevation of basement.
- Insufficient drainage capacity and reduction, obstruction of drains and rivers by dense constructions along or inside rivers beds.
- Absence of drainage to divert flow from construction in streams and rivers beds. - Very rare application of simple measures such as elevated basements of construction
on pillars inside or close to floodable, estuaries, wetlands. - Loss of old practices of flood preventive or mitigation measures in recent constructions.
It is very easy to observe that old houses and “case” close to rivers or shoreline in lowlands were built on elevated basement or on piles and pillars.

75
Figure 46 : old traditional practice of construction on pillars or elevated basements in colonial
houses and cases close to rivers or beaches in low lands
Figure 47 : Absence of protection and basement at same elevation than ground level in recent
construction. On the right the recent house was build on an elevated basement.
Figure 48 : medical centers in Silhouette (left) and La Digue (Right) both build on the beaches
with ground basement at same level than natural soils. An analysis of the existing regulation concerning constructions in hazard exposed areas reveals that there are only recommendations which are not considered as mandatory and are applied - or not - by decision of the constructors.
76
There is a lack of construction rules specific to hazards exposed area. Land use mapping and planning taking in account the exposure to natural phenomenon are also missing. The main and first reason is the absence of detailed knowledge and mapping of exposed areas. Only the major development project are committed to define, model and control the exposure to natural phenomenon and hazards, in the framework of the preliminary Environmental Impact Assessment (EIA). Most of the individual or small construction project are not so severely monitored and constrained by environmental regulations. The only concrete measure which seems to be partly observed but is not only done for protection against coastal hazards is the step back measure which forbids construction on a 25 m strip along the beach.
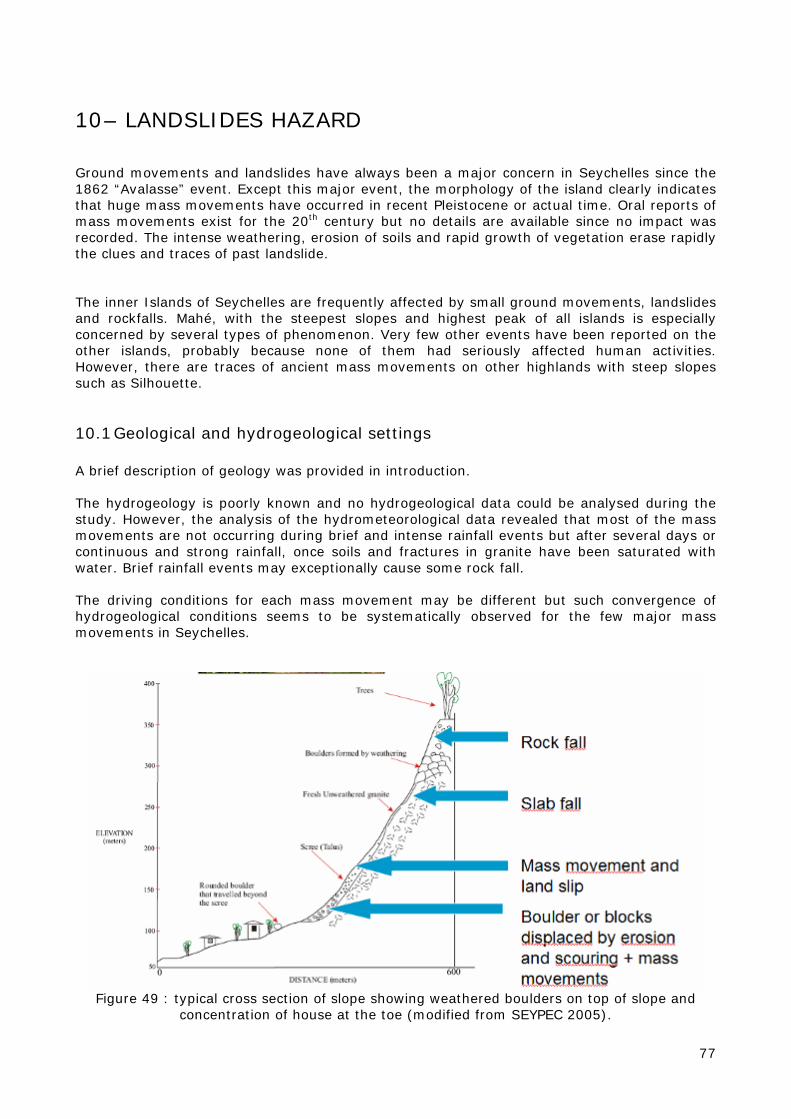
77
10 – LANDSLIDES HAZARD Ground movements and landslides have always been a major concern in Seychelles since the 1862 “Avalasse” event. Except this major event, the morphology of the island clearly indicates that huge mass movements have occurred in recent Pleistocene or actual time. Oral reports of mass movements exist for the 20th century but no details are available since no impact was recorded. The intense weathering, erosion of soils and rapid growth of vegetation erase rapidly the clues and traces of past landslide. The inner Islands of Seychelles are frequently affected by small ground movements, landslides and rockfalls. Mahé, with the steepest slopes and highest peak of all islands is especially concerned by several types of phenomenon. Very few other events have been reported on the other islands, probably because none of them had seriously affected human activities. However, there are traces of ancient mass movements on other highlands with steep slopes such as Silhouette.
10.1 Geological and hydrogeological settings A brief description of geology was provided in introduction. The hydrogeology is poorly known and no hydrogeological data could be analysed during the study. However, the analysis of the hydrometeorological data revealed that most of the mass movements are not occurring during brief and intense rainfall events but after several days or continuous and strong rainfall, once soils and fractures in granite have been saturated with water. Brief rainfall events may exceptionally cause some rock fall. The driving conditions for each mass movement may be different but such convergence of hydrogeological conditions seems to be systematically observed for the few major mass movements in Seychelles.
Figure 49 : typical cross section of slope showing weathered boulders on top of slope and
concentration of house at the toe (modified from SEYPEC 2005).

78
10.2 Types of ground movements
10.2.1 Mudflows There are no real recent evidence of mudflow in Seychelles. However, the available descriptions of the great 1862 “Avalasse” suggest that the original mass movement which took place somewhere above the city of Victoria, finished its course on the city as a mudflow. From a report the Civil Commissioner’s Office 1862, the following description is available: A “Cyclone” apparently hit Seychelles, with Mahé mainly affected. The “cyclone” or depression was of small diameter as a boat at 30 miles did not suffered much.” The storm was at the most intense on Mahé and La Digue but still calm in Frégate. Winds were estimated to up to 64-72 Mph (103-116Kph); W-NW direction. (wind max. Force 11) on 12th October evening. Heavy rain started on the 10th October and continued till the 12th. No destruction are known in Praslin and Curieuse; Raincloud burst over 3 Frères Mountain between 11 and 12 am, 12th october. A huge landslip (mudflow mixing rocks, mud, vegetal and trees) buried Mahe. Localisation of the mudflow: eastern slopes of the mountain over Port Victoria (Mr. Cauvin’s residence & ‘Ma Retraite’); police and prison yards, Victoria street, Royal Street, Anglican Church, Cluny Orphanage, old cemetery, Government House. The affected area in town was covered with 3 to 4 feets of mud. (90-120cm) St Louis river bed filled with mud and displaced; its ravine has been locally considerably deepened. The mud flow has an extension of 2000 feet (610m). The flow runs along Saint Louis river. Extended the land of several tens of meters in the lagoon. (now Victoria and Albert Streets, Gordon Square) The mud covers the sea and extends 400 feet (122m) away from the port wharf. Boulders of 50 to 75 tons were displaced and the largest could be less than 600 tons. Numerous landslips were observed all along the coasts; most destructive at Plaisance and Paris (24 killed); less destructive at Bel Ombre, Pointe Capucins , Anse Boileau, Mountain Dariz. A list of damages was found in colonial reports. The recorded damages were:
• All bridges in Victoria (11) destroyed. • All roads severely damaged. • 613 huts and house destroyed • 5 stones houses damaged • 116 wooden houses damaged • 30000 coconut trees blew down (= crops) • 22 boats sunk • min. 70 victims; >100? • No victims on other islands and few damages on Praslin. No food scarcity as potatoes
and manioc plantations were not destroyed. • More houses and huts destroyed in the south of Mahe (108) than in the north (7) • Curieuse: no damage; Praslin: very little damages; Ste Anne: considerable destruction
of coconut trees; Cerf island: small loss of coconut trees. The hypothesis of formation for the mudflow is an accumulation on water in basins or steps in upper part of concave slopes which saturates all slopes and masses of sediments accumulated and depressions. The outlet of this depression being a ravine obstructed by blocks, the earth is forced and breaks under pressure of the mass retained above and flows through the ravine at considerable speed. The mud flow came down from the upper part of the Saint Louis river catchment through the city of Victoria, destroying several tens of houses. A tentative map of the mudflow is proposed below from the reports.
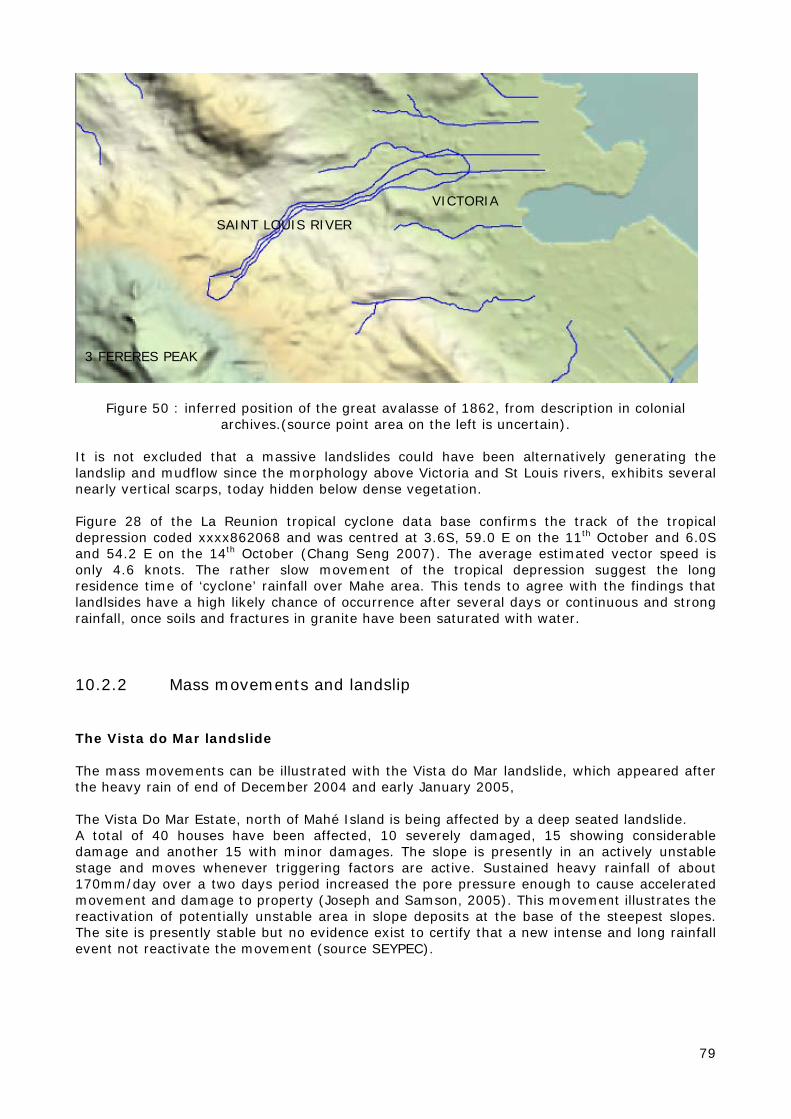
79
Figure 50 : inferred position of the great avalasse of 1862, from description in colonial archives.(source point area on the left is uncertain).
It is not excluded that a massive landslides could have been alternatively generating the landslip and mudflow since the morphology above Victoria and St Louis rivers, exhibits several nearly vertical scarps, today hidden below dense vegetation. Figure 28 of the La Reunion tropical cyclone data base confirms the track of the tropical depression coded xxxx862068 and was centred at 3.6S, 59.0 E on the 11th October and 6.0S and 54.2 E on the 14th October (Chang Seng 2007). The average estimated vector speed is only 4.6 knots. The rather slow movement of the tropical depression suggest the long residence time of ‘cyclone’ rainfall over Mahe area. This tends to agree with the findings that landlsides have a high likely chance of occurrence after several days or continuous and strong rainfall, once soils and fractures in granite have been saturated with water.
10.2.2 Mass movements and landslip The Vista do Mar landslide The mass movements can be illustrated with the Vista do Mar landslide, which appeared after the heavy rain of end of December 2004 and early January 2005, The Vista Do Mar Estate, north of Mahé Island is being affected by a deep seated landslide. A total of 40 houses have been affected, 10 severely damaged, 15 showing considerable damage and another 15 with minor damages. The slope is presently in an actively unstable stage and moves whenever triggering factors are active. Sustained heavy rainfall of about 170mm/day over a two days period increased the pore pressure enough to cause accelerated movement and damage to property (Joseph and Samson, 2005). This movement illustrates the reactivation of potentially unstable area in slope deposits at the base of the steepest slopes. The site is presently stable but no evidence exist to certify that a new intense and long rainfall event not reactivate the movement (source SEYPEC).
SAINT LOUIS RIVER
3 FERERES PEAK
VICTORIA
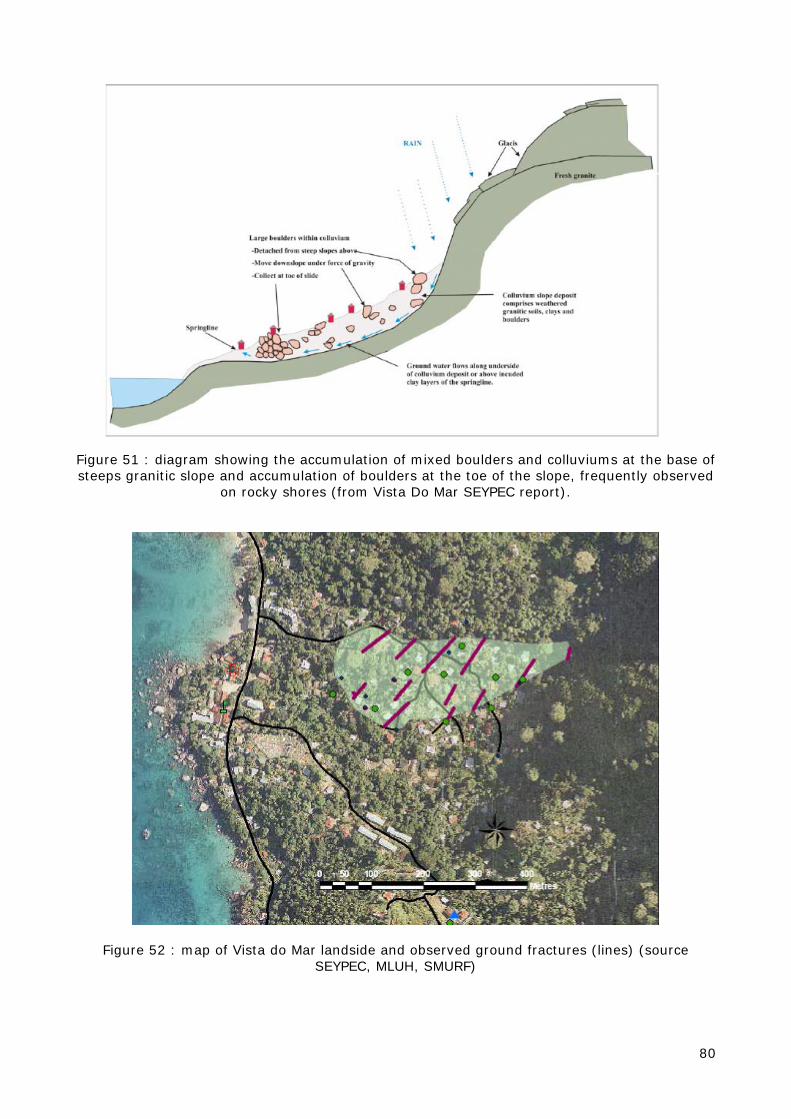
80
Figure 51 : diagram showing the accumulation of mixed boulders and colluviums at the base of steeps granitic slope and accumulation of boulders at the toe of the slope, frequently observed
on rocky shores (from Vista Do Mar SEYPEC report).
Figure 52 : map of Vista do Mar landside and observed ground fractures (lines) (source SEYPEC, MLUH, SMURF)
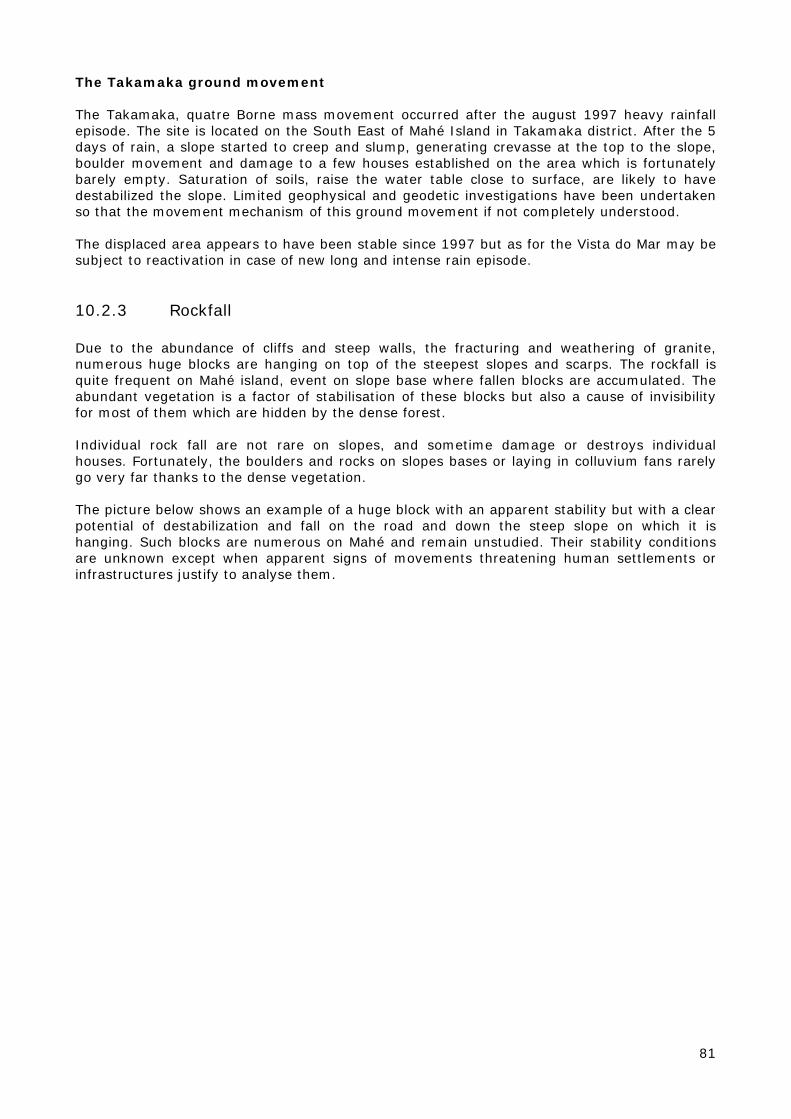
81
The Takamaka ground movement The Takamaka, quatre Borne mass movement occurred after the august 1997 heavy rainfall episode. The site is located on the South East of Mahé Island in Takamaka district. After the 5 days of rain, a slope started to creep and slump, generating crevasse at the top to the slope, boulder movement and damage to a few houses established on the area which is fortunately barely empty. Saturation of soils, raise the water table close to surface, are likely to have destabilized the slope. Limited geophysical and geodetic investigations have been undertaken so that the movement mechanism of this ground movement if not completely understood. The displaced area appears to have been stable since 1997 but as for the Vista do Mar may be subject to reactivation in case of new long and intense rain episode.
10.2.3 Rockfall Due to the abundance of cliffs and steep walls, the fracturing and weathering of granite, numerous huge blocks are hanging on top of the steepest slopes and scarps. The rockfall is quite frequent on Mahé island, event on slope base where fallen blocks are accumulated. The abundant vegetation is a factor of stabilisation of these blocks but also a cause of invisibility for most of them which are hidden by the dense forest. Individual rock fall are not rare on slopes, and sometime damage or destroys individual houses. Fortunately, the boulders and rocks on slopes bases or laying in colluvium fans rarely go very far thanks to the dense vegetation. The picture below shows an example of a huge block with an apparent stability but with a clear potential of destabilization and fall on the road and down the steep slope on which it is hanging. Such blocks are numerous on Mahé and remain unstudied. Their stability conditions are unknown except when apparent signs of movements threatening human settlements or infrastructures justify to analyse them.

82
Figure 53 : hanging block along a road on a steep slope of Mahé island.
Labati rockfall. The Labati rockfall is a set of massive boulder hanging at the top of a cliff. Some of them fell down from the top during March 2002. The analysis by local geologist showed that the blocks were separated by faults and fractures, dipping toward the slope and could slide easily. It can be noticed that the 11 March 2002 rockfall at Labati did not occur during a heavy rain episode but at the end of the North West monsoon season. The site had to be purged from the remaining dangerous blocks. The potential locations for such rockfalls from cliffs, walls and scarps, or boulders rolling in slope base are extremely numerous and would deserve a proper mapping. To date, the areas subject to such hazard are not mapped and approximately known when some events occurred and causes damages.
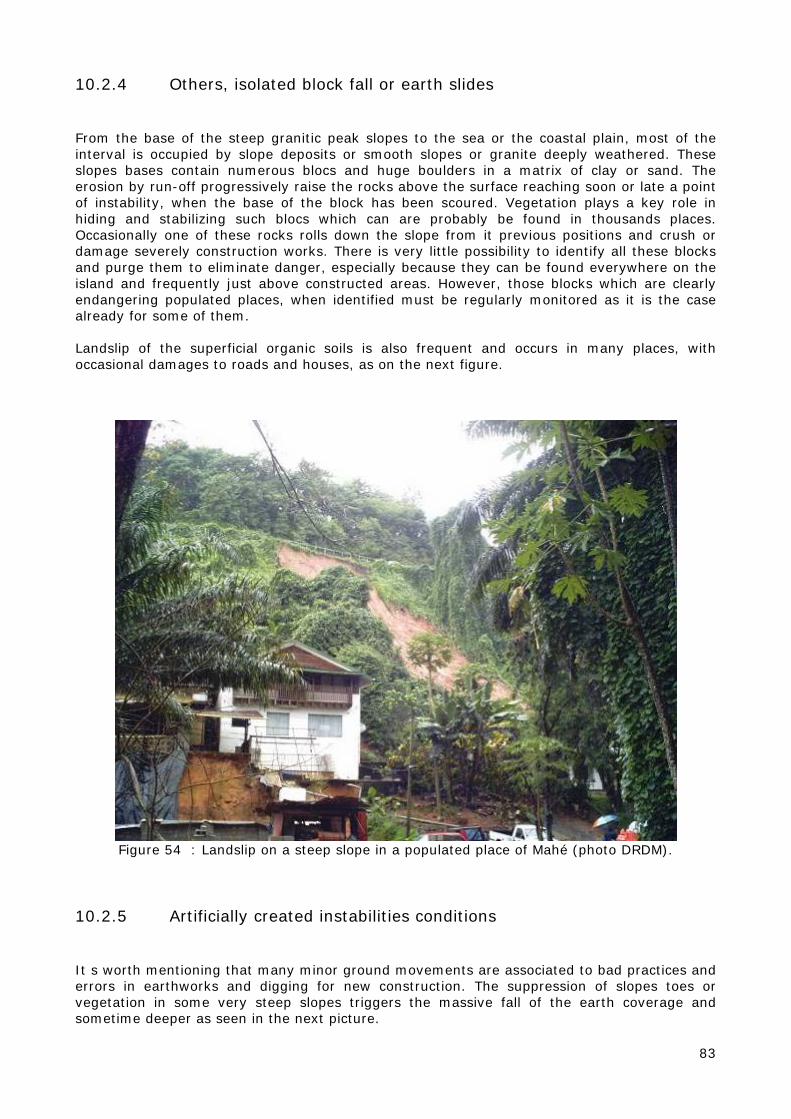
83
10.2.4 Others, isolated block fall or earth slides From the base of the steep granitic peak slopes to the sea or the coastal plain, most of the interval is occupied by slope deposits or smooth slopes or granite deeply weathered. These slopes bases contain numerous blocs and huge boulders in a matrix of clay or sand. The erosion by run-off progressively raise the rocks above the surface reaching soon or late a point of instability, when the base of the block has been scoured. Vegetation plays a key role in hiding and stabilizing such blocs which can are probably be found in thousands places. Occasionally one of these rocks rolls down the slope from it previous positions and crush or damage severely construction works. There is very little possibility to identify all these blocks and purge them to eliminate danger, especially because they can be found everywhere on the island and frequently just above constructed areas. However, those blocks which are clearly endangering populated places, when identified must be regularly monitored as it is the case already for some of them. Landslip of the superficial organic soils is also frequent and occurs in many places, with occasional damages to roads and houses, as on the next figure.
Figure 54 : Landslip on a steep slope in a populated place of Mahé (photo DRDM).
10.2.5 Artificially created instabilities conditions It s worth mentioning that many minor ground movements are associated to bad practices and errors in earthworks and digging for new construction. The suppression of slopes toes or vegetation in some very steep slopes triggers the massive fall of the earth coverage and sometime deeper as seen in the next picture.
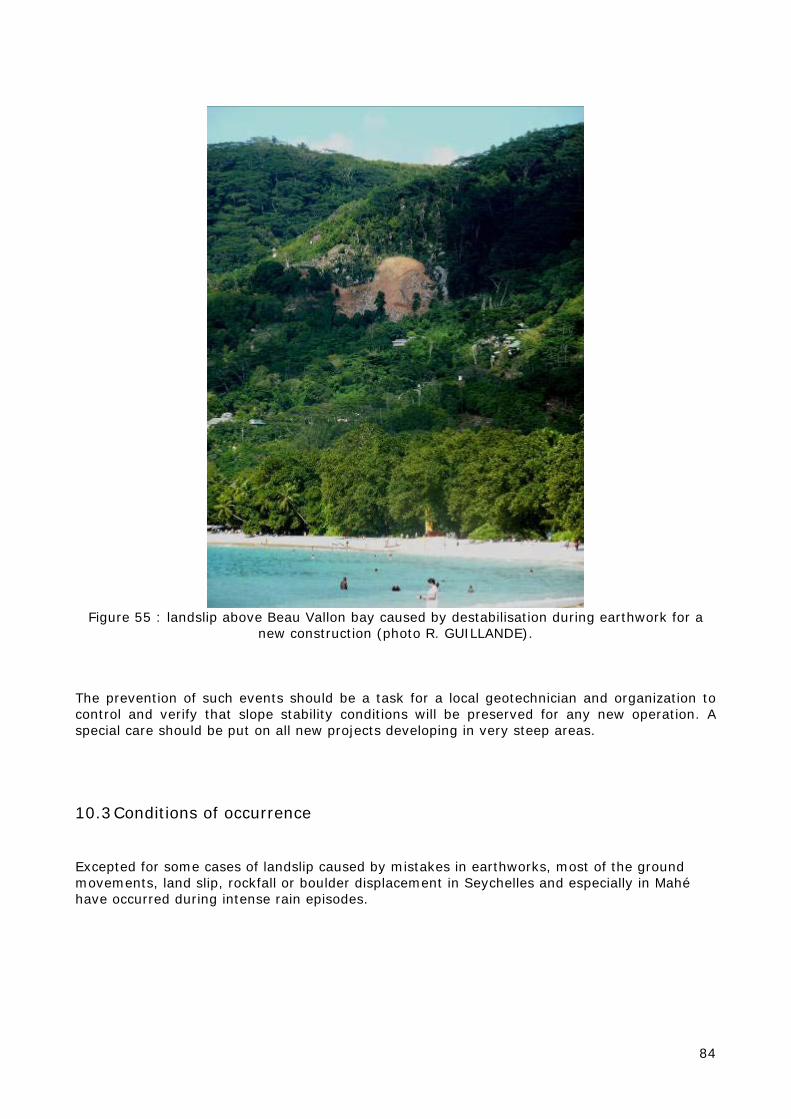
84
Figure 55 : landslip above Beau Vallon bay caused by destabilisation during earthwork for a
new construction (photo R. GUILLANDE). The prevention of such events should be a task for a local geotechnician and organization to control and verify that slope stability conditions will be preserved for any new operation. A special care should be put on all new projects developing in very steep areas.
10.3 Conditions of occurrence Excepted for some cases of landslip caused by mistakes in earthworks, most of the ground movements, land slip, rockfall or boulder displacement in Seychelles and especially in Mahé have occurred during intense rain episodes.
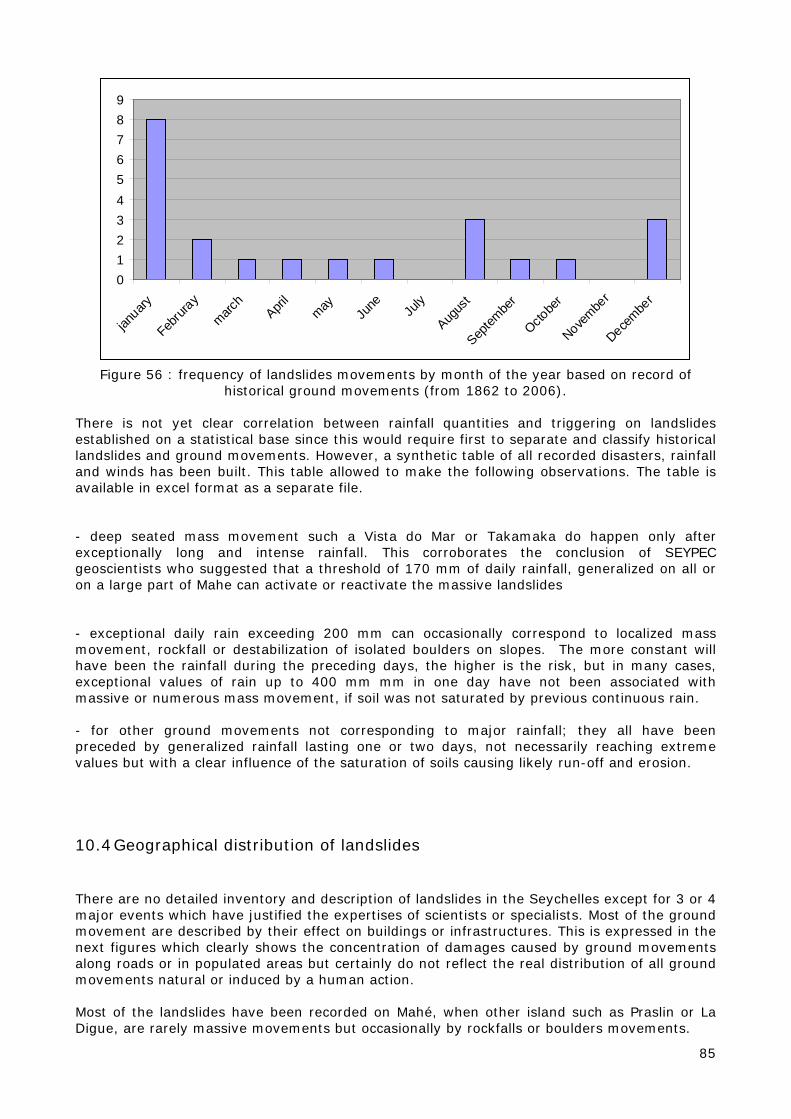
85
0123456789
january
Februr
aymarc
hApri
lmay
June Ju
ly
Augus
t
Septem
ber
Octobe
r
Novembe
r
Decembe
r
Figure 56 : frequency of landslides movements by month of the year based on record of
historical ground movements (from 1862 to 2006). There is not yet clear correlation between rainfall quantities and triggering on landslides established on a statistical base since this would require first to separate and classify historical landslides and ground movements. However, a synthetic table of all recorded disasters, rainfall and winds has been built. This table allowed to make the following observations. The table is available in excel format as a separate file. - deep seated mass movement such a Vista do Mar or Takamaka do happen only after exceptionally long and intense rainfall. This corroborates the conclusion of SEYPEC geoscientists who suggested that a threshold of 170 mm of daily rainfall, generalized on all or on a large part of Mahe can activate or reactivate the massive landslides - exceptional daily rain exceeding 200 mm can occasionally correspond to localized mass movement, rockfall or destabilization of isolated boulders on slopes. The more constant will have been the rainfall during the preceding days, the higher is the risk, but in many cases, exceptional values of rain up to 400 mm mm in one day have not been associated with massive or numerous mass movement, if soil was not saturated by previous continuous rain. - for other ground movements not corresponding to major rainfall; they all have been preceded by generalized rainfall lasting one or two days, not necessarily reaching extreme values but with a clear influence of the saturation of soils causing likely run-off and erosion.
10.4 Geographical distribution of landslides There are no detailed inventory and description of landslides in the Seychelles except for 3 or 4 major events which have justified the expertises of scientists or specialists. Most of the ground movement are described by their effect on buildings or infrastructures. This is expressed in the next figures which clearly shows the concentration of damages caused by ground movements along roads or in populated areas but certainly do not reflect the real distribution of all ground movements natural or induced by a human action. Most of the landslides have been recorded on Mahé, when other island such as Praslin or La Digue, are rarely massive movements but occasionally by rockfalls or boulders movements.
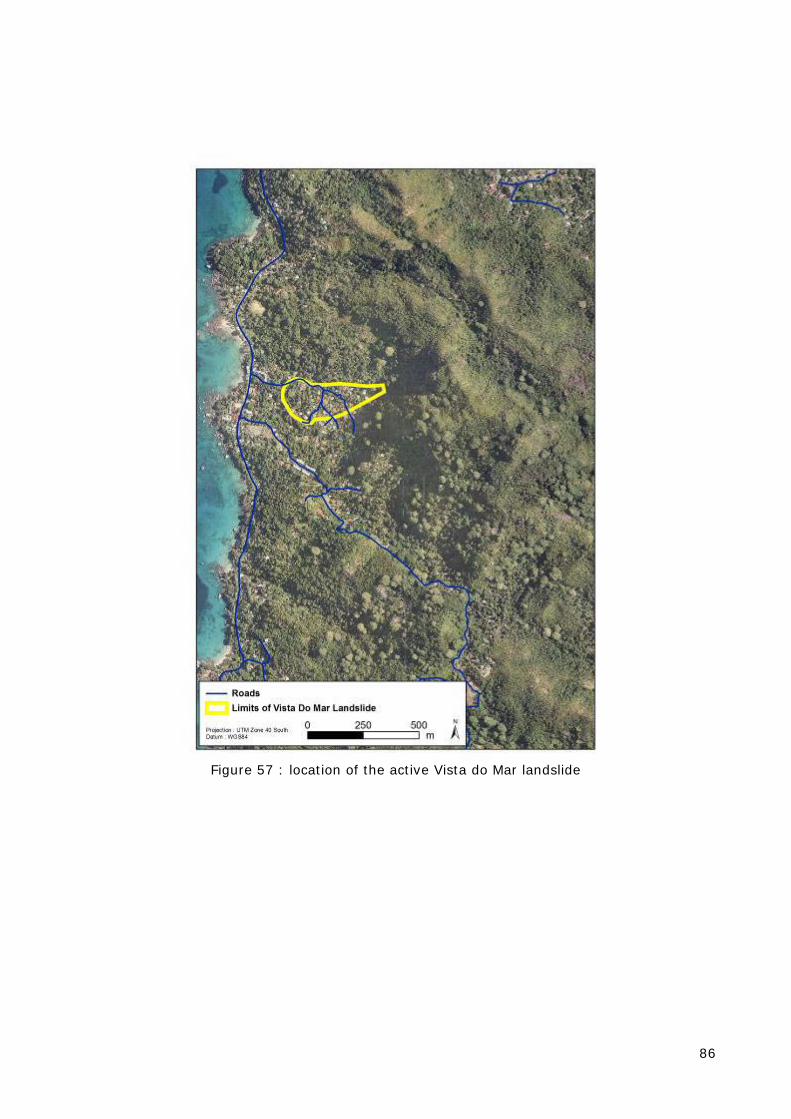
86
Figure 57 : location of the active Vista do Mar landslide
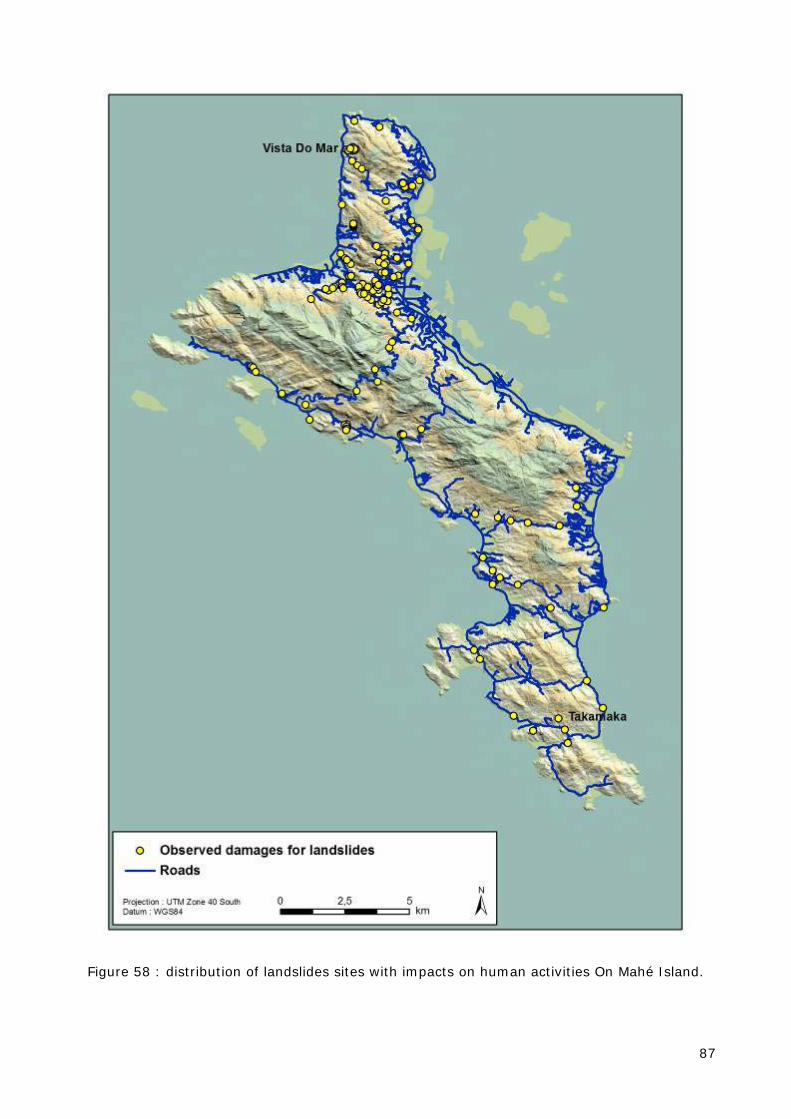
87
Figure 58 : distribution of landslides sites with impacts on human activities On Mahé Island.
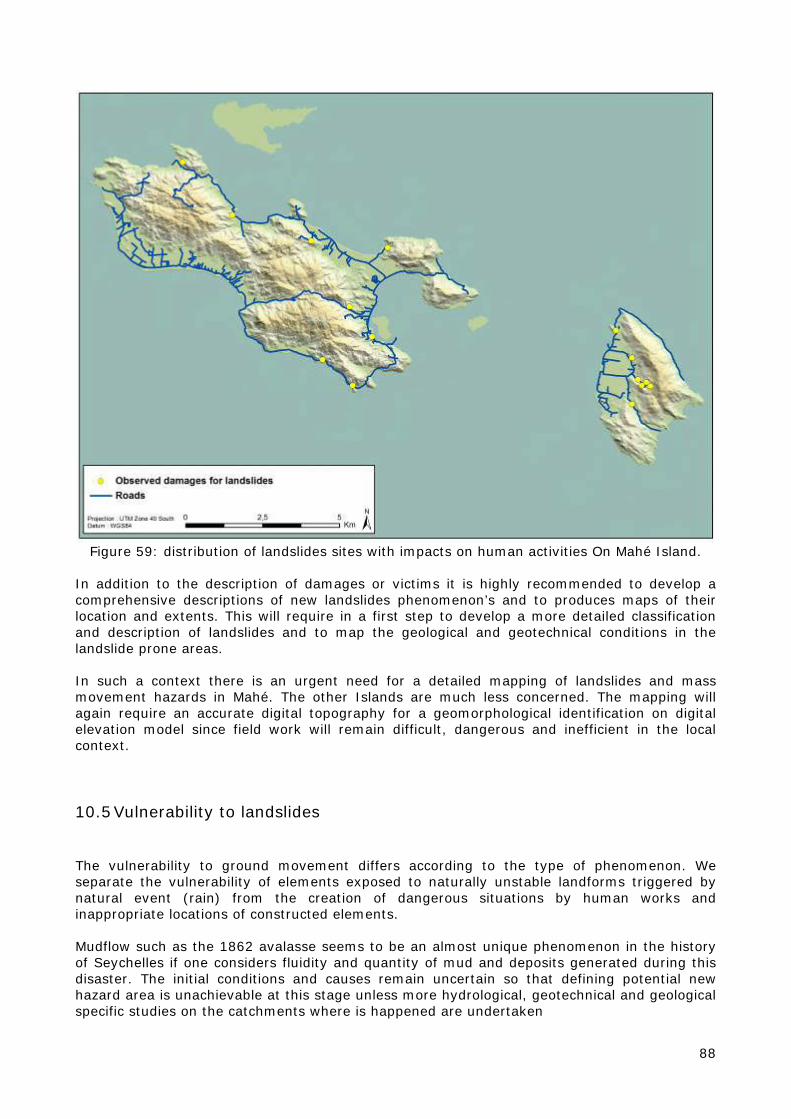
88
Figure 59: distribution of landslides sites with impacts on human activities On Mahé Island.
In addition to the description of damages or victims it is highly recommended to develop a comprehensive descriptions of new landslides phenomenon’s and to produces maps of their location and extents. This will require in a first step to develop a more detailed classification and description of landslides and to map the geological and geotechnical conditions in the landslide prone areas. In such a context there is an urgent need for a detailed mapping of landslides and mass movement hazards in Mahé. The other Islands are much less concerned. The mapping will again require an accurate digital topography for a geomorphological identification on digital elevation model since field work will remain difficult, dangerous and inefficient in the local context.
10.5 Vulnerability to landslides The vulnerability to ground movement differs according to the type of phenomenon. We separate the vulnerability of elements exposed to naturally unstable landforms triggered by natural event (rain) from the creation of dangerous situations by human works and inappropriate locations of constructed elements. Mudflow such as the 1862 avalasse seems to be an almost unique phenomenon in the history of Seychelles if one considers fluidity and quantity of mud and deposits generated during this disaster. The initial conditions and causes remain uncertain so that defining potential new hazard area is unachievable at this stage unless more hydrological, geotechnical and geological specific studies on the catchments where is happened are undertaken
89
For mass movement, all constructions or infrastructures built on the sliding areas or in front of the toe can experience slight damages to total destruction For rockfall or blocks on hanging walls, the trajectory of the blocks and distance covered in case of fall is uncertain and oblige to consider a large fanshape area below the unstable blocks. Such unstable cliff rims are extremely numerous, especially on Mahé and assessing the individual risk on populated places would require first to carry out an inventory and mapping of these potential rockfall areas. Such an inventory does not exist. The risk due isolated boulder fall or destabilization which occurs on talus or slope deposits is event more difficult to assess since, there are numerous houses established on apparently stable slopes but where erosion and scouring of blocks basement during heavy rains can generate a single massive block tilt and fall, when surrounding environment remain totally stable. This can happen somewhat randomly on all slopes of Mahé but zoning these areas of steep slopes with exposed boulders blocks at surface, even in forested zone would be a first step to assessment of this fuzzy risk. It has to be noticed that since decades the talus and glacis slopes on Mahé Island have been progressively constructed, more or less legally as flat and low coastal plains started to be saturated and prices of good land plots were raising. The landslide and ground movements hazard being unmapped, it is not possible to produce a vulnerability map for landslides. Vulnerability still has to be analysed case by case according to local conditions and available geological, geotechnical and hydrological data. A second type of vulnerability exist which is generated by creation of potential (hazard) instabilities by inappropriate location and application of geotechnical rules. Reduction of vulnerability will progress mostly through a more detailed control of construction sites ands conditions during land works by experienced geotechnical or civil engineering specialists. Clear rules and regulation must be written and eventually a foreign existing code can be employed if no local expertise can produce at short term regulation or codes for geotechnical stability of constructions. Training of engineers and architects, enforcement of codes and increase consultation of DRDM or other national experts (including decision power on allowing or not constructions after controls) is recommended. The problems concerns mainly the auto-constructed houses or small building installed on steep slopes by individual owners.
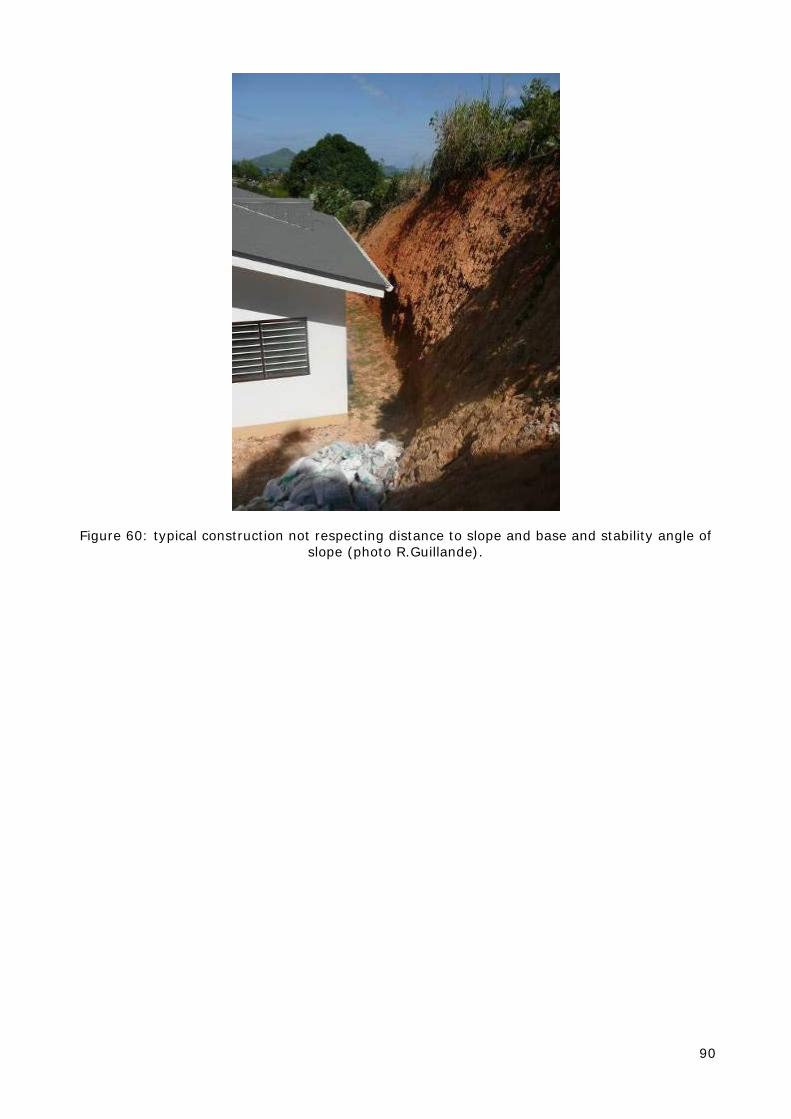
90
Figure 60: typical construction not respecting distance to slope and base and stability angle of slope (photo R.Guillande).
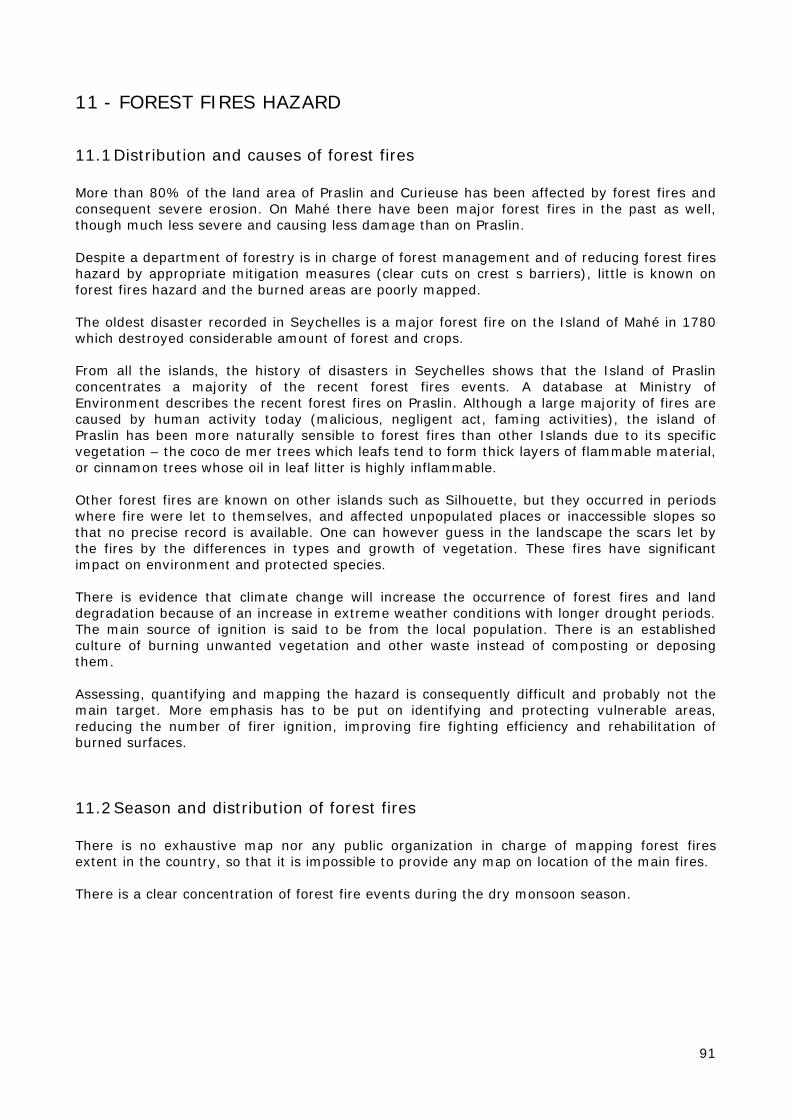
91
11 - FOREST FIRES HAZARD
11.1 Distribution and causes of forest fires More than 80% of the land area of Praslin and Curieuse has been affected by forest fires and consequent severe erosion. On Mahé there have been major forest fires in the past as well, though much less severe and causing less damage than on Praslin. Despite a department of forestry is in charge of forest management and of reducing forest fires hazard by appropriate mitigation measures (clear cuts on crest s barriers), little is known on forest fires hazard and the burned areas are poorly mapped. The oldest disaster recorded in Seychelles is a major forest fire on the Island of Mahé in 1780 which destroyed considerable amount of forest and crops. From all the islands, the history of disasters in Seychelles shows that the Island of Praslin concentrates a majority of the recent forest fires events. A database at Ministry of Environment describes the recent forest fires on Praslin. Although a large majority of fires are caused by human activity today (malicious, negligent act, faming activities), the island of Praslin has been more naturally sensible to forest fires than other Islands due to its specific vegetation – the coco de mer trees which leafs tend to form thick layers of flammable material, or cinnamon trees whose oil in leaf litter is highly inflammable. Other forest fires are known on other islands such as Silhouette, but they occurred in periods where fire were let to themselves, and affected unpopulated places or inaccessible slopes so that no precise record is available. One can however guess in the landscape the scars let by the fires by the differences in types and growth of vegetation. These fires have significant impact on environment and protected species. There is evidence that climate change will increase the occurrence of forest fires and land degradation because of an increase in extreme weather conditions with longer drought periods. The main source of ignition is said to be from the local population. There is an established culture of burning unwanted vegetation and other waste instead of composting or deposing them. Assessing, quantifying and mapping the hazard is consequently difficult and probably not the main target. More emphasis has to be put on identifying and protecting vulnerable areas, reducing the number of firer ignition, improving fire fighting efficiency and rehabilitation of burned surfaces.
11.2 Season and distribution of forest fires There is no exhaustive map nor any public organization in charge of mapping forest fires extent in the country, so that it is impossible to provide any map on location of the main fires. There is a clear concentration of forest fire events during the dry monsoon season.
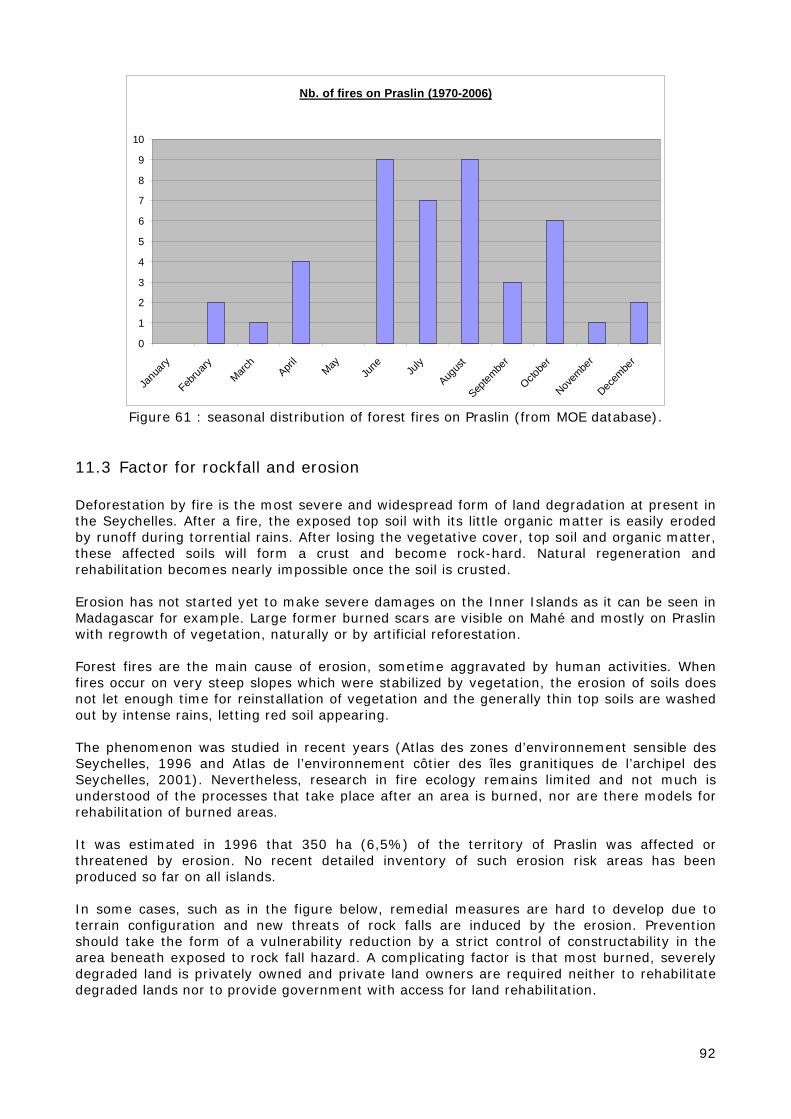
92
Nb. of fires on Praslin (1970-2006)
0
1
2
3
4
5
6
7
8
9
10
Janu
ary
Februa
ryMarc
hApri
lMay
June Ju
ly
Augus
t
Septem
ber
Octobe
r
Novem
ber
Decem
ber
Figure 61 : seasonal distribution of forest fires on Praslin (from MOE database).
11.3 Factor for rockfall and erosion Deforestation by fire is the most severe and widespread form of land degradation at present in the Seychelles. After a fire, the exposed top soil with its little organic matter is easily eroded by runoff during torrential rains. After losing the vegetative cover, top soil and organic matter, these affected soils will form a crust and become rock-hard. Natural regeneration and rehabilitation becomes nearly impossible once the soil is crusted. Erosion has not started yet to make severe damages on the Inner Islands as it can be seen in Madagascar for example. Large former burned scars are visible on Mahé and mostly on Praslin with regrowth of vegetation, naturally or by artificial reforestation. Forest fires are the main cause of erosion, sometime aggravated by human activities. When fires occur on very steep slopes which were stabilized by vegetation, the erosion of soils does not let enough time for reinstallation of vegetation and the generally thin top soils are washed out by intense rains, letting red soil appearing. The phenomenon was studied in recent years (Atlas des zones d’environnement sensible des Seychelles, 1996 and Atlas de l’environnement côtier des îles granitiques de l’archipel des Seychelles, 2001). Nevertheless, research in fire ecology remains limited and not much is understood of the processes that take place after an area is burned, nor are there models for rehabilitation of burned areas. It was estimated in 1996 that 350 ha (6,5%) of the territory of Praslin was affected or threatened by erosion. No recent detailed inventory of such erosion risk areas has been produced so far on all islands. In some cases, such as in the figure below, remedial measures are hard to develop due to terrain configuration and new threats of rock falls are induced by the erosion. Prevention should take the form of a vulnerability reduction by a strict control of constructability in the area beneath exposed to rock fall hazard. A complicating factor is that most burned, severely degraded land is privately owned and private land owners are required neither to rehabilitate degraded lands nor to provide government with access for land rehabilitation.
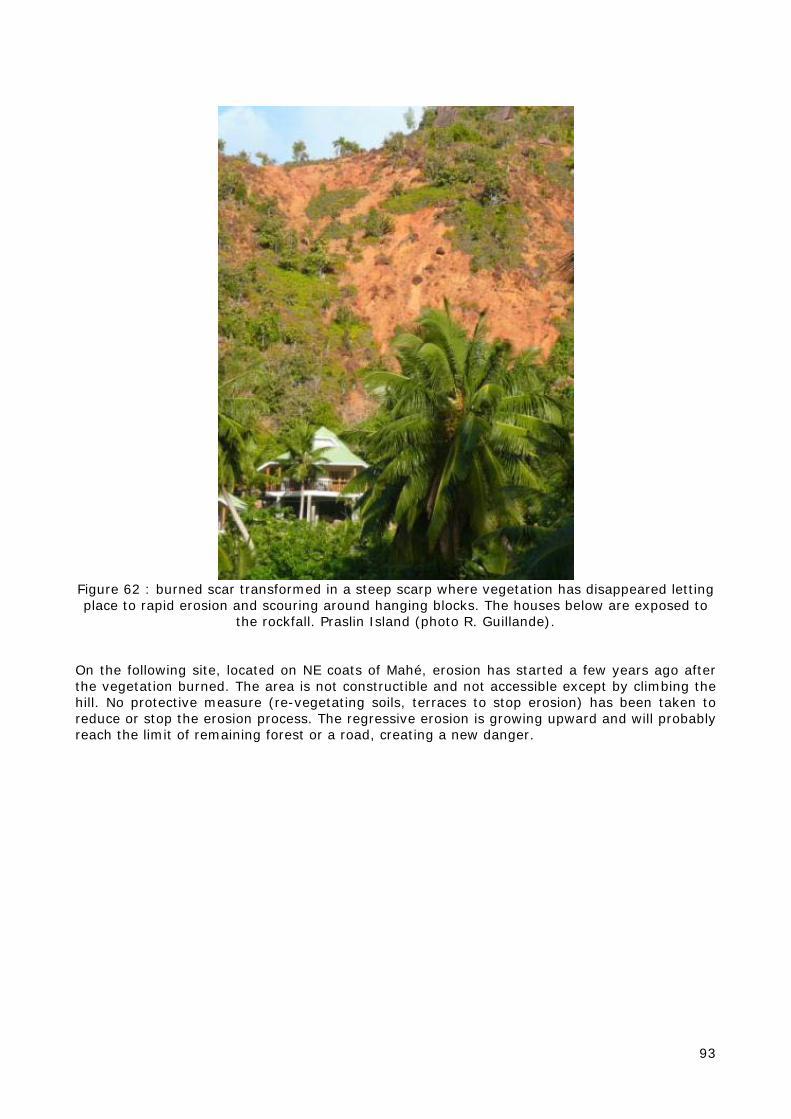
93
Figure 62 : burned scar transformed in a steep scarp where vegetation has disappeared letting place to rapid erosion and scouring around hanging blocks. The houses below are exposed to
the rockfall. Praslin Island (photo R. Guillande). On the following site, located on NE coats of Mahé, erosion has started a few years ago after the vegetation burned. The area is not constructible and not accessible except by climbing the hill. No protective measure (re-vegetating soils, terraces to stop erosion) has been taken to reduce or stop the erosion process. The regressive erosion is growing upward and will probably reach the limit of remaining forest or a road, creating a new danger.
94
Figure 63 : rapid onset of erosion on a burned slope at North East point. Forest has
disappeared and superficial soil is rapidly eroded. The phenomenon is probably accelerated by underneath groundwater flow which accelerates erosion of the red soils when reaching the
surface (photo R. Guillande).
11.4 Forest fire risk reduction The devastating effect of forest fires, which is particularly prominent on Praslin and Curieuse islands, has long been recognized by the authorities in Seychelles. Reducing the erosion and stability of soils has always been a concern in Seychelles, but strong and rapid measures have to be taken as soon as a new site is identified. The Department of Environment (DOE)has the mandate to control and reduce forest fires, in collaboration with the Fire Brigade. There exist Emergency Brigade Units at district level (1 per district with around 15 members) that deal with localised fires, or more important fires. A system of fire breaks exists on Praslin and these are being maintained adequately on an annual basis; though not much is known about their effectiveness. Considering the huge destructive effects of deforestation in countries such as Haiti or Madagascar more attention should be paid to the erosion process on slopes of the inner islands, first of all by carrying out a new inventory of exposed areas and the development of protective measures and programmes very early when the erosion process starts to appear or before its triggering. A Fire Contingency Plan that defines responsibilities for forest fire fighting exists, though is outdated. The Lighting of Fire Act and the Coco de mer Decree are currently under review by DOE. A permit from the Forestry section is required before lighting open fires. Bans are put into force during the dry period and these are monitored and enforced by the staff of the Ministry of Environment. Radio and TV messages contain general awareness programmes on fire.
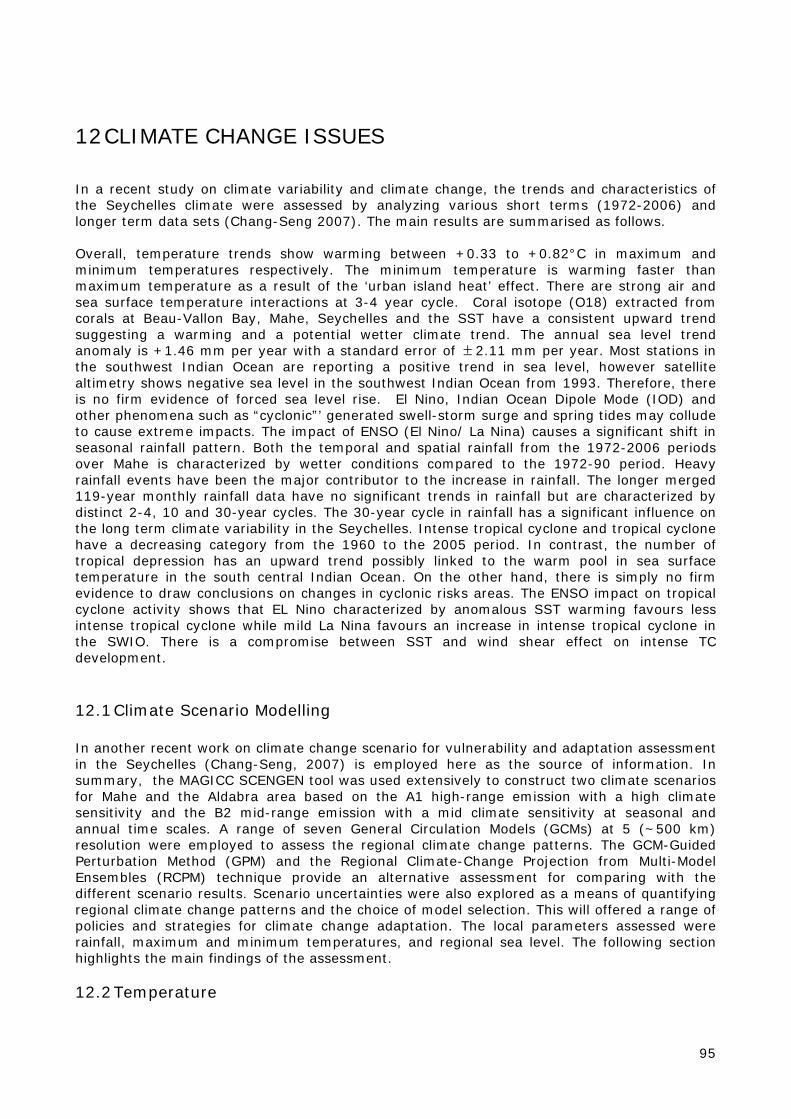
95
12 CLIMATE CHANGE ISSUES In a recent study on climate variability and climate change, the trends and characteristics of the Seychelles climate were assessed by analyzing various short terms (1972-2006) and longer term data sets (Chang-Seng 2007). The main results are summarised as follows. Overall, temperature trends show warming between +0.33 to +0.82°C in maximum and minimum temperatures respectively. The minimum temperature is warming faster than maximum temperature as a result of the ‘urban island heat’ effect. There are strong air and sea surface temperature interactions at 3-4 year cycle. Coral isotope (O18) extracted from corals at Beau-Vallon Bay, Mahe, Seychelles and the SST have a consistent upward trend suggesting a warming and a potential wetter climate trend. The annual sea level trend anomaly is +1.46 mm per year with a standard error of ± 2.11 mm per year. Most stations in the southwest Indian Ocean are reporting a positive trend in sea level, however satellite altimetry shows negative sea level in the southwest Indian Ocean from 1993. Therefore, there is no firm evidence of forced sea level rise. El Nino, Indian Ocean Dipole Mode (IOD) and other phenomena such as “cyclonic”’ generated swell-storm surge and spring tides may collude to cause extreme impacts. The impact of ENSO (El Nino/ La Nina) causes a significant shift in seasonal rainfall pattern. Both the temporal and spatial rainfall from the 1972-2006 periods over Mahe is characterized by wetter conditions compared to the 1972-90 period. Heavy rainfall events have been the major contributor to the increase in rainfall. The longer merged 119-year monthly rainfall data have no significant trends in rainfall but are characterized by distinct 2-4, 10 and 30-year cycles. The 30-year cycle in rainfall has a significant influence on the long term climate variability in the Seychelles. Intense tropical cyclone and tropical cyclone have a decreasing category from the 1960 to the 2005 period. In contrast, the number of tropical depression has an upward trend possibly linked to the warm pool in sea surface temperature in the south central Indian Ocean. On the other hand, there is simply no firm evidence to draw conclusions on changes in cyclonic risks areas. The ENSO impact on tropical cyclone activity shows that EL Nino characterized by anomalous SST warming favours less intense tropical cyclone while mild La Nina favours an increase in intense tropical cyclone in the SWIO. There is a compromise between SST and wind shear effect on intense TC development.
12.1 Climate Scenario Modelling In another recent work on climate change scenario for vulnerability and adaptation assessment in the Seychelles (Chang-Seng, 2007) is employed here as the source of information. In summary, the MAGICC SCENGEN tool was used extensively to construct two climate scenarios for Mahe and the Aldabra area based on the A1 high-range emission with a high climate sensitivity and the B2 mid-range emission with a mid climate sensitivity at seasonal and annual time scales. A range of seven General Circulation Models (GCMs) at 5 (~500 km) resolution were employed to assess the regional climate change patterns. The GCM-Guided Perturbation Method (GPM) and the Regional Climate-Change Projection from Multi-Model Ensembles (RCPM) technique provide an alternative assessment for comparing with the different scenario results. Scenario uncertainties were also explored as a means of quantifying regional climate change patterns and the choice of model selection. This will offered a range of policies and strategies for climate change adaptation. The local parameters assessed were rainfall, maximum and minimum temperatures, and regional sea level. The following section highlights the main findings of the assessment.
12.2 Temperature
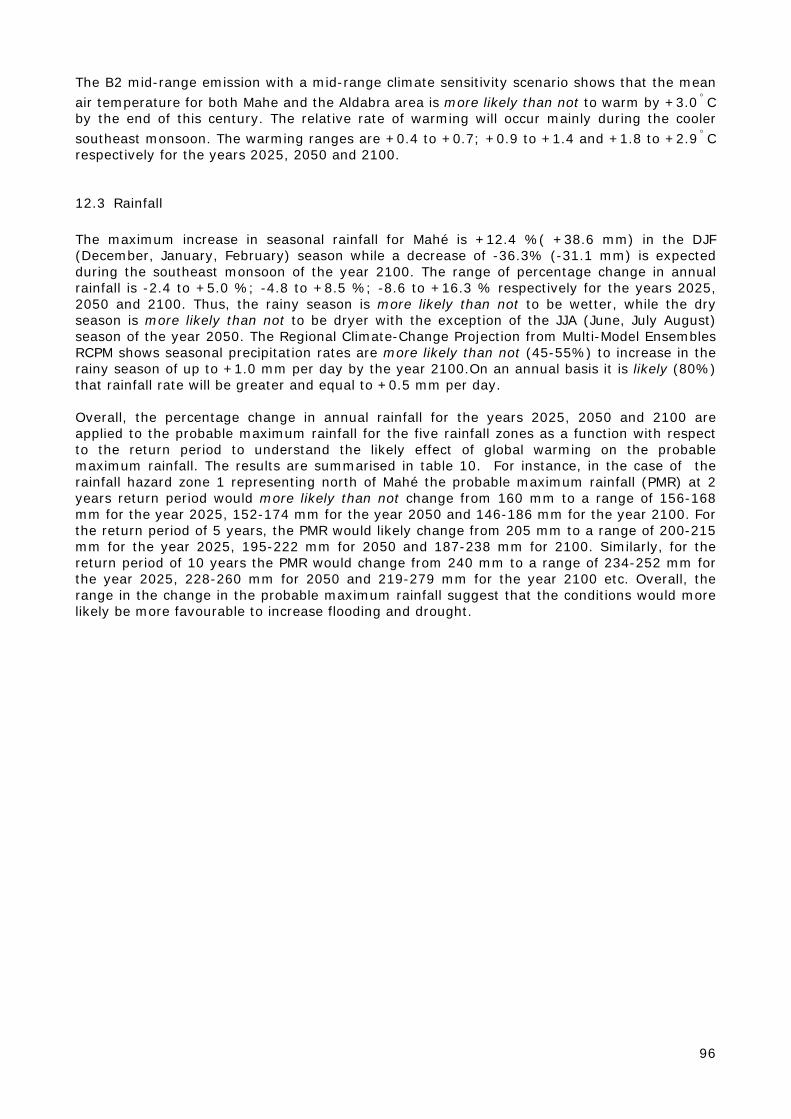
96
The B2 mid-range emission with a mid-range climate sensitivity scenario shows that the mean air temperature for both Mahe and the Aldabra area is more likely than not to warm by +3.0 ° C by the end of this century. The relative rate of warming will occur mainly during the cooler southeast monsoon. The warming ranges are +0.4 to +0.7; +0.9 to +1.4 and +1.8 to +2.9 ° C respectively for the years 2025, 2050 and 2100.
12.3 Rainfall The maximum increase in seasonal rainfall for Mahé is +12.4 %( +38.6 mm) in the DJF (December, January, February) season while a decrease of -36.3% (-31.1 mm) is expected during the southeast monsoon of the year 2100. The range of percentage change in annual rainfall is -2.4 to +5.0 %; -4.8 to +8.5 %; -8.6 to +16.3 % respectively for the years 2025, 2050 and 2100. Thus, the rainy season is more likely than not to be wetter, while the dry season is more likely than not to be dryer with the exception of the JJA (June, July August) season of the year 2050. The Regional Climate-Change Projection from Multi-Model Ensembles RCPM shows seasonal precipitation rates are more likely than not (45-55%) to increase in the rainy season of up to +1.0 mm per day by the year 2100.On an annual basis it is likely (80%) that rainfall rate will be greater and equal to +0.5 mm per day. Overall, the percentage change in annual rainfall for the years 2025, 2050 and 2100 are applied to the probable maximum rainfall for the five rainfall zones as a function with respect to the return period to understand the likely effect of global warming on the probable maximum rainfall. The results are summarised in table 10. For instance, in the case of the rainfall hazard zone 1 representing north of Mahé the probable maximum rainfall (PMR) at 2 years return period would more likely than not change from 160 mm to a range of 156-168 mm for the year 2025, 152-174 mm for the year 2050 and 146-186 mm for the year 2100. For the return period of 5 years, the PMR would likely change from 205 mm to a range of 200-215 mm for the year 2025, 195-222 mm for 2050 and 187-238 mm for 2100. Similarly, for the return period of 10 years the PMR would change from 240 mm to a range of 234-252 mm for the year 2025, 228-260 mm for 2050 and 219-279 mm for the year 2100 etc. Overall, the range in the change in the probable maximum rainfall suggest that the conditions would more likely be more favourable to increase flooding and drought.

Table 10: Global climate change warming effect of the estimated 24-Hours Probable Maximum Rainfall (mm) for the years 2025, 2050 and 2100 for the five rainfall zones and their corresponding return period (T).
12.4 Tropical Cyclone On the other hand, global warming effect on tropical cyclone remains a major challenge world wide, but recent modelling studies in the Unites States on the impacts of carbon dioxide induced warming on hurricane intensity and precipitation (Knutson et al, 2004) have suggested that peak winds may increase by 5 to 10 % whilst the peak rainfall rates may rise by 20 to 30 %. Therefore, the range in percentage change in wind speed is applied successively to the five cyclonic wind hazard zones to evaluate the likely changes. In general, the cyclone wind hazard zone increases by one category of severity respectively (fig 66). Though the technique is simple, it does provide the required and policy oriented information for future cyclone mitigation, planning and development in the Seychelles. For example, the building codes and development should consider the climate warming-probable maximum wind speed ranging from 48-63 knots (89-117 km/h) rather than the historically known probable maximum win speed in the range 34-47 knots (63-88 km/h) for Mahe inner Islands.
Rainfall Hazard Scenarios
Return Period T (Years)
2
5
10
25
50
100
200
Scenario 1: Reference PMR for North of Mahe(mm)
160 205 240 275 300 330 360
2025 156-168
200-215
234-252
268-289
293-315
322-346
351-378
2050
152-174
195-222
228-260
262-298
286-325
314-358
243-390
2100
146-186
187-238
219-279
251-320
274-349
302-384
329-419
Scenario 2: Reference PMR for South of Mahe (mm)
120 150 175 205 230 250 270
2025
117-126
146-158
171-184
200-215
224-241
244-262
263-283
2050
114-130
143-163
167-190
195-224
219-249
238-271
257-292
2100
110-140
137-174
160-203
187-238
210-267
228-291
247-314
Scenario 3: Reference PMR for Inner Islands (mm)
140 177 207 240 265 290 315
2025 137-147
174-187
218-203
234-252
259-278
283-304
307-331
2050
133-152
168-192
197-224
228-260
252-287
276-314
300-342
2100
130-163
162-206
189-241
219-279
242-308
265-337
288--366
Scenario 4: Reference PMR for Southern outer Islands(mm)
105 135 157 188 215 225 260
2025
102-110
132-142
153-165
183-197
210-226
220-236
254-273
2050
100-114
128-146
149-170
179-204
205-233
214-244
247-282
2100
96-122
123-157
143-182
172-219
196-250
206-262
238-302
Scenario 5: Reference PMR Southwestern outer Islands(mm)
90 120 140 170 200 220 250
2025
88-94 117-126
137-147
166-178
195-210
215-231
244-262
2050
86-98 114-130
133-152
162-184
190-217
209-239
238-271
2100
82-105
110-139
128-163
155-198
183-233
202-256
229-291
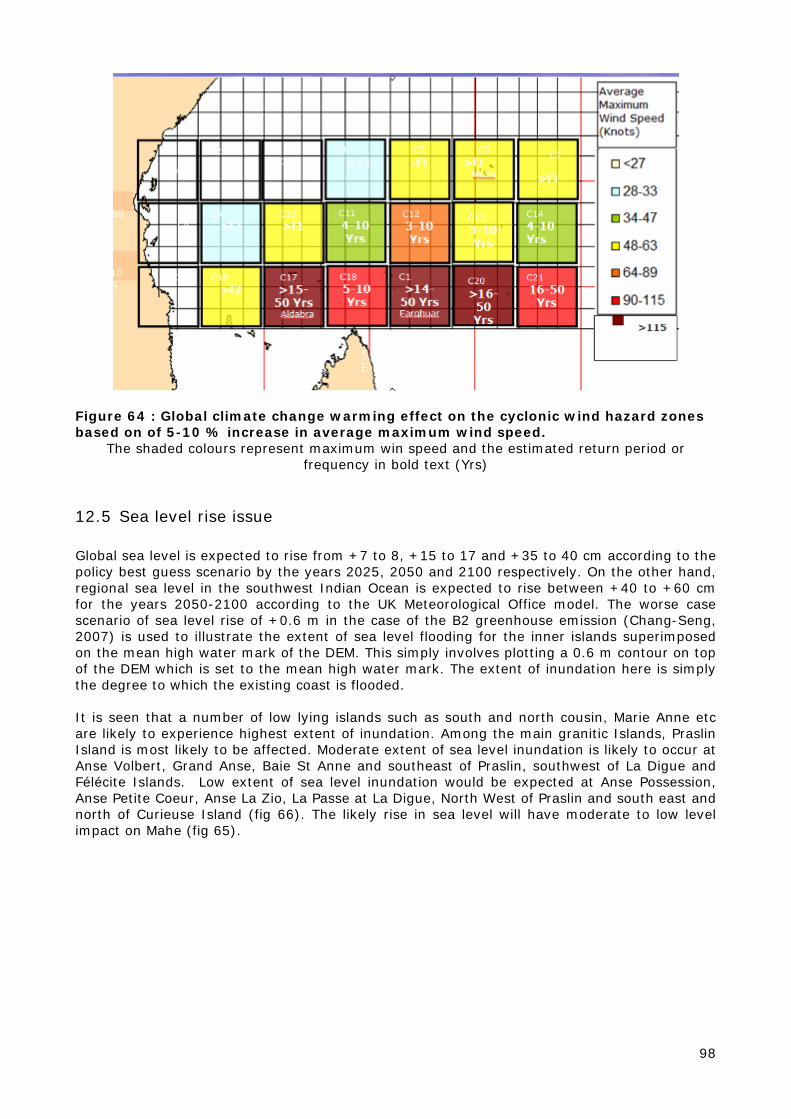
98
Figure 64 : Global climate change warming effect on the cyclonic wind hazard zones based on of 5-10 % increase in average maximum wind speed.
The shaded colours represent maximum win speed and the estimated return period or frequency in bold text (Yrs)
12.5 Sea level rise issue Global sea level is expected to rise from +7 to 8, +15 to 17 and +35 to 40 cm according to the policy best guess scenario by the years 2025, 2050 and 2100 respectively. On the other hand, regional sea level in the southwest Indian Ocean is expected to rise between +40 to +60 cm for the years 2050-2100 according to the UK Meteorological Office model. The worse case scenario of sea level rise of +0.6 m in the case of the B2 greenhouse emission (Chang-Seng, 2007) is used to illustrate the extent of sea level flooding for the inner islands superimposed on the mean high water mark of the DEM. This simply involves plotting a 0.6 m contour on top of the DEM which is set to the mean high water mark. The extent of inundation here is simply the degree to which the existing coast is flooded. It is seen that a number of low lying islands such as south and north cousin, Marie Anne etc are likely to experience highest extent of inundation. Among the main granitic Islands, Praslin Island is most likely to be affected. Moderate extent of sea level inundation is likely to occur at Anse Volbert, Grand Anse, Baie St Anne and southeast of Praslin, southwest of La Digue and Félécite Islands. Low extent of sea level inundation would be expected at Anse Possession, Anse Petite Coeur, Anse La Zio, La Passe at La Digue, North West of Praslin and south east and north of Curieuse Island (fig 66). The likely rise in sea level will have moderate to low level impact on Mahe (fig 65).
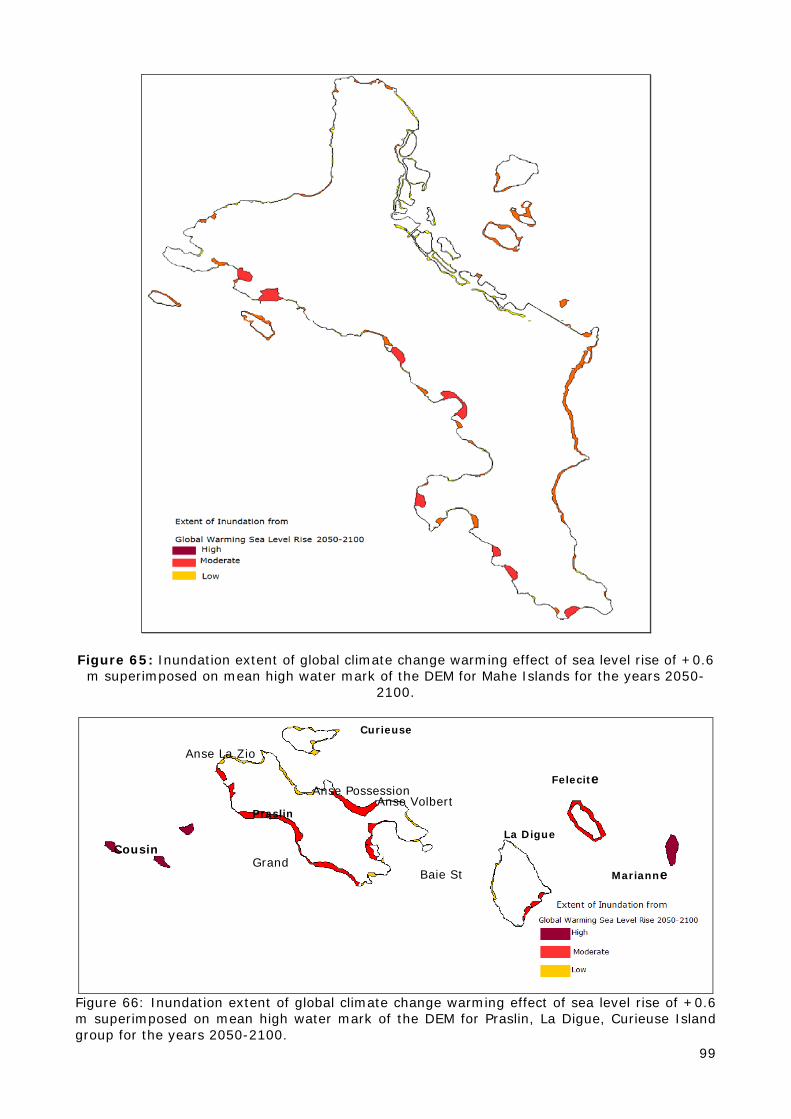
99
Figure 65: Inundation extent of global climate change warming effect of sea level rise of +0.6
m superimposed on mean high water mark of the DEM for Mahe Islands for the years 2050-2100.
Figure 66: Inundation extent of global climate change warming effect of sea level rise of +0.6 m superimposed on mean high water mark of the DEM for Praslin, La Digue, Curieuse Island group for the years 2050-2100.
Praslin
La Digue
Grand
Anse Volbert
Baie St
Anse Possession
Anse La Zio
Curieuse
Felecite
Marianne
Cousin
100
The maps above reflect low lying coastal zone extracted from a DEM produced for tsunami modelling. For coastal zone, the 1/25000 accuracy of the original topographic maps from which are extracted the heights is insufficient (5 m interval between heights curves). Manual correction had been applied locally by injection of fictive points or heights curves where they are missing especially along low lying areas. In lowland heights are generally above 2 or 3 meters. Consequently, the areas below 0.6 m height are inaccurate and cannot be considered as totally exposed to storm surge hazard. There is an urgent need for acquisition of a detailed topography also for the coastal areas hazard mapping, in order to produce 1/10000 maps or even 1/5000.
101
13 - VULNERABILITY OF MAIN INFRASTRUCTURES, LIFELINES AND UTILITIES TO NATURAL DISASTERS Until the august 1997 intense rainfall and floods, the Country had mostly experienced minor damages to its infrastructures. Most of the impact consisted in damages to the road and tracks networks, caused by floods and ground movements, rock falls. The damages and consequences of the 1997 event illustrate an extended disaster impact at the scale of the Seychelles, despite this rainfall episode had nothing to compare with what would be the impact of a real cyclone.
13.1 Effects of August 1997 rainfall and floods. We present hereunder as brief description of damages recorded during the major floods experiences in Seychelles during the last decades, in August 1997 (source United Nations Disaster Assessment Coordination, Seychelles: Floods - 08-Sep-97) 6. Utilities 6.1 Electric Power -- Power lines were brought down by landslides and sub-stations were flooded. The primary distribution system was restored by 19 August. Secondary systems took longer to repair but are now restored. The repair task has almost exhausted maintenance stores. 6.2 Communications -- Telephone lines are underground, and there were no reports of disruptions. 6.3 Water -- 80 percent of the people on the main islands have access to piped treated water. Many supply pipes were broken by landslides and floods. Temporary repairs enabled all house supplies to be restored. At least one reservoir has been undermined and needs to be demolished and rebuilt. Further stabilisation work will be needed on another site. 7. Roads -- The last major road was expected to be cleared of landslide damage by 4 September, while secondary roads will take longer to clear. Many roads on coastal plains were damaged by flooding, and repairs to these roads are expected to take until about 7 September. A total of 44 major road damage sites have been identified as requiring significant response. 8. Airports -- The whole airfield was flooded, causing the new surfaces to crack and the asphalt to lift from the sub-base. 9. Agriculture -- All of the 6,000 hectares of agricultural land was affected by the disaster, and 600 hectares, mostly intensive vegetable farming areas in lowland areas, were severely affected. Many flooded farms have lost all their crops, and many hill farms not only lost crops but also infrastructure. It is estimated that the disaster has put back the target for self-sufficiency by at least a year.
13.2 Distribution of population The preceding chapters demonstrated that coastal zones and lowland are exposed to flooding by rivers, storms surges and tsunami hazards.
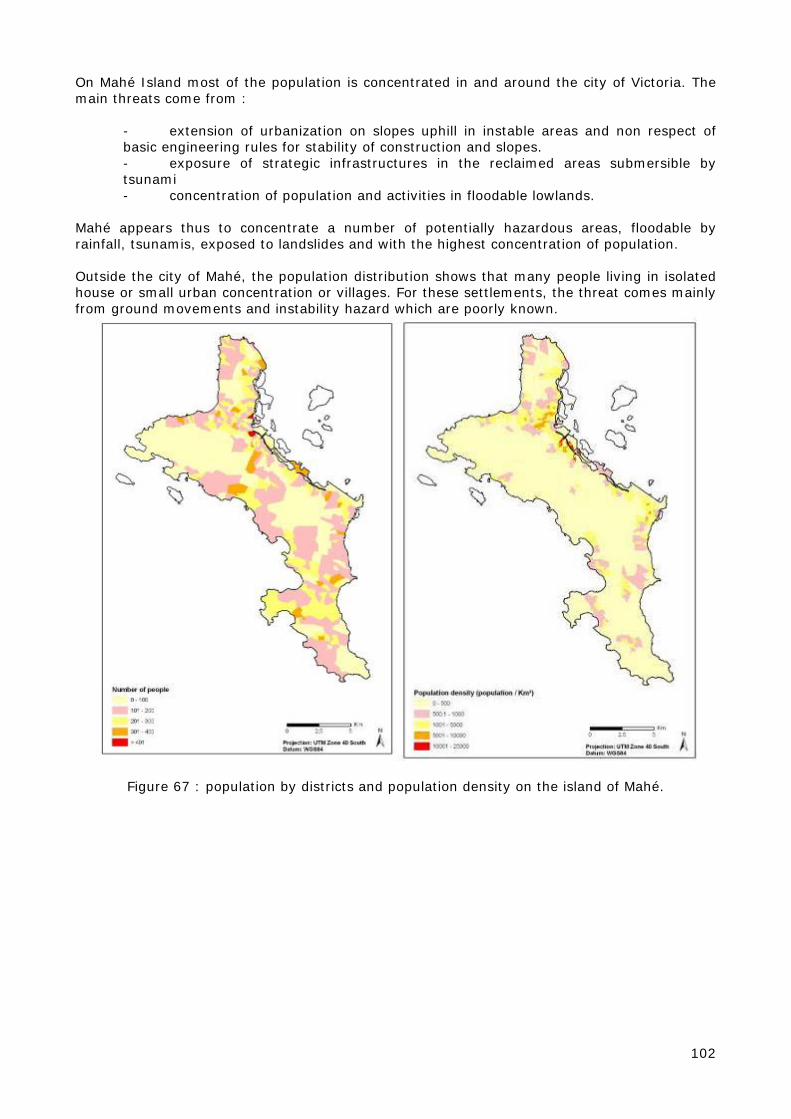
102
On Mahé Island most of the population is concentrated in and around the city of Victoria. The main threats come from :
- extension of urbanization on slopes uphill in instable areas and non respect of basic engineering rules for stability of construction and slopes. - exposure of strategic infrastructures in the reclaimed areas submersible by tsunami - concentration of population and activities in floodable lowlands.
Mahé appears thus to concentrate a number of potentially hazardous areas, floodable by rainfall, tsunamis, exposed to landslides and with the highest concentration of population. Outside the city of Mahé, the population distribution shows that many people living in isolated house or small urban concentration or villages. For these settlements, the threat comes mainly from ground movements and instability hazard which are poorly known.
Figure 67 : population by districts and population density on the island of Mahé.
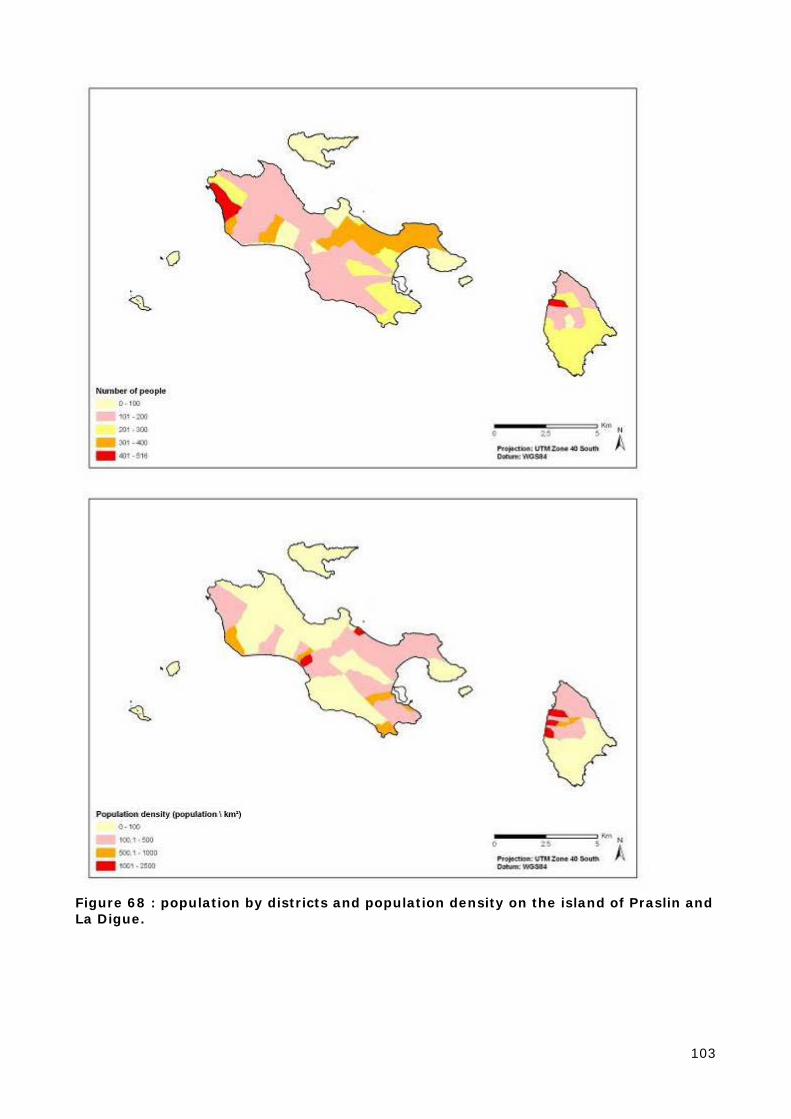
103
Figure 68 : population by districts and population density on the island of Praslin and La Digue.
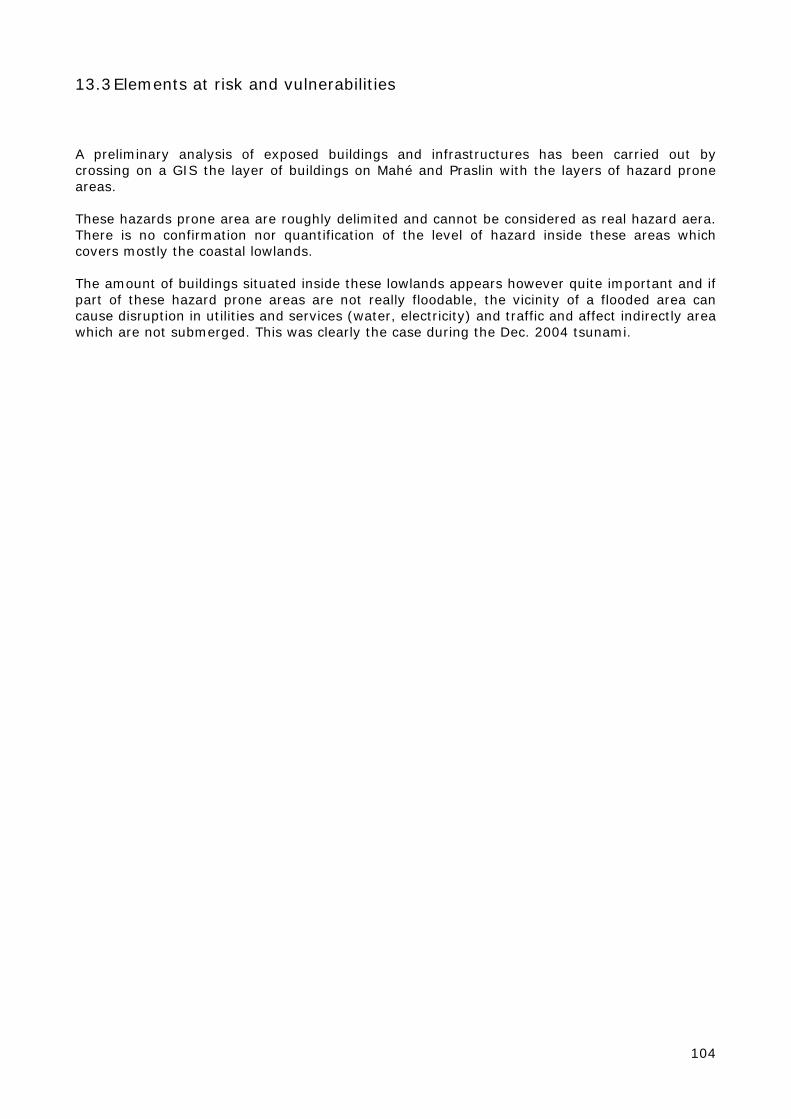
104
13.3 Elements at risk and vulnerabilities A preliminary analysis of exposed buildings and infrastructures has been carried out by crossing on a GIS the layer of buildings on Mahé and Praslin with the layers of hazard prone areas. These hazards prone area are roughly delimited and cannot be considered as real hazard aera. There is no confirmation nor quantification of the level of hazard inside these areas which covers mostly the coastal lowlands. The amount of buildings situated inside these lowlands appears however quite important and if part of these hazard prone areas are not really floodable, the vicinity of a flooded area can cause disruption in utilities and services (water, electricity) and traffic and affect indirectly area which are not submerged. This was clearly the case during the Dec. 2004 tsunami.
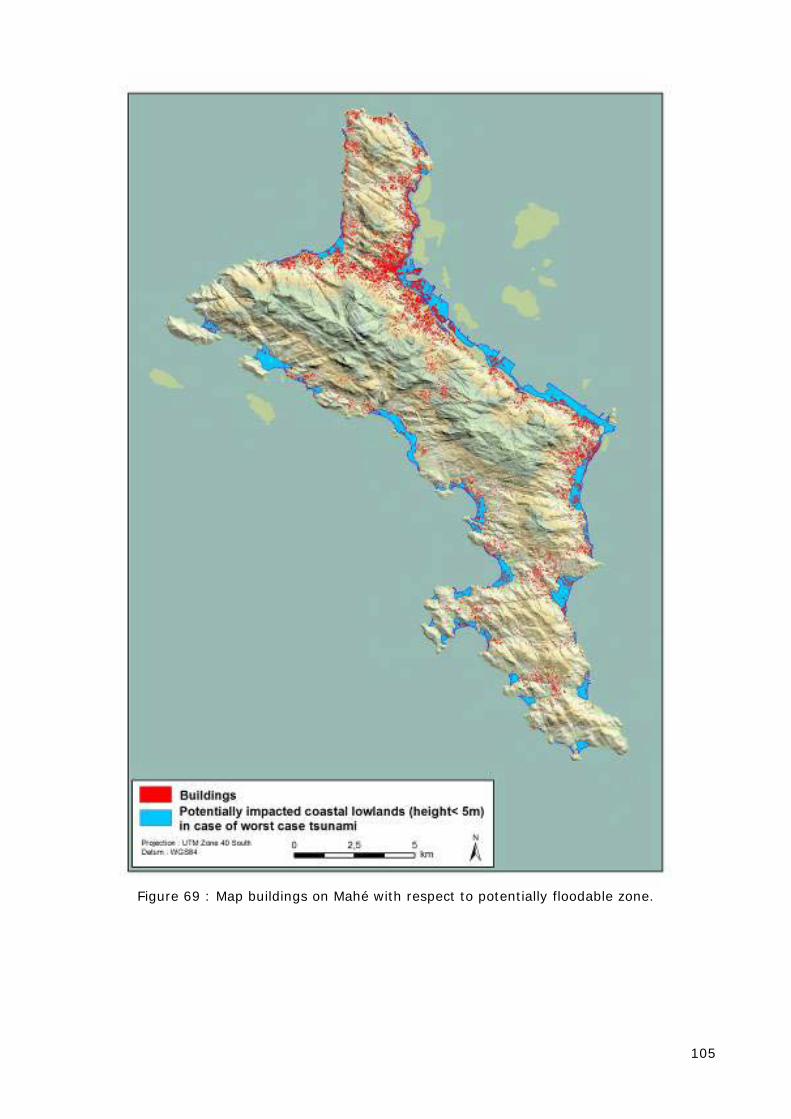
105
Figure 69 : Map buildings on Mahé with respect to potentially floodable zone.
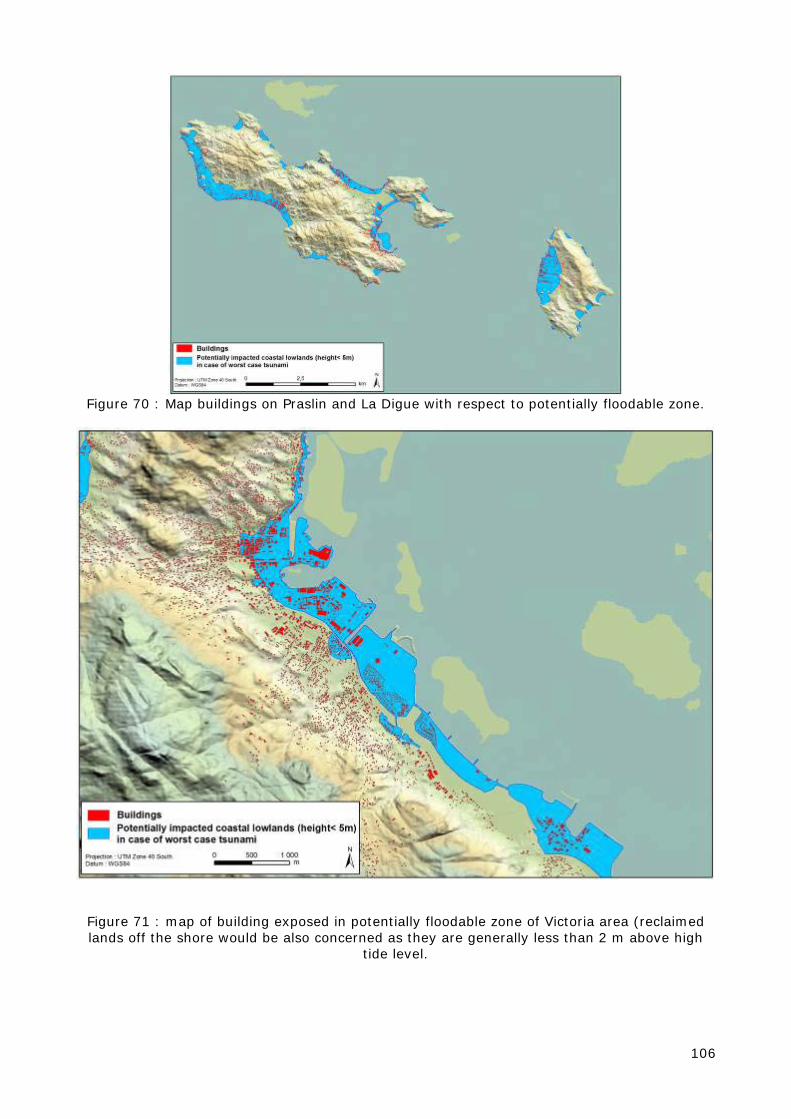
106
Figure 70 : Map buildings on Praslin and La Digue with respect to potentially floodable zone.
Figure 71 : map of building exposed in potentially floodable zone of Victoria area (reclaimed lands off the shore would be also concerned as they are generally less than 2 m above high
tide level.
107
Figure 72 : location of hotels, guest houses, restaurant and other sites related to tourism
activities on the island of Mahé (data GIS dept., MND).
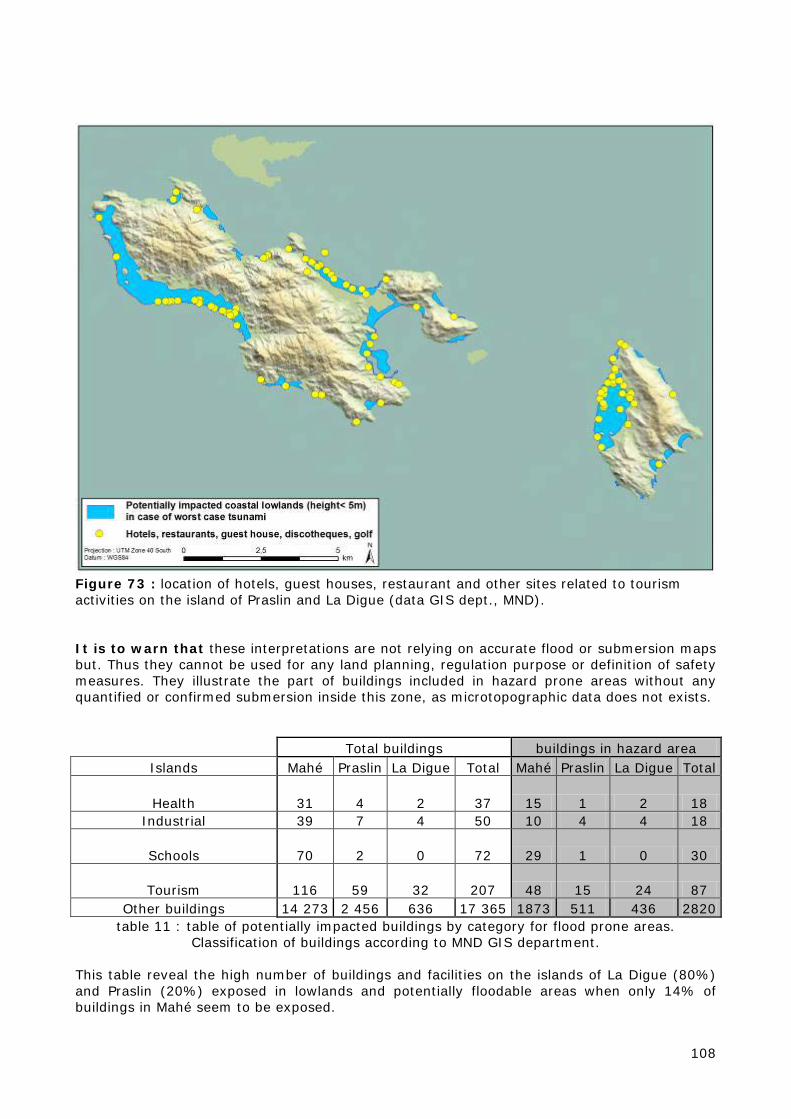
108
Figure 73 : location of hotels, guest houses, restaurant and other sites related to tourism activities on the island of Praslin and La Digue (data GIS dept., MND). It is to warn that these interpretations are not relying on accurate flood or submersion maps but. Thus they cannot be used for any land planning, regulation purpose or definition of safety measures. They illustrate the part of buildings included in hazard prone areas without any quantified or confirmed submersion inside this zone, as microtopographic data does not exists.
Total buildings buildings in hazard area
Islands Mahé Praslin La Digue Total Mahé Praslin La Digue Total
Health 31 4 2 37 15 1 2 18 Industrial 39 7 4 50 10 4 4 18
Schools 70 2 0 72 29 1 0 30
Tourism 116 59 32 207 48 15 24 87 Other buildings 14 273 2 456 636 17 365 1873 511 436 2820
table 11 : table of potentially impacted buildings by category for flood prone areas. Classification of buildings according to MND GIS department.
This table reveal the high number of buildings and facilities on the islands of La Digue (80%) and Praslin (20%) exposed in lowlands and potentially floodable areas when only 14% of buildings in Mahé seem to be exposed.
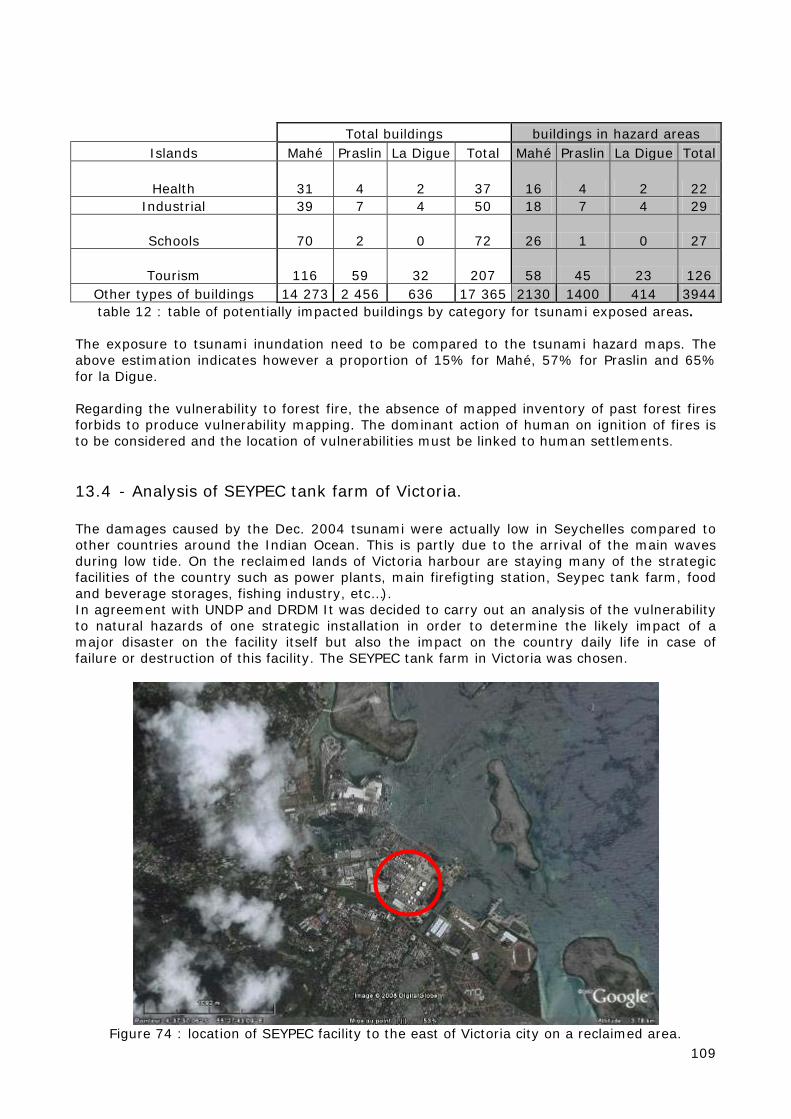
109
Total buildings buildings in hazard areas
Islands Mahé Praslin La Digue Total Mahé Praslin La Digue Total
Health 31 4 2 37 16 4 2 22 Industrial 39 7 4 50 18 7 4 29
Schools 70 2 0 72 26 1 0 27
Tourism 116 59 32 207 58 45 23 126 Other types of buildings 14 273 2 456 636 17 365 2130 1400 414 3944 table 12 : table of potentially impacted buildings by category for tsunami exposed areas.
The exposure to tsunami inundation need to be compared to the tsunami hazard maps. The above estimation indicates however a proportion of 15% for Mahé, 57% for Praslin and 65% for la Digue. Regarding the vulnerability to forest fire, the absence of mapped inventory of past forest fires forbids to produce vulnerability mapping. The dominant action of human on ignition of fires is to be considered and the location of vulnerabilities must be linked to human settlements.
13.4 - Analysis of SEYPEC tank farm of Victoria. The damages caused by the Dec. 2004 tsunami were actually low in Seychelles compared to other countries around the Indian Ocean. This is partly due to the arrival of the main waves during low tide. On the reclaimed lands of Victoria harbour are staying many of the strategic facilities of the country such as power plants, main firefigting station, Seypec tank farm, food and beverage storages, fishing industry, etc…). In agreement with UNDP and DRDM It was decided to carry out an analysis of the vulnerability to natural hazards of one strategic installation in order to determine the likely impact of a major disaster on the facility itself but also the impact on the country daily life in case of failure or destruction of this facility. The SEYPEC tank farm in Victoria was chosen.
Figure 74 : location of SEYPEC facility to the east of Victoria city on a reclaimed area.
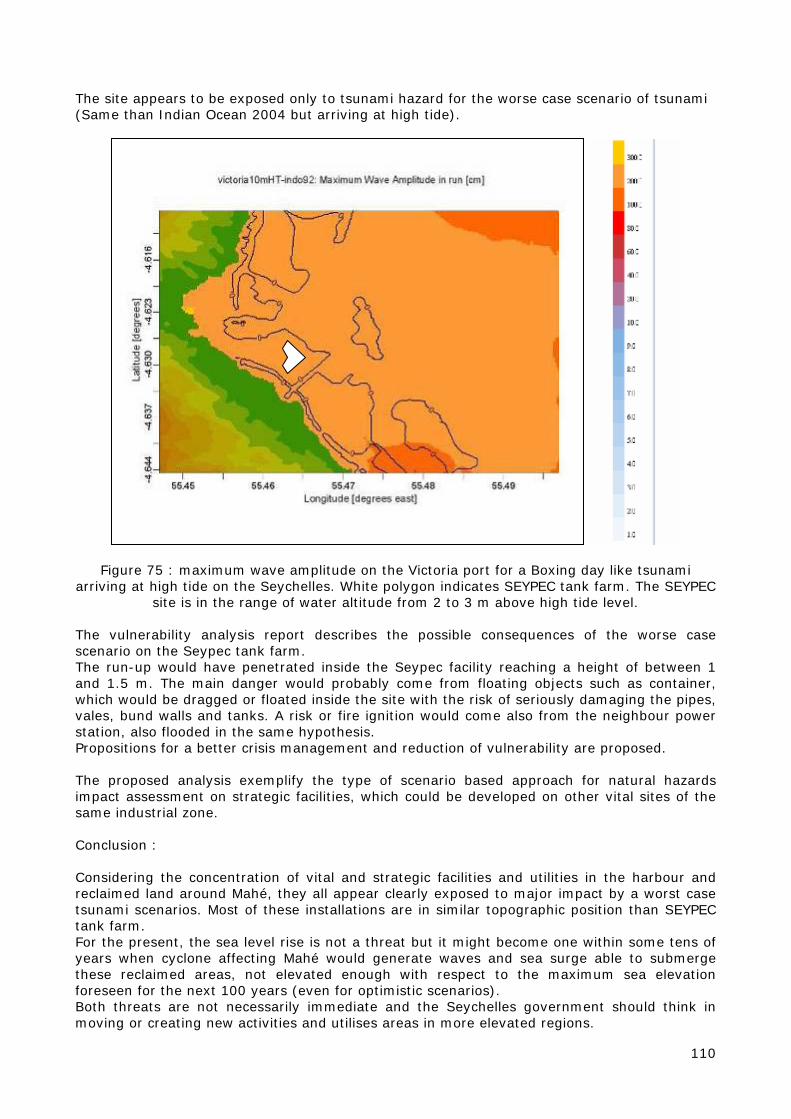
110
The site appears to be exposed only to tsunami hazard for the worse case scenario of tsunami (Same than Indian Ocean 2004 but arriving at high tide).
Figure 75 : maximum wave amplitude on the Victoria port for a Boxing day like tsunami arriving at high tide on the Seychelles. White polygon indicates SEYPEC tank farm. The SEYPEC
site is in the range of water altitude from 2 to 3 m above high tide level. The vulnerability analysis report describes the possible consequences of the worse case scenario on the Seypec tank farm. The run-up would have penetrated inside the Seypec facility reaching a height of between 1 and 1.5 m. The main danger would probably come from floating objects such as container, which would be dragged or floated inside the site with the risk of seriously damaging the pipes, vales, bund walls and tanks. A risk or fire ignition would come also from the neighbour power station, also flooded in the same hypothesis. Propositions for a better crisis management and reduction of vulnerability are proposed. The proposed analysis exemplify the type of scenario based approach for natural hazards impact assessment on strategic facilities, which could be developed on other vital sites of the same industrial zone. Conclusion : Considering the concentration of vital and strategic facilities and utilities in the harbour and reclaimed land around Mahé, they all appear clearly exposed to major impact by a worst case tsunami scenarios. Most of these installations are in similar topographic position than SEYPEC tank farm. For the present, the sea level rise is not a threat but it might become one within some tens of years when cyclone affecting Mahé would generate waves and sea surge able to submerge these reclaimed areas, not elevated enough with respect to the maximum sea elevation foreseen for the next 100 years (even for optimistic scenarios). Both threats are not necessarily immediate and the Seychelles government should think in moving or creating new activities and utilises areas in more elevated regions.
111
14 KEY FINDINGS AND RECOMMENDATIONS FOR RISK REDUCTION
14.1 Key findings The recent impact of major natural events on the Seychelles raised a national consciousness of the fragility of the country against natural disaster. Awareness and preparedness were considered seriously after the 2004 Indian Ocean tsunami and were reinforced by cyclone Bondo in 2006. The historical perspective explains and justifies the lack of preparation of the country to face major disasters. The country remained generally unaffected by major disasters which stroke the Indian Ocean region during the last two centuries. The account of victims directly caused by natural phenomenon’s is extremely low for the Seychelles (less than a hundred since 1790), even if compared to the total population of the country. This situation makes that most of the existing buildings and constructions are not designed to face extreme weathers conditions and that many low lying areas exposed to floods or invasion by the sea in case of storm surge and tsunami are now occupied by dense population. This situation is common on Small Islands Developing States (SIDS) and is explained also by the fact that on the main islands, the steep slopes of the central mountains forbid a dense occupation of the inland territories. Demographic and development pressure are concentrated on coastal zones. It is also obvious that in the case of a tsunami such as the Dec. 2004 event, which is very rare, no country around the Indian Ocean - even Indonesia - had taken specific measures to protect its coast and population of such an unimaginable disaster. For the time being, the climate change predictions, except for sea level rise, do not clearly indicates how intense could be the extreme weather conditions in the future in Seychelles. On the other hand it appears that very little is done to reduce vulnerability. If the increase of hazard is not clear, vulnerability is obviously increasing with the absence of real planning and control of what is being done in hazard prone areas. The main problem remains that hazard zoning is poor or absent. A set of recommendations have been elaborated to introduce in development and construction practices, a consideration of exposure to natural hazard and a reduction of risk by reduction of vulnerability. Except the introduction of Environmental impact Assessment (EIA) in all major constructions or development project, there are no specific regulation concerning the reduction of vulnerability to natural hazards of new houses or buildings, constructed by individuals or small companies. Polices and regulations such as the Environmental Protection Act (EPA, 1994), the Town and Country Planning Act (TCP, 1972), or more recently, the National Policy on Disaster Mitigation measures for Building and Infrastructure Development to withstand adverse weather impact (Cabinet Memorandum, April 2007), which emphasized the necessity of adapting construction to extreme weather conditions, are not restricting enough and consequently rarely followed except on decision of the project developer. The DRDM is the governmental body responsible of disaster management in Seychelles and has developed a Disaster Management Policy (finalized in April 2008) within the framework of the UNDP project. The DRDM should now develop specific regulations for vulnerability reduction that may reinforce the existing legislation and ensure that they are respected.
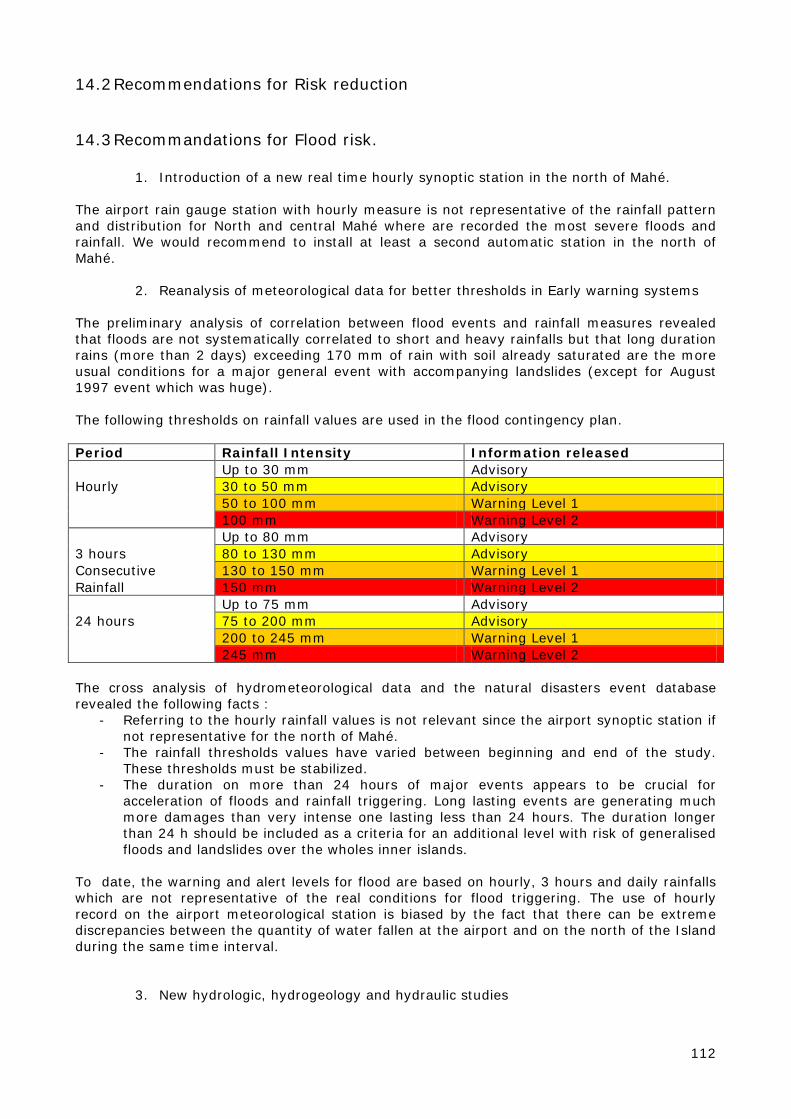
112
14.2 Recommendations for Risk reduction
14.3 Recommandations for Flood risk.
1. Introduction of a new real time hourly synoptic station in the north of Mahé.
The airport rain gauge station with hourly measure is not representative of the rainfall pattern and distribution for North and central Mahé where are recorded the most severe floods and rainfall. We would recommend to install at least a second automatic station in the north of Mahé.
2. Reanalysis of meteorological data for better thresholds in Early warning systems The preliminary analysis of correlation between flood events and rainfall measures revealed that floods are not systematically correlated to short and heavy rainfalls but that long duration rains (more than 2 days) exceeding 170 mm of rain with soil already saturated are the more usual conditions for a major general event with accompanying landslides (except for August 1997 event which was huge). The following thresholds on rainfall values are used in the flood contingency plan. Period Rainfall Intensity Information released Up to 30 mm Advisory Hourly 30 to 50 mm Advisory 50 to 100 mm Warning Level 1 100 mm Warning Level 2 Up to 80 mm Advisory 3 hours 80 to 130 mm Advisory Consecutive 130 to 150 mm Warning Level 1 Rainfall 150 mm Warning Level 2 Up to 75 mm Advisory 24 hours 75 to 200 mm Advisory 200 to 245 mm Warning Level 1 245 mm Warning Level 2 The cross analysis of hydrometeorological data and the natural disasters event database revealed the following facts :
- Referring to the hourly rainfall values is not relevant since the airport synoptic station if not representative for the north of Mahé.
- The rainfall thresholds values have varied between beginning and end of the study. These thresholds must be stabilized.
- The duration on more than 24 hours of major events appears to be crucial for acceleration of floods and rainfall triggering. Long lasting events are generating much more damages than very intense one lasting less than 24 hours. The duration longer than 24 h should be included as a criteria for an additional level with risk of generalised floods and landslides over the wholes inner islands.
To date, the warning and alert levels for flood are based on hourly, 3 hours and daily rainfalls which are not representative of the real conditions for flood triggering. The use of hourly record on the airport meteorological station is biased by the fact that there can be extreme discrepancies between the quantity of water fallen at the airport and on the north of the Island during the same time interval.
3. New hydrologic, hydrogeology and hydraulic studies

113
Despite the work of PUC, the hydrology remains insufficiently studied and water balance in catchments is not well known. The present study could not integrate such an analysis with the numerous small watersheds of Mahé and Praslin. From a scientific and engineering point of view, hydrogeologic studies will be necessary to better understand the soil saturation process prevailing before occurrence of floods and the limit conditions which can lead to landslides, ground movement and landslip.
4. Better landuse and settlement control in floodable area. This will be possible only once detailed flood hazard studied will be done and appropriate floodable zone maps will be available. Many settlements have been developed in former flood expansion zones and do not benefit of proper drainage works;
5. Improvement in drainage network design and maintenance As stated in the studies of the drainage task force, part of the drainage network needs to be remodelled and restored, especially in :
- urban area of Victoria where channels or drains are badly designed and flow is limited by many obstacles.
- Coastal low lying zones where design is not appropriate and does not take in consideration sediment transport, and effect of waves
14.3.1 Recommendations for storms and cyclones risk. The strong winds remain rares in Seychelles. Trees, vegetation but also human constructions have grown in this wind conditions. The 2002 strom which hit Praslin has shown how forest as well as buildings are unprepared to face very strong winds. The cyclone Bondo and its impact on the outer Islands of Providence and Farquhar triggered the elaboration of new recommendation for a better preparation against the likely increase of extreme and adverse weather events at level of emergency management, creation of shelters, reinforcement of roofs for new constructions
The recommendations are proposed in the National Policy on Disaster Mitigation measures for Building and Infrastructure Development to withstand adverse weather impact (Cabinet Memorandum, April 2007). However this remains at the level of recommendation and they have not been yet translated into a real regulation. Furthermore, this concern only new construction and no recommendations are proposed for the existing buildings. Recommendation:
6. the National Policy on Disaster Mitigation measures for Building and Infrastructure Development to withstand adverse weather impact should become a mandatory regulation supported by a technical manual of application and a control of application and sanctions for non-respect of them.
7. construction of safe shelter areas on outer islands.
8. Identification in each district of a safe building able to receive numerous people
and be used as a shelter. The building must have a roof certified to withstand very string gusts but also accessible and protected from flood, storm surge, ground movement.
114
14.4 Recommendations for ground movements and erosion risk. There is no regulation regarding protection of construction against landslides and ground movements. Each new project is analysed case by case with advisory of expert in some cases, DRDM being involved in major development projects. The planning authority is the main governmental body to decide on authorization of construction. The recommendations are :
9. Despite the small number of major landslides on the Island of Mahé, the landslide and ground instability hazard remains poorly known on the slopes between the coastal plains and the steep slopes of the granitic peaks. A first complete instability and ground movements hazard mapping deserves to be undertaken for the main Island of Mahé where many accidents occurred on new and isolated constructions build in steep slopes or on slope deposits.
10. The October 1862 Avalasse remain poorly known but is the major disaster in
Seychelles. A detailed study on site, mechanism and conditions of occurrence should be undertaken to determined the conditions of occurrence and identify possible risk of such a new event in other sites or on the same site in the future.
11. Enforcement of laws and regulation to respect engineering construction and
ground stability rules and reinforcement of DRDM or Ministry of construction team to increase the control of construction projects. This should be done though training of existing people and external assistance to improve the existing recommendation and transform them in real regulations.
12. Monitoring and prevention of erosion areas on steep isolated slopes which can
extend rapidly when no remediation measures are taken, especially on Mahé and Praslin.
14.5 Recommendations for tsunami risk. As in many other countries around The Indian Ocean, there are not many structural or work recommendations to propose. Most of the effort must be on Early warning, preparedness and emergency management.
13. Improvement in data collection, quality control and management. 14. Tsunami modelling needs to be validated using at least two separate tsunami
models.
15. Establish the roughness parameter for the main islands. This has important for determining maximum run-up.
16. Stakeholders such as the NMS needs to revise EWS according to findings.
115
14.6 General recommandations
17. Investigations in British colonial archives Considering the apparent concentration of disasters since the independence of the country, the uncertainty could be partly solved with the analysis of British colonial meteorological archives.
18. Improve thresholds for floods and tsunamis used for warnings and alerts used in
contingency plans
Concerning the tsunami thresholds, there is a possibility of simplifying them based on the findings of the study.
19. Develop and use fast damages assessment during crisis stages to support relief operations using intensity scales
In order to reinforce the decision process in Emergency situation, the quantification of impact of a disaster would be necessary: there is currently in Seychelles no formalized way of quantifying the intensity of any natural phenomenon and corresponding damages. No intensity or damage scales allow to understand the magnitude and geographical distribution as well as the evolution of these intensities during a disaster. If information’s stream flow to DRDM and government is defined, a tool should be developed to represent the global magnitude and development of the on-going disaster. We recommend developing an intensity characterization procedure during disaster based on intensity scales for each phenomenon and a simple mapping or GIS tool to represent the distributions of damages collected from the districts administration and relief operators. An example of such intensity scale for flash floods developed in France is shown in the next figure. The scale allows the qualification the event either by its physical intensity (if a physical parameter is available) or by observation of corresponding damages on elements exposed.
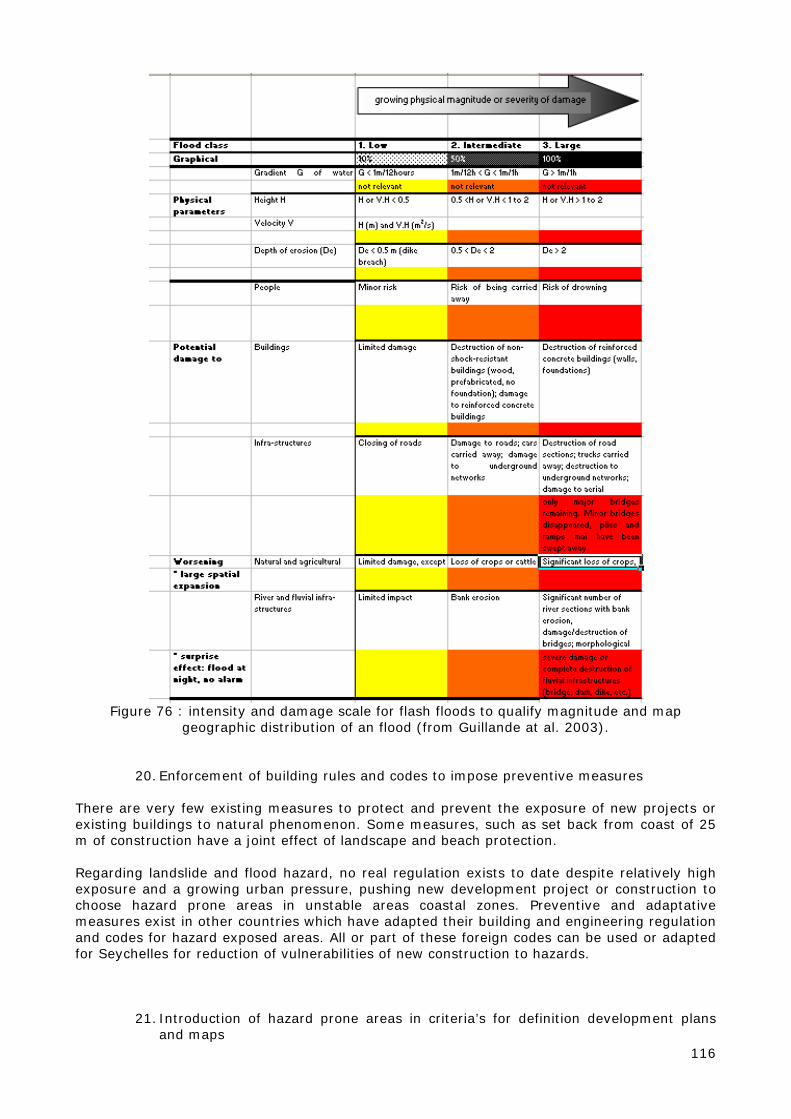
116
Figure 76 : intensity and damage scale for flash floods to qualify magnitude and map
geographic distribution of an flood (from Guillande at al. 2003).
20. Enforcement of building rules and codes to impose preventive measures There are very few existing measures to protect and prevent the exposure of new projects or existing buildings to natural phenomenon. Some measures, such as set back from coast of 25 m of construction have a joint effect of landscape and beach protection. Regarding landslide and flood hazard, no real regulation exists to date despite relatively high exposure and a growing urban pressure, pushing new development project or construction to choose hazard prone areas in unstable areas coastal zones. Preventive and adaptative measures exist in other countries which have adapted their building and engineering regulation and codes for hazard exposed areas. All or part of these foreign codes can be used or adapted for Seychelles for reduction of vulnerabilities of new construction to hazards.
21. Introduction of hazard prone areas in criteria’s for definition development plans and maps
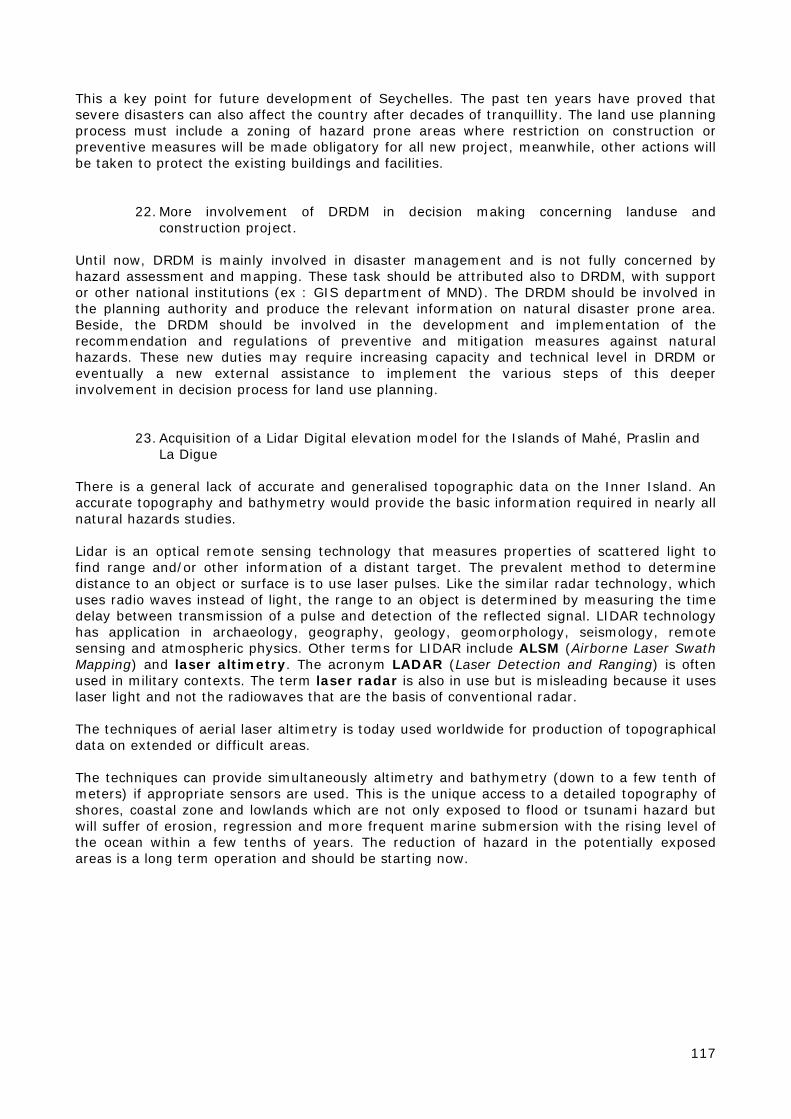
117
This a key point for future development of Seychelles. The past ten years have proved that severe disasters can also affect the country after decades of tranquillity. The land use planning process must include a zoning of hazard prone areas where restriction on construction or preventive measures will be made obligatory for all new project, meanwhile, other actions will be taken to protect the existing buildings and facilities.
22. More involvement of DRDM in decision making concerning landuse and construction project.
Until now, DRDM is mainly involved in disaster management and is not fully concerned by hazard assessment and mapping. These task should be attributed also to DRDM, with support or other national institutions (ex : GIS department of MND). The DRDM should be involved in the planning authority and produce the relevant information on natural disaster prone area. Beside, the DRDM should be involved in the development and implementation of the recommendation and regulations of preventive and mitigation measures against natural hazards. These new duties may require increasing capacity and technical level in DRDM or eventually a new external assistance to implement the various steps of this deeper involvement in decision process for land use planning.
23. Acquisition of a Lidar Digital elevation model for the Islands of Mahé, Praslin and La Digue
There is a general lack of accurate and generalised topographic data on the Inner Island. An accurate topography and bathymetry would provide the basic information required in nearly all natural hazards studies. Lidar is an optical remote sensing technology that measures properties of scattered light to find range and/or other information of a distant target. The prevalent method to determine distance to an object or surface is to use laser pulses. Like the similar radar technology, which uses radio waves instead of light, the range to an object is determined by measuring the time delay between transmission of a pulse and detection of the reflected signal. LIDAR technology has application in archaeology, geography, geology, geomorphology, seismology, remote sensing and atmospheric physics. Other terms for LIDAR include ALSM (Airborne Laser Swath Mapping) and laser altimetry. The acronym LADAR (Laser Detection and Ranging) is often used in military contexts. The term laser radar is also in use but is misleading because it uses laser light and not the radiowaves that are the basis of conventional radar. The techniques of aerial laser altimetry is today used worldwide for production of topographical data on extended or difficult areas. The techniques can provide simultaneously altimetry and bathymetry (down to a few tenth of meters) if appropriate sensors are used. This is the unique access to a detailed topography of shores, coastal zone and lowlands which are not only exposed to flood or tsunami hazard but will suffer of erosion, regression and more frequent marine submersion with the rising level of the ocean within a few tenths of years. The reduction of hazard in the potentially exposed areas is a long term operation and should be starting now.
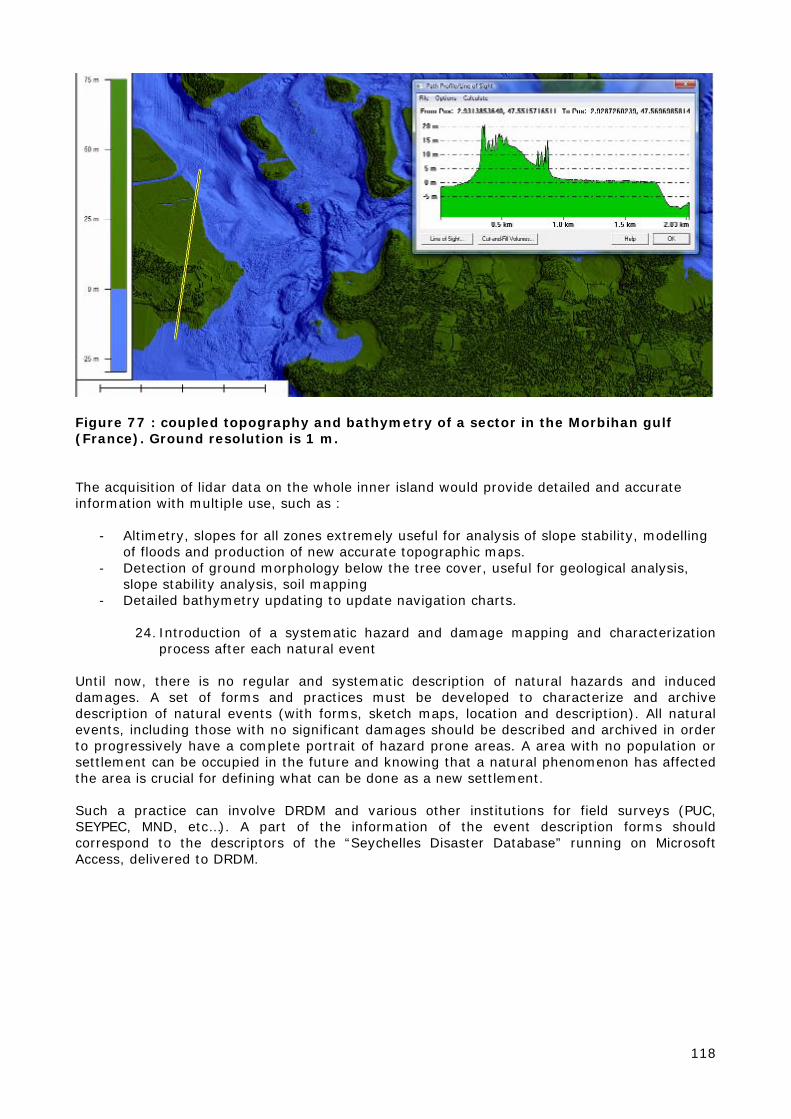
118
Figure 77 : coupled topography and bathymetry of a sector in the Morbihan gulf (France). Ground resolution is 1 m. The acquisition of lidar data on the whole inner island would provide detailed and accurate information with multiple use, such as :
- Altimetry, slopes for all zones extremely useful for analysis of slope stability, modelling of floods and production of new accurate topographic maps.
- Detection of ground morphology below the tree cover, useful for geological analysis, slope stability analysis, soil mapping
- Detailed bathymetry updating to update navigation charts.
24. Introduction of a systematic hazard and damage mapping and characterization process after each natural event
Until now, there is no regular and systematic description of natural hazards and induced damages. A set of forms and practices must be developed to characterize and archive description of natural events (with forms, sketch maps, location and description). All natural events, including those with no significant damages should be described and archived in order to progressively have a complete portrait of hazard prone areas. A area with no population or settlement can be occupied in the future and knowing that a natural phenomenon has affected the area is crucial for defining what can be done as a new settlement. Such a practice can involve DRDM and various other institutions for field surveys (PUC, SEYPEC, MND, etc…). A part of the information of the event description forms should correspond to the descriptors of the “Seychelles Disaster Database” running on Microsoft Access, delivered to DRDM.
119
15 - DISASTER DATABASE Considering the lack of a detailed record of historical disasters, it has been decided to make and inventory of all victims and damages directly or indirectly linked to a natural disaster phenomenon and to create a database that could be used an implemented by DRDM to analyse and store informations about impact of natural disasters. The database has been installed at DRDM and is operational. The first step has been to collect and organize all available description on past natural events with a significant impact to have recorded. The major source of information for natural phenomenon identification and description were:
- The national archives with pre-independence documents - National press since the independence of the country - Technical and scientific reports stored in DRDM library - Interview of various engineers and responsible in public administration or associations.
Each event is described by a set of descriptors relating to:
- date, duration - type of natural phenomenon and cause - type, intensity and geographical distribution of damages - number and types of victims
No economical or cost of damages being available, it was decided not to include such a dimension in the DB. To date, this database is the first compilation of impacts of natural phenomenon and disasters on the Seychelles. The oldest event identified is a forest fire on Mahé in 1780. The tool has been developed with Microsoft access and has a user friendly interface which makes it accessible to non specialist. Two main functions exist: consultation and extraction of past event using simple criteria, modification and creation of events.
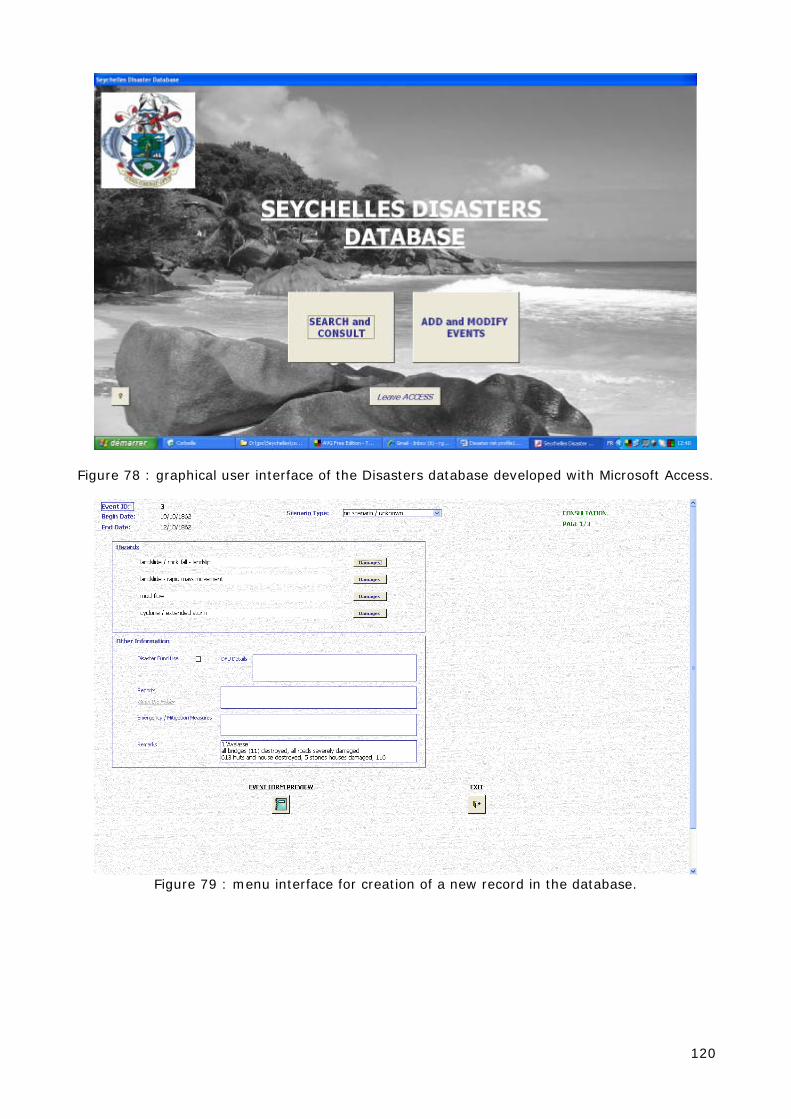
120
Figure 78 : graphical user interface of the Disasters database developed with Microsoft Access.
Figure 79 : menu interface for creation of a new record in the database.
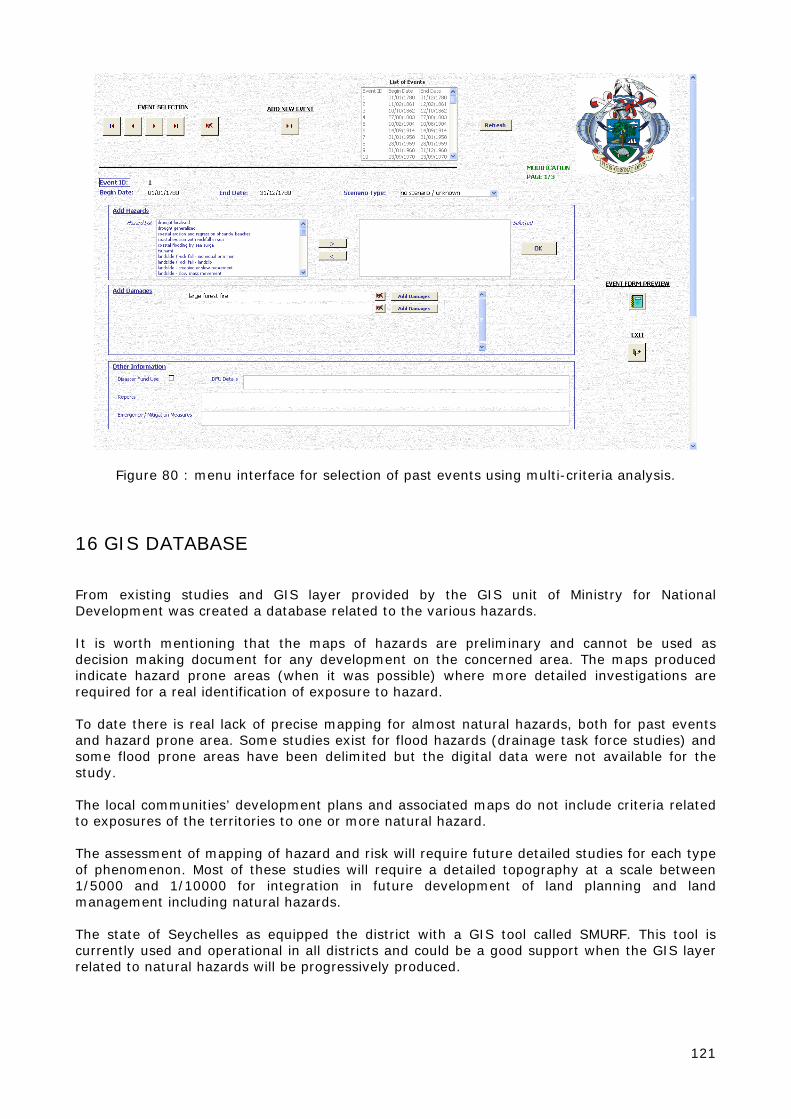
121
Figure 80 : menu interface for selection of past events using multi-criteria analysis.
16 GIS DATABASE From existing studies and GIS layer provided by the GIS unit of Ministry for National Development was created a database related to the various hazards. It is worth mentioning that the maps of hazards are preliminary and cannot be used as decision making document for any development on the concerned area. The maps produced indicate hazard prone areas (when it was possible) where more detailed investigations are required for a real identification of exposure to hazard. To date there is real lack of precise mapping for almost natural hazards, both for past events and hazard prone area. Some studies exist for flood hazards (drainage task force studies) and some flood prone areas have been delimited but the digital data were not available for the study. The local communities’ development plans and associated maps do not include criteria related to exposures of the territories to one or more natural hazard. The assessment of mapping of hazard and risk will require future detailed studies for each type of phenomenon. Most of these studies will require a detailed topography at a scale between 1/5000 and 1/10000 for integration in future development of land planning and land management including natural hazards. The state of Seychelles as equipped the district with a GIS tool called SMURF. This tool is currently used and operational in all districts and could be a good support when the GIS layer related to natural hazards will be progressively produced.
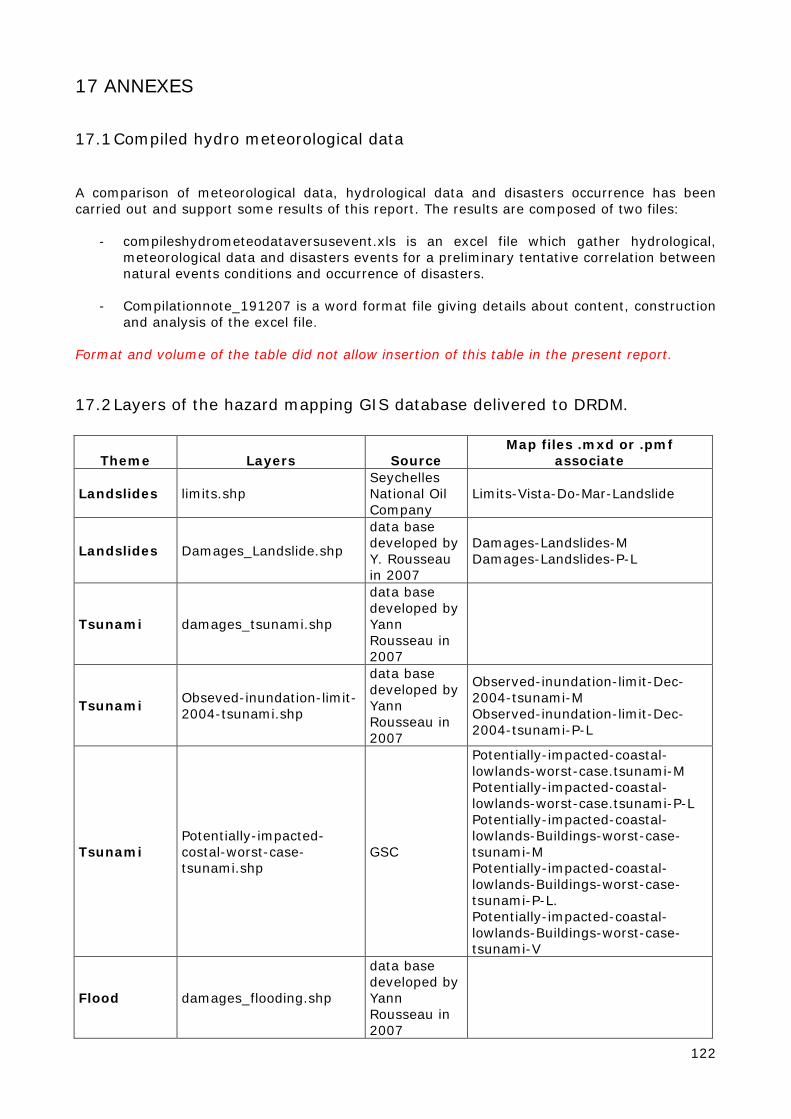
122
17 ANNEXES
17.1 Compiled hydro meteorological data A comparison of meteorological data, hydrological data and disasters occurrence has been carried out and support some results of this report. The results are composed of two files:
- compileshydrometeodataversusevent.xls is an excel file which gather hydrological, meteorological data and disasters events for a preliminary tentative correlation between natural events conditions and occurrence of disasters.
- Compilationnote_191207 is a word format file giving details about content, construction
and analysis of the excel file. Format and volume of the table did not allow insertion of this table in the present report.
17.2 Layers of the hazard mapping GIS database delivered to DRDM.
Theme Layers Source Map files .mxd or .pmf
associate
Landslides limits.shp Seychelles National Oil Company
Limits-Vista-Do-Mar-Landslide
Landslides Damages_Landslide.shp
data base developed by Y. Rousseau in 2007
Damages-Landslides-M Damages-Landslides-P-L
Tsunami damages_tsunami.shp
data base developed by Yann Rousseau in 2007
Tsunami Obseved-inundation-limit-2004-tsunami.shp
data base developed by Yann Rousseau in 2007
Observed-inundation-limit-Dec-2004-tsunami-M Observed-inundation-limit-Dec-2004-tsunami-P-L
Tsunami Potentially-impacted-costal-worst-case-tsunami.shp
GSC
Potentially-impacted-coastal-lowlands-worst-case.tsunami-M Potentially-impacted-coastal-lowlands-worst-case.tsunami-P-L Potentially-impacted-coastal-lowlands-Buildings-worst-case-tsunami-M Potentially-impacted-coastal-lowlands-Buildings-worst-case-tsunami-P-L. Potentially-impacted-coastal-lowlands-Buildings-worst-case-tsunami-V
Flood damages_flooding.shp
data base developed by Yann Rousseau in 2007
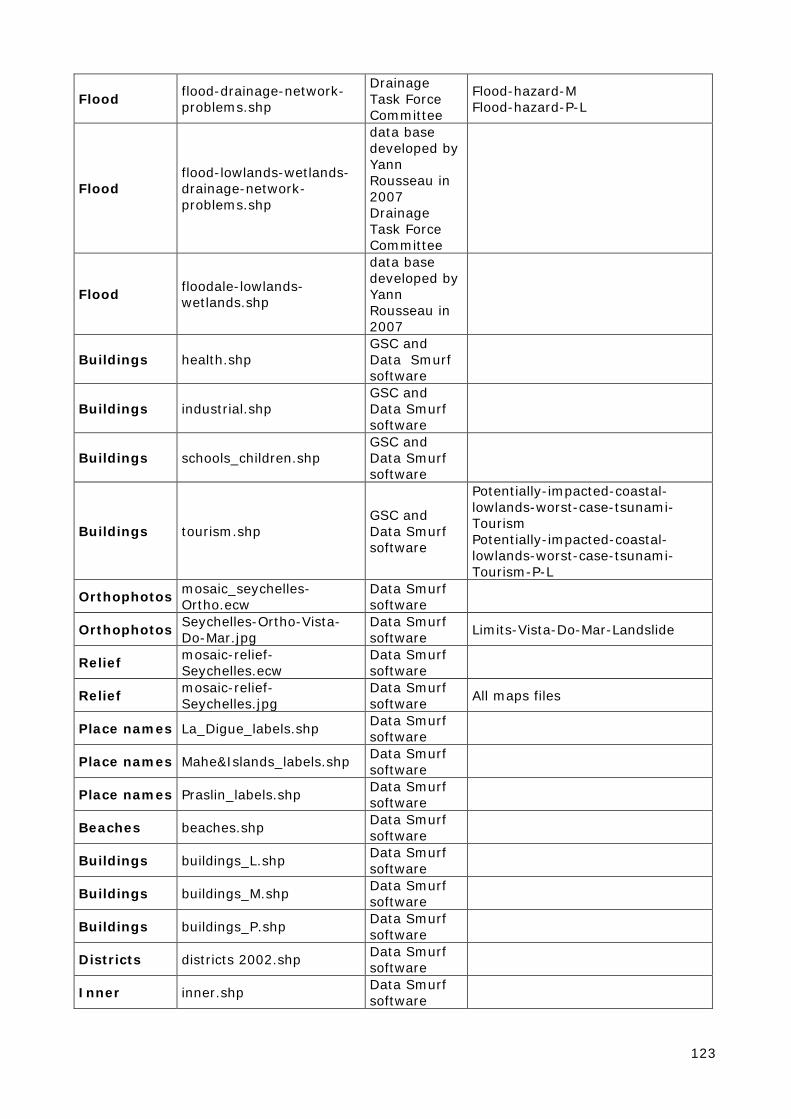
123
Flood flood-drainage-network-problems.shp
Drainage Task Force Committee
Flood-hazard-M Flood-hazard-P-L
Flood flood-lowlands-wetlands-drainage-network-problems.shp
data base developed by Yann Rousseau in 2007 Drainage Task Force Committee
Flood floodale-lowlands-wetlands.shp
data base developed by Yann Rousseau in 2007
Buildings health.shp GSC and Data Smurf software
Buildings industrial.shp GSC and Data Smurf software
Buildings schools_children.shp GSC and Data Smurf software
Buildings tourism.shp GSC and Data Smurf software
Potentially-impacted-coastal-lowlands-worst-case-tsunami-Tourism Potentially-impacted-coastal-lowlands-worst-case-tsunami-Tourism-P-L
Orthophotos mosaic_seychelles-Ortho.ecw
Data Smurf software
Orthophotos Seychelles-Ortho-Vista-Do-Mar.jpg
Data Smurf software Limits-Vista-Do-Mar-Landslide
Relief mosaic-relief-Seychelles.ecw
Data Smurf software
Relief mosaic-relief-Seychelles.jpg
Data Smurf software All maps files
Place names La_Digue_labels.shp Data Smurf software
Place names Mahe&Islands_labels.shp Data Smurf software
Place names Praslin_labels.shp Data Smurf software
Beaches beaches.shp Data Smurf software
Buildings buildings_L.shp Data Smurf software
Buildings buildings_M.shp Data Smurf software
Buildings buildings_P.shp Data Smurf software
Districts districts 2002.shp Data Smurf software
Inner inner.shp Data Smurf software
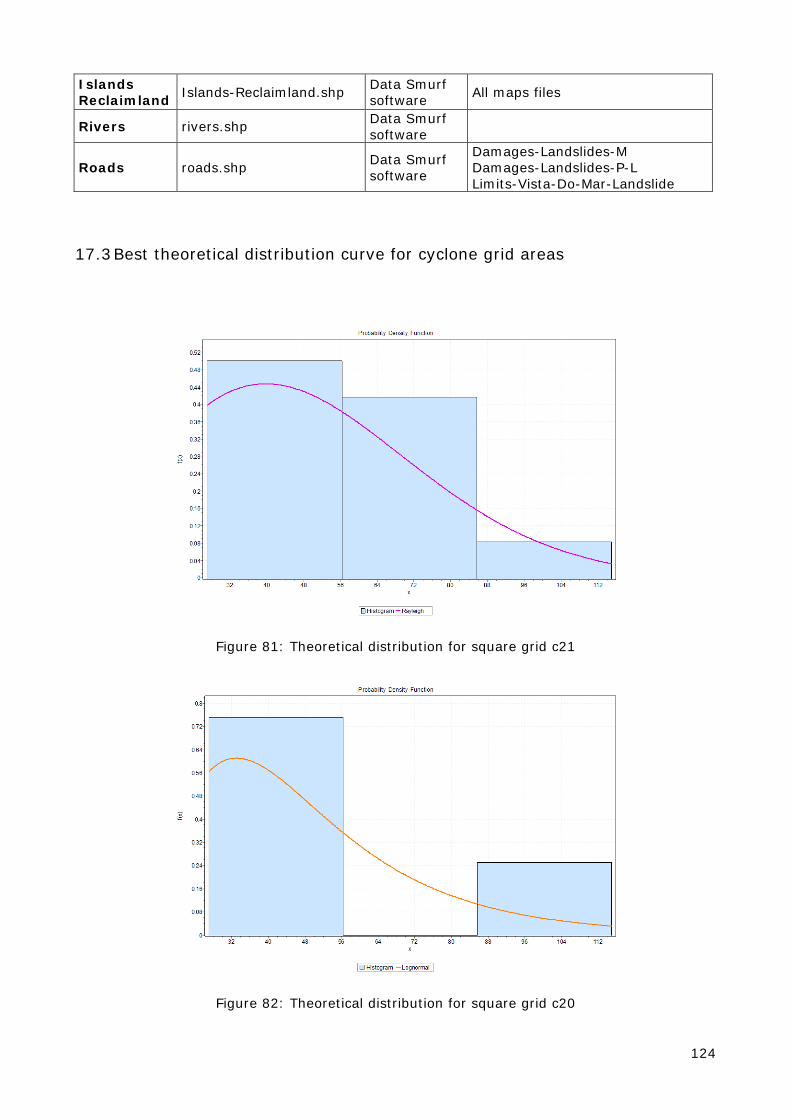
124
Islands Reclaimland Islands-Reclaimland.shp Data Smurf
software All maps files
Rivers rivers.shp Data Smurf software
Roads roads.shp Data Smurf software
Damages-Landslides-M Damages-Landslides-P-L Limits-Vista-Do-Mar-Landslide
17.3 Best theoretical distribution curve for cyclone grid areas
Figure 81: Theoretical distribution for square grid c21
Figure 82: Theoretical distribution for square grid c20
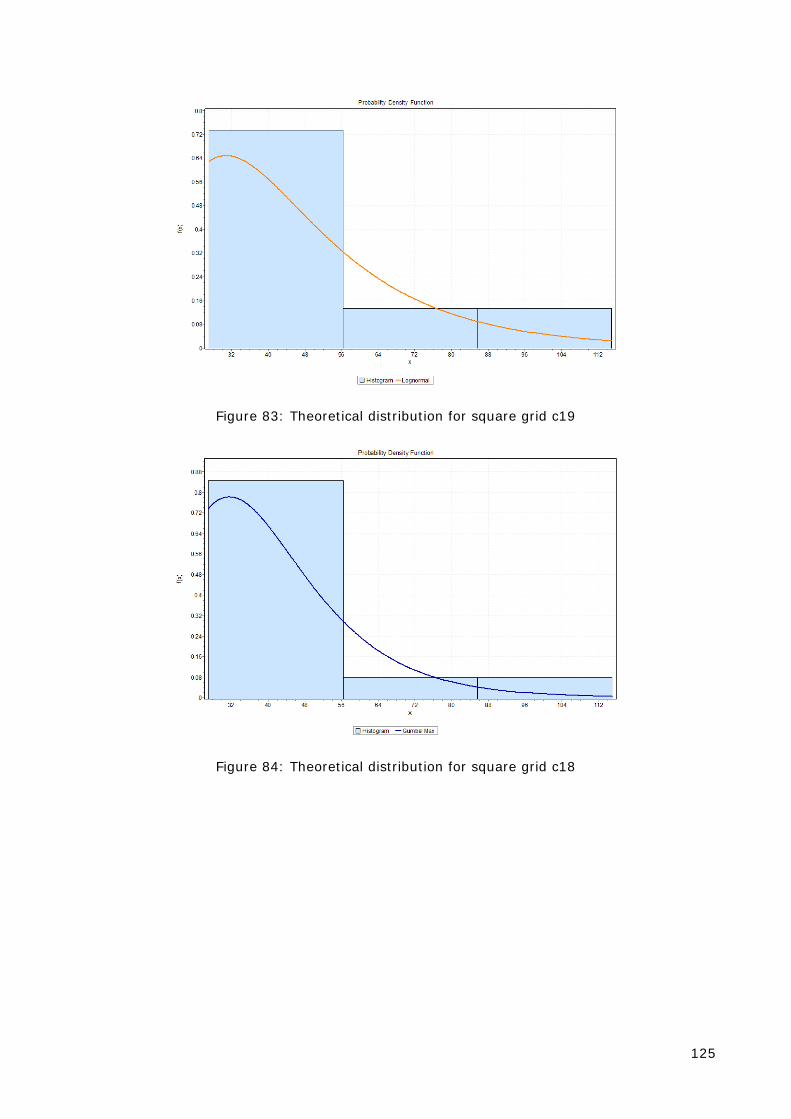
125
Figure 83: Theoretical distribution for square grid c19
Figure 84: Theoretical distribution for square grid c18
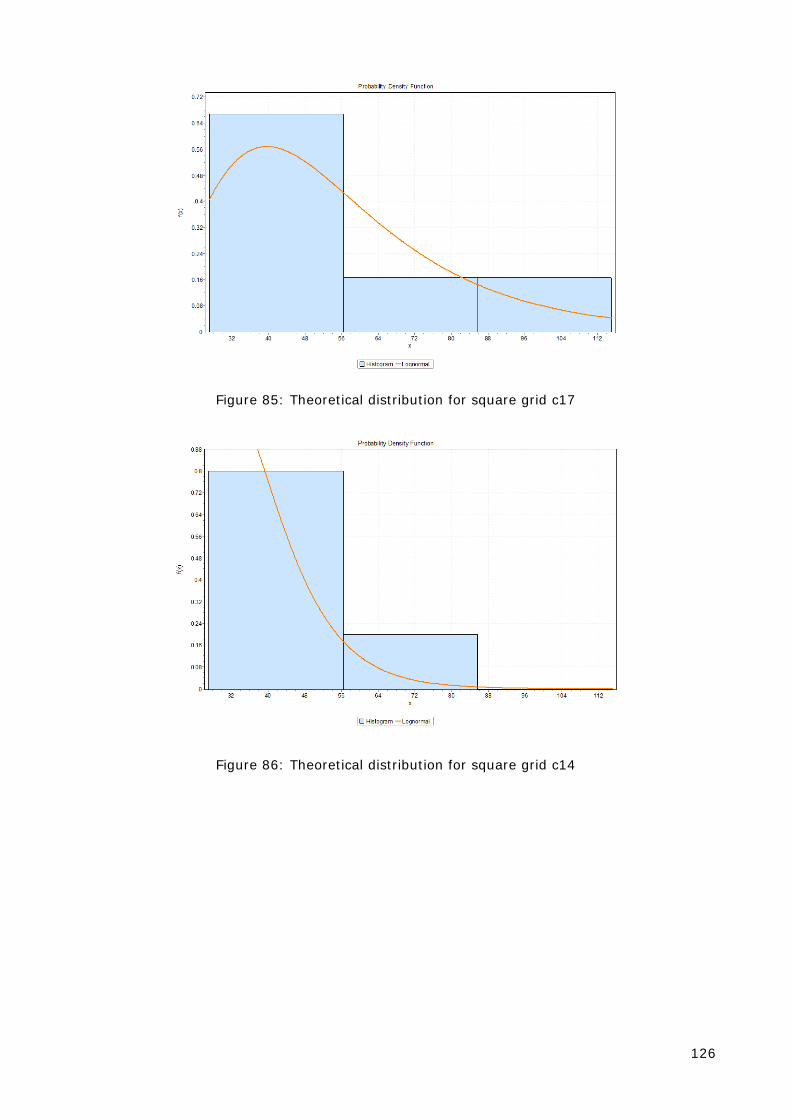
126
Figure 85: Theoretical distribution for square grid c17
Figure 86: Theoretical distribution for square grid c14
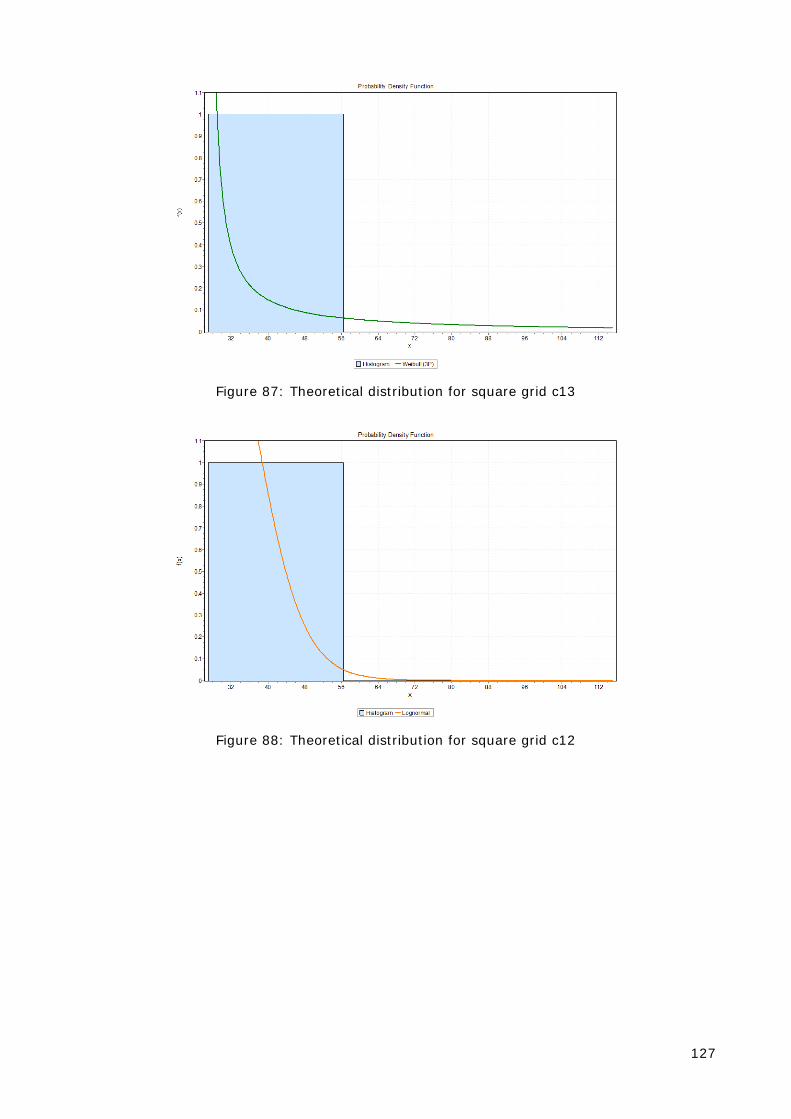
127
Figure 87: Theoretical distribution for square grid c13
Figure 88: Theoretical distribution for square grid c12
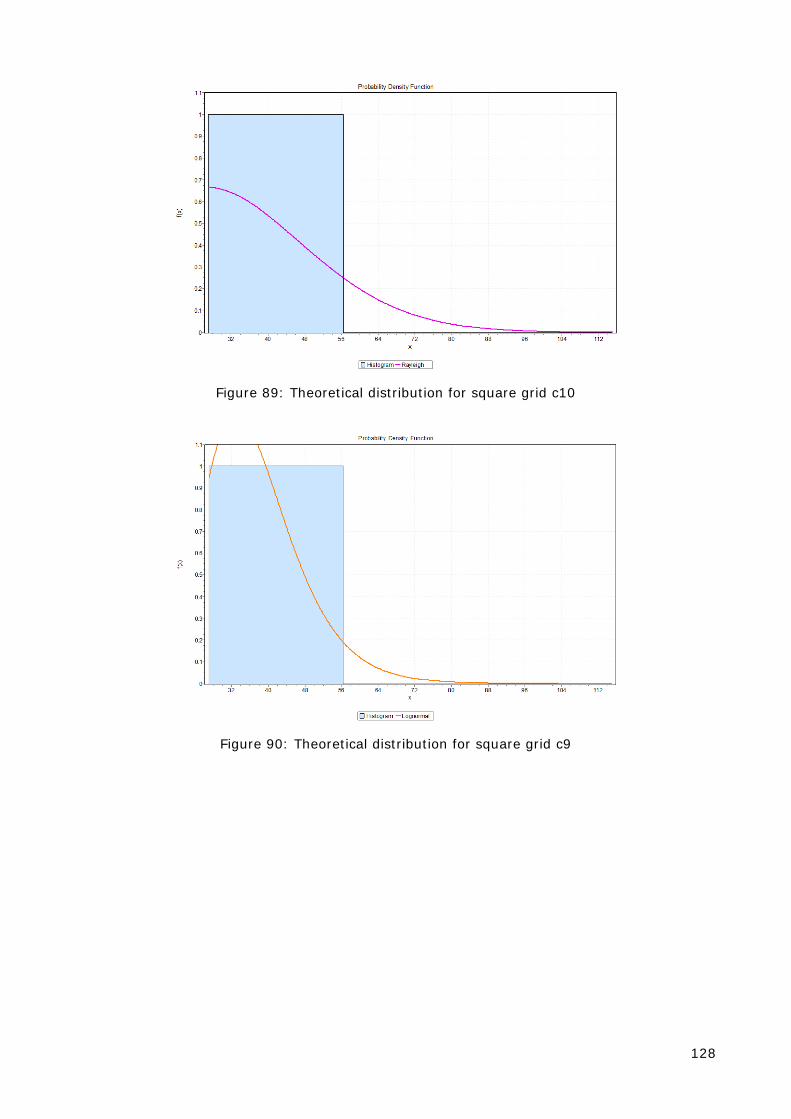
128
Figure 89: Theoretical distribution for square grid c10
Figure 90: Theoretical distribution for square grid c9
129
18 REFERENCES
• Virginie Cazes-Duvat & René Robert – Atlas de l’environnement côtier des îles granitiques de l’archipel des Seychelles – publication of La Réunion University – ISBN : 2-87614-467-0. 2001.
• BELOUSOV, A.B. (1994) : Large-scale sector collapses at Kurile-Kamchatka volcanoes
in the 20th century. In: Proceedings of International Conference on Volcano Instability on the Earth and Other Planets, 1994, The Geological Society of London.
• Lionel E. Jackson, Jr., J. Vaughn Barrie, Donald L. Forbes, John Shaw, Gavin K. Manson,
Michael Schmidt - EFFECTS OF THE 26 DECEMBER 2004 INDIAN OCEAN TSUNAMI IN THE REPUBLIC OF SEYCHELLES Report of the Canada-UNESCO Indian Ocean Tsunami Expedition 19 January – 5 February 2005 , Geological Survey of Canada.
• A Geological Analysis of the Rockfall at Labati Prepared by Seychelles National Oil
Company - TECHNICAL REPORT GHZ/2002/01 Geohazard Series, April 2002
• Chang-Seng, S. D., 2007: Climate Variability and Climate Change Assessment for the Seychelles, Second National Communication (SNC), Under the United Nations Framework Convention on Climate Change (UNFCCC).
• Chang-Seng, S. D., 2007: Climate Change Scenario Assessment for the Seychelles,
Second National Communication (SNC), Under the United Nations Framework Convention on Climate Change (UNFCCC).
• Chang-Seng, S. D., 2005: Marine Weather Systems, Tropical Cyclone Prediction and
Impacts in the Southwest Indian Ocean, MSc. Thesis, Department of Geography and Environmental Studies, University of Zululand.
• Chang-Seng, S. D., 2002: El Nino, Indian Ocean Dipole Mode and its Impact on Sea
Level and Rainfall in the Seychelles, Seychelles National Meteorological Services.
• Fornari , D.J. & Campbell, J.F. (1987): Submarine topography around the Hawaiian Islands. U.S. Geol. Surv. Prof. Paper, 1350, p. 109-124.
• Garcia, M.O. (1996) : Turbidites from slope failure on Hawaiian volcanoes. In: Mc Guire,
W.J., Jones, A.P. & Neuberg J. (eds), Volcano Instability on the Earth and Other Planets. Special Publication of the Geological Society of London 110, p.281-292.
• Knutson,R. (2004): Impact of CO2-Induced Warming on Simulated Hurricane Intensity
and Precipitation: Sensitivity to the Choice of Climate Model and Convective Parameterization, Journal of Climate.
• Labazuy, P. (1996) : Recurrent land sliding events on the submarine flank of Piton de la
Fournaise volcano (Réunion Island). In: MCGUIRE, W.J., JONES, A.P. & NEUBERG J. (eds), Volcano Instability on the Earth and Other Planets. Special Publication of the Geological Society of London 110, p. 293-306.
• Lénat, J.F., Vincent, P. & Bachelery P. (1989) : The off-shore continuation of an active
basaltic volcano: Piton de la Fournaise (Réunion Island, Indian Ocean); structural and geomorphological interpretation from sea beam mapping. J. Volcanol. Geotherm. Res., 36, p. 1-36.
• Merrifield, Firring, Brundit, Chang-Seng et al. (2005): Tide Gauge Observations of the
Indian OceanTsunami, December 26”, American Geophysical Union, 2005

130
• Moore, J. G. & Moore, G.W. (1984): Deposit from a giant wave on the island of Lanai,
Hawaii. Science, 226, p. 1312-1315.
• Moore, J. G., Normark, W. R. & Holcomb, R. T. (1994) –: Giant Hawaiian Landslides. Ann. Rev. Earth. Planet. Sci., 22, p. 119-144.
• Oehler J.F., Labazuy P., Lénat J.F. (2004) Recurrence of major flank lanslides during
the last 2 Ma History of Réunion Island – Bill. Volcanol. 66-585-598.
• Smith, M.S. & Sheperd, J.B. (1995) : Tsunamigenic landslides at Kick ‘em Jenny. In: Mc Guire, W. J., Jones, A. P. & J. Neuberg (eds), Volcano Instability on the Earth and Other Planets. Special Publication of the Geological Society of London 110, p. 115-124.
• Synolakis,C. & Okal, E.( 2007): Far-Field Tsunami Hazard From Mega-Thrust
Earthquakes in the Indian Ocean," just published in Geophysical Journal International.
• Seychelles in Figures – 2007 edition – prepared by National Statistics Bureau, Victoria, Seychelles.
• Seychelles – Initial national communication Under the United Nations Framework
Convention on Climate Change - Ministry of Environment and Transport - Republic of Seychelles - October 2000
Other documents and reports :
• Atlas des zones d’environnement sensible des Seychelles – document
d’accompagnement de la carte au 1/25000 des espaces sensibles – coopération française – 1996.
• December 2004 torrential rain – LTD – 2005 (author unknown). • Détermination d'échelles en 5 niveaux par type de phénomènes naturels pour tous les
risques naturels (chef de projet). French Ministry of Environment /DPPR/SDPRM, 2003. in partnership with METEO France and CEMAGREF (Guillande and others…)
• Environmental impact assessment : introduction guidelines – 3 – Construction – Environmental Management Plan for Seychelles – Action A2 .
• National Statistic Bureau – Statistical bulletin - Population and vital statistics N° 1,
2008, March 2008. • Patrick R Joseph, Patrick J Samson - Vista Do Mar Phenomenon, A geotechnical
Analysis, Key Findings - By Geologist, 26 January 2005, Seychelles National Oil Company. • VISTA DO MAR ESTATE PHENOMENON, WIDESPREAD DAMAGE TO HOUSES AND
PUBLIC IN FRASTRUCTURE, A GEOTECHNICAL INVESTIGATION - PATRICK R JOSEPH & PATRICK J SAMSON, SEYCHELLES NATIONAL OIL COMPANY LTD, JANUARY 2005
• Payet R – East coast reclamation – Phase III – Environement impact assessment –
1998 – Ministry of Land use and Habitat – government of Seychelles. • Preliminary Study of the Drainage Problems in North Mahe - Drainage Task Force
Committee. December 2005 - J. Morgan (Chairman), A. Edmond, G .Esparon, Y. Fostel, F. Cœur de Lion, G. Hoareau, F. Sophola, MA Ernesta, N.Samson (Members).
131
• PRELIMINARY STUDY OF THE FLOODING PROBLEMS IN VICTORIA - Drainage Task Force Committee. June 2005 - J. Morgan (Chairman), A. Edmond , G .Esparon , Y. Fostel, F. Cœur de Lion, G. Hoareau , F. Sophola, MA Ernesta, N.Samson (Members).
• National policy on disaster mitigation for building and infrastructures Development to
withstand adverse weather impact – cabinet memorandum, Presidency of the republic. • UN-DHA - Geneva Situation Report No. 3 - Seychelles: Floods [DHA-03: 08-Sep-
97],Seychelles - FLOODS, 8 September 1997. • UNDP-GEF project document - Capacity Development for Sustainable Land Management
in Seychelles – June 2007.