direct volume variation measurements in fused silica ... · direct volume variation measurements in...
TRANSCRIPT

Direct volume variation measurements in fused silicaspecimens exposed to femtosecond laserChampion, A.; Bellouard, Y.J.
Published in:Optical Materials Express
DOI:10.1364/OME.2.000789
Published: 01/01/2012
Document VersionPublisher’s PDF, also known as Version of Record (includes final page, issue and volume numbers)
Please check the document version of this publication:
• A submitted manuscript is the author's version of the article upon submission and before peer-review. There can be important differencesbetween the submitted version and the official published version of record. People interested in the research are advised to contact theauthor for the final version of the publication, or visit the DOI to the publisher's website.• The final author version and the galley proof are versions of the publication after peer review.• The final published version features the final layout of the paper including the volume, issue and page numbers.
Link to publication
Citation for published version (APA):Champion, A., & Bellouard, Y. (2012). Direct volume variation measurements in fused silica specimens exposedto femtosecond laser. Optical Materials Express, 2(6), 789-798. DOI: 10.1364/OME.2.000789
General rightsCopyright and moral rights for the publications made accessible in the public portal are retained by the authors and/or other copyright ownersand it is a condition of accessing publications that users recognise and abide by the legal requirements associated with these rights.
• Users may download and print one copy of any publication from the public portal for the purpose of private study or research. • You may not further distribute the material or use it for any profit-making activity or commercial gain • You may freely distribute the URL identifying the publication in the public portal ?
Take down policyIf you believe that this document breaches copyright please contact us providing details, and we will remove access to the work immediatelyand investigate your claim.
Download date: 17. Jun. 2018

Direct volume variation measurements in fused
silica specimens exposed to femtosecond laser
Audrey Champion and Yves Bellouard*
Department of Mechanical Engineering Eindhoven University of Technology, Eindhoven, The Netherlands
Abstract: We introduce a new method to investigate localized volume
variations resulting from laser exposure. Our method is based on the
measurement of fused silica cantilevers deflection from which we calculate
the effective stress and density variation in laser-affected zones.
Specifically, we investigate density variations in fused silica exposed to
femtosecond laser exposure in the regime where nanogratings are found.
We demonstrate that a volume expansion is taking place in that particular
regime.
©2012 Optical Society of America
OCIS codes: (160.2750) Glass and other amorphous materials; (230.4000) Microstructure
fabrication; (320.7130) Ultrafast processes in condensed matter, including semiconductors;
(320.2250) Femtosecond phenomena.
References and links
1. K. M. Davis, K. Miura, N. Sugimoto, and K. Hirao, “Writing waveguides in glass with a femtosecond laser,”
Opt. Lett. 21(21), 1729–1731 (1996).
2. A. Marcinkevičius, S. Juodkazis, M. Watanabe, M. Miwa, S. Matsuo, H. Misawa, and J. Nishii, “Femtosecond
laser-assisted three-dimensional microfabrication in silica,” Opt. Lett. 26(5), 277–279 (2001).
3. Y. Bellouard, E. Barthel, A. A. Said, M. Dugan, and P. Bado, “Scanning thermal microscopy and Raman analysis
of bulk fused silica exposed to low-energy femtosecond laser pulses,” Opt. Express 16(24), 19520–19534 (2008),
doi:10.1364/OE.16.019520.
4. Y. Bellouard, T. Colomb, C. Depeursinge, M. Dugan, A. A. Said, and P. Bado, “Nanoindentation and
birefringence measurements on fused silica specimen exposed to low-energy femtosecond pulses,” Opt. Express
14(18), 8360–8366 (2006), doi:10.1364/OE.14.008360.
5. Y. Shimotsuma, P. G. Kazansky, J. R. Qiu, and K. Hirao, “Self-organized nanogratings in glass irradiated by
ultrashort light pulses,” Phys. Rev. Lett. 91(24), 247405 (2003).
6. V. R. Bhardwaj, E. Simova, P. P. Rajeev, C. Hnatovsky, R. S. Taylor, D. M. Rayner, and P. B. Corkum,
“Optically produced arrays of planar nanostructures inside fused silica,” Phys. Rev. Lett. 96(5), 057404 (2006).
7. P. P. Rajeev, M. Gertsvolf, C. Hnatovsky, E. Simova, R. S. Taylor, P. B. Corkum, D. M. Rayner, and V. R.
Bhardwaj, “Transient nanoplasmonics inside dielectrics,” Opt. Phys. 40(11), S273–S282 (2007).
8. E. Bricchi, B. G. Klappauf, and P. G. Kazansky, “Form birefringence and negative index change created by
femtosecond direct writing in transparent materials,” Opt. Lett. 29(1), 119–121 (2004).
9. M. Beresna, M. Gecevičius, P. G. Kazansky, and T. Gertus, “Radially polarized optical vortex converter created
by femtosecond laser nanostructuring of glass,” Appl. Phys. Lett. 98(20), 201101 (2011).
10. C. Hnatovsky, R. S. Taylor, E. Simova, V. R. Bhardwaj, D. M. Rayner, and P. B. Corkum, “Polarization-
selective etching in femtosecond laser-assisted microfluidic channel fabrication in fused silica,” Opt. Lett.
30(14), 1867–1869 (2005).
11. E. N. Glezer and E. Mazur, “Ultrafast-laser driven micro-explosions in transparent materials,” Appl. Phys. Lett.
71(7), 882–884 (1997).
12. C. Hnatovsky, J. R. Taylor, P. P. Rajeev, E. Simova, V. R. Bhardwaj, D. M. Rayner, and P. B. Corkum, “Pulse
duration dependence of femtosecond-laser-fabricated nanogratings in fused silica,” Appl. Phys. Lett. 87(1),
014104 (2005).
13. R. Taylor, C. Hnatovsky, and E. Simova, “Applications of femtosecond laser induced self‐organized planar
nanocracks inside fused silica glass,” Laser Photonics Rev. 2(1-2), 26–46 (2008).
14. J. Canning, M. Lancry, K. Cook, A. Weickman, F. Brisset, and B. Poumellec, “Anatomy of a femtosecond laser
processed silica waveguide,” Opt. Mater. Express 1(5), 998–1008 (2011), doi:10.1364/OME.1.000998.
15. S. Rajesh and Y. Bellouard, “Towards fast femtosecond laser micromachining of fused silica: The effect of
deposited energy,” Opt. Express 18(20), 21490–21497 (2010), doi:10.1364/OE.18.021490.
16. G. G. Stoney, “The tension of metallic films deposited by electrolysis,” Proc. R. Soc. Lond., A Contain. Pap.
Math. Phys. Character 82(553), 172–175 (1909).
#165240 - $15.00 USD Received 21 Mar 2012; revised 27 Apr 2012; accepted 3 May 2012; published 14 May 2012(C) 2012 OSA 1 June 2012 / Vol. 2, No. 6 / OPTICAL MATERIALS EXPRESS 789

17. Y. Bellouard, A. Said, M. Dugan, and P. Bado, “Fabrication of high-aspect ratio, micro-fluidic channels and
tunnels using femtosecond laser pulses and chemical etching,” Opt. Express 12(10), 2120–2129 (2004),
http://www.opticsinfobase.org/oe/abstract.cfm?URI=oe-12-10-2120.
18. H. Sugiura and T. Yamadaya, “Raman-scattering in silica glass in the permanent densification region,” J. Non-
Cryst. Solids 144, 151–158 (1992).
19. J. Bell and P. Dean, “Atomic vibrations in vitreous silica,” Discuss. Faraday Soc. 50, 55–61 (1970).
20. F. L. Galeener, “Band limits and the vibrational spectra of tetrahedral glasses,” Phys. Rev. B 19(8), 4292–4297
(1979).
21. M. Okuno, B. Reynard, Y. Shimada, Y. Syono, and C. Willaime, “A Raman spectroscopy study of shock-wave
densification of vitreous silica,” Phys. Chem. Miner. 26(4), 304–311 (1999).
22. J. W. Chan, T. Huser, S. Risbud, and D. M. Krol, “Structural changes in fused silica after exposure to focused
femtosecond laser pulses,” Opt. Lett. 26(21), 1726–1728 (2001).
23. W. J. Reichman, D. M. Krol, L. Shah, F. Yoshino, A. Arai, S. M. Eaton, and P. R. Herman, “A spectroscopic
comparison of femtosecond-laser-modified fused silica using kilohertz and megahertz laser systems,” J. Appl.
Phys. 99(12), 123112 (2006).
24. A. Agarwal and M. Tomozawa, “Correlation of silica glass properties with the infrared spectra,” J. Non-Cryst.
Solids 209(1-2), 166–174 (1997).
1. Introduction
Fused silica (a-SiO2) exposure to low-energy (i.e. below the ablation threshold) femtosecond
laser pulses, leads to interesting effects such as a local increase of refractive index [1] and/or a
local increase of etching rate [2]. When exposing fused silica to femtosecond laser beams,
three types of structural modifications (commonly labeled “Type I, II and III”) have been
reported as a function of fluence and pulse duration.
In the first regime (type I), homogeneous modifications are observed in the laser affected
zone (LAZ) leading to an increase of refractive index [1] and an increase of etching rate [2].
Experimental evidences suggesting localized densifications for type I structures, have been
reported in [3,4]. In the intermediate regime (type II) – regime on which our paper is focused,
self-organized patterns consisting of “nanogratings” are found [5–7]. These patterns present
interesting optical properties such as form-birefringence [8] giving the possibility to create
novel photonics devices such as polarization converters [9]. Interestingly and although their
structures seem to be radically different than for type I modifications, nanogratings also lead
to a local increase of etching rate strongly dependent on the polarization [10]. Finally, Type
III modifications refer to voids in the material [11]. Exposure conditions to obtain the three
different types of modifications are summarized in [12] for a given set of experimental
conditions.
The physical mechanism responsible for the formation of nanogratings is not fully
understood and various models have been proposed (see for instance [5] and [6,7]). From a
material point-of-view, the nature of structural changes remains elusive. Shimotsuma et al. [5]
indicated that nanogratings contain oxygen depleted-zones. To explain the enhanced etching
mechanism in the nanogratings regime, a model based on oriented nanocracks was proposed
[13]. In this model, nanogratings are interpreted as a set of oriented cracks. However, recent
SEM observations [14] showing the presence of a porous structure inside the lower-index
zone of the nanogratings contradicts this interpretation. In addition, we have shown [15] that,
in the nanogratings regime, the etching rate first reaches a maximum for a given amount of
deposited energy regime and then decays for higher amount of deposited energy. This
observation cannot be explained with a model where an accelerated etching rate is driven by
the presence of oriented cracks. Indeed, according to this nanocrack model, the etching rate
should keep on increasing (or at least not diminish) with the increasing amount of deposited
energy (i.e. the number of nanocracks should increase with the energy deposited). Therefore,
another type of physical mechanism is responsible for the accelerated etching rate. In
particular, we suspect localized densification coupled to stress accumulation and relaxation to
account for the accelerated etching in laser affected zones consisting of nanogratings.
To further understand the etching mechanism, it is essential to be able to quantify possible
volume changes and deformation resulting from the possible presence of stress. In this paper,
#165240 - $15.00 USD Received 21 Mar 2012; revised 27 Apr 2012; accepted 3 May 2012; published 14 May 2012(C) 2012 OSA 1 June 2012 / Vol. 2, No. 6 / OPTICAL MATERIALS EXPRESS 790

we introduce a new experimental technique for quantifying density variations resulting from
laser exposure that we apply here to the regime where nanogratings form. Note that the
methodology proposed here could be used in a variety of situation involving structural
changes introduced by laser exposure.
2. Methodology for laser-induced volume variation measurement
Our method is based on micro-cantilevers deflections. The working principle is outlined in
Fig. 1. A transparent cantilever is exposed locally to a laser beam, but only close to its
anchoring point and only on the upper part (but below surface). In the cantilever portion
exposed to the laser beam, the modified zone and the unaffected layers form a bimorph
composite structure (see Fig. 1). If a volume expansion or reduction occurs in the laser
affected zone, the bimorph element will respectively bend down or up. The bimorph-zone
forms a hinge. Any resulting displacement is amplified by the cantilever arm. Note that
because of the geometrical amplification, the volume that needs to be laser-irradiated can be
minimized to as little as a single scanned line. The deflection amplification provides a simple
and yet efficient method for increasing the measurement range and achieving high resolution.
In the experiments reported here, the total length of the cantilever largely exceeds the bimorph
structure length.
Fig. 1. Left: Working principle for measuring volume changes using on cantilever deflection.
The laser exposure takes place only near the anchoring point of the cantilever and only in its
upper-half thickness and forms a bimorph composite structure that induces a local bending of
the cantilever. The deflection, measured at the tip of the cantilever, is effectively amplified by
the length of the cantilever. Right: Schematic of the cantilever cross-section and definition of
the geometrical parameters used in the paper.
Based on the measured deflection, the localized volume expansion in the laser affected
zone is extracted. To do so, we use two mechanical models. The first one considers the laser
affected zone as a continuously and homogeneously modified layer on a bulk-unmodified
substrate. Effectively, this is similar to a bimorph structure made of two different materials.
We use the Stoney equation [16] to calculate the stress in the laser affected portion of the
cantilever and then, to estimate the volume variation. Here, we assume that the boundaries
between the two layers are in a first approximation well-defined. Stoney equation enables us
to calculate the strain in the upper layer as a function of the radius of curvature of the bimorph
and is expressed by:
( )
2
26 1
s s
zz
f
E d
R dσ
ν=
− (1)
where Es is the young modulus of the ‘substrate’ (here the bulk unmodified fused silica), ds
the substrate thickness, df the thickness of the laser-affected layer, ν the Poisson ratio of the
unmodified zone and R the radius of curvature (of the bimorph zone).
We assume that R is measured along the neutral axis of the cantilever beam. R is
calculated from the deflection measurement (see Fig. 1, right for the geometrical parameters).
#165240 - $15.00 USD Received 21 Mar 2012; revised 27 Apr 2012; accepted 3 May 2012; published 14 May 2012(C) 2012 OSA 1 June 2012 / Vol. 2, No. 6 / OPTICAL MATERIALS EXPRESS 791
sin
laz
laz
wsR w L
R
L
α αδδ α
= =
=
≃ (2)
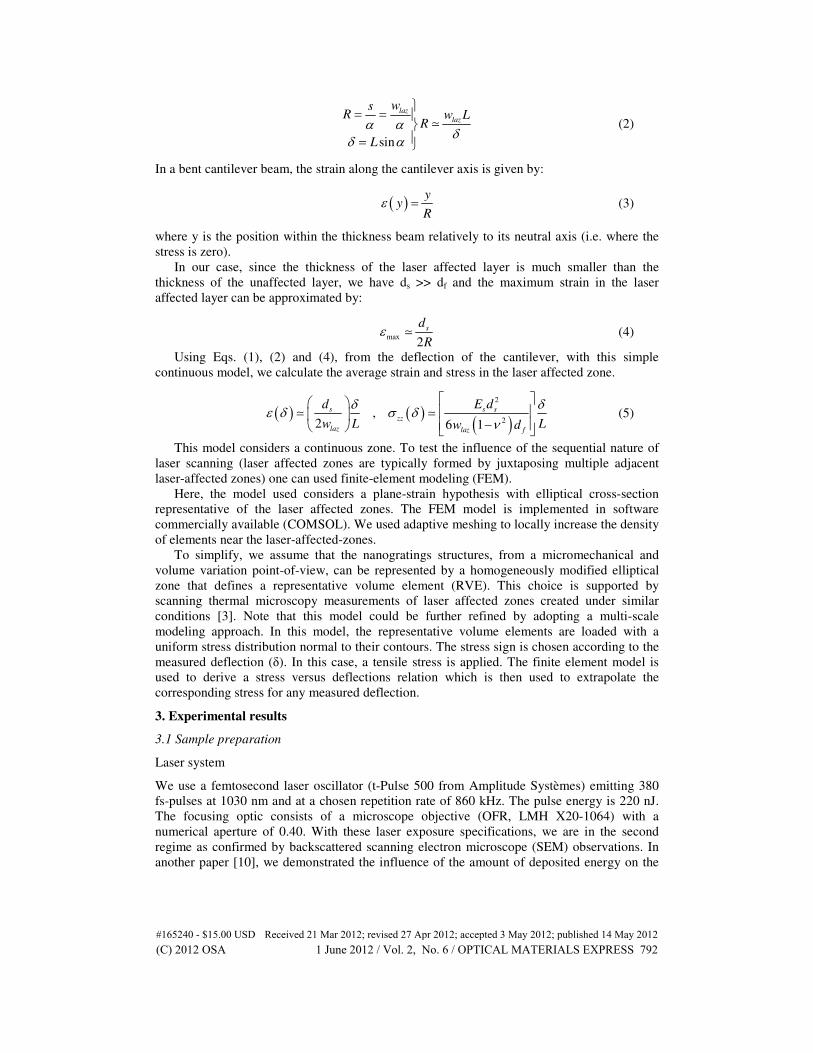
In a bent cantilever beam, the strain along the cantilever axis is given by:
( ) yy
Rε = (3)
where y is the position within the thickness beam relatively to its neutral axis (i.e. where the
stress is zero).
In our case, since the thickness of the laser affected layer is much smaller than the
thickness of the unaffected layer, we have ds >> df and the maximum strain in the laser
affected layer can be approximated by:
max2
sd
Rε ≃ (4)
Using Eqs. (1), (2) and (4), from the deflection of the cantilever, with this simple
continuous model, we calculate the average strain and stress in the laser affected zone.
( ) ( )( )
2
2,
2 6 1
s s s
zz
laz laz f
d E d
w L Lw d
δ δε δ σ δ
ν
− ≃ ≃ (5)
This model considers a continuous zone. To test the influence of the sequential nature of
laser scanning (laser affected zones are typically formed by juxtaposing multiple adjacent
laser-affected zones) one can used finite-element modeling (FEM).
Here, the model used considers a plane-strain hypothesis with elliptical cross-section
representative of the laser affected zones. The FEM model is implemented in software
commercially available (COMSOL). We used adaptive meshing to locally increase the density
of elements near the laser-affected-zones.
To simplify, we assume that the nanogratings structures, from a micromechanical and
volume variation point-of-view, can be represented by a homogeneously modified elliptical
zone that defines a representative volume element (RVE). This choice is supported by
scanning thermal microscopy measurements of laser affected zones created under similar
conditions [3]. Note that this model could be further refined by adopting a multi-scale
modeling approach. In this model, the representative volume elements are loaded with a
uniform stress distribution normal to their contours. The stress sign is chosen according to the
measured deflection (δ). In this case, a tensile stress is applied. The finite element model is
used to derive a stress versus deflections relation which is then used to extrapolate the
corresponding stress for any measured deflection.
3. Experimental results
3.1 Sample preparation
Laser system
We use a femtosecond laser oscillator (t-Pulse 500 from Amplitude Systèmes) emitting 380
fs-pulses at 1030 nm and at a chosen repetition rate of 860 kHz. The pulse energy is 220 nJ.
The focusing optic consists of a microscope objective (OFR, LMH X20-1064) with a
numerical aperture of 0.40. With these laser exposure specifications, we are in the second
regime as confirmed by backscattered scanning electron microscope (SEM) observations. In
another paper [10], we demonstrated the influence of the amount of deposited energy on the
#165240 - $15.00 USD Received 21 Mar 2012; revised 27 Apr 2012; accepted 3 May 2012; published 14 May 2012(C) 2012 OSA 1 June 2012 / Vol. 2, No. 6 / OPTICAL MATERIALS EXPRESS 792

etching rate. Here, in these experimen
tested various levels of deposited energy, namely from 6 J/mm
Cantilever preparation
The cantilevers (shown in Fig. 2
following a process described in another paper [
used a scanning speed of 5 mm/s, a pulse energy of 250 nJ, a repetition rate of 860 kHz and a
NA of 0.40. After chemical etching in low
exposed to the laser beam but only in their upper
mm-squares with a thickness of 500 microns. The material is OH
cantilever exposure is made by scanning adjacent lines (going b
micron spacing over a width of 5 mm. The writing speed was varying in order to obtain the
specified deposited energy. The writing was tested with two linear polarizations along and
perpendicular to the cantilever axis).
Fig. 2. (a) Top view shown the contour of the cantilevers (dark line) and the areas exposed to
the laser beam after etching (light grey). To save space, the cantilevers are folded one on
another. (b) Images of the cantilevers taken with an optical microscope in r
modified zones are clearly visible.
Lines for etching comparison
Using the same type of substrate, we made a series of lines below the surface with the same
energy deposition and exposure conditions. This specimen is used to correlate the me
deflections with the etching rate. The experimental protocol to measure the etched length is
described in [14].
3.2 Deflection measurement
Figure 3 shows the cantilever deflection as a function of the energy deposition. It is displayed
for both polarizations (transverse/parallel to the writing direction). A confocal microscope
(Sensofar -PLµ2300) is used to measure the deflection with an error of +/
the amplification mechanism, the data span from 50 to 90 µm. For this particular exposure
condition (regime II), we observe a deflection in the opposite direction from the LAZ
indicating a volume expansion after exposure. Furthermore, we
dependence with the polarization.
etching rate. Here, in these experiments and to compare with the influence of etching, we
tested various levels of deposited energy, namely from 6 J/mm2 to 150 J/mm
2.
Fig. 2) are fabricated using the same laser than specified above and
a process described in another paper [17]. As processing parameters, here we have
used a scanning speed of 5 mm/s, a pulse energy of 250 nJ, a repetition rate of 860 kHz and a
NA of 0.40. After chemical etching in low-concentration HF (2.5%), the cantilevers are again
exposed to the laser beam but only in their upper-half thickness. The substrates used are 25
squares with a thickness of 500 microns. The material is OH-rich fused silica. The
cantilever exposure is made by scanning adjacent lines (going back and forth) with two
micron spacing over a width of 5 mm. The writing speed was varying in order to obtain the
specified deposited energy. The writing was tested with two linear polarizations along and
perpendicular to the cantilever axis).
(a) Top view shown the contour of the cantilevers (dark line) and the areas exposed to
the laser beam after etching (light grey). To save space, the cantilevers are folded one on
another. (b) Images of the cantilevers taken with an optical microscope in reflection. The
modified zones are clearly visible.
Lines for etching comparison
Using the same type of substrate, we made a series of lines below the surface with the same
energy deposition and exposure conditions. This specimen is used to correlate the me
deflections with the etching rate. The experimental protocol to measure the etched length is
3.2 Deflection measurement
shows the cantilever deflection as a function of the energy deposition. It is displayed
for both polarizations (transverse/parallel to the writing direction). A confocal microscope
PLµ2300) is used to measure the deflection with an error of +/− 0.1 µm. Thanks to
the amplification mechanism, the data span from 50 to 90 µm. For this particular exposure
condition (regime II), we observe a deflection in the opposite direction from the LAZ
indicating a volume expansion after exposure. Furthermore, we note a possible weak
dependence with the polarization.
ts and to compare with the influence of etching, we
) are fabricated using the same laser than specified above and
]. As processing parameters, here we have
used a scanning speed of 5 mm/s, a pulse energy of 250 nJ, a repetition rate of 860 kHz and a
ers are again
half thickness. The substrates used are 25
rich fused silica. The
ack and forth) with two-
micron spacing over a width of 5 mm. The writing speed was varying in order to obtain the
specified deposited energy. The writing was tested with two linear polarizations along and
(a) Top view shown the contour of the cantilevers (dark line) and the areas exposed to
the laser beam after etching (light grey). To save space, the cantilevers are folded one on
eflection. The
Using the same type of substrate, we made a series of lines below the surface with the same
energy deposition and exposure conditions. This specimen is used to correlate the measured
deflections with the etching rate. The experimental protocol to measure the etched length is
shows the cantilever deflection as a function of the energy deposition. It is displayed
for both polarizations (transverse/parallel to the writing direction). A confocal microscope
0.1 µm. Thanks to
the amplification mechanism, the data span from 50 to 90 µm. For this particular exposure
condition (regime II), we observe a deflection in the opposite direction from the LAZ
note a possible weak-
#165240 - $15.00 USD Received 21 Mar 2012; revised 27 Apr 2012; accepted 3 May 2012; published 14 May 2012(C) 2012 OSA 1 June 2012 / Vol. 2, No. 6 / OPTICAL MATERIALS EXPRESS 793

Fig. 3. (a): Deflection measurements for different levels of energy deposition with longitudinal
and transverse polarization. (b): Equivalent elongation calculated and compared with the
simulation. The FEM model predicts in average a 5% higher stress than for the continuous
analytical model. The deflection measurement error is +/− 0.1 µm.
3.3 Corresponding stress in the laser affected zones
Using Eq. (5) applied to the deflection measurements shown in Fig. 3, we estimate the
principal stress in the laser affected zones (Fig. 4). The data are also compared with the results
from the FEM simulations.
Fig. 4. Calculated stress using the continuous and discrete model for transverse (a) and
longitudinal (b) polarization defined with respect to the writing direction (s).
The maximum elongation variation is estimated to be 0.03%. The FEM model predicts in
average a 5% higher stress than for the continuous analytical model.
3.4 Effect of the energy deposition on the etching rate
The etching rate dependence on the energy deposition after femtosecond laser exposure has
been shown in a previous work [10]. Here, we reproduce these experiments but with the
rigorously identical laser exposure conditions than the one used for the cantilever
experiments. The results are shown in Fig. 5.
#165240 - $15.00 USD Received 21 Mar 2012; revised 27 Apr 2012; accepted 3 May 2012; published 14 May 2012(C) 2012 OSA 1 June 2012 / Vol. 2, No. 6 / OPTICAL MATERIALS EXPRESS 794

Fig. 5. Graph comparing both polarizations in term of etching rate according to the energy
deposition. We measure the etched length with an optical microscope (10x objectives). The
error is +/− 1µm.
The etched length grows steeply and reaches a maximum between 10 and 20 J/mm2 for both
polarizations. For the 90 deg polarization, the etching rate is almost twice faster than for the 0
deg which is consistent with [10].
The maximum cantilever deflections and the maximum etched lengths are found at about
the same energy deposition level (i.e. between 10 and 30 J/mm2), illustrating a strong
correlation between the two phenomena.
3.5 Evolution of Raman spectra as a function of the deposited energy
Fused silica consists of randomly arranged SiO4 tetrahedra. The oxygen atoms sit at the corner
of each tetrahedron and are shared with two adjacent tetrahedra. The bond angle decreases
under a compressive stress and increases under a tensile stress [18]. Bond angle variation can
be observed using Raman spectroscopy that provides information related to glass structural
changes caused by mechanical stress. For SiO2, three fundamental vibrations bands located
between 450 and 1200 cm−1
[19,20] are observed: asymmetric stretching (AS) from 1050 to
1100 cm−1
, symmetric stretching (SS) or bending mode from 790 to 810 cm−1
and symmetric
oxygen stretching or bending-rock (R) from 440 to 470 cm−1
. These bands shift when the
bond angle Si-O-Si changes: the band at 1050 shifts to a higher wave number and the two
others bands shift to a lower wave number [20]. Two peaks at 490 and 604 cm−1
, called D0
and D2 respectively, are modified when the bond angle changes (mechanical densification
shock wave [21]). Previous works [3,22,23] have reported that laser-induced modifications in
fused silica produce visible changes in their Raman spectra. For instance, it was shown that
the D2 peak (at 605 cm−1
) increases in intensity. This change is interpreted [3,22,23] with a
change of SiO4 ring size toward smaller rings (n = 3). The D0 (located at 490 cm−1
) moves
toward lower wave number for mechanically densified fused silica but also for femtosecond
laser induced type I and II modifications [3].
Raman spectra of the laser exposed areas for the same energy depositions used in the
etching experiment discussed above, were measured. Characteristics Raman spectra are
shown in Fig. 6. The reference spectrum is taken in the pristine zone of the silica.
Measurements made without post-processing show a strong fluorescence background, due
essentially to the color-centers (NBO) introduced by the laser that get excited with our Raman
illumination conditions (632 nm-laser source). To remove the color-centers, the specimen is
heated up to 150°C for 10 hours. Note that the tip deflections measured after the 10h-heating
period does not change compared to their initial procedure, indicating that the post-processing
step-conditions do not modify the mechanical state of the cantilevers.
#165240 - $15.00 USD Received 21 Mar 2012; revised 27 Apr 2012; accepted 3 May 2012; published 14 May 2012(C) 2012 OSA 1 June 2012 / Vol. 2, No. 6 / OPTICAL MATERIALS EXPRESS 795

Fig. 6. Raman spectra for two polarizations (longitudinal and perpendicular to the writing
direction) compared to a reference spectrum, measured in the pristine material. These curves
are obtained after heating up the material at 150°C to remove colored-centers. The laser
exposures for the longitudinal and perpendicular cases are: 10 J/mm2 and 16 J/mm2
respectively.
From each Raman spectrum taken at various levels of deposited energy and for the two
polarization states, the D2 peaks are extracted after normalization and compared. The results
are shown in Fig. 7.
Fig. 7. D2-peak variation as a function of the energy deposition level for both polarizations after
heating at 150°C during 10 hours (to annihilate color-centers).
We observe a shift of the D0-peak to lower wave-number after exposure and an increase of
the D2-peak. These observations are consistent with our own observations made on mainly
type I modifications, but also on nanogratings [3]. The bond angle decreases after laser
exposure, indicating the possible presence of compressive stress in or around the LAZ, as well
as the formation of lower-order rings. These Raman observations point towards a possible
densification of the glass matrix.
This is apparently contradicting the expansion phenomena observed for the cantilever.
Note that the trend observed in Fig. 7 is the same than for the etching length and for the
cantilever deflection: a sharp increase followed by a gradual decay. This observation hints a
rapid buildup of stress associated with structural modifications.
4. Discussion and interpretation
Our cantilever method has shown that, in the second regime where nanogratings are found,
the laser affected zone expands. The relative estimated expansion is 0.03%. Recently, the
#165240 - $15.00 USD Received 21 Mar 2012; revised 27 Apr 2012; accepted 3 May 2012; published 14 May 2012(C) 2012 OSA 1 June 2012 / Vol. 2, No. 6 / OPTICAL MATERIALS EXPRESS 796

presence of porous material in the LAZ has been reported [14]. This observation, together
with previous observations, contradicts the model assuming that nanogratings are de facto
cracks [13]. Cracks may be found when the stress concentration in the nanogratings is
sufficiently high but do not form ad-initio [3]. Indeed, the formation of a porous material
made of nano-scale bubbles can account for the expansion we are observing in locally laser-
exposed cantilevers. On the other hand, the Raman spectra suggest the presence of lower-ring
numbers in the cantilevers laser affected zones. Lower-ring numbers would induce a
densification and therefore, an opposite effect to what we are observing in cantilevers.
Fig. 8. Proposed scenario to explain the various phenomena reported in this paper.
To reconcile the two observations, we propose the following scenario, outlined in Fig. 8. If we
admit our LAZ are made of porous material (in the nanogratings), every nano-scale bubble
during their formation would induce the formation of compressively stressed zones
surrounding them that, if the stress is sufficiently high, locally induce a mechanical
densification. The stress is also responsible for bond angle variations in the SiO2 matrix that
explain a faster etching rate in the LAZ. The correlation between stress and etching rate was
shown in [24]. This supports the similar trend we are observing between the cantilever
bending and the etching rate. The two experimental curves have similar features and show a
characteristic maximum for the same deposited energy levels.
We note that the etching rate also depends on the deposited energy. A maximum etching
rate is observed for a given level, here about 20 J/mm2. The presence of this maximum
suggests that the stress gradually builds up as the material is repeatedly ‘hammered’ by the
femtosecond laser. When this stress becomes too high, cracks nucleate randomly and stress
relaxation is observed globally in the LAZ explaining the reduced etching rate as well as the
lowering of the cantilever deflection. The cantilevers do not completely recover their
deformation due to the formation of irreversible, non-affine open interfaces (see Fig. 8). The
increased etching rate is also still observed because some irreversible densification took place
in an earlier phase of the process, prior to the formation of cracks. The presence of open pores
may offer a path for the etchant to penetrate inside the material but overall, the etching
mechanism is much less efficient than the densification-driven and stress-induced ones. This
model is also compatible with the etching rate polarization anisotropy [10]. The laser
exposure condition segregates densified zones in the narrow bands forming the nanogratings.
If these zones are connected longitudinally, it will indeed favor the etching rate, while a
#165240 - $15.00 USD Received 21 Mar 2012; revised 27 Apr 2012; accepted 3 May 2012; published 14 May 2012(C) 2012 OSA 1 June 2012 / Vol. 2, No. 6 / OPTICAL MATERIALS EXPRESS 797
parallel assembly of nanogratings will be less efficient. Our observations show that in both
polarization cases, the formation of cracks slow down substantially the etching rate and are
counter-productive.
5. Conclusion
We have demonstrated a method to quantitatively estimate the level of volume changes in the
laser affected zone after femtosecond laser exposure. In particular, we have shown that for
nanogratings, a volume expansion is taking place and that the energy deposition has an
influence on the volume variation that can be correlated to both, Raman spectra and etching
rate. We interpret these phenomena by the formation of a porous structure in the nanogratings
(consistent with experimental observations [14]), that locally stresses and densifies the
material – explaining the peak observed for etching rate, Raman spectra and volume
expansion; followed by crack formation and stress relaxation that accounts for the less
efficient etching observed at higher energy deposited. This work emphasizes the role of the
stress in the etching rate and its importance for accurately controlling etched patterns.
Acknowledgments
The authors would like to thank Marco Hendrix for his help with the Raman setup and for the
Chemical department for letting us use their Raman instruments. This work is supported by
the European Commission through the Seventh Framework program
(http://www.femtoprint.eu/) [Project Femtoprint, NMP, project no 260103].
#165240 - $15.00 USD Received 21 Mar 2012; revised 27 Apr 2012; accepted 3 May 2012; published 14 May 2012(C) 2012 OSA 1 June 2012 / Vol. 2, No. 6 / OPTICAL MATERIALS EXPRESS 798