direct use of pgv for estimating peak nonlinear...
TRANSCRIPT
* Correspondence to: S. Akkar, Earthquake Engineering Research Center, Department of Civil Engineering, Middle East Technical University 06531 Ankara, Turkey
† Email: [email protected]
1
Direct use of PGV for estimating peak nonlinear oscillator displacements
Sinan Akkar*,† and Bilge Küçükdoğan
Earthquake Engineering Research Center, Department of Civil Engineering, Middle East Technical University 06531 Ankara, Turkey
SUMMARY
A predictive model is presented for estimating the peak inelastic oscillator displacements (Sd,ie) from
peak ground velocity (PGV). The proposed model accounts for the variation of Sd,ie for bilinear
hysteretic behavior under constant ductility (µ) and normalized lateral strength ratio (R) associated
with postyield stiffness ratios of α = 0% and α = 5%. The regression coefficients are based on a
ground-motion database that contains dense-to-stiff soil site recordings at distances of up to 30 km
from the causative fault. The moment magnitude (M) range of the database is 5.2 ≤ M ≤ 7.6 and the
ground motions do not exhibit pulse-dominant signals. Confined to the limitations imposed by the
ground-motion database, the model can estimate Sd,ie by employing the PGV predictions obtained from
the attenuation relationships (ground motion prediction equations). This way the influence of
important seismological parameters can be incorporated to the variation of Sd,ie in a fairly rationale
manner. This feature of the predictive model advocates its implementation in the probabilistic seismic
hazard analysis that employs scalar ground-motion intensity indices. Various case studies are
presented to show the consistent estimations of Sd,ie by the proposed model. The error propagation in
the Sd,ie estimations is also discussed when the proposed model is associated with various attenuation
relationships.
KEYWORDS: Peak ground velocity; Inelastic spectral displacement; Ground-motion predictive
models; Regression; Seismic design/performance assessment; Bilinear hysteretic model

Revised Manuscript 2
1. INTRODUCTION
Most approximate models that are developed for estimating the expected peak inelastic oscillator
displacements (inelastic spectral displacement, Sd,ie) have made use of elastic period (T) dependent
empirical relationships for a given displacement ductility (µ) or normalized lateral strength (R).
Concerning the historical development of these models, they are generally based on Rµ - µ - T
relationships whose ground breaking studies were conducted by Veletsos and Newmark [1] and
further improved by Newmark and Hall [2, 3] within the context of force-based design to approximate
the oscillator yield-strength (Fy) that would limit a predefined µ value. More recently various
researchers have provided useful period-dependent empirical regression equations for direct estimation
of Sd,ie either as a function of µ (e.g. References [4-7]) or R (e.g. References [8, 6]). Regardless of the
underlying approach, these studies used ground-motion datasets to establish the empirical relationships
based on the quantity and quality of the accumulated strong-motion records at the time when they
were conducted. Depending on the objective of the study the datasets were compiled to bring forward
various aspects of ground-motion parameters. The studies that followed the Veletsos and Newmark
approach have made use of peak ground-motion values to define the frequency content of the ground
motion. They then derived their empirical relationships to relate elastic to inelastic oscillator response
for the spectral period ranges described by the peak ground-motion ratios. These studies classified
their datasets according to ground-motion duration, moderate- to large-magnitude events, pulse-
dominant signals or severe events produced by a particular fault type (e.g. References [9-11]). Using
small- to large-size ground-motion datasets, studies conducted by Elghadamsi and Mohraz [12], Sewel
[13], Nassar and Krawinkler [14], Miranda [4, 15], Song and Pincheira [16], Ruiz-García and Miranda
[7, 8], Arroyo and Teran [17] and Peköz and Pincheira [18] mostly emphasized the influence of
different site classes on the estimation of Sd,ie. Chopra and Chintanapakdee [6, 19] classified their
ground motions according to different magnitude-distance bins as well as for different site classes.
Researchers like MacRae and Roeder [20], Baéz and Miranda [21], MacRae et al. [22] and Chopra and
Chintanapakdee [23] shaped their Sd,ie predictive expressions on the differences between near- and far-
fault ground-motion records. These studies revealed significant insight about the nonlinear oscillator
behavior under different load-deformation rules. The reader is referred to the above cited studies as
well as Miranda and Bertero [25] and Mahin and Bertero [26] for a detailed review on nonlinear
Revised Manuscript 3
oscillator response studies for the estimation of Sd,ie. In addition to these efforts few studies developed
empirical Rµ - µ - T relationships that are directly based on normalized spectrum [27-29] to account for
the influence of earthquake source in the estimation of inelastic oscillator response that is generally
overlooked by other studies.
Regardless of the approximate model, the major concept used in the estimation of Sd,ie is
eaedied STR
SR
S ,
2
,, 2⎟⎠⎞
⎜⎝⎛==
πµµ (1)
In the case of Rµ - µ - T relationships, one would use the expected Rµ for a given µ - T pair to estimate
Sd,ie from its elastic counterpart Sd,e (or equivalently utilizing the more familiar elastic pseudo-spectral
acceleration, Sa,e that can be related to Sd,e through the constant (T/2π)2 as shown in Eq. (1)). For the
direct empirical relationships, the analyst relates Sd,ie to Sd,e by using the regression equations that
mimic the expected variation of µ/R either for a constant ductility level or normalized lateral strength
ratio. Thus, an alternative way of expressing Eq. (1) is
eaxedxied STCSCS ,
2
,, 2 ⎟
⎠⎞
⎜⎝⎛==
π (2)
where Cx is the period-dependent modification factor either for constant µ or R. The expressions
presented in Eqs. (1) and (2) establish a linear relationship between inelastic and elastic spectral
displacements (or equivalently a linear variation between Sd,ie and Sa,e) for a given elastic period, T. As
a matter of fact this approach is one of the current methods used in the simplified nonlinear static
procedures (e.g. References [30-33]). Note that the ongoing research efforts for the estimation of Sd,ie
continuously result in new predictive models. In a recent study, Tothong and Cornell [34] proposed an
attenuation relationship for estimating Sd,ie as a function of oscillator yield-strength and magnitude.
Recent research that aims to associate structural deformation demands with alternative ground-
motion intensities has conveyed valuable information about the merits of PGV. Various studies have
shown that PGV can be considered as a reasonable scalar ground-motion parameter that correlates well
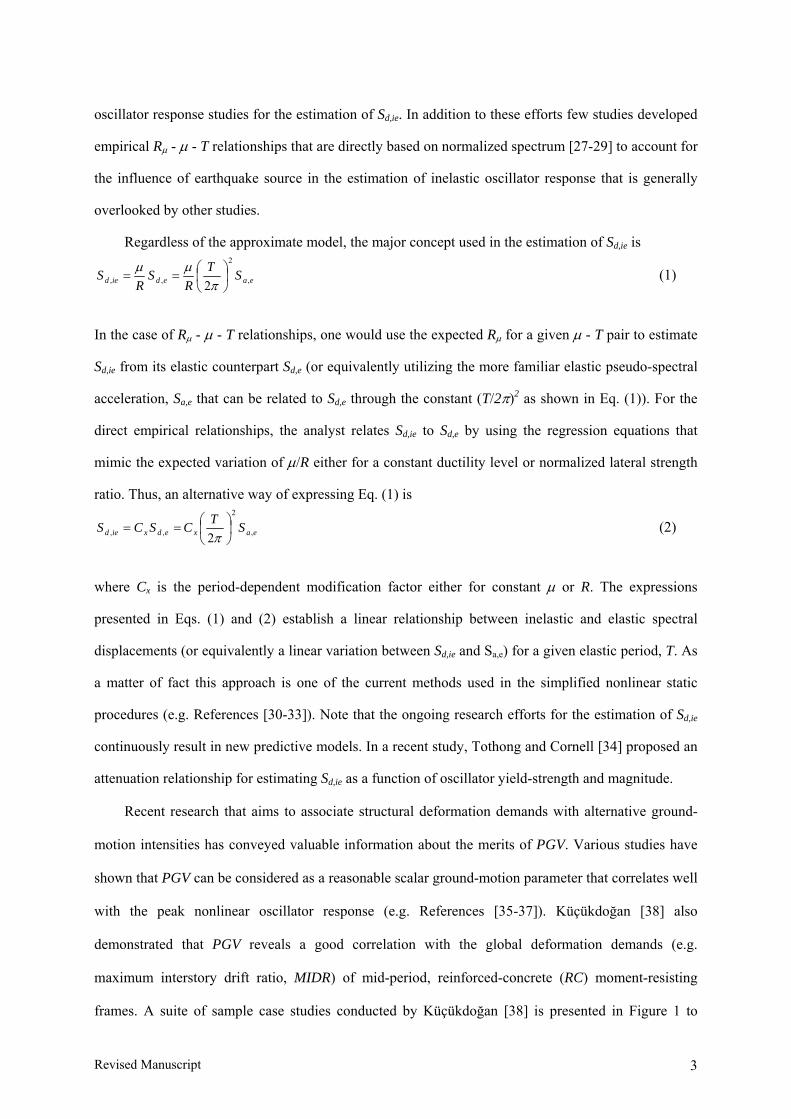
with the peak nonlinear oscillator response (e.g. References [35-37]). Küçükdoğan [38] also
demonstrated that PGV reveals a good correlation with the global deformation demands (e.g.
maximum interstory drift ratio, MIDR) of mid-period, reinforced-concrete (RC) moment-resisting
frames. A suite of sample case studies conducted by Küçükdoğan [38] is presented in Figure 1 to

Revised Manuscript 4
illustrate the above conclusion. The scatter plots compare the correlation between PGV and MIDR
computed from the nonlinear response history analysis of a set of RC frame buildings with
fundamental periods between 0.40s < T1 ≤ 1.3s. The frame systems were subjected to the ground-
motion dataset in Akkar and Özen [36]. The straight lines in each plot help to illustrate the variation of
MIDR with the scalar ground-motion index PGV. Spearman’s non-parametric coefficient (ρ) was used
to assess the correlation between these two variables because it does not require the assumption that
the relationship between PGV and MIDR is linear, nor does it require any assumption about the
frequency distribution of the variables [40]. The high ρ values presented in each plot advocates that
PGV reveals versatile information about the nonlinear multi-degree-of-freedom (MDOF) deformation
demands that has been observed previously for the peak nonlinear oscillator displacements. The
correlation between PGV and MIDR increases as the story number increases that is inherently related
to the shift in the building period towards longer spectral range. This observation was one of the
driving factors for using PGV as the ground-motion intensity measure to assess the seismic
performance of building stocks in the Istanbul metropolitan area [41, 42].
This study presents alternative empirical regression equations as a function PGV for estimating
Sd,ie. The predictive equations were derived from a suite of dense-to-stiff soil ground motions at
relatively short source-to-site distances. The equations are devised for estimating 5%-damped Sd,ie for
bilinear oscillator response with postyield stiffness ratios of α = 0% and α = 5%. The estimations are
based on constant ductility and normalized lateral strength. The information revealed from the
constant ductility spectral displacements is useful for seismic design whereas Sd,ie obtained from the
normalized lateral strength yields direct information about the deformation demands on existing
structures. The bilinear hysteretic model and the associated α values are widely used to represent the
pushover curves of various MDOF systems in nonlinear static procedures. The paper also illustrates
the implementation of the predictive model by making use of PGV estimations computed from recent
ground motion prediction equations (GMPEs) under different scenarios. When implemented together
with the GMPEs, the predictive model can be useful for probabilistic seismic hazard analysis (PSHA)
methods that are based on a scalar ground-motion intensity measure.
Revised Manuscript 5
1 10 100
MID
R (%
)
0.01
0.1
1
1 10 100
PGV (cm/s)1 10 100
MID
R (%
)
0.01
0.1
1
PGV (cm/s)1 10 100
ρ = 0.600 ρ = 0.687
ρ = 0.680 ρ = 0.709
3 st. (T1=0.41-0.73s) 5 st. (T1=0.70-1.04s)
7 st. (T1=0.87-1.15 s) 9 st. (T1=0.99-1.30 s)
Figure 1. Correlation between PGV and MIDR for a set of moment-resisting frame systems subjected to the ground motions in Akkar and Özen [36]. The plots present the MIDR vs. PGV scatters from 5 sets of building models with 3-, 5-, 7- and 9-stories. The nonlinear RHA were conducted by using IDARC 2D [39]. All frame models have 3 bays and are regular in plan with 5m span width and 3m story height. They comply with the modern seismic provisions such that they can undergo sufficient nonlinear deformation without experiencing collapse when subjected to design earthquakes. Detailed information about the models is presented in Küçükdoğan [38] that can be provided to the interested reader upon request.
2. GROUND-MOTION DATASET
The ground-motion dataset comprises of 105 soil site records from 46 shallow events with a moment
magnitude range 5.2 ≤ M ≤ 7.6. The shortest horizontal distance from the surface projection of the
fault rupture (Rjb, [43]) of the accelerometric data is less than 30km that is of practical importance for
most engineering applications. The dataset was compiled from the studies by Akkar and Özen [36] and
Akkar and Bommer [44]. An arbitrary horizontal component was selected randomly from each

Revised Manuscript 6
accelerogram. Almost all pre-1999 data is analogue recordings and they constitute the majority in the
dataset. The records with forward directivity effects were excluded since such ground motions are
dominated by pulse-type signals that result in a distinct structural behavior depending on the pulse
period and the amplitude of ground velocity (e.g. References [45-48]). The main features of the
records used in the regression analysis are listed in Table A1 in Appendix A. The distribution of
records with respect to faulting style is uneven. The dataset is mainly dominated by strike-slip (S)
events (45 records). There are 31 records from reverse (R) faulting earthquakes and the number of
records from normal (N) faulting is 23. The style-of-faulting of the 6 records from the 1989 Loma
Prieta event is identified as reverse-oblique (RO) in the literature.
Figure 2 presents information about the magnitude-distance distribution and the usable period
range of the ground-motion dataset. The scatter plot presented in Figure 2.a indicates that the data has
a better resolution between 5.5 ≤ M ≤ 7.0 and Rjb ≤ 25km. The upper 30m average shear-wave velocity
(Vs,30) of each strong-motion station was used in the site classification. The 62% of the database is
dominated by NEHRP site class D records (180m/s ≤ Vs,30 < 360m/s) whereas the rest of the data is
recorded on NEHRP site class C (360m/s ≤ Vs,30 < 750m/s). The data number vs. oscillator period plot
displayed in Figure 2.b was obtained from the maximum usable elastic spectral period range criteria
established by Akkar and Bommer [49]. The low-cut (high-pass) filter frequency of each record was
used to define the corresponding spectral period range for which the filter influence is minimized in
spectral calculations. Figure 2.b shows that there is a significant reduction in the record number when
T > 3.5s. In this study the inelastic spectral displacements were calculated up to T = 2.0s as they are
expected to be influenced more by low-cut filtering due to the inherent period elongation in nonlinear
oscillator response. This way almost all data in the database could be used in the regression analyses
as can be depicted from Figure 2.b. It should be noted that the 2-seconds period limit is still a crude
assumption to minimize the low-cut filter influence on peak nonlinear oscillator displacements. To the
best of authors’ knowledge, there is no well-established criterion in the relevant literature for defining
usable period range of nonlinear spectral calculations to minimize the low-cut filter influence.

Revised Manuscript 7
Distance, Rjb (km)
0 5 10 15 20 25 30
Mag
nitu
de (M
)
5.0
5.5
6.0
6.5
7.0
7.5
8.0 NEHRP CNEHRP D
Period (s)
0 1 2 3 4 5 6 7 8 9 10
Dat
a N
umbe
r
20
40
60
80
100
(a) (b)
Figure 2. Magnitude vs. distance (Rjb) scatter and useful spectral period range information.
3. REGRESSION ANALYSIS
3.1 Functional form
The general mathematical model for estimating Sd,ie for a given µ or R value is
TPGVfSRied ⋅⋅= )(
,, θµ
(3)
The functional form f in Eq. (3) considers the influence of independent ground-motion parameters (θ)
such as magnitude, distance, site class etc. The regression analysis was conducted on the
dimensionless dependent variable Sd,ie/(PGV×T) because this parameter resulted in a simpler predictive
model as discussed next. Concerning the limited resolution of the actual ground-motion database, the
influence of independent ground-motion parameters on the predicted variable was investigated by
using some recent GMPEs. The behavior of Sd,e/(PGV×T) that is the elastic response version of the
predicted parameter was analyzed to achieve this objective. The main assumption in this sensitivity
analysis is that the general behavior of the predicted parameter will have a similar (but not the same)
pattern both for linear and nonlinear oscillator response. (This assumption is further discussed in
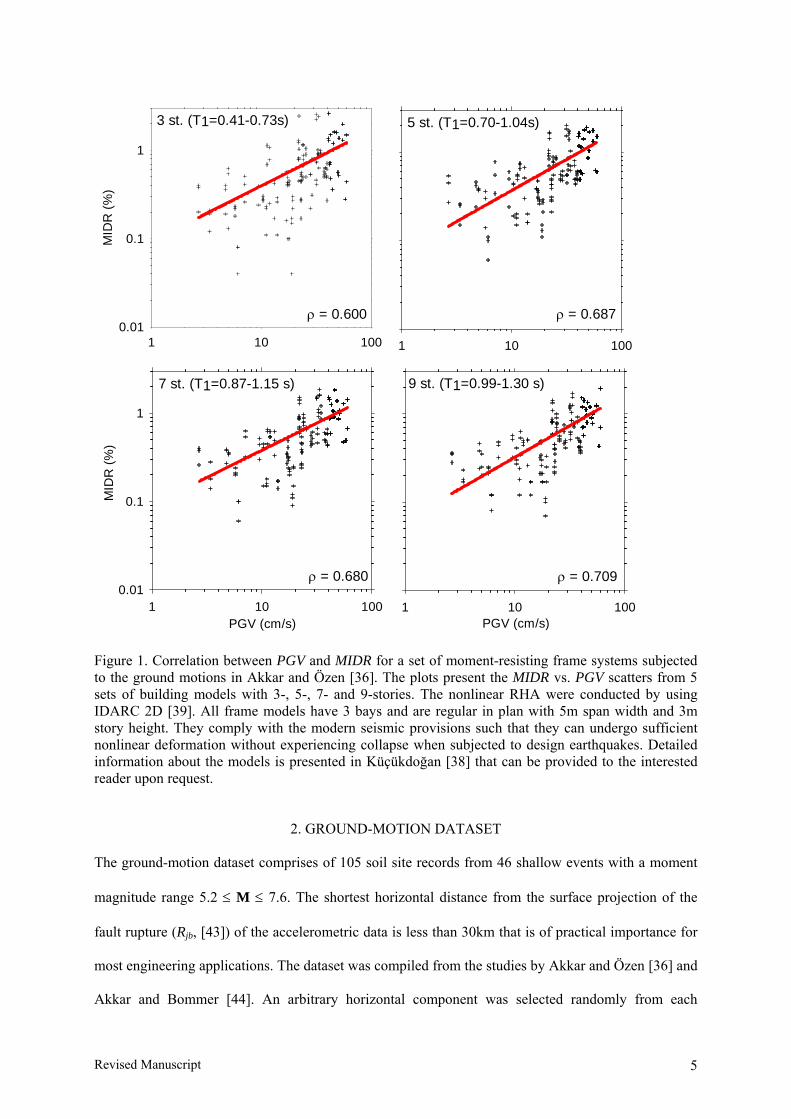
Figure 4). Figure 3 shows the comparative results from two recent GMPEs that are derived by Akkar
and Bommer [44, 50] and Boore and Atkinson [51]. These studies are abbreviated as AB07 and BA07,
respectively. The figures on the left display the results computed from AB07 whereas the pertaining
results of BA07 are presented on the right hand side. The AB07 prediction equations were derived
Revised Manuscript 8
from a recently compiled European ground-motion database. The BA07 GMPE uses a worldwide
ground-motion dataset that is compiled for Next Generation Attenuation (NGA) project. Both studies
estimate the spectral and peak ground-motion values with certain differences in their functional forms.
For example BA07 considers the nonlinear soil effects as a function of Vs,30 whereas AB07 does not
account for soil nonlinearity. Moreover AB07 introduces dummy variables to consider the site
conditions that are in accordance with NEHRP site class definitions. The BA07 model describes the
site influence through continuous Vs,30 values. The first row in Figure 3 shows the influence of distance
metric (Rjb) on Sd,e/(PGV×T) for the magnitude range of interest in this study. The figures on the left
and right panels display 3 sets of curves for the oscillator periods at T = 0.5, 1.0 and 2.0s. Each set
compares 3 distinct Rjb distances (i.e. Rjb = 10, 20 and 30 km) for a given oscillator period. The
discrete T and Rjb values presented fairly cover the period and distance ranges in this study. All plots
are produced for strike-slip events. The chosen site class is NEHRP C that is arbitrarily approximated
by using Vs,30 = 450m/s in AB07. The comparative plots show that for short-period oscillator response
(T = 0.5s) both GMPEs describe a slight departure for the Rjb = 10km curve with respect to the Rjb =
20km and Rjb = 30km curves in the small magnitude range. As far as the long-period oscillator
response (T = 2.0s) is concerned, the AB07 curves follow a trend similar to the one described for T =
0.5s whereas BA07 curves almost overlap each other for all Rjb distances. The observed differences in
the behavior of GMPEs for T = 2.0s may stem from their distinct magnitude scaling functional forms.
The GMPEs considered do not show a distance-wise sensitivity for T = 1.0s. Although it is crude,
these observations may lead to an assumption that the discrepancies on Sd,e/(PGV×T) emerging from
distance variation are secondary when compared to the magnitude influence. The second row in Figure
3 shows the significance of site class on Sd,e/(PGV×T). NEHRP site classes C and D are considered in
the comparative plots as the ground-motion dataset consists of records from these site categories. For
illustrative purposes Vs,30 = 450m/s and 270m/s are used in BA07 to represent NEHRP C and D site
classes, respectively. Similar to the plots in the first row, each panel displays 3 sets of Sd,e/(PGV×T) vs.
Rjb curves computed for T = 0.5, 1.0 and 2.0s. Each set corresponds to a particular oscillator period
and shows the variation in Sd,e/(PGV×T) for NEHRP C and D site classes, respectively. In order not to

Revised Manuscript 9
crowd the figures the AB07 predictions were used to display the results for M = 7 whereas BA07 was
used to illustrate the results from small magnitude events mimicked by M = 5. The style-of-faulting is
also chosen as strike-slip in these figures. Although there is a departure in Sd,e/(PGV×T) between
different site classes for large magnitude and mid-period values (T = 1.0s), the general picture from
these plots may also advocate that magnitude is a more prominent parameter than the site class in the
variation of Sd,e/(PGV×T). Plots similar to those presented in Figure 3 were also produced for normal
and reverse faulting. Although they are not shown in the paper, the observations are comparable to
those presented for strike-slip faults.
Akkar and Bommer (2007)
Magnitude (M)5 6 7
Sd,
e/(P
GV
xT)
0.050.060.070.080.09
0.2
0.3
0.4
0.1
T=0.5s, Rjb=10kmT=0.5s, Rjb=20kmT=0.5s, Rjb=30kmT=1.0s, Rjb=10kmT=1.0s, Rjb=20kmT=1.0s, Rjb=30kmT=2.0s, Rjb=10kmT=2.0s, Rjb=20kmT=2.0s, Rjb=30km
Boore and Atkinson (2007)
Magnitude (M)5 6 7
0.050.060.070.080.09
0.2
0.3
0.4
0.1
T=0.5s, Rjb=10kmT=0.5s, Rjb=20kmT=0.5s, Rjb=30kmT=1.0s, Rjb=10kmT=1.0s, Rjb=20kmT=1.0s, Rjb=30kmT=2.0s, Rjb=10kmT=2.0s, Rjb=20kmT=2.0s, Rjb=30km
T=0.5sT=0.5s
T=1.0s
T=1.0s
T=2.0s
T=2.0s
NEHRP C Vs,30 = 450 m/s
Distance, Rjb (km)
0 5 10 15 20 25 30
Sd,
e/(P
GV
xT)
0.00
0.05
0.10
0.15
0.20
0.25
0.30
NEHRP C, T = 0.5sNEHRP D, T = 0.5sNEHRP C, T = 1.0sNEHRP D, T = 1.0sNEHRP C, T = 2.0sNEHRP D, T = 2.0s
Distance, Rjb (km)
0 5 10 15 20 25 300.00
0.05
0.10
0.15
0.20
0.25
0.30
Vs,30 = 450m/s, T = 0.5sVs,30 = 270m/s, T = 0.5sVs,30 = 450m/s, T = 1.0sVs,30 = 270m/s, T = 1.0sVs,30 = 450m/s, T = 2.0sVs,30 = 270m/s, T = 2.0s
M = 7 M = 5
Figure 3. Influence of certain ground-motion parameters on Sd,e/(PGV×T) using different GMPEs.

Revised Manuscript 10
Figure 4 exhibits the behavior of dependent variable obtained from the actual data as a function
of magnitude to rationalize the discussions presented in the above paragraph. The plots present the
variation of average Sd,ie/(PGV×T) points computed from the magnitude bins of half-unit intervals
starting from M = 5. The panels in the first row display this variation for constant ductility whereas the
second row plots describe the same relationships for constant R. Although the plots summarize the
results of elastoplastic (α = 0%) hysteretic behavior, similar trends also exist for the bilinear oscillator
response with α = 5%. The panels on the left show the magnitude dependent variation of Sd,ie/(PGV×T)
for µ = 1.5 (upper row) and R = 1.5 (lower row), respectively. The upper and lower row panels on the
right show the same variations for µ = 8 and R = 8, respectively. In order not to complicate the
information presented the average scatter points in each panel describe the magnitude dependent
variation at two periods: T = 0.5s and T = 2.0s. The data resolution allowed the computation of
average scatter points for two different distance intervals (i.e. Rjb < 10km and 10km < Rjb < 2 km). The
plots also show the quadratic curves that were fit to the variation of average scatter points computed
for each distance interval. The reason of choosing quadratic curves is their relatively high R2 values
that suggest a fairly good relation between the actual data trend and the fits. When the plots presented
in Figure 4 are compared with those in Figure 3, one would observe that the trends are fairly similar
except for the fact that the nonlinear oscillator response results in a shift in the vertical axis when the
level of inelasticity (i.e. µ or R) attains higher values. These limited observations verify the major
assumptions about the behavior of dependent parameter and fortify the general conclusions discussed
in Section 3.1 that are derived through the use of GMPEs.

Revised Manuscript 11
µ = 1.5
5 6 7
S d,ie
/(PG
VxT)
0.050.060.070.080.09
0.2
0.3
0.40.50.6
0.1
T=0.5s
T=2.0s
µ = 8.0
5 6 70.050.060.070.080.09
0.2
0.3
0.40.50.6
0.1Rjb < 10 km (T = 0.5s)
10 km < Rjb < 20 km (T = 0.5s)
Rjb < 10 km (T = 2.0s)
10 km < Rjb < 20 km (T = 2.0s)
T=0.5s
T=2.0s
R = 1.5
Magnitude (M)
5 6 7
S d,ie
/(PG
VxT)
0.050.060.070.080.09
0.2
0.3
0.40.50.6
0.1
T=0.5s
T=2.0s
R = 8.0
Magnitude (M)
5 6 70.050.060.070.080.09
0.2
0.3
0.40.50.6
0.1 Rjb < 10 km (T = 0.5s)
10 km < Rjb < 20 km (T = 0.5s)
Rjb < 10 km (T = 2.0s)
10 km < Rjb < 20 km (T = 2.0s)
T=0.5s
T=2.0s
Figure 4. Variation of the observed data as a function of magnitude for different periods and distance intervals. The upper row shows the variations for constant ductility for µ = 1.5 (left panel) and µ = 8.0 (right panel). Similar information is given in the lower row panels for normalized lateral strength.
Based on the above discussions, it was decided to consider the magnitude term as the only
explanatory variable in the predictive model. The quadratic variation of magnitude was selected for the
proposed model that seems to capture the variation of the dimensionless dependent variable
adequately for the overall magnitude range when the plots from AB07 (Figure 3) and the actual data
(Figure 4) are considered. The quadratic magnitude variation is also reasonable for the trends revealed
by BA07 for M ≤ 6.7. This GMPE shows a sharp linear decay for M > 6.7 (called as “hinging effect”
by the proponents) due to the magnitude scaling terms in the model that prevent oversaturation in the
predicted ground-motion variable. It should be noted that the sole consideration of magnitude

Revised Manuscript 12
influence is rough and at the expense of complexity a more complete model should contain the rest of
the independent ground-motion parameters that are omitted in this study. In their predictive model
Tothong and Cornell (2006) also considered magnitude as the only explanatory variable indicating that
other seismological independent parameters are not as influential as magnitude in the estimation of
Sd,ie. The final functional form used in the regression analysis is presented in Eq. (4).
σεµ⋅+++=⎟
⎟⎠
⎞⎜⎜⎝
⎛
×2
210,,ln MbMbbTPGV
S Ried (4)
In the above expression b0, b1 and b2 are the regression coefficients to be determined from the
regression analysis. The last term is the random error term and it accounts for the variability in the
dependent parameter due to the unconsidered predictor parameters in the model. This term
corresponds to the difference between the estimated and observed dependent variable that is called as
the residual in the regression analysis. If the fitted model correctly accounts for the variation of the
observed data, the residual mean square is the unbiased estimator of the variance (σ2) about the
regression. However, if the model fails to explain the variation of the observed data, the residuals
contain both random and systematic errors due to the model inadequacy resulting in biased σ2
calculated from the residual mean square [52]. The term ε in Eq. (4) denotes the number of standard
deviations (σ) above or below the expected value of dependent variable.
3.2. Regression Technique
There are number of regression techniques to estimate the coefficients of predictive variables in a
functional form. In this study the least squares regression was used that would estimate the same
coefficients as of maximum likelihood regression method provided that the random error terms are
normally distributed with zero mean and σ2 [53]. This condition is satisfied here as discussed in the
succeeding paragraphs. The regressions were done period-by-period for 0.2s ≤ T ≤ 2.0s with
increments of 0.1s. The inelastic oscillator displacements were estimated at 8 distinct µ and R values
(i.e. µ or R = 1.5, 2, 3, 4, 5, 6, 7 and 8) for bilinear hysteretic model associated with 0% and 5%
postyield stiffness ratio (α). The initial damping was taken as 5% of critical in all nonlinear oscillator
responses. The regression coefficients as well as the associated σ values are presented in Küçükdoğan

Revised Manuscript 13
[38]. They are also posted on http://www.ce.metu.edu.tr/~sakkar/GMPE_coeffs.xls. The random error
term (σ) of the predictive model is independent of magnitude whereas some recent prediction
equations do consider the magnitude influence on σ. The magnitude-dependent standard deviations
might have been incorporated to the predictive model by implementing pure error analysis as outlined
in Douglas and Smit [54]. This was not done for the current study as the data resolution is limited to
partition the database into different magnitude-distance bins to observe the magnitude influence on the
standard deviations. Bommer et al. [55] showed that the magnitude dependence on the random
variability of the ground motion prediction models require further work because different magnitude-
distance binning schemes may significantly influence the variation of σ as a function of magnitude.
Detailed analysis of variance (ANOVA) was carried out in order to judge the adequacy of the
predictive model for each set of T-µ-α (or T-R-α). The ANOVA calculations account for the random
variation of the repeated observations in the predicted variable for distinct T-M pairs [52]. F-test was
applied at the 5% significance level to examine the lack of model fit. Except for very short periods
there was no lack of model fit at the 5% significance level in the T-µ-α (or T-R-α) pairs indicating that
the predictive model can fairly represent the variation of the observed data. The corresponding R2
statistics also showed that the model can generally explain more than 50% of the data variation that
can be accepted as quite satisfactory for datasets containing repeated observations [52]. In essence,
considering the overall performance, the predictive model is accepted as adequate for descent
estimations of nonlinear peak oscillator displacements in terms of PGV.
3.3 Residual analysis and model evaluation
As noted previously the above calculations are only valid under the assumption that residuals are
normally distributed with zero mean and variance σ2. Figure 5 shows the sample normal probability
plots of residuals at T = 0.5, 1.0, 1.5 and 2.0s for µ and R equal to 4 when α = 0%. All plots indicate
that the normal distribution with zero mean assumption for residuals is reasonable since the residuals
fall near the solid line that connects different percentiles of normal distribution. Thus, the variances
computed from the residual mean squares can fairly account for the random error associated with the

Revised Manuscript 14
predictive model. The same observations also apply to the normal probability plots of the bilinear
hysteretic model with α = 5% [38]. These are not presented here due to the space limitations.
Figure 5. Normal probability plots of the residuals at T = 0.5, 1.0, 1.5 and 2.0 s for µ and R equal to 4 (upper and lower rows, respectively) when postyield stiffness is 0%.
The residuals were also examined to confirm that the predictions are unbiased due to the
omission of other explanatory parameters in the predictive model that are discussed in the previous
paragraphs. Figure 6 presents the residual plots against magnitude at T = 0.5 1.0, 1.5 and 2.0s for µ = 6
(first row) and for R = 6 (second row). Figure 7 shows the residuals vs. estimated dependent parameter
plots of the entire database for µ and R equal to 1.5, 3.0, 5.0 and 7.0. Similar to Figure 6, the upper and
lower rows display the relevant plots for constant ductility and normalized lateral strength ratio,
respectively. Both figures present residual scatters for α = 0% because the associated dispersion is
relatively higher when compared to the residuals of α = 5% case. The solid straight lines in these
figures show the trends fitted to the residuals; a significant slope in these trend lines would suggest the
biased estimations of the predictive model. The plots in Figures 6 and 7 do not exhibit a biased trend
in the residuals. Thus the proposed model satisfactorily accounts for the variation of the dependent
parameter regardless of the omission of other predictor parameters. Note that the residuals reported for
normalized lateral strength attain larger values than those of displacement ductility. This is expected

Revised Manuscript 15
since the peak oscillator displacements computed for constant R values are not limited to a predefined
value which is the case for constant µ peak oscillator displacements. The inherent difference between
the nonlinear oscillator responses imposed by constant µ and R results in increased dispersion about
the mean variation of peak oscillator displacements computed for normalized lateral strength.
T = 0.5 s., µ = 6.0
5.0 5.5 6.0 6.5 7.0 7.5
Res
idua
l
-2
-1
0
1
2T = 1.0 s., µ = 6.0
5.0 5.5 6.0 6.5 7.0 7.5-2
-1
0
1
2T = 1.5 s., µ = 6.0
5.0 5.5 6.0 6.5 7.0 7.5-2
-1
0
1
2T = 2.0 s., µ = 6.0
5.0 5.5 6.0 6.5 7.0 7.5-2
-1
0
1
2
T = 0.5 s., R = 6.0
Magnitude (M)5.0 5.5 6.0 6.5 7.0 7.5
Res
idua
l
-2
-1
0
1
2T = 1.0 s., R = 6.0
Magnitude (M)5.0 5.5 6.0 6.5 7.0 7.5
-2
-1
0
1
2T = 1.5 s., R = 6.0
Magnitude (M)5.0 5.5 6.0 6.5 7.0 7.5
-2
-1
0
1
2T = 2.0 s., R = 6.0
Magnitude (M)5.0 5.5 6.0 6.5 7.0 7.5
-2
-1
0
1
2
Figure 6. Residual plots as a function of M for µ = 6 (upper row) and R = 6 (lower row) at T = 0.5, 1.0, 1.5 and 2s when α = 0%.
µ = 1.5
-2.50 -2.25 -2.00 -1.75 -1.50 -1.25
Res
idua
l
-2
-1
0
1
2µ = 3.0
-2.25 -2.00 -1.75 -1.50 -1.25-2
-1
0
1
2µ = 5.0
-2.25 -2.00 -1.75 -1.50 -1.25 -1.00-2
-1
0
1
2µ = 7.0
-2.25 -2.00 -1.75 -1.50 -1.25 -1.00-2
-1
0
1
2
R = 1.5
Predicted ln(Sd,ie/(PGVxT))-2.50 -2.25 -2.00 -1.75 -1.50 -1.25
Res
idua
l
-2
-1
0
1
2R = 3.0
Predicted ln(Sd,ie/(PGVxT))-2.25 -2.00 -1.75 -1.50 -1.25
-2
-1
0
1
2R = 5.0
Predicted ln(Sd,ie/(PGVxT))-2.25 -2.00 -1.75 -1.50 -1.25 -1.00
-2
-1
0
1
2R = 7.0
Predicted ln(Sd,ie/(PGVxT))-2.25-2.00-1.75-1.50-1.25-1.00-0.75-0.50
-2
-1
0
1
2
Figure 7.Residual plots in terms of the dependent parameter for distinct µ and R values considering the entire database. The residuals pertain to the results obtained from the bilinear model with α = 0%.

Revised Manuscript 16
µ = 4 T = 0.5s
5.0 5.5 6.0 6.5 7.0 7.5 8.0
ln[S
d,ie
/(PG
VxT
)]
-3
-2
-1
0
µ = 8, T = 0.5s
Magnitude (M)
5.0 5.5 6.0 6.5 7.0 7.5 8.0
ln[S
d,ie
/(PG
VxT
)]
-3
-2
-1
0
µ = 8, T = 1.0s
Magnitude (M)5.0 5.5 6.0 6.5 7.0 7.5 8.0
-3
-2
-1
0
µ = 4, T = 1.0s
5.0 5.5 6.0 6.5 7.0 7.5 8.0
-3
-2
-1
0
µ = 4, T = 2.0s
5.0 5.5 6.0 6.5 7.0 7.5 8.0
-3
-2
-1
0
µ = 8, T = 2.0s
Magnitude (M)
5.0 5.5 6.0 6.5 7.0 7.5 8.0
-3
-2
-1
0
mean+σ
−σ
mean
+σ
−σmean
+σ
−σ
mean+σ
−σmean
+σ
−σmean
+σ
−σ
Figure 8. Scatter plots of the actual variation of the dependent parameter together with the corresponding mean ± σ estimations for µ = 4 (upper row) and µ = 8 (lower row). The plots represent elastoplastic (α = 0%) behavior. The left, middle and the right panels compare the actual data and the predictions at T = 0.5s, 1.0s and 2.0s, respectively. The diamonds designate the averages of the actual data computed for the magnitude bins of half-unit intervals starting from M = 5.
Information about the predictive power of the proposed empirical model is reported in Figure 8.
The figure presents the magnitude-dependent scatter plots of the actual data for elastoplastic (α = 0%)
oscillator response superimposed with the mean ± σ estimations. The plots display the pertaining data
variation for µ = 4 (first raw) and µ = 8 (second row) that are computed at T = 0.5s (first column), 1.0s
(second column) and 2.0s (third column). The diamonds in all plots represent the average of the
observed data computed from the magnitude bins of half-unit intervals that start from M = 5. The
general picture depicted from these figures is that the proposed empirical model is able to capture the
general variation of the observed data fairly well. The exceptions are the short-period cases with large
inelasticity levels (e.g. the lower left corner panel). This observation is consistent with the conclusions
of Akkar and Özen [36] who observed poor correlation between PGV and Sd,ie at short-period
oscillator response. As stated in Section 3.2, this shortcoming of the model is tolerated by considering
Revised Manuscript 17
its overall performance for the entire spectral period range and inelastic levels covered in this study.
Though it is not reported here, similar conclusions are also valid for constant strength oscillator
response and bilinear hysteretic model with α = 5%.
4. APPLICATION OF THE PROPOSED MODEL
The predictive model can estimate the peak inelastic oscillator displacements for a PGV value that is
computed from a GMPE. Recalling the general functional form presented in Eq. (3) and applying
random variables theory under the assumption that both PGV and Sd,ie|R, µ are log-normal independent
varieties with negligible statistical correlation, one can incorporate the random error due to the
predicted PGV to the overall standard deviation of the Sd,ie estimation. This is given in Eq. (5).
( )[ ] ( )[ ] [ ])ln()(lnln,, PGVVarfVarSVar
Ried += θµ
(5)
The term on the left hand side of Eq. (5) is the total variance of the estimated Sd,ie that contains
random error terms due to the predictive model presented and the PGV estimated from a GMPE (first
and second terms on the right hand side, respectively). The predictive model presented here is derived
for random horizontal component definition and this requires a careful consideration of the GMPE
employed for the PGV estimation. If the chosen GMPE is not devised for the random components
effect, one must use a consistent scaling to bring the horizontal component definition of the chosen
GMPE in agreement with the random component definition used here. Beyer and Bommer [56, 57]
established empirical relationships between different horizontal component definitions of PGV for
their median estimations and for the associated random error terms. These relationships can be used
efficiently to obtain compatible and consistent results from the proposed predictive model when the
GMPE considered yields PGV estimations other than the random horizontal component definition.

Revised Manuscript 18
M = 5.5, PGV = 18.3 cm/s
0.1 1
Sd,
ie (c
m)
1
10
M = 6.0, PGV = 29.7 cm/s
0.1 1
1
10
M = 7.0, PGV = 59.6 cm/s
0.1 1
1
10
µ = 1.0µ = 4.0µ = 6.0µ = 8.0
Period (s)0.1 1
Sd,
ie (c
m)
1
10
Period (s)0.1 1
1
10
Period (s)0.1 1
1
10
R = 1.0R = 4.0R = 6.0R = 8.0
Figure 9. Inelastic spectral displacement estimations of the proposed predictive model for constant µ (upper row) and constant R (lower row) when α = 0%. The black solid curves that are designated by either µ = 1 or R = 1 show the corresponding elastic spectral displacements computed from Akkar and Bommer [50].
Figure 9 shows the variation in the expected Sd,ie for a set of constant µ and R values and for
reverse faulting events of increasing magnitude (M = 5.5, 6.0 and 7.0). For illustrative purposes the
site is assumed to be located 5 km from the surface projection of the fault rupture and its soil condition
is represented as NEHRP D. The plots present the Sd,ie estimations for α = 0%. The first row panels
display the constant ductility spectral displacement plots for M = 5.5, 6.0 and 7.0, respectively. The
second row presents the same information for normalized lateral strength spectral displacements. The
PGV values of the scenario events were computed from Akkar and Bommer [44] that uses geometric
mean component definition. The empirical relationships proposed by Beyer and Bommer [56, 57]
were used to adjust the differences between the random component and geometric mean definitions.
The figure also associates the elastic spectral displacements computed from Akkar and Bommer [50]
in order to verify the consistent behavior of the predicted Sd,ie with respect to its elastic counterpart.

Revised Manuscript 19
Figure 9 clearly displays the magnitude influence on the variation of Sd,ie. For small magnitude events
(M = 5.5), the inelastic spectral displacements start oscillating about a constant plateau after T > 1.0s.
For other magnitude values the inelastic spectral displacements follow a continuously increasing
pattern with increasing oscillator periods. This observation is consistent with the previous studies that
highlight the strong relationship between magnitude and spectral corner periods for defining the
commencement of constant spectral displacement plateau (e.g. References [32, 58, 59]. The PGV
dependent predictive model seems to capture this effect adequately underlining once again the strong
correlation between PGV and magnitude that has already been addressed by many studies (e.g.
References [44, 60]). Note that the elastic displacement spectra plotted in these figures display a
compatible pattern with the magnitude-dependent inelastic spectral trends discussed above. This
observation provides further information about the trustable behavior of the proposed model. Another
common observation from these plots is that the spectral periods for the commencement of “equal
displacement rule” (i.e. inelastic spectral displacements practically attaining the same peak
displacements of the corresponding elastic oscillators) are sensitive to the level of PGV that is
essentially related to the magnitude. The increase in PGV (that is dictated by the increase in
magnitude) shifts the spectral regions towards longer periods where “equal displacement rule” starts to
hold. This observation was also noted by Tothong and Cornell [34] while deriving their inelastic
spectral displacement prediction equation. Note that the differences in the short-period peak
displacements between the displacement ductility and normalized lateral strength spectra are notable
since the latter spectrum type does not impose any limit on the computed inelastic oscillator
displacements. These observations have already been marked by various studies (e.g. References
[6,8]) and the proposed model can capture these prominent features of nonlinear oscillator response.

Revised Manuscript 20
Constant Strength
0.0 0.5 1.0 1.5 2.00.3
0.4
0.5
0.6
0.7
0.8
0.9
1.0Constant Ductility
0.0 0.5 1.0 1.5 2.0
σ Tot
0.3
0.4
0.5
0.6
0.7
0.8
0.9
1.0
0.0 0.5 1.0 1.5 2.00.3
0.4
0.5
0.6
0.7
0.8
0.9
1.0
0.0 0.5 1.0 1.5 2.0
σ Tot
0.3
0.4
0.5
0.6
0.7
0.8
0.9
1.0
µ = 1.5 µ = 3.0 µ = 5.0 µ = 8.0
Period (s)
0.0 0.5 1.0 1.5 2.00.3
0.4
0.5
0.6
0.7
0.8
0.9
1.0
Period (s)
0.0 0.5 1.0 1.5 2.0
σ Tot
0.3
0.4
0.5
0.6
0.7
0.8
0.9
1.0
Boore and Atkinson (2007) Boore and Atkinson (2007)
Akkar and Bommer (2007)M = 5.5
Akkar and Bommer (2007)M = 5.5
Akkar and Bommer (2007)M = 7.5
Akkar and Bommer (2007)M = 7.5
µ = 1.5 µ = 3.0 µ = 5.0 µ = 8.0
RRRR
Figure 10. Illustrative cases about the variation in the total standard deviation (σTot) of estimated Sd,ie when the proposed model is associated with the scenario-based PGVs that are estimated from different GMPEs. The plots on the left and on the right show the change in σTot for different µ and R values, respectively. The gray shadows complete the entire picture about the variation of σTot by describing the overall band in σTot for µ and R values ranging between 1.5 and 8.
Figure 10 illustrates the progress in the random error of estimated Sd,ie for various µ and R values
when the scenario PGV is described by a GMPE. The total variance expression presented in Eq. (5) is
used to address the change in the total standard deviation (σTot) when the scenario-based PGV values
are estimated through AB07 and BA07. One major difference between these predictive models is that

Revised Manuscript 21
AB07 takes into account of magnitude uncertainty in the random error term. This results in a
magnitude-dependent standard deviation that increases with decreasing magnitude. The predictive
model BA07 does not consider a magnitude influence on the variation of standard deviation. The
panels in the first row describe the period-dependent variation in σTot (the overall dispersion about the
Sd,ie estimations) when the scenario-based PGV values are computed from BA07. The left and right
panels show the change in σTot for constant µ and R, respectively. The empirical relationships
proposed by Beyer and Bommer [56, 57] were used once again to adjust the random error term in
BA07 for the differences between the horizontal component definitions. Owing to the magnitude-
independent standard deviation in BA07, the σTot values presented in these plots are not affected from
the changes in magnitude. The total standard deviation in BA07 for elastic spectral displacement
estimations is reported to vary between 0.6 and 0.7 for the period range of interest in this study. The
first row plots in Figure 10 show slightly higher standard deviations than those reported by BA07.
This observation suggests that the predictive model does not significantly amplify the uncertainty in
the estimated Sd,ie when it is associated with the PGV values computed from other GMPEs. The other
two rows in this figure show the variation in σTot when the scenario-based PGV is estimated by AB07.
Similar to the previous exercises, the empirical relationships of Beyer and Bommer [56, 57] were used
to fine-tune the standard deviations due to different horizontal component definitions. The second row
plots show the change in σTot for a small magnitude scenario event (M = 5.5). The third row plots
describe the same variation for a large magnitude event (M = 7.5). The comparisons of standard
deviations presented here and those reported in Akkar and Bommer [50] for elastic spectral
displacement predictions suggest once again that the proposed model does not severely amplify σTot of
Sd,ie estimations as a result of using the estimated PGV from AB07. A more important observation
depicted from these figures is that the magnitude dependency implemented in AB07 results in a
significant difference in the level of random error for the Sd,ie estimations. As far as the small
magnitude events (i.e. M = 5.5) are concerned, the use of AB07 for estimating the scenario PGV
results in about 30% increase in σTot when compared to the use of BA07. This ratio is reversed for
large magnitude events (i.e. M = 7.5) in the favor of AB07. The consideration of AB07 would

Revised Manuscript 22
approximately decrease σTot by 40% with respect to the use of BA07. Provided the fact that both AB07
and BA07 yield similar median PGV estimations [44] for a given scenario event large variations in the
standard deviations as a function of M may cast serious concerns about the description of random
error in the ground-motion model. Thus, as discussed by Bommer et al. [55], the magnitude influence
on the error propagation of the predicted variable should be studied further to clarify whether the
ground motion variability genuinely depends on magnitude.
5. SUMMARY AND CONCLUSIONS
The correlation between PGV and peak inelastic oscillator displacement is used to derive a simple
predictive model for estimating Sd,ie as a function of PGV. The model accounts for the 5%-damped
bilinear oscillator response between 0.2s ≤ T ≤ 2.0s associated with 0% and 5% postyield stiffness
ratios. It describes the variation of Sd,ie for constant ductility and normalized lateral strength ratios. The
regression analysis was conducted for a suite of dense-to-stiff soil site records with a magnitude
interval of 5.2 ≤ M ≤ 7.6. The records are selected from the close proximity of causative fault (Rjb < 30
km) and they do not exhibit pulse dominant signals. Confined to these limitations, this study presents
the results of regression analysis with a special emphasis on the model verification. The comparative
plots between the observed and estimated data as well as the residual analysis showed that, despite its
simplicity, the general performance of the model is appealing except for short periods where the model
may not fully explain the trends in the empirical data.
The case studies presented showed that the proposed model can properly address the effect of
important ground-motion parameters on the behavior of Sd,ie when the PGV values are associated
through a GMPE. The strong relationship between PGV and magnitude results in rationale Sd,ie
estimations that validate the magnitude influence on the spectral shapes. The estimated spectral
displacements start converging to constant values based on the variation of magnitude-dependent
spectral corner periods that reflect the genuine characteristic of the actual data. The empirical model
can also distinguish the differences in the nonlinear oscillator response imposed by constant ductility
and normalized lateral strength ratio. These observations suggest the adequacy of the proposed model

Revised Manuscript 23
in estimating Sd,ie. The case studies also illustrated that the total standard deviation about the estimated
Sd,ie is not amplified significantly when the proposed mode is associated with a GMPE. However, the
variation in σTot inherently depends on the random error description of the GMPE utilized (e.g.
magnitude dependency/independency of the standard deviation). In essence, the key features of the
model reported here not only make it practical for preliminary design and seismic performance
assessment of a broad class of building systems but also describe the model as a versatile tool for the
scalar PSHA methods.
ACKNOWLEDGEMENTS
The authors express their sincere gratitude to Prof. M.T. Yılmaz who gave valuable insight about the
regression and ANOVA analyses. Dr. David M. Boore kindly ran many simulations based on different
source models to discuss the behavior of regression coefficients with the first author. The valuable
comments of two anonymous reviewers improved the technical quality of the paper significantly. This
study is partially funded by the Scientific and Technological Research Council of Turkey under Award
No. 105G016.

Revised Manuscript 24
REFERENCES
1. Veletsos AS, Newmark NM. Effect of inelastic behavior on the response of simple systems to earthquake motions. Proc., 2nd World Conf. on Earthquake Engineering, Vol. II, Tokyo, 895–912., 1960. 2. Newmark NM, Hall WJ. Seismic Design Criteria for Nuclear Reactor Facilities. Report No. 46, Building Practices for Disaster Mitigation, National Bureau of Standards, U.S. Department of Commerce, 209-236, 1973. 3. Newmark NM, Hall WJ. Earthquake Spectra and Design. EERI Monograph Series, Earthquake Engineering Research Institute, Oakland, CA, 1982. 4. Miranda E. Inelastic displacement ratios for structures on firm sites. Journal of Structural Engineering (ASCE) 2000; 126(10):1150-1159. DOI:10.1061/(ASCE)0733-9445(2000)126:10(1150). 5. MacRae GA, Tagawa H. Methods to estimate displacements of PG&E structures. Final Report PG&E/PEER Task No. 505, Seattle Washington, 2002. 6. Chopra AK, Chintanapakdee C. Inelastic Deformation Ratios for Design and Evaluation of Structures: Single-Degree-of-Freedom Bilinear Systems. Journal of Structural Engineering (ASCE) 2004; 130(9):1309-1319. DOI: 10.1061/(ASCE)0733-9445(2004)130:9(1309). 7. Ruiz García J, Miranda E. Inelastic ratios for design of structures on soft soils sites, Journal of Structural Engineering (ASCE), 2004; 130(12): 2051-2061. DOI: 10.1061/(ASCE)0733-9445(2004)130:12(2051). 8. Ruiz-García J, Miranda E. Inelastic displacement ratios for evaluation of existing structures. Earthquake Engineering and Structural Dynamics 2003; 32(8):1237-1258. DOI: 10.1002/eqe.271. 9. Vidic T, Fajfar P, Fischinger M. Consistent inelastic design spectra: strength and displacement. Earthquake Engineering and Structural Dynamics 1994; 23(5):507–521. DOI: 10.1002/eqe.4290230504. 10. Cuesta I, Aschheim MA, Fajfar P. Simplified R-Factor Relationships for Strong Ground Motions. Earthquake Spectra 2003; 19(1):25-45. DOI: 10.1193/1.1540997. 11. Riddell R, Garcia JE, Garces E. Inelastic deformation response of SDOF systems subjected to earthquakes. Earthquake Engineering and Structural Dynamics 2002; 31(3):515-538. DOI: 10.1002/eqe.142. 12. Elghadamsi F, Mohraz B. Inelastic earthquake spectra. Earthquake Engineering and Structural Dynamics 1987; 15(1):91–104. DOI: 10.1002/eqe.4290150107 13. Sewel RT. Damage effectiveness of earthquake ground motion: characterizations based on the performance of structures and equipment. PhD Thesis, Department of Civil and Environmental Engineering, Stanford University, Stanford CA., 619 pp., 1989. 14. Nassar AA, Krawinkler H. Seismic Demands for SDOF and MDOF Systems. Report No. 95, The John A. Blume Earthquake Engineering Center, Stanford University, CA, 1991. 15. Miranda E. Site dependent strength reduction factors. Journal of Structural Engineering (ASCE) 1993; 119(12): 3503-3519. DOI: 10.1061/(ASCE)0733-9445(1993)119:12(3503).

Revised Manuscript 25
16. Song JK, Pincheira J. Spectral displacement demands of stiffness- and strength-degrading systems. Earthquake Spectra 2000; 16(4):817-851. DOI: 10.1193/1.1586141. 17. Arroyo D, Terán A. Strength reduction factors for ductile structures with passive energy dissipating devices, Journal of Earthquake Engineering 2003; 7(2): 297-325. DOI: 10.1142/S1363246903001036. 18. Peköz HA, Pincheira JA. Seismic response of stiffness and strngth degrading systems. Proc., 13th World Conf. on Earthquake Engineering, Paper No. 936, Vancouver BC, Canada, 2004. 19. Chopra AK, Chintanapakdee C. Inelastic Deformation Ratios for Design and Evaluation of Structures. Report No. EERC-2003-09, Earthquake Engineering Research Center, University of California at Berkeley, Berkeley, CA, 2003. 20. MacRae GA, Roeder CW. Near-field ground motion effects on short structures. Final Report to PG&E/PEER, Pacific Earthquake Engineering Research Center, Richmond, CA, 1999. 21. Baéz JI, Miranda E. Amplification factors to estimate inelastic displacement demands for the design of structures in the near field. Proc., 12th World Conf. on Earthquake Engineering, CDRom Auckland, New Zealand, 2000. 22. MacRae GA, Morrow DV, and Roeder CW. Near-fault ground motion effects on simple structures. Journal of Structural Engineering (ASCE) 2001; 127(9): 996-1004. DOI: 10.1061/(ASCE)0733-9445(2001)127:9(996). 23. Chopra AK, Chintanapakdee C. Comparing response of SDF systems to near-fault and far-fault earthquake motions in the context of spectral regions. Earthquake Engineering and Structural Dynamics 2001; 30(12):1769–1789. DOI: 10.1002/eqe.92. 25. Miranda E, Bertero VV. Evaluation of strength reduction factors for earthquake-resistant design. Earthquake Spectra 1994; 10(2), 357–397. DOI: 10.1193/1.1585778. 26. Mahin SA, Bertero VV. An evaluation of inelastic seismic design spectra. Journal of Structural Division (ASCE) 1981; 107: 1777-1795. 27. Ordaz M, Pérez-Rocha LE. Estimation of strength-reduction factors for elasto-plastic systems: A new approach. Earthquake Engineering and Structural Dynamics 1998; 27(9):889–901. DOI: 10.1002/(SICI)1096-9845(199809)27. 28. Chakraborati A, Gupta VK. Scaling of strength reduction factors for degrading elasto-plastic oscillators. Earthquake Engineering and Structural Dynamics 2005; 34(2):189–206. DOI: 10.1002/eqe.416. 29. Karmakar D, Gupta VK. Estimation of strength reduction factors via normalized pseudo-acceleration response spectrum. Earthquake Engineering and Structural Dynamics 2007; 36(6):751–763. DOI: 10.1002/eqe.651. 30. FEMA NEHRP guidelines for the seismic rehabilitation of buildings. Guidelines (FEMA 273) and Commentary (FEMA-274), Federal Emergency Management Agency, Washington DC, 1997. 31. ASCE. Prestandard and commentary for the seismic rehabilitation of buildings. Report No. FEMA 356, American Society of Civil Engineers, Washington DC, 2000. 32. FEMA. The 2003 NEHRP recommended provisions for new buildings and other structures. Part 1: Provisions (FEMA 450), Federal Emergency Management Agency, Washington DC, 2003.

Revised Manuscript 26
33. ATC. Improvement of nonlinear static seismic analysis procedures. Report No. FEMA 440, Applied Technology Council, Washington DC, 2005. 34. Tothong P, Cornell A.C. An empirical ground-motion attenuation relation for inelastic spectral displacement. Bulletin of the Seismological Society of America 2006; 96(6): 2146-2164. DOI: 10.1785/0120060018. 35. Riddell R. On ground motion intensity indices. Earthquake Spectra, 2007; 23(1): 147-173. 36. Akkar S, Özen, Ö. Effect of peak ground velocity on deformation demands for SDOF systems. Earthquake Engineering and Structural Dynamics 2005; 34(13): 1551-1571. DOI: 10.1002/eqe.492. 37. Kurama YC, Farrow KT. Ground motion scaling methods for different site conditions and structure characteristics. Earthquake Engineering and Structural Dynamics, 2003; 32(15): 2425–2450. DOI: 10.1002/eqe.335. 38. Küçükdoğan B. Investigation of the effect of ground-motion intensity measures on seismic demand parameters using probabilistic methods. MSc Thesis, Department of Civil Engineering, Middle East Technical University 06531, Ankara, Turkey, 2007. 39. Valles RE, Reinhorn AM, Kunnath SK, Li C, and Madan A. IDARC-2D version 4.0: A program for the inelastic damage analysis of buildings. Rep. No. NCEER 96-0010, State University of New York at Buffalo, N.Y., 1996. 40. Press WH, Flannery BP, Teukolsky SA and Vetterling WT. Numerical recipes: the art of scientific computation (FORTRAN version). Cambridge University Press, Cambridge, 702 pp, 1989. 41. Akkar S, Sucuoğlu H and Yakut A. Displacement-based fragility functions for low- and mid-rise ordinary concrete buildings. Earthquake Spectra, 2005; 21(4): 901-927. DOI: 10.1193/1.2084232. 42. Sucuoğlu H, Yazgan U, and Yakut A. A Screening Procedure for Seismic Risk Assessment in Urban Building Stocks. Earthquake Spectra, 2007; 23(2): 441-458. DOI: 10.1193/1.2720931. 43. Joyner WB, Boore DM. Peak horizontal acceleration and velocity from strong-motion records including records from the 1979 Imperial Valley, California, earthquake. Bulletin of the Seismological Society of America 1981; 71(6): 2011-2038. 44. Akkar S, Bommer JJ. Empirical prediction equations for peak ground velocity derived from strong-motion records from Europe and the Middle East. Bulletin of the Seismological Society of America 2007a; 97(2): 511-530. DOI: 10.1785/0120060141. 45. Anderson JC, Bertero VV. Uncertainties in establishing design earthquakes. Journal of Structural Engineering (ASCE) 1987; 113:1709 –1723. 46. Alavi B, Krawinkler H. Behavior of moment-resisting frame structures subjected to near-fault ground motions. Earthquake Engineering and Structural Dynamics 2004; 33(6): 687-706. DOI: 10.1002/eqe.369. 47. Bray JD, Rodriguez-Marek A. Characterization of forward-directivity ground motions in the near-fault region. Soil Dynamics and Earthquake Engineering 2004; 24(11): 815-828. DOI:10.1016/j.soildyn.2004.05.001

Revised Manuscript 27
48. Akkar S, Yazgan U, Gülkan P. Deformation limits for simple non-degrading systems subjected to near-fault ground motions. Proc., 13th World Conf. on Earthquake Engineering, Paper No. 2276, Vancouver BC, Canada, 2004. 49. Akkar S, Bommer JJ. Influence of long-period filter cut-off on elastic spectral displacements. Earthquake Engineering and Structural Dynamics 2006; 35(9): 1145-1165. DOI: 10.1002/eqe.577. 50. Akkar S, Bommer JJ. Prediction of elastic displacement response spectra in Europe and the Middle East. Earthquake Engineering and Structural Dynamics 2007b; 36(10): 1275-1301. DOI: 10.1002/eqe.679. 51. Boore DM, Atkinson G. Ground-Motion Predictions Equations for the Average Horizontal Component of PGA, PGV, and 5%-Damped SA at Spectral Periods between 0.01 s and 10.0. Submitted for publication in Earthquake Spectra, 2007. 52. Draper NR, Smith H. Applied Regression Analysis, Second edition, John Wiley & Sons Inc., New York, 709 pp, 1981. 53. Myers RH. Classical and modern regression with applications. PWS Publishers, Boston Massachusetts, 359 pp, 1986. 54. Douglas J, Smit PM. How Accurate Can Strong Ground Motion Attenuation Relations Be? Bulletin of the Seismological Society of America 2001; 91(6): 1917-1923. DOI: 10.1785/0120000278. 55. Bommer JJ, Stafford PJ, Alarcón JE and Akkar S. Ground-motion predictions over extended magnitude range. Bulletin of the Seismological Society of America 2007; 97(6):2152-2170. DOI: 10.1785/0120070081. 56. Beyer K, Bommer JJ. Relationships between median values and between aleatory variabilities for different definitions of the horizontal component of motion, Bulletin of the Seismological Society of America 2006; 96(4A):1512-1522. DOI: 10.1785/0120050210. 57. Beyer K, Bommer JJ. Errata: Relationships between median values and between aleatory variabilities for different definitions of the horizontal component of motion, Bulletin of the Seismological Society of America 2007; 97(5):1769. DOI: 10.1785/0120070128. 58. Faccioli E, Paolucci R, Rey J. Displacement spectra for long periods. Earthquake Spectra 2004; 20(2):347-376. DOI: 10.1193/1.1707022. 59. Bommer JJ, Elnashai AS. Displacement spectra for seismic design. Journal of Earthquake Engineering 1999; 3(1):1-32. DOI: 10.1142/S1363246999000028. 60. Wu YM, Teng TI, Shin TC, Hsiao NC. Relationship between peak ground acceleration, peak ground velocity and intensity in Taiwan. Bulletin of the Seismological Society of America 2003; 93(1):386-396. DOI: 10.1785/0120020097.

Revised Manuscript 28
APPENDIX – A GROUND MOTION DATA SET
Table A.1. List of ground motions used and their important features
Earthquake CO1 Date Time (UTC) Station PGV
(cm/s) M Rjb (km) Site2 F3 fc
4
(Hz) Aigion GR 15/06/1995 00:15:51 Aigio-OTE Building 52.36 6.5 7.0 C N 0.08Aigion GR 15/06/1995 00:15:51 Amfissa-OTE Building 9.72 6.5 22.0 D N 0.09Alkion GR 24/02/1981 20:53:39 Korinthos-OTE Building 23.62 6.6 10.0 D N 0.10Alkion GR 24/02/1981 20:53:39 Xilokastro-OTE Building 28.04 6.6 8.0 D N 0.07Alkion GR 25/02/1981 20:53:39 Korinthos-OTE Building 13.67 6.3 19.0 D N 0.06Ano Liosia GR 07/09/1999 11:56:51 Athens-Syntagma 1st lower level 12.99 6.0 8.0 C N 0.10Ano Liosia GR 07/09/1999 11:56:51 Athens 3 Kallithea District 15.70 6.0 8.0 C N 0.14Ano Liosia GR 07/09/1999 11:56:51 Athens-Sepolia Metro Station 17.84 6.0 5.0 C N 0.16Ano Liosia GR 07/09/1999 11:56:51 Athens-Sepolia Garage 21.32 6.0 5.0 C N 0.15Basso Tirreno IT 15/04/1978 23:33:48 Patti-Cabina Prima 15.21 6.0 13.0 D S 0.15Campano Lucano IT 23/11/1980 18:34:52 Calitri 29.36 6.9 13.0 C N 0.10Campano Lucano IT 23/11/1980 18:34:52 Brienza 11.50 6.9 23.0 C N 0.15Cape Mendocino USA 25/04/1992 18:06:11 Rio Dell - 101/Painter St. Overseas 42.63 7.0 7.9 C R 0.07Cape Mendocino USA 25/04/1992 18:06.11 Petrolia 48.30 7.0 0.0 C R 0.07Cerkes TR 14/08/1996 02:59:41 Merzifon Meteorology Station 5.02 5.6 13.0 D S 0.16Chi-Chi TA 20/09/1999 17:47:35 TCU051 40.58 7.6 7.7 D R 0.04Chi-Chi TA 20/09/1999 17:47:35 TCU082 41.03 7.6 5.2 D R 0.04Chi-Chi TA 20/09/1999 17:47:35 CHY006 42.09 7.6 9.8 D R 0.04Coyote Lake USA 06/08/1979 17:05:28 Gilroy Array #3 Sewage Treatment 16.89 5.7 6.8 D S 0.25Coyote Lake USA 06/08/1979 17:05:28 SJB Overpass, Bent 3 4.74 5.7 20.4 C S 0.20Coyote Lake USA 06/08/1979 17:05:28 Gilroy Array #2 31.88 5.7 8.5 D S 0.25Dinar TR 01/10/1995 15:57:13 Dinar Meteorology Station 43.99 6.4 0.0 D N 0.09Duzce TR 12/11/1999 16:57:20 LDEO Station No. C1062 FI 18.25 7.2 14.0 D S 0.05Duzce TR 12/11/1999 16:57:20 Bolu 55.17 7.2 12.0 D S 0.05Faial PO 09/07/1998 05:19:07 Horta 34.37 6.1 11.0 D S 0.18Firuzabad IR 20/06/1994 09:09.03 Zanjiran 40.44 5.9 7.0 C S 0.13Friuli IT 11/09/1976 16:35:03 Buia 21.71 5.5 7.0 D R 0.20Friuli IT 15/09/1976 09:21:19 Breginj Fabrika IGLI 27.74 6.0 14.0 C R 0.14Friuli IT 15/09/1976 09:21:19 Forgaria Cornio 23.97 6.0 9.0 C R 0.15Friuli IT 15/09/1976 09:21:19 San Rocco 19.40 6.0 9.0 C R 0.15Friuli IT 15/09/1976 09:21:19 Buia 12.53 6.0 9.0 D R 0.15Gazli UZ 17/05/1976 02:58:42 Karakyr Point 54.75 6.7 4.0 D R 0.20Imperial Valley USA 15/10/1979 23:17:00 Parachute Test Facility,El Centro 17.27 6.5 12.7 D S 0.07Imperial Valley USA 15/10/1979 23:17:00 Calexico Fire Station 18.95 6.5 10.5 D S 0.07Imperial Valley USA 15/10/1979 23:17:00 Casa Flores, Mexicali 31.51 6.5 9.8 D S 0.10Imperial Valley USA 15/10/1979 23:17:00 El Centro Array #10 45.96 6.5 6.2 D S 0.07Imperial Valley USA 15/10/1979 23:17:00 Aeropuerto Mexicali 42.03 6.5 0.0 D S 0.15Imperial Valley USA 15/10/1979 23:17:00 El Centro Array #2 32.71 6.5 13.3 D S 0.07Imperial Valley USA 15/10/1979 23:17:00 El Centro Array #4 38.10 6.5 4.9 D S 0.07Imperial Valley USA 15/10/1979 23:17:00 Dogwood Rd., Diff. Array, El Centro 41.15 6.5 5.1 D S 0.07Imperial Valley USA 15/10/1979 23:17:00 Bonds Corner 44.33 6.5 0.5 D S 0.10Imperial Valley USA 15/10/1979 23:17:00 McCabe School, El Centro Array #11 45.24 6.5 12.5 D S 0.07Imperial Valley USA 15/10/1979 23:17:00 James Rd., El Centro Array #5 49.71 6.5 1.8 D S 0.07Imperial Valley USA 15/10/1979 23:17:00 Borchard Ranch, El Centro Array #1 10.36 6.5 19.8 D S 0.07Ionian GR 04/11/1973 15:52:12 Lefkada OTE Building 56.90 5.8 11.0 D R 0.10Izmit TR 17/08/1999 00:01:40 Duzce Meteorology Station 50.70 7.6 13.6 D S 0.10Izmit TR 17/08/1999 00:01:40 Iznik Highway Patrol 26.82 7.6 29.0 D S 0.04Izmit TR 13/09/1999 11:55:30 Adapazari Kadin D. Cocuk B. Evi 7.02 5.8 27.0 D S 0.08Izmit TR 13/09/1999 11:55:30 Yarimca-Petkim 8.07 5.8 27.0 D S 0.08Kalamata GR 13/09/1986 17:24:34 Kalamata Prefecture 33.10 5.9 0.0 C N 0.15Kalamata GR 13/09/1986 17:24:34 Kalamata OTE Building 34.61 5.9 0.0 C N 0.05Komilion GR 25/02/1994 02:30:50 Lefkada OTE Building 14.53 5.4 16.0 D S 0.20Komilion GR 25/02/1994 02:30:50 Lefkada Hospital 12.08 5.4 15.0 D S 0.20Kozani GR 19/05/1995 06:48:49 Karpero Town Hall 14.85 5.2 16.0 C N 0.13Landers USA 28/06/1992 11:57:53 Joshua Tree Fire Station 42.71 7.3 11.0 C S 0.07

Revised Manuscript 29
Lazio Abruzzo IT 07/05/1984 17:49:42 Cassino Sant Elia 11.12 5.9 18.0 D N 0.17Livermore USA 01/24/1980 19:00 Livermore VA Hospital 17.39 5.5 NI D S 0.20Livermore USA 01/24/1980 02:33 Morgan Territory Park 11.04 5.8 10.3 C S 0.60Loma Prieta USA 18/10/1989 00:04:21 Gilroy #6 San Ysidoro 13.92 6.9 17.9 C RO 0.16Loma Prieta USA 18/10/1989 00:04:21 Gilroy Gavilan Coll 28.93 6.9 9.2 C RO 0.16Loma Prieta USA 18/10/1989 00:04:21 Gilroy #2 – Hwy 101/Bolsa Rd 39.23 6.9 10.4 D RO 0.16Loma Prieta USA 18/10/1989 00:04:21 Gilroy #3 - Gilroy Sewage Plant 34.48 6.9 12.2 D RO 0.16Loma Prieta USA 18/10/1989 00:04:21 Saratoga 1-Story School Gym 37.19 6.9 8.5 C RO 0.50Loma Prieta USA 18/10/1989 00:05:21 Corralitos Eureka Canyon Rd 55.20 6.9 0.2 C RO 0.10Manesion GR 07/06/1989 19:45:54 Patra OTE Building 2.34 5.2 24.0 D S 0.17Montenegro MN 15/04/1979 06:19:41 Petrovac Hotel Oliva 39.96 6.9 3.0 C R 0.11Montenegro MN 15/04/1979 06:19:41 Bar Skupstina Opstine 52.81 6.9 3.0 C R 0.10Montenegro MN 15/04/1979 06:19:41 Ulcinj Hotel Olimpic 51.70 6.9 13.0 C R 0.10Montenegro MN 24/05/1979 06:19:41 Bar Skupstina Opstine 16.54 6.2 15.0 C R 0.09Montenegro MN 24/05/1979 06:19:41 Budva PTT 27.73 6.2 10.0 C R 0.07Morgan Hill USA 24/04/1984 21:15:28 Gilroy Gavilan College 3.39 6.1 14.8 C S 0.40Morgan Hill USA 24/04/1984 21:15:28 Gilroy #2 4.99 6.1 13.7 D S 0.16Morgan Hill USA 24/04/1984 21:15:28 Halls Valley 39.57 6.1 3.5 D S 0.16Morgan Hill USA 24/04/1984 21:15:28 Gilroy #7 5.76 6.1 12.1 D S 0.30Morgan Hill USA 24/04/1984 21:15:28 Gilroy #6 11.26 6.1 9.9 C S 0.20Morgan Hill USA 24/04/1984 21:15:28 Gilroy #3 11.88 6.1 13.0 D S 0.20North Palm Springs USA 07/08/1986 09:20 Fun Valley 6.12 6.2 12.8 D S 0.20Northridge USA 17/01/1994 12:31:03 Los Angeles - UCLA Grounds 21.88 6.7 13.8 C R 0.16Northridge USA 17/01/1994 12:31:03 6850 Coldwater Canyon Ave., N. Hollywood 23.07 6.7 7.9 C R 0.09Northridge USA 17/01/1994 12:31:03 Brentwood V.A. Hosp. 24.01 6.7 12.9 C R 0.10Northridge USA 17/01/1994 12:31:03 Pacoima Kagel Canyon 50.88 6.7 5.3 C R 0.14Northridge USA 17/01/1994 12:31:03 14145 Mulholland Dr., Beverly Hills 57.94 6.7 9.4 D R 0.13Northridge USA 17/01/1994 12:31:03 17645 Saticoy St. 59.82 6.7 0.0 D R 0.07Northridge USA 17/01/1994 12:31:03 7769 Topanga Canyon Blvd.,Canoga Park 59.84 6.7 0.0 D R 0.16Parkfield USA 27/06/1966 04:26 Cholame, Shandon, Array #5 25.44 6.1 9.6 D S 0.07Preveza GR 10/03/1981 15:16:20 Lefkada OTE Building 5.94 5.4 21.0 D R 0.14Pyrgos GR 26/03/1993 11:58:15 Pyrgos Agriculture Bank 19.02 5.4 10.0 D S 0.15Racha GRG 03/05/1991 20:19:39 Ambrolauri 25.10 5.6 11.0 D R 0.15Racha GRG 03/05/1991 20:19:39 Oni Base Camp 1.97 5.6 17.0 D R 0.22Sicilia-Orientale IT 13/12/1990 00:24:26 Catania Piana 10.78 5.6 24.0 D S 0.18South Iceland IC 17/06/2000 00:51:48 Hella 55.26 6.5 5.0 C S 0.08South Iceland IC 17/06/2000 00:51:48 Selsund 22.06 6.5 20.0 C S 0.17South Iceland IC 21/06/2000 00:51:48 Solheimar 40.95 6.4 4.0 C S 0.09South Iceland IC 21/06/2000 00:51:48 Kaldarholt 26.62 6.4 12.0 C S 0.10Spitak AR 07/12/1988 07:41:24 Gukasian 30.09 6.7 20.0 D R 0.06Umbria Marche IT 26/09/1997 00:13:16 Colfiorito 23.01 5.7 3.0 C N 0.17Umbria Marche IT 26/09/1997 00:13:16 Castelnuovo Assisi 6.44 5.7 24.0 D N 0.15Umbria Marche IT 26/09/1997 09:40:30 Castelnuovo Assisi 13.06 6.0 23.0 D N 0.10Umbria Marche IT 26/09/1997 09:40:30 Gubbio Piana 17.72 6.0 30.0 D N 0.10Umbria Marche IT 12/10/1997 11:08:36 Foligno Santa Maria Infraportas Base 1.07 5.2 20.0 D N 0.13Umbria Marche IT 06/10/1997 23:24:00 Castelnuovo Assisi 7.55 5.5 20.0 D N 0.12Volvi GR 20/06/1978 20:03:22 Thessaloniki City Hotel 16.08 6.2 13.0 D N 0.13Whittier Narrows USA 10/01/1987 14:42 200 S. Flower, Brea 7.07 6.1 18.4 D R 0.16Whittier Narrows USA 10/01/1987 14:42 7420 Jaboneria,Bell Gardens 28.00 6.1 10.3 D R 0.10Whittier Narrows USA 10/01/1987 14:42 Los Angeles Obregon Park 21.78 6.1 4.5 D R 0.40
1 CO is used to abbreviate countries Armenia (AR), Georgia (GRG), Greece (GR), Iceland (IC), Iran (IR), Italy (IT), Montenegro (MN), Portugal (PO), Turkey (TR), the United States of America (USA), Uzbekistan (UZ) and Taiwan (TA). 2 S designates the faulting style. 3 F designates the style-of-faulting. 4 fc abbreviates the low-cut filter frequency.