direct simulation monte carlo method for gas cluster ion beam technology
TRANSCRIPT

Direct simulation Monte Carlo method for gascluster ion beam technology
Z. Insepov *, I. Yamada
LASTI, Himeji Institute of Technology, 3-1-2 Kouto, Kamigori, Ako, Hyogo 678-1205, Japan
Abstract
A direct simulation Monte Carlo method has been developed and applied for the simulation of a supersonic Ar gas
expansion through a converging–diverging nozzle, with the stagnation pressures of P0 ¼ 0:1–10 atm, at various tem-
peratures. A body-fitted coordinate system has been developed that allows modeling nozzles of arbitrary shape. A wide
selection of nozzle sizes, apex angles, with diffuse and specular atomic reflection laws from the nozzle walls, has been
studied. The results of nozzle simulation were used to obtain a scaling law
P0T19=80 daLb
n ¼ const:
for the constant mean cluster sizes that are formed in conical nozzles. The Hagena�s formula, valid for the conical
nozzles with a constant length, has further been extended to the conical nozzles with variable lengths, based on our
simulation results.
� 2002 Elsevier Science B.V. All rights reserved.
PACS: 02.70.Uu; 47.60.+I; 36.40; 82.30.Nr
Keywords: Direct simulation Monte Carlo; Body-fitted coordinate; Supersonic nozzle; Cluster size
1. Introduction
Cluster formation in a supersonic nozzle flow is
a challenging problem for both theory [1–7] and
experiment [8–16]. The gasdynamics theory basedon Navier–Stokes equations cannot adequately
treat this problem due to a highly non-equilibrium
nature of the cluster formation phenomenon.
The direct simulation Monte Carlo (DSMC)
method [17–23] is a probabilistic method, and the
number of simulating ‘‘particles’’ in a DSMC-
model could be many orders of magnitude less
than the real molecules� number. DSMC couldtreat supersonic expansion of gases with inherent
non-equilibrium processes, e.g. with chemical re-
action [20], and it can take into account the for-
mation of small clusters [21,22].
The aim of this work is to study supersonic gas
expansion in the nozzles of arbitrary shape and
to predict average cluster sizes by comparing our
simulation results with available experimentaldata.
*Corresponding author. Tel.: +81-791-58-0412; fax.: +81-
791-58-0242.
E-mail address: [email protected] (Z. Inse-
pov).
0168-583X/02/$ - see front matter � 2002 Elsevier Science B.V. All rights reserved.
doi:10.1016/S0168-583X(02)01870-0
Nuclear Instruments and Methods in Physics Research B 202 (2003) 283–288
www.elsevier.com/locate/nimb

2. Body-fitted coordinate system
A new three-dimensional body-fitted coordinate(BFC) system has been developed and used within
the DSMC method, which is applied to study an
axially symmetric supersonic gas flow inside the
conical nozzles. The new method could also pre-
dict various flow parameters like flow density,
temperature, pressure, and in principle, cluster size
distribution function for different radial distances
from the nozzle central axis.The BFC method is a well-known method of
gasdynamics and it was first proposed for studying
aerodynamics external flows. It has also been
shown to successfully characterize a complicated
gasdynamics behavior including shock waves
[18,19]. BFC is also known as the boundary-con-
forming method [23] and has not been used for
supersonic nozzle simulation by DSMC before.In DSMC, the physical space must be divided
into small cells. Since the discretization of a nozzle
volume is a complex problem, the BFC method
transforms the physical space into a rectangular
space, which is easily divided into uniform cells.
The DSMC method consists of two processes: (a)
the collisions between the particles in a cell are
counted (step 1), (b) the particles are moved fromprevious position to a new one, according to the
equations of motion (step 2). For step 1, all the
particles within the cell must be identified and
BFC accelerates this step significantly. For step 2,
the BFC method uses the same equations of mo-
tion as for real space, with the corrections due to
the coordinate system transformations [19].
The cell sizes of dxc � 10�5–10�4 m were usedfor our simulations, depending on the total nozzle
length. The equations of motion were numerically
solved with the time step dt � 1–10 ns that was
obtained by a compromise between Eq. (1) and a
reasonable length of computation on a PC.
dt � 0:01� dxc=ðU þ CÞ: ð1Þ
Here, dxc is the cell size, (U þ C) is the total
particle velocity, C is the sound speed. The total
computing time was chosen in such a way that the
simulated particles were able to pass through the
whole nozzle many times [17].
Diffusive, with full accommodation, and spec-
ular boundary conditions [17] were applied to-
gether with BFC, as it was suggested in [19].
For most simulations at low pressure, the totalcomputing time was of about a few days. The
computing time has trend to increase significantly
with the gas pressure. Therefore, a great deal
of our results was obtained at pressures below
5 atm.
Fig. 1 shows the geometry of a conical nozzle
that was modeled in this work. The shape of these
devices was chosen to be similar to that usedat Kyoto University (Japan) and for Karlsruhe
(Germany) groups� experiments, in order to com-
pare simulation results with experiment. In this
figure, P0 and T0 are the pressure and the temper-
ature in the stagnation chamber. The two hori-
zontal arrows show the direction and the relative
magnitude of the flow velocity u. The nozzle couldbe characterized by the following parameters: dth –the throat diameter, D – the exit diameter, and h is
the apex angle for the conical type of a nozzle, and
L is the total nozzle length.
The studied nozzles had similar entrance sec-
tions characterized by the length of the inlet
cone section and the length of the cylindrical
throat. These parameters along with the throat
diameter were similar to ones in Hagena�s work[8,9].
The conical apex angles and the lengths of exit
nozzle section were used as variable parameters. In
total, more than 20 nozzles with different lengths
and exit apex angles were simulated for different
stagnation pressures from 0.1 to 10 atm, at room
temperature.
Fig. 1. A typical conical nozzle is shown that has the following
parameters [8,9]: d ¼ 0:14–0:16 mm, D ¼ 1–3 mm, L ¼ 24:5
mm. The apex angles were varied between 5� and 15�.
284 Z. Insepov, I. Yamada / Nucl. Instr. and Meth. in Phys. Res. B 202 (2003) 283–288

3. Simulation results
Figs. 2–5 show the results for a typical nozzlewith a small apex angle. The independent variable
is the x-axis along the flow of a simulated particle
from the central x-axis. The following flow char-
acteristics are shown here: the flow velocity uðxÞ in
m/s (Fig. 2), the flow temperature T ðxÞ in K (Fig.
3), the flow density qðxÞ in kg/m3 (Fig. 4), and the
flow pressure PðxÞ in Torr (Fig. 5), along the x-axis(that is given in reduced units), after 2� 105 time
steps. In these plots, the solid line (1) shows the
dependence of the appropriate variable along theconical wall, and the circles (2) are the variables
calculated along the central x-axis.
Fig. 2. U–velocity plot for the conical nozzle with the para-
meter from [8]. Line 1 shows the variable for the cells near the
nozzle wall, line 2 – along the centerline of the flow.
Fig. 3. Temperature plot for the same nozzle as in Fig. 2. Lines
1 and 2 have the same meaning as in Fig. 2.
Fig. 4. Density plot for the same nozzle as in Figs. 2 and 3.
Lines 1 and 2 have the same meaning as in Fig. 2.
Fig. 5. Pressure plot for the same nozzle as in Figs. 2–5. Lines 1
and 2 have the same meaning as in Fig. 2.
Z. Insepov, I. Yamada / Nucl. Instr. and Meth. in Phys. Res. B 202 (2003) 283–288 285
3.1. Hagena’s analysis
By analyzing a large number of experimentswith various gases, carried out at Karlsruhe Nu-
clear Center for many years, Hagena and co-
workers [8,9] have found a few useful scaling laws
for the flow parameters. As they have suggested,
the mean cluster size remains almost constant with
increasing the stagnation temperature T0 if the
stagnation pressure P0 and the nozzle throat dia-
meter deq are related to each others along with therelation (2):
P0T19=80 d0:8
eq ¼ const:;
deq ¼ dth= tan h=2ð Þ:ð2Þ
Here, P0 is the stagnation pressure, T0 is the
stagnation temperature, deq is the equivalent sonicthroat diameter [10], and dth is the throat diameter
for a conical nozzle. An important feature of this
relation is that the power exponents entering into
(2) could be obtained from the temperature gra-
dients dT=dx, or the transit times, dt ¼ dx=v0 alongthe x-axis centerline for a nozzle.
The Hagena�s formula (2) is a further develop-
ment of the two fundamental relations for gasexpansion through a nozzle: (a) isentropic relation
P0Tc=ð1�cÞ0 ¼ const.; (b) the line with equal bimo-
lecular processes, P0Tð1:5c�1Þ=ð1�cÞ0 ¼ const. Here, c is
the ratio of specific heats and P0, T0 are the sourcegas pressure and temperature. Formula (2) uses
the fact that both cluster size and cluster mass flux
density increase with increasing the source pres-
sure P0 and decreasing the source temperature T0.Such changes in the stagnation conditions would
lead to the crossing the saturation line at higher
densities, thus favoring the condensation processes
[8,9].
In the present work, the DSMC method has
been applied to calculate temperature gradients for
various conical nozzles. The obtained gradients
were used to generalize the Hagena�s formula tothe nozzles with variable exit lengths by adding a
power-low dependence of the mean cluster size on
the nozzle lengths, Ln The new formula (3) relates
flow parameters and fixes the mean cluster size for
different nozzle exit section lengths:
P0T19=80 daLb
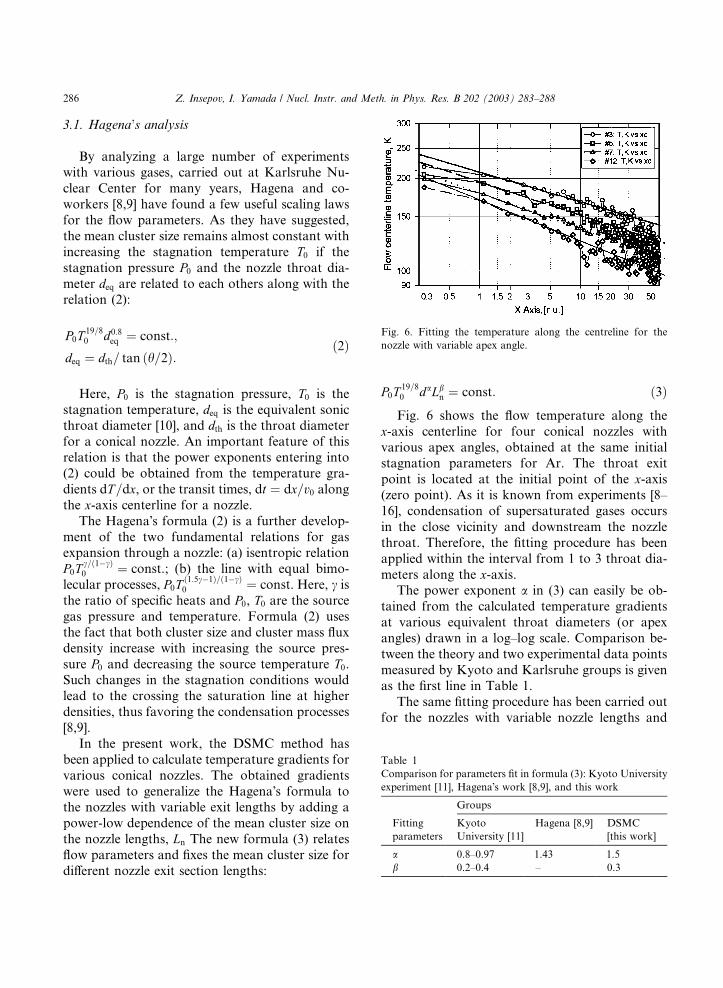
n ¼ const: ð3ÞFig. 6 shows the flow temperature along the
x-axis centerline for four conical nozzles with
various apex angles, obtained at the same initialstagnation parameters for Ar. The throat exit
point is located at the initial point of the x-axis(zero point). As it is known from experiments [8–
16], condensation of supersaturated gases occurs
in the close vicinity and downstream the nozzle
throat. Therefore, the fitting procedure has been
applied within the interval from 1 to 3 throat dia-
meters along the x-axis.The power exponent a in (3) can easily be ob-
tained from the calculated temperature gradients
at various equivalent throat diameters (or apex
angles) drawn in a log–log scale. Comparison be-
tween the theory and two experimental data points
measured by Kyoto and Karlsruhe groups is given
as the first line in Table 1.
The same fitting procedure has been carried outfor the nozzles with variable nozzle lengths and
Fig. 6. Fitting the temperature along the centreline for the
nozzle with variable apex angle.
Table 1
Comparison for parameters fit in formula (3): Kyoto University
experiment [11], Hagena�s work [8,9], and this work
Groups
Fitting
parameters
Kyoto
University [11]
Hagena [8,9] DSMC
[this work]
a 0.8–0.97 1.43 1.5
b 0.2–0.4 – 0.3
286 Z. Insepov, I. Yamada / Nucl. Instr. and Meth. in Phys. Res. B 202 (2003) 283–288

apex angle for the narrow exit cone. Fig. 7(a)–(d)
show the fitting for the temperature gradient in a
nozzle and the results of all fittings are given on the
second line of Table 1.
3.2. Average cluster size and ion current
As formula (3) fixes the ratio for the gasdy-namics variables, it can predict the average cluster
sizes and the ion currents only if one data point is
known from experiment. The above statement
could easily be proved by a gasdynamics analysis
that relates the average cluster size hNi to the right
site of (3).
Formula (3) has been used in this work to
predict the average cluster sizes and ion currentsbased on one experimental data point at 4000 Torr
for the nozzle that was supplied by Kyoto Uni-
versity group [11].
Fig. 8 shows an excellent comparison of our
prediction for the average cluster size given by
formula (3) (solid lines) and the Kyoto University
Fig. 8. Prediction for average cluster sizes by formula (3) are
given as solid lines, along with the level numbers. Circles cor-
respond to the experimental data, from left to right [11]:
hNi ¼ 2� 104, 2:5� 104, 2:7� 104 and 3:3� 104. Squares,
from bottom to top: 3:3� 104, 2:2� 104, 1:5� 104 [11]. Apex
angles and nozzle lengths are given in reduced units.
Fig. 7. Fitting the temperature along the centerline for the variable lengths of the nozzle exit sections.
Z. Insepov, I. Yamada / Nucl. Instr. and Meth. in Phys. Res. B 202 (2003) 283–288 287

experimental data points [11] (circles). Therefore,
we would suggest using it for predicting average
cluster sizes.
A significant aspect of the Hagena�s analysis isthe experimental finding [10] that any conical
nozzle can be characterized by a single parameter,
the throat diameter, of an equivalent sonic nozzle.
Unfortunately, there is no such simple represen-
tation for the nozzles other than the conical ones.
Therefore, the results of this work could not be
easily transferable to Laval nozzles.
4. Conclusions
In this study, the DSMC method has been
employed for simulation of a supersonic gas ex-
pansion and a new three-dimensional BFC system
has been developed for an Ar gas, with pressures at
stagnation chamber up to 10 atm, at room tem-perature. The developed method has been applied
to study an axially symmetric supersonic gas flow
inside the conical nozzles of different lengths and
apex angles, at low and intermediate Ar gas pres-
sures.
Flow density, pressure, flow velocity, tempera-
ture and flow atomic flux were calculated by
DSMC along the central x-axis for nozzles withvarious lengths. The DSMC data for the temper-
ature gradient (transit times) were used to find
power exponents in the scaling low for the flows
and the results of this analysis were in good
agreement with Kyoto group�s and Hagena�s ex-
perimental results.
The Hagena�s analysis for the constant mean
cluster size has been generalized for the conicalnozzles with variable lengths of the exit sections.
Acknowledgements
One of the authors (Z.I.) acknowledges valu-
able discussions on the fundamentals of the
DSMC method by Prof. Donald Baganoff of
Stanford University. This work was supported by
the NEDO project (Japan).
References
[1] E.R. Buckle, Trans. Faraday Soc. 65 (1969) 1267.
[2] J.K. Lee, J.A. Barker, F.F. Abraham, J. Chem. Phys. 58
(1973) 3166.
[3] S.H. Bauer, D.J. Frurip, J. Phys. Chem. 81 (1977) 1015.
[4] P.A. Skovorodko, in: Proc. 13 Int. Conf. on Raref. Gas
Dyn., Novosibirsk, 1982, p. 1053.
[5] B.M. Smirnov, Phys. Scr. 50 (1994) 364.
[6] B.M. Smirnov, A.Ju. Strizhev, Phys. Scripta 50 (1994) 606.
[7] K. Yasuoka, M. Matsumoto, J. Chem. Phys. 109 (1998)
8451.
[8] O.F. Hagena, W. Obert, J. Chem. Phys. 56 (1972) 1793.
[9] O.F. Hagena, in: P.P. Wegener (Ed.), Book Molecular
Beams and Low Density Gas Dynamics, M. Dekker, Inc.,
New York, 1974, Chapter 2, p. 93.
[10] O.F. Hagena, in: L. Trilling, H.Y. Wachman (Eds.),
Rarefied Gas Dynamics, Vol. II, Academic Press, New
York, 1969, p. 1465.
[11] T. Seki, private communication.
[12] O. Abraham, J.H. Binn, B.G. DeBoer, G.D. Stein, Phys.
Fluids 24 (6) (1981) 1017.
[13] T. Takagi, I. Yamada, G. Takaoka, H. Usui, in: Proc. of
the Special Symposium on Adv. Materials-II, Osaka, 1990,
p. 167.
[14] B.E. Wyslouzil, J.L. Cheung, G. Wilemski, R. Stray, Phys.
Rev. Lett. 79 (1997) 431.
[15] B.E. Wyslouzil, G. Wilemski, M.G. Beals, M.B. Frish,
Phys. Fluids 6 (1994) 2845.
[16] B.E. Wyslouzil, C.H. Heath, J.L. Cheung, G. Wilemski, J.
Chem. Phys. 113 (2000) 7317.
[17] G.A. Bird, Molecular Gas Dynamics and the Direct
Simulation of Gas Flows, Oxford, 1994.
[18] T. Shimada, T. Abe, in: Muntz et al. (Eds.), Rarefied Gas
Dynamics, Progress in Astronautics and Aeronautics,
AIAA, 1989, p. 258.
[19] T. Abe, J. Comput. Phys. 83 (1989) 424.
[20] S.D. Piersall, J.B. Anderson, J. Chem. Phys. 95 (1991) 971.
[21] K. Hongo, H. Mizuseki, Y. Kawazoe, Mater. Trans. 42
(2001) 439.
[22] H. Hettema, J.S. McFeaters, J. Chem. Phys. 105 (1996)
2816.
[23] J.F. Thompson, Z.U.A. Warsi, C.W. Mastin, Numerical
Grid Generation – Foundations and Applications, Else-
vier, North-Holland, 1985, p. 7.
288 Z. Insepov, I. Yamada / Nucl. Instr. and Meth. in Phys. Res. B 202 (2003) 283–288