direct observations of clear-sky aerosol radiative forcing...
TRANSCRIPT
Direct observations of clear-sky aerosol radiative forcing fromspace during the Indian Ocean Experiment
K. Rajeev1
Space Physics Laboratory, Vikram Sarabhai Space Centre, Trivandrum, India
V. RamanathanCenter for Clouds, Chemistry and Climate, Scripps Institution of Oceanography, University of California, SanDiego, La Jolla, California
Abstract. This study presents the regional estimates of the seasonal and diurnal meanbroadband (0.3–5.0 mm) clear-sky aerosol radiative forcing at the top of atmosphere(TOA) due to both the natural and the anthropogenic aerosols over the tropical IndianOcean from 258N to 258S. We propose two new methods, the slope method and thedifferencing method, to obtain clear sky aerosol forcing from solely satellitemeasurements. The focus of the study is January to March 1997, 1998, and 1999. TheTOA clear-sky aerosol forcing was obtained by integrating satellite data for aerosol opticaldepth (AOD) and the broadband radiation budget. Over 30,000 pixels were collocated toestimate that the diurnal and seasonal mean reflected broadband solar radiation at TOAincreases by about 24 W m22 per unit increase in AOD at the wavelength of 500 nm. Theobserved TOA clear-sky aerosol forcing varied between 24 and 214 W m22 in theNorthern Hemisphere (NH) and between 0 and 26 Wm22 in the Southern Hemisphere.Assuming a ratio of surface to TOA clear-sky aerosol forcing of 3 which was observedover Kaashidhoo Climate Observatory (4.968N, 73.468E) during the same period [Satheeshand Ramanathan, 2000], this leads to a clear-sky aerosol forcing of 212 to 242 Wm22 atthe surface in the NH. The difference between the TOA forcing and the surface forcing isthe atmospheric forcing. As a result, the atmosphere is subject to a large net forcing ofabout 8–28 Wm22 in the NH, largely due to the presence of black carbon. Of equalimportance is the fact that the Indian Ocean aerosols introduce a large interhemisphericgradient in the solar heating during the wintertime. The implications for climate andmonsoonal circulation may be major and need to be explored with coupled model studies.
1. Introduction
Aerosols affect the radiation budget of Earth-atmospheresystem by scattering and absorbing part of the incoming solarradiation (direct effect) and by modifying the cloud dropletsize distribution, thereby changing the radiative properties andlifetime of clouds (indirect effect) [Charlson et al., 1992; Kiehland Briegleb, 1993; Intergovernmental Panel on Climate Change(IPCC), 1995]. Both the direct and the indirect radiative effectsof aerosols have large regional variations because of the shortlifetime of aerosols, which contribute to significant spatial vari-ability in aerosol concentrations as well as in their chemicalcomposition and optical properties. A detailed investigation ofaerosol radiative properties and the radiative forcing on aregional scale is thus essential. Such regional studies werecarried out in the Amazon region [Kaufman et al., 1998], in thewestern Atlantic Ocean [Russell et al., 1999], and in the IndianOcean [Ramanathan et al., 1995]. The Tropospheric AerosolRadiative Forcing Observational Experiment (TARFOX)
made extensive measurements of aerosol properties and theradiative effects of aerosols in the summer haze plume of theeast coast of the United States [Russell et al., 1999] whichshowed that the instantaneous sky daytime upwelling fluxchanges due to aerosols are about 30–100 times larger than theglobal average forcing expected for a global average sulfateaerosol optical depth of 0.04 [Hignett et al., 1999].
The Indian Ocean Experiment (INDOEX) was aimed atstudying the long range transport of aerosols and trace speciesinto the otherwise pristine oceans from urban regions andassessing the direct and the indirect aerosol radiative forcing[Ramanathan et al., 1995]. During the Asian winter monsoonperiod, the northeasterly winds from the land areas transportlarge amounts of continental aerosols over the oceanic regions[Rajeev et al., 2000]. This provides a unique opportunity tostudy the extent of transport of continental aerosols and theirradiative impact over the otherwise pristine ocean areas. Ja-yaraman et al. [1998] studied the direct aerosol radiative forc-ing at Earth’s surface over the tropical Indian Ocean on thebasis of surface measurements of column aerosol optical depthand the incoming direct and diffuse solar radiation in thevisible spectrum. They showed that the direct visible (,780nm) solar flux decreased by 42 6 4 Wm22 and diffuse skyradiation increased by about 30 6 3 Wm22 with every 0.1increase in aerosol optical depth for solar zenith angles smallerthan 608. By integrating the aerosol chemical and optical prop-
1Formerly at Center for Clouds, Chemistry, and Climate, ScrippsInstitution of Oceanography, University of California, San Diego, Cal-ifornia.
Copyright 2001 by the American Geophysical Union.
Paper number 2000JD9007230148-0227/01/2000JD900723$09.00
JOURNAL OF GEOPHYSICAL RESEARCH, VOL. 106 , NO. D15, PAGES 17,221–17,235, AUGUST 16, 2001
17,221
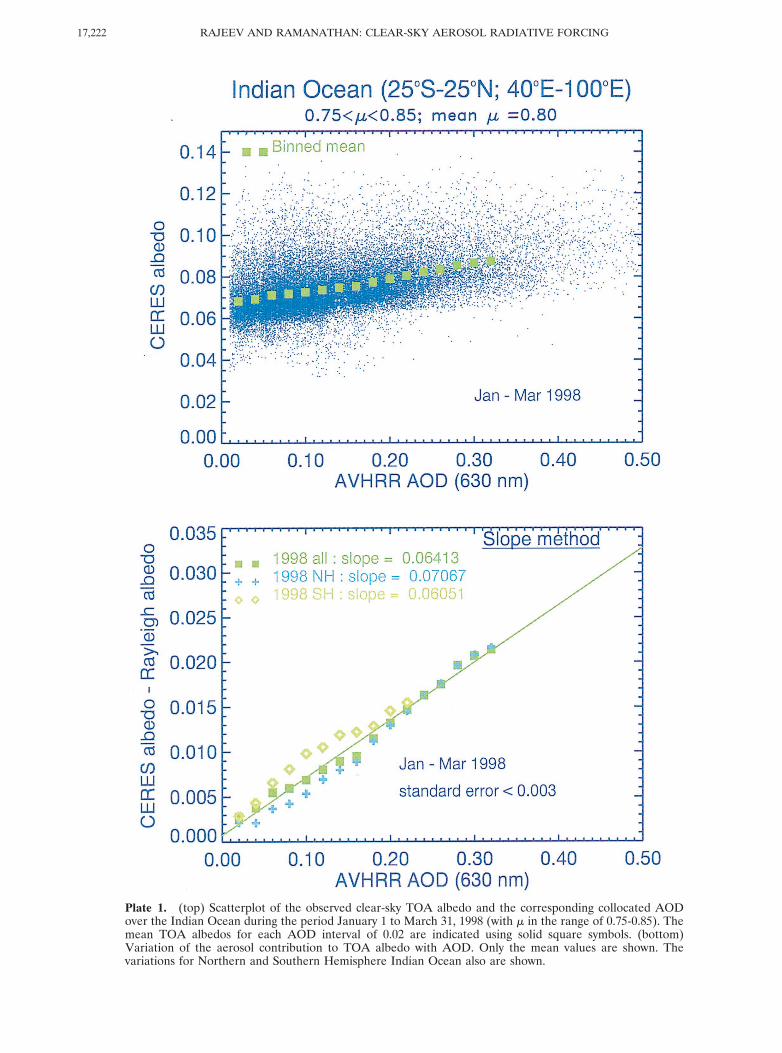
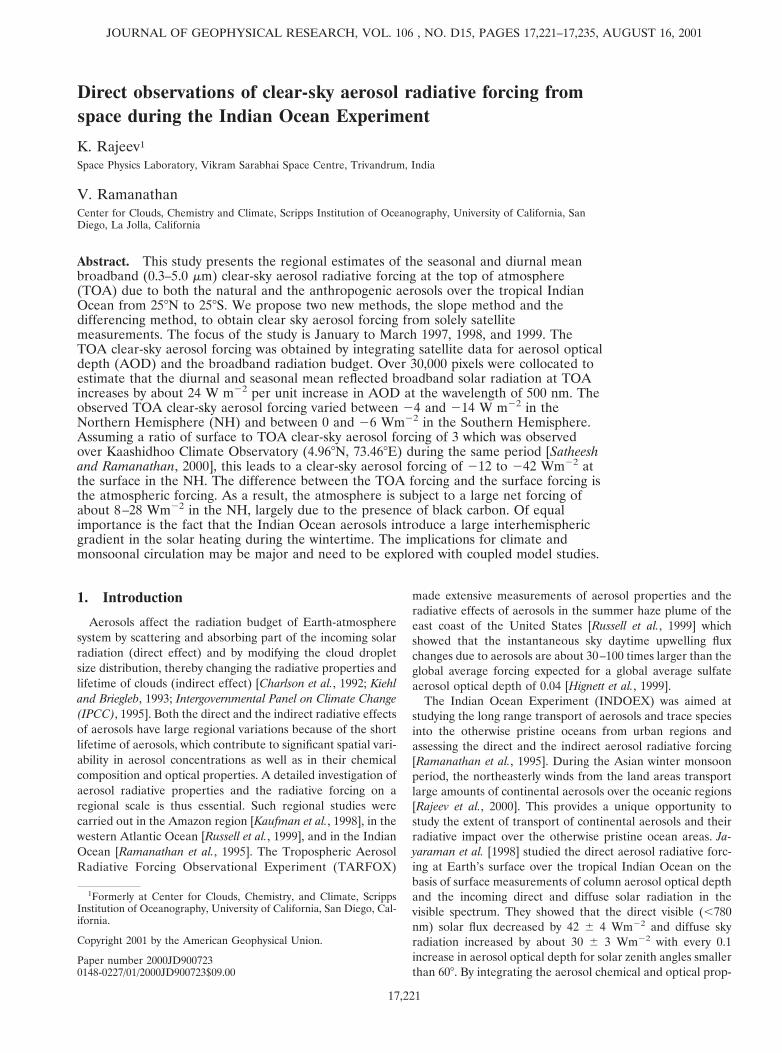
Plate 1. (top) Scatterplot of the observed clear-sky TOA albedo and the corresponding collocated AODover the Indian Ocean during the period January 1 to March 31, 1998 (with m in the range of 0.75-0.85). Themean TOA albedos for each AOD interval of 0.02 are indicated using solid square symbols. (bottom)Variation of the aerosol contribution to TOA albedo with AOD. Only the mean values are shown. Thevariations for Northern and Southern Hemisphere Indian Ocean also are shown.
RAJEEV AND RAMANATHAN: CLEAR-SKY AEROSOL RADIATIVE FORCING17,222
erties observed over the Indian Ocean island of Kaashidhoo(4.978N, 73.4668E) into a Monte Carlo radiative transfermodel, Podgorny et al. [2000] showed that during the winterperiod, aerosols decrease the sea surface clear sky solar heat-ing by about 16 W m22. The corresponding estimated directradiative forcing at the top of the atmosphere (TOA) wasabout 24 Wm22. Satheesh and Ramanathan [2000] have esti-mated the clear sky aerosol forcing over Kaashidhoo based onobservations during the winter period of 1998 and 1999 whichshowed that the diurnal mean clear sky solar flux decreased atthe surface by 15–30 Wm22, while at TOA it increased only by5–10 Wm22, the balance being distributed in the atmosphere.
The aerosol optical depth (AOD) derived using the ad-vanced very high resolution radiometer (AVHRR) data overthe ocean areas around the Indian subcontinent and the TOAbroadband short wave (SW) radiative flux observed using theClouds and the Earth’s Radiant Energy System (CERES)[Wielicki et al., 1996] at the same location and time provide aunique opportunity to estimate the clear sky radiative forcingdue to aerosols in the Earth-atmosphere system over the entireIndian Ocean region. The primary objectives of the presentstudy are (1) the estimation of the clear sky aerosol radiativeforcing efficiency (i.e., the change in the clear sky SW radiativeflux with unit increase in AOD) at the TOA and (2) thedetermination of the regional clear sky aerosol radiative forc-ing at the TOA and surface and studying its interannual vari-ability during the Asian winter monsoon period (January-March) over the tropical Indian Ocean, Arabian Sea, and Bayof Bengal. The study is based on the AOD at 630 nm retrievedfrom the channel 1 (630 6 50 nm) radiance observed byAVHRR on onboard NOAA 14 [Rajeev et al., 2000] and TOAbroadband SW radiative flux (in the spectral range of 0.3mm-5.0 mm) observed using CERES [Wielicki et al., 1996] overthe region during the winter monsoon period of January-March 1997, 1998, and 1999. The satellite retrieval model for
deriving AOD from NOAA 14 AVHRR data is based on theobserved chemical and optical properties of aerosols over theIndian Ocean, the in situ measured value of single-scatteringalbedo, and the wind dependence of sea surface reflectance[Rajeev et al., 2000]. The aerosol forcing efficiency is estimatedusing the collocated values of AVHRR-retrieved AOD and theTOA albedo observed using CERES during January 1 toMarch 31, 1998, and March 1–31, 1999. Regional maps of TOAaerosol forcing during January-March 1997, 1998, and 1999 arethen generated using the AVHRR retrieved AOD and theestimated clear sky aerosol forcing efficiency. Using the ob-served regional clear sky aerosol forcing at TOA and the ratioof the surface to TOA clear sky aerosol radiative forcing ob-served over the Indian Ocean island of Kaashidhoo based on insitu measurements reported by Satheesh and Ramanathan[2000], regional maps of the clear-sky aerosol radiative forcingat the surface and within the atmosphere are generated (for aregion within 6108 around Kaashidhoo), and its interannualvariability is discussed.
2. Data and Method of Analysis2.1. Retrieval of Aerosol Optical Depth From NOAA 14AVHRR Data
The AOD (at the wavelength 630 nm 6 50 nm) over theIndian Ocean area (in the latitude range 258S to 258N and thelongitude range 408E-1008E) during January 1 to March 31 of1997, 1998, and 1999 is retrieved from the radiance observedby channel 1 of NOAA 14 AVHRR. The methodology isexplained by Rajeev et al. [2000]. We have used the NOAA 14AVHRR global area coverage (GAC) data of the afternoonsatellite pass. Revised postlaunch calibration constants whichcorrect for the degradation of the AVHRR channel 1 sensorare used to convert the AVHRR digital counts to reflectance[Rao and Chen, 1999]. Retrieval of AOD is based on compar-ison of the observed satellite radiance at channel 1 with thelook-up tables of modeled radiances. The look-up tables ofsatellite radiances as a function of solar zenith angle, the sat-ellite viewing angle, relative azimuth, surface wind speed, andAOD are generated using the discrete ordinate radiative trans-fer method for a plane parallel atmosphere [Stamnes et al.,1988] with 32 vertical layers. This method accounts for themultiple scattering by aerosols and molecules and absorptiondue to aerosols, water vapor, and ozone. Vertical profiles ofpressure, temperature, molecular density, and ozone for thetropical atmosphere are based on the model by McClatchey etal. [1972]. Aerosols are assumed to be well mixed in the bound-ary layer (up to 1 km), and the aerosol number density de-creases exponentially with height above 1 km with a scaleheight of 0.8 km, which is inferred from the lidar images duringthe observation period [Satheesh et al., 1999]. To minimizeerrors in the retrieval of AOD, we use the data only from theantisolar side of the satellite scan. Variations in ocean reflec-tance due to wind speed are taken into account by consideringdaily surface winds from the National Centers for Environ-mental Prediction (NCEP) and the National Center for Atmo-spheric Research (NCAR) reanalysis [Kalnay et al., 1996].Fresnel reflection of the direct and diffuse solar radiation atthe ocean surface is calculated for rough ocean based on themodel proposed by Cox and Munk [1954]. Increase in oceanalbedo due to foam (whitecaps) with increase in wind speed iscalculated on the basis of the model produced by Kopke [1984].Pixels, which are filled partially or fully by clouds, are detected
Figure 1. Intercomparison of the advanced very high resolu-tion radiometer (AVHRR) aerosol optical depth (AOD) withthe in situ AOD. The in situ measurements were obtained fromthe automatic CIMEL Sun/sky radiometer at the KaashidhooClimate Observatory (KCO) (4.968N, 73.468E) and Male’(4.198N, 73.528E), the hand-held Sun photometer onboardR/V Sagar Kanya during 1997, and the spectroradiometer on-board R/V Sagar Kanya during 1998.
17,223RAJEEV AND RAMANATHAN: CLEAR-SKY AEROSOL RADIATIVE FORCING

and rejected using three tests: (1) the threshold method(brightness temperatures in channels 4 and 5), (2) the spatialcoherence test (brightness temperatures in channel 4) [Coakleyand Bretherton, 1982], and (3) the visible and near-IR channelratio method [Durkee et al., 1991].
The aerosol scattering phase function and single-scatteringalbedo used in the retrieval are based on the aerosol modeldeveloped using observations of the chemical, microphysical,and optical properties of aerosols over the Indian Ocean dur-ing the winter months [Satheesh et al., 1999]. This aerosolmodel contains seven aerosol types, namely, sea salt, sulfate,nitrate, organics, ammonia, dust, and soot. The aerosol scat-tering phase function used here is the same as that shown inFigure 1 of Rajeev et al. [2000]. The observed mean singlescattering albedo at the surface is 0.90 and corresponds to amean relative humidity of 78% observed during the period.However, the mean relative humidity varies with height, whichresults in the height variation of single scattering albedo. Forthe above described aerosol model, the values of aerosol singlescattering albedo (v) with relative humidity (RH) obtained onthe basis of the Hess et al. [1998] model are 0.90 for RH 578%, 0.874 for RH 5 70%, 0.861 for RH 5 60%, 0.850 forRH 5 50%, and 0.752 for RH535%. We have taken theaverage altitude profile of RH on the basis of the balloonsonde data during the observation period as given by Satheeshet al. [1999] and used the corresponding altitude variation of v.The altitude profile of RH has a mean value of 78% in themixing region (up to 1 km) and decreases above 1 km to havea mean value of 62% between 1 and 2 km. Above 2 km, RHshows only little variation and has a mean value of 35%. Forthis altitude variation of RH and corresponding variation in v,the column integrated value of v is 0.87 (with v 5 0.90 at thesurface).
The in situ measured single scattering albedo at Kaashidhoowas ;0.9 at the surface. However, aerosols of purely oceanicorigin have single-scattering albedo of ;1.0. Background AODdue to aerosols of ocean origin is, however, small (;0.05).Thus the application of the absorbing aerosol model with v 50.87 over the whole area and all optical depths may not bevalid. For each clear sky pixel we retrieve two values of AOD,one using the absorbing model described above (with v 5 0.90at the surface) and the other with v 5 1.0. The AODs retrievedusing these two models were used to obtain the AOD used inthis study as follows: If AOD retrieved using v equal to 1.0 ata pixel is #0.05, this is taken as the actual AOD at the pixel.When AOD retrieved using the absorbing model at a pixel is.0.15, this value is taken as the AOD at the pixel. For valuesof AOD between 0.05 and 0.15, the AOD at the pixel is ob-tained by interpolating between the retrieved AODs using theabsorbing model and that obtained using v equal to 1.0, afterassuming a nonabsorbing AOD of 0.05. Thus for higher AODthe value will be closer to that obtained using the obsorbingmodel. This accounts for the nonabsorbing background aero-sols of marine origin (v 5 1.0) and continental aerosols whichare observed to have single scattering albedo of 0.87 (0.9 at thesurface). The AOD retrieved for each satellite pass is griddedhorizontally with latitude-longitude grid size of 0.28 by averag-ing the AOD derived from all the clear sky individual pixelswithin the grid box.
The satellite-retrieved AOD is compared with the in situmeasured AOD as shown in Figure 1. The in situ measure-ments were obtained from different sources. First is the auto-matic CIMEL Sun/sky radiometer, which is part of the Aerosol
Robot Network (AERONET) [Holben et al., 1998] at theKaashidhoo Climate Observatory (KCO) (4.968N, 73.468E)and Male (4.198N, 73.528E) (interpolated to 630 nm usingobservations at 500 and 670 nm) during February 24, 1998, toMarch 31, 1998, and January 1 to March 31, 1999. The ship-borne measurements during 1997 are based on a hand-heldSun photometer onboard R/V Sagar Kanya [Jayaraman, 1999]cruising between latitudes of 138N and 138S during January1–31, 1997 (interpolated to 630 nm using observations at 497and 667 nm). The shipborne measurements during 1998 weredone using the spectroradiometer [Meywerk and Ramanathan,1999] at 630 nm onboard R/V Sagar Kanya cruising betweenlatitudes of 208S and 208N during February 18 to March 31,1998. For comparison of satellite retrieved AOD with theKaashidhoo data, we consider average AVHHRR AODwithin 6 1.08 latitude-longitude and within a time interval of660 min. For comparison with the shipborne measurements,AVHRR AOD within 628 latitude-longitude and within a timeinterval of 660 min is considered. Restricting the horizontalextent of the AVHRR data to smaller horizontal ranges re-duces the number of data points available for the intercom-parison but the results are similar. The slope of the intercom-parison shown in Figure 1 is 0.977 and the intercept is 0.020.The correlation coefficient is 0.921. The root-mean-square(RMS) deviation between the AVHRR and the in situ AOD is0.055. Part of the spread in the intercomparison between theAVHRR AOD and the in situ measured value could be due tothe spatial averaging of AVHRR AOD used in the intercom-parison. On the basis of the sensitivity analysis discussed belowand the intercomparison of AVHRR AOD with the in situmeasured AOD, the typical uncertainty of the AVHRR de-rived AOD is ;15%.
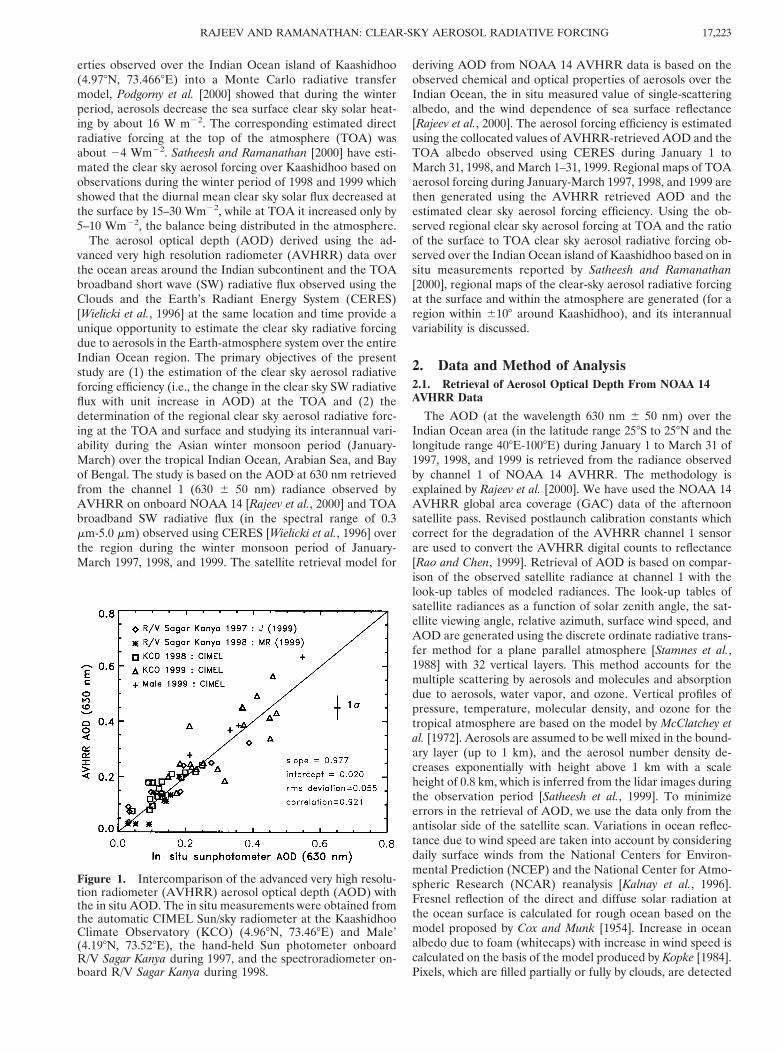
The satellite-derived AOD is sensitive to the aerosol phasefunction; the single scattering albedo, the surface reflectance,and the AVHRR calibration constants used in the retrieval.The sensitivity of the above parameters on the satellite derivedAOD are discussed here. The sensitivity of the derived AODto surface reflectivity and aerosol single scattering albedo isshown by Rajeev et al. [2000]. Figure 2 shows sensitivity of thederived AOD to the aerosol single scattering albedo (v), whichis found to be the largest source of uncertainty. All the satellitepasses during January 1999 are analyzed using the presentmethod explained above with the aerosol model having v 50.87 (nonconservative scattering case) and v 5 1.0 (conserva-tive scattering case), keeping all other parameters (includingthe phase function) the same, in order to study the effect ofsinglescattering albedo alone. In Table 1, case 1 shows theslope, intercept, and correlation of a linear fit to the twoobservations shown in Figure 2. It may be noted from Figure 2that for high values of AOD the conservative scattering caseunderestimates the AOD by as much as 25-30% compared tothe nonconservative scattering case. The difference is insignif-icant at very low AOD (,0.15). The agreement for low AODvalues is an artefact, since our model assumes a purely non-absorbing model for AOD # 0.05 and a linear interpolationbetween v 5 1 and v 5 0.87 for AOD from 0.05 to 0.15. Overthe Indian Ocean north of the Intertropical Convergence Zone(ITCZ), v 5 0.87 is consistent with the surface, aircraft, andshipborne measurements conducted during January-March1998 and 1999. South of the ITCZ, the AOD derived wasgenerally low and hence the effective single-scattering albedoused by the model is more than 0.87 (mostly closer to 1.0),which is consistent with the above in situ measurements during
RAJEEV AND RAMANATHAN: CLEAR-SKY AEROSOL RADIATIVE FORCING17,224
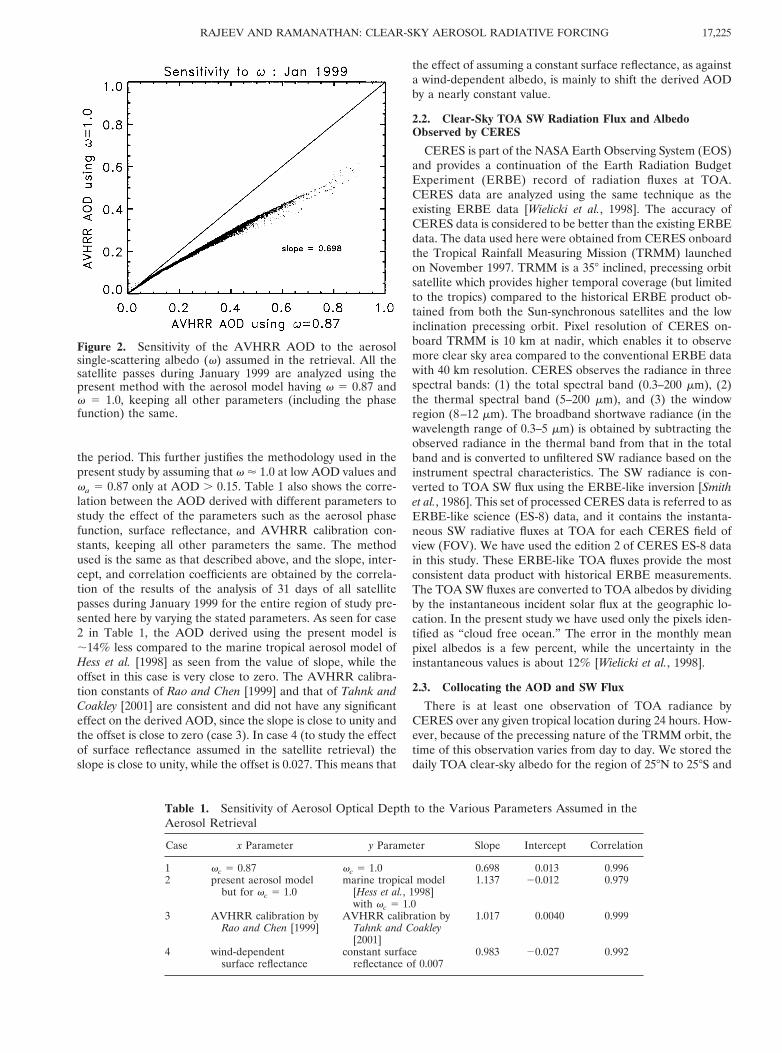
the period. This further justifies the methodology used in thepresent study by assuming that v ' 1.0 at low AOD values andva 5 0.87 only at AOD . 0.15. Table 1 also shows the corre-lation between the AOD derived with different parameters tostudy the effect of the parameters such as the aerosol phasefunction, surface reflectance, and AVHRR calibration con-stants, keeping all other parameters the same. The methodused is the same as that described above, and the slope, inter-cept, and correlation coefficients are obtained by the correla-tion of the results of the analysis of 31 days of all satellitepasses during January 1999 for the entire region of study pre-sented here by varying the stated parameters. As seen for case2 in Table 1, the AOD derived using the present model is;14% less compared to the marine tropical aerosol model ofHess et al. [1998] as seen from the value of slope, while theoffset in this case is very close to zero. The AVHRR calibra-tion constants of Rao and Chen [1999] and that of Tahnk andCoakley [2001] are consistent and did not have any significanteffect on the derived AOD, since the slope is close to unity andthe offset is close to zero (case 3). In case 4 (to study the effectof surface reflectance assumed in the satellite retrieval) theslope is close to unity, while the offset is 0.027. This means that
the effect of assuming a constant surface reflectance, as againsta wind-dependent albedo, is mainly to shift the derived AODby a nearly constant value.
2.2. Clear-Sky TOA SW Radiation Flux and AlbedoObserved by CERES
CERES is part of the NASA Earth Observing System (EOS)and provides a continuation of the Earth Radiation BudgetExperiment (ERBE) record of radiation fluxes at TOA.CERES data are analyzed using the same technique as theexisting ERBE data [Wielicki et al., 1998]. The accuracy ofCERES data is considered to be better than the existing ERBEdata. The data used here were obtained from CERES onboardthe Tropical Rainfall Measuring Mission (TRMM) launchedon November 1997. TRMM is a 358 inclined, precessing orbitsatellite which provides higher temporal coverage (but limitedto the tropics) compared to the historical ERBE product ob-tained from both the Sun-synchronous satellites and the lowinclination precessing orbit. Pixel resolution of CERES on-board TRMM is 10 km at nadir, which enables it to observemore clear sky area compared to the conventional ERBE datawith 40 km resolution. CERES observes the radiance in threespectral bands: (1) the total spectral band (0.3–200 mm), (2)the thermal spectral band (5–200 mm), and (3) the windowregion (8–12 mm). The broadband shortwave radiance (in thewavelength range of 0.3–5 mm) is obtained by subtracting theobserved radiance in the thermal band from that in the totalband and is converted to unfiltered SW radiance based on theinstrument spectral characteristics. The SW radiance is con-verted to TOA SW flux using the ERBE-like inversion [Smithet al., 1986]. This set of processed CERES data is referred to asERBE-like science (ES-8) data, and it contains the instanta-neous SW radiative fluxes at TOA for each CERES field ofview (FOV). We have used the edition 2 of CERES ES-8 datain this study. These ERBE-like TOA fluxes provide the mostconsistent data product with historical ERBE measurements.The TOA SW fluxes are converted to TOA albedos by dividingby the instantaneous incident solar flux at the geographic lo-cation. In the present study we have used only the pixels iden-tified as “cloud free ocean.” The error in the monthly meanpixel albedos is a few percent, while the uncertainty in theinstantaneous values is about 12% [Wielicki et al., 1998].
2.3. Collocating the AOD and SW Flux
There is at least one observation of TOA radiance byCERES over any given tropical location during 24 hours. How-ever, because of the precessing nature of the TRMM orbit, thetime of this observation varies from day to day. We stored thedaily TOA clear-sky albedo for the region of 258N to 258S and
Figure 2. Sensitivity of the AVHRR AOD to the aerosolsingle-scattering albedo (v) assumed in the retrieval. All thesatellite passes during January 1999 are analyzed using thepresent method with the aerosol model having v 5 0.87 andv 5 1.0, keeping all other parameters (including the phasefunction) the same.
Table 1. Sensitivity of Aerosol Optical Depth to the Various Parameters Assumed in theAerosol Retrieval
Case x Parameter y Parameter Slope Intercept Correlation
1 vc 5 0.87 vc 5 1.0 0.698 0.013 0.9962 present aerosol model
but for vc 5 1.0marine tropical model
[Hess et al., 1998]with vc 5 1.0
1.137 20.012 0.979
3 AVHRR calibration byRao and Chen [1999]
AVHRR calibration byTahnk and Coakley[2001]
1.017 0.0040 0.999
4 wind-dependentsurface reflectance
constant surfacereflectance of 0.007
0.983 20.027 0.992
17,225RAJEEV AND RAMANATHAN: CLEAR-SKY AEROSOL RADIATIVE FORCING
408E to 1008E for each 0.28 3 0.28 latitude-longitude grid boxwith a time resolution of 1 hour. The TOA latitude and lon-gitude as given in CERES ES-8 data were converted to theirsurface values using the standard geometrical algorithm. Sim-ilarly, the mean AOD data for each day at any geographiclocation over the above region are stored with 0.28 latitude-longitude resolution. Unlike the TOA albedo obtained fromthe CERES data, the time of observation of AOD usingAVHRR data is nearly constant (;1430 during January-March 1998). For each of the geographic cells of grid size 0.28the AOD values are collocated with TOA albedo within a timeinterval of 2 hours, for each day. However, the precessingnature of the TRMM orbit and the higher frequency of occur-rence of cloud over the tropics limit the number of data pointsthat are thus collocated. The study is made with values ofcollocated CERES broadband TOA albedo and the AVHRRAOD during the period January 1 to March 31, 1998, when asufficient number of collocated data points were available overthe region. During 1999, the CERES data were available onlyduring March (not continuous) due to operational problemswith the satellite, and the number of collocated data pointsavailable is too low compared to 1998. Hence the CERES dataduring 1999 are used here only for assessing the validity of theresults obtained for the 1998 period.
3. Model Computations of TOA FluxTo determine the clear sky aerosol radiative forcing from the
collocated AOD and TOA albedo, the molecular contributionhas to be subtracted from the observed TOA albedo (in theslope method discussed in section 4.1). In the present study,the molecular contribution to the TOA albedo for various solarzenith angles is determined using the Monte Carlo modeldescribed by Podgorny et al. [2000]. In this broadband model,the entire solar spectrum is divided into 38 spectral bands andhas 33 vertical layers between the surface and 100 km. Theocean surface albedo to direct solar radiation is based on themodel by Briegleb et al. [1986]. The ocean albedo for diffusedownward radiation is taken as 6.0% as suggested by Brieglebet al. [1986]. These model computations were also performedwith aerosols present in the atmosphere. The aerosol modelproperties used (the single scattering albedo and its altitudevariation, the aerosol scattering phase function, and altitudevariation of aerosol extinction) are the same as that explainedin the aerosol model described in section 2.1.
4. Results and Discussion4.1. Estimation of Clear-Sky Aerosol Radiative ForcingEfficiency at TOA
The clear sky aerosol forcing efficiency at TOA is estimatedon the basis of two independent methods: (1) the slope methodand (2) the differencing method. The slope method is limitedto a finite range of m (5cos(u), where u is the solar zenithangle) due to the unavailability of a sufficiently large numberof data points for all ranges of m. This is a potential limitationof this method since the aerosol forcing is a function of thesolar zenith angle. The differencing method, on the otherhand, uses all observed values of m and accounts for the de-pendence of aerosol forcing on m.
4.1.1. Slope method. Plate 1 (top) shows the scatterplotof the observed clear-sky TOA albedo and the correspondingcollocated AOD over the geographic area between 258N and
258S and between 408E and 1008E for the period January 1 toMarch 31, 1998. Since the TOA albedo depends strongly onthe solar zenith angle, we include only values within a narrowrange of m between 0.75 and 0.85. The particular range waschosen because it had the maximum number of collocated datapoints. The mean value of m is 0.80. The total number ofcollocated data points is 37,709. The mean TOA albedos foreach AOD interval of 0.02 are indicated using solid squaresymbols, which are indicated only for the range of AOD valueshaving at least 200 points within the 0.02 range of AOD. Thestandard deviation of the TOA albedo for any given AOD is inthe range of 12-16%. The relatively large scatter in the valuesis due to the uncertainties in the model used to convert radi-ances to TOA albedo (the standard deviation due to this factoralone is about 12.1% as described in section 2.2) and due tocloud contamination. The uncertainties in the retrieved AOD(typically 15%) and the variation in the TOA albedo with solarzenith angle (0.75 , m , 0.85) also contribute to this scatter.Despite the relatively large scatter in the values, the increase inTOA albedo with AOD is clearly discernible in the top plot ofPlate 1. The slope of the variation of the mean TOA albedo(binned at AOD intervals of 0.02) is 0.0646 and the interceptis 0.0664. The intercept represents the value of clear sky albedoin the absence of aerosols, i.e., due to reflection by surface andscattering by air molecules. In principle, the slope is the aero-sol forcing efficiency. However, to establish its validity, weestimate it more directly in the bottom plot of plate 1, aftersubtracting the aerosol-free TOA albedo for each individualobservation.
The aerosol-free TOA albedo is based on the Monte Carlomodel estimations of Podgorny et al. [2000] as discussed insection 3. The difference between the observed TOA albedo(top plot of Plate 1) and the aerosol-free TOA albedo based onthe model calculations gives the TOA albedo due to aerosolsalone (aa). The individual aa values thus determined are thenaveraged at AOD intervals of 0.02 to obtain the mean aa andare shown in the bottom plot of Plate 1; they are indicated onlyfor the range of AOD values having at least 200 points withinthe 0.02 range of AOD. The standard deviation of the individ-ual mean aa values is the same as that of the mean albedovalues in Plate 1 (top). The standard error (standard deviationdivided by the square root of the number of values in eachAOD bin) of the mean aa values is less than 0.003. The bottomplot of Plate 1 shows a very nearly linear increase in aa withAOD, and the variation is appreciably higher than the individ-ual standard errors. The slope of the straight line obtained bya least squares fit is 0.0646, which gives the clear-sky aerosolradiative forcing efficiency at TOA for m 5 0.80. This value isin good agreement with the slope in Plate 1. (top). The inter-cept of the least square fitted line in Plate 1 (bottom) is veryclose to zero (0.0007). The near-zero intercept in the bottomplot demonstrates that the intercept in the top plot is an ex-cellent approximation for the albedo of the aerosol-free atmo-sphere for a mean m of 0.80. Furthermore it also validates theMonte Carlo model calculations.
Plate 1 (bottom) also shows the clear-sky aerosol forcingefficiency for the northern (north of the equator) and southern(south of the equator) Indian Ocean. The clear-sky aerosolforcing efficiencies. (i.e., the slope) for the northern and south-ern Indian Oceans are very similar and within the uncertaintylimits. One of the main reasons for this is that the ITCZ issouth of about 58S to 108S and the anthropogenic aerosolsextend south of the equator. Hence the data for the entire
RAJEEV AND RAMANATHAN: CLEAR-SKY AEROSOL RADIATIVE FORCING17,226
tropical Indian Ocean region are combined together, and theNorthern Hemisphere and Southern Hemisphere are nottreated separately for further calculations. As described insection 2.2, the maximum uncertainty in the TOA albedo is12.1% and that in the AVHRR-retrieved AOD is ;15%. Thetwo errors are not correlated. Thus the uncertainty in theaerosol forcing obtained on the basis of the above method isestimated to be less than 19.2%. The clear-sky aerosol radia-tive forcing efficiency at TOA (in terms of albedo and for AODof 630 nm) is thus 0.0646 6 0.0129 for 0.75 # m # 0.85. Theclear-sky aerosol forcing efficiency obtained from a similaranalysis for the March 1999 (number of collocated points isonly 7585) is 0.0496 for 0.75 # m # 0.85. The results are inagreement within the uncertainty limits.
In the above computations, only the data with m in the range0.75 # m # 0.85 are used, with a mean value m0 5 0.80. Theinstantaneous clear-sky aerosol radiative forcing efficiencythus determined corresponds to m0 5 0.80. We adopt thedifferencing method to extend the analysis to all zenith angleranges. First, we ensure the consistency of the two approachesfor m 5 0.80.
4.1.2. Differencing method. The CERES TOA albedosare sorted for two ranges of collocated AOD: (1) 0.0 #AOD # 0.05 and (2) 0.15 # AOD # 0.25 and binning the
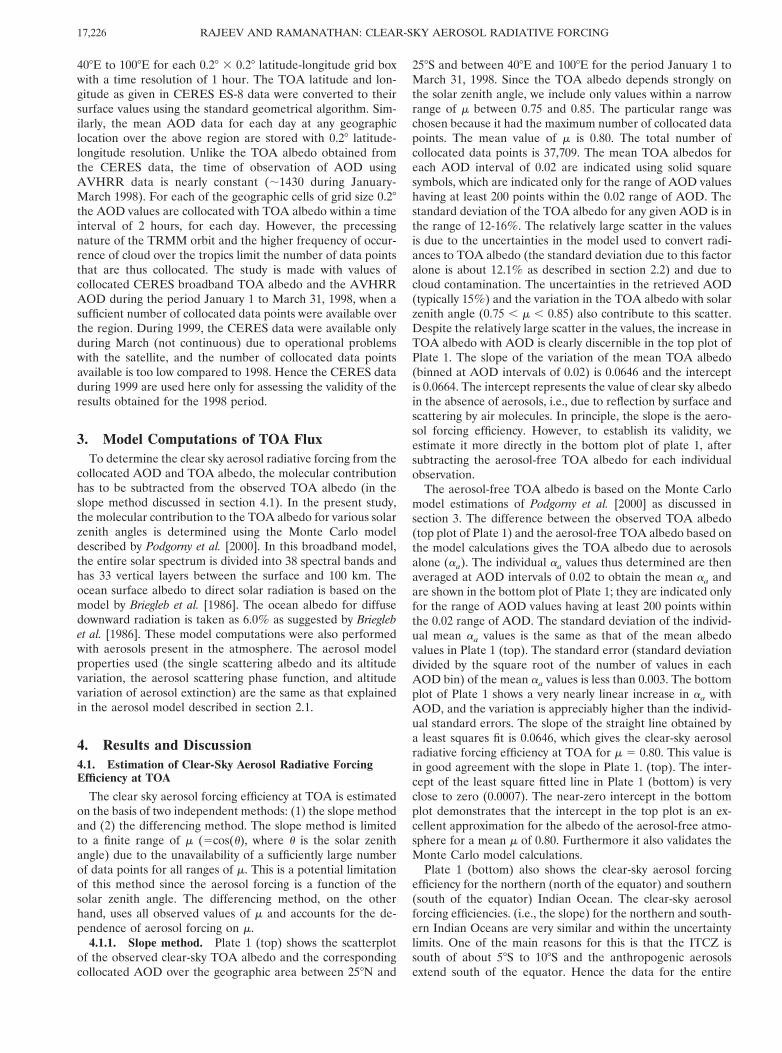
mean albedo (a1 and a2 for 0.0 # AOD # 0.05 and 0.15 #AOD #0.25, respectively) for each value of m with bin size of0.02. This method is applied only to the 1998 data. The numberof points for most of the range bins of m is insufficient during1999 for the application of this method. Plate 2 shows thevariation of mean albedos, a1 and a2 as a function of m for thetwo ranges of AOD. The mean albedo increases with a de-crease in m, as would be expected from theoretical consider-ations. The corresponding mean AODs (ta1 and ta2, respec-tively) are ;0.03 and 0.2, respectively, and uncorrelated withm. It may be noted that the difference between the two meanalbedos increases with a decrease in m, which is an indicationof the m dependence of the clear-sky aerosol forcing efficiency.
The aerosol forcing efficiency for each interval of m is de-termined by taking the ratio of the difference between a1 anda2 (5Da) to the corresponding difference between ta1 and ta2
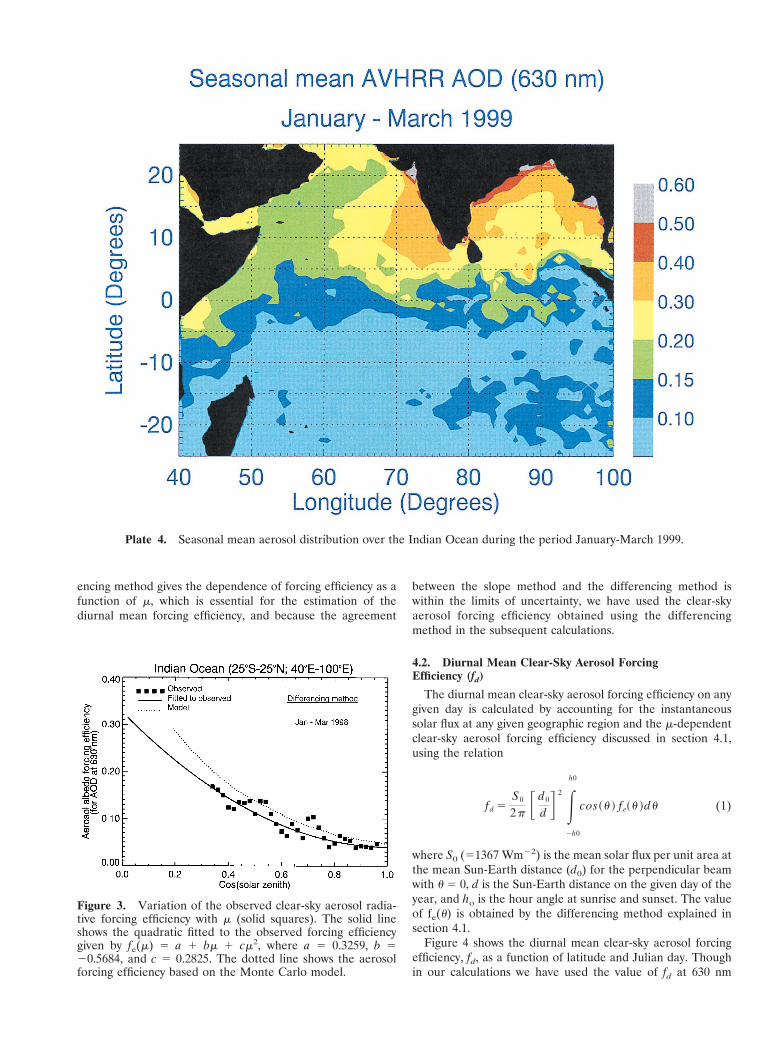
(5Dta); that is, the clear-sky aerosol forcing efficiency as afunction of m is given by fe(m) 5 Da/Dta. Variation of fe (m) asa function of m thus calculated is shown in Figure 3 using solidsquare symbols. The value of fe decreases with an increase in m.The solid line shows the quadratic fitted to the observed forc-ing, given by fe(m) 5 a 1 bm 1 cm2, where a 5 0. 3259, b 520.5684, and c 5 0.2825. The aerosol forcing based on theMonte Carlo model described in section 3 is also shown in
Plate 2. Variation of mean albedos (a1 and a2) with m for two ranges of AOD (0.0 # AOD # 0.05 and0.15 # AOD # 0.25). The bin size of m is 0.02. The respective mean AODs (ta1 and ta2) are also shown. Allthe collocated data in the geographical area between 258N and 258S and between 408E and 1008E during theperiod January 1 to March 31, 1998, are used here.
17,227RAJEEV AND RAMANATHAN: CLEAR-SKY AEROSOL RADIATIVE FORCING
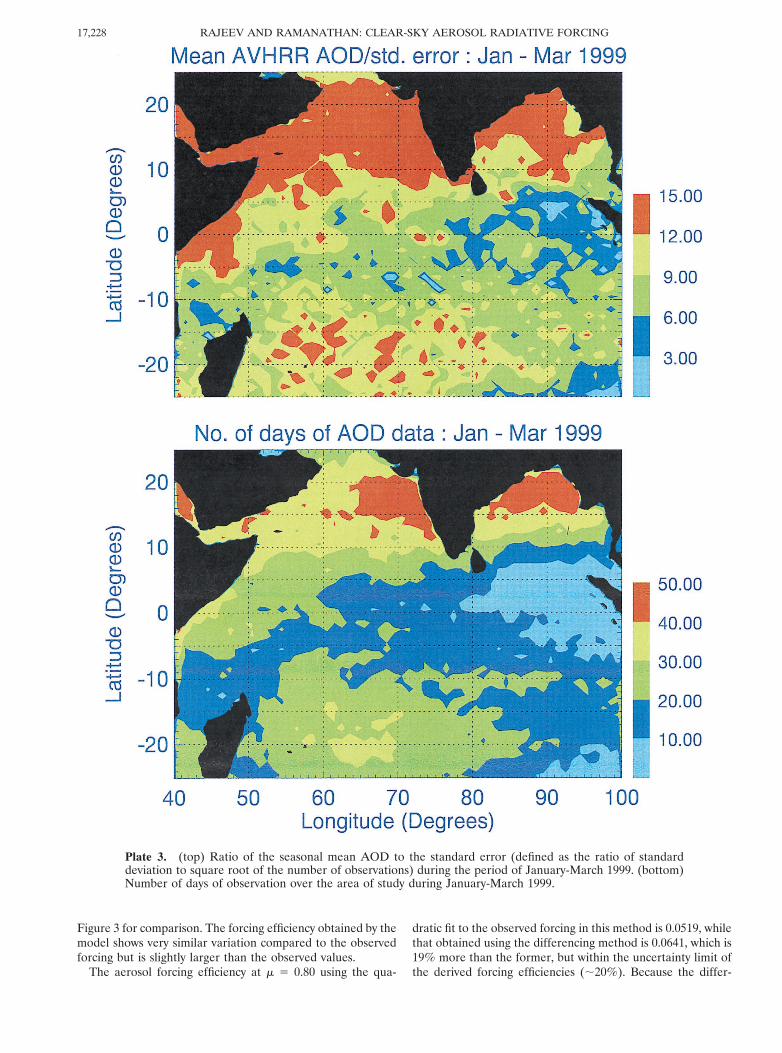
Figure 3 for comparison. The forcing efficiency obtained by themodel shows very similar variation compared to the observedforcing but is slightly larger than the observed values.
The aerosol forcing efficiency at m 5 0.80 using the qua-
dratic fit to the observed forcing in this method is 0.0519, whilethat obtained using the differencing method is 0.0641, which is19% more than the former, but within the uncertainty limit ofthe derived forcing efficiencies (;20%). Because the differ-
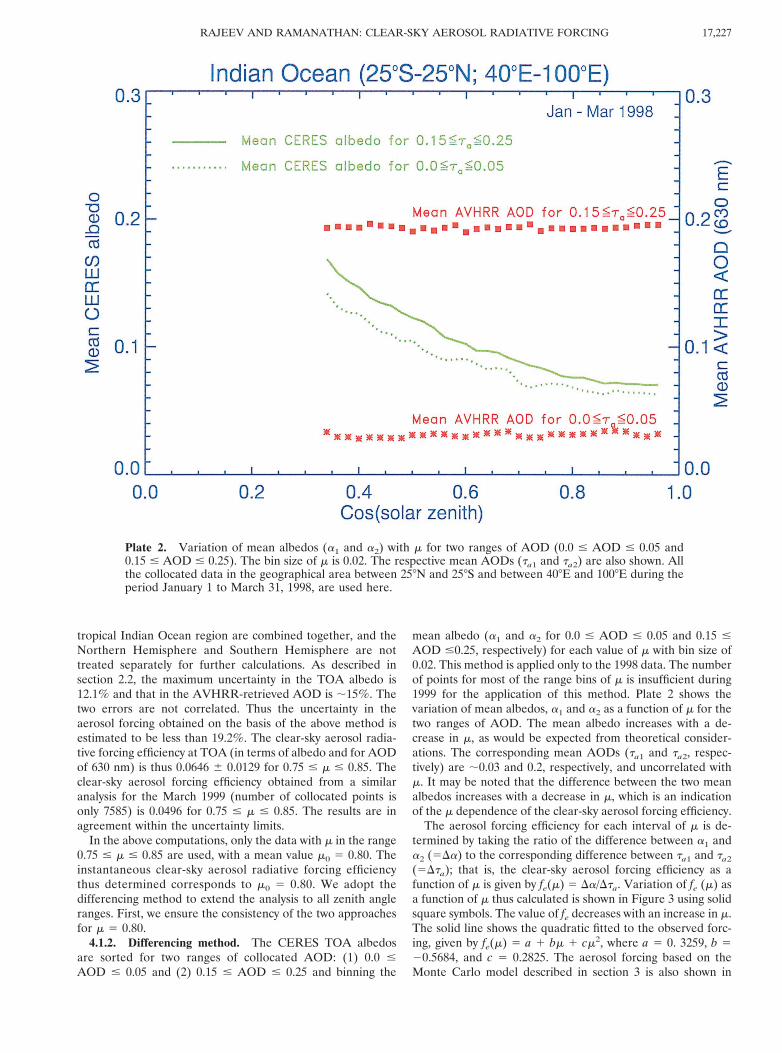
Plate 3. (top) Ratio of the seasonal mean AOD to the standard error (defined as the ratio of standarddeviation to square root of the number of observations) during the period of January-March 1999. (bottom)Number of days of observation over the area of study during January-March 1999.
RAJEEV AND RAMANATHAN: CLEAR-SKY AEROSOL RADIATIVE FORCING17,228
encing method gives the dependence of forcing efficiency as afunction of m, which is essential for the estimation of thediurnal mean forcing efficiency, and because the agreement
between the slope method and the differencing method iswithin the limits of uncertainty, we have used the clear-skyaerosol forcing efficiency obtained using the differencingmethod in the subsequent calculations.
4.2. Diurnal Mean Clear-Sky Aerosol ForcingEfficiency (fd)
The diurnal mean clear-sky aerosol forcing efficiency on anygiven day is calculated by accounting for the instantaneoussolar flux at any given geographic region and the m-dependentclear-sky aerosol forcing efficiency discussed in section 4.1,using the relation
fd 5S0
2p F d0
d G2 E
2h0
h0
cos~u ! fe~u !du (1)
where S0 (51367 Wm22) is the mean solar flux per unit area atthe mean Sun-Earth distance (d0) for the perpendicular beamwith u 5 0, d is the Sun-Earth distance on the given day of theyear, and ho is the hour angle at sunrise and sunset. The valueof fe(u) is obtained by the differencing method explained insection 4.1.
Figure 4 shows the diurnal mean clear-sky aerosol forcingefficiency, fd, as a function of latitude and Julian day. Thoughin our calculations we have used the value of fd at 630 nm
Plate 4. Seasonal mean aerosol distribution over the Indian Ocean during the period January-March 1999.
Figure 3. Variation of the observed clear-sky aerosol radia-tive forcing efficiency with m (solid squares). The solid lineshows the quadratic fitted to the observed forcing efficiencygiven by fe(m) 5 a 1 bm 1 cm2, where a 5 0.3259, b 520.5684, and c 5 0.2825. The dotted line shows the aerosolforcing efficiency based on the Monte Carlo model.
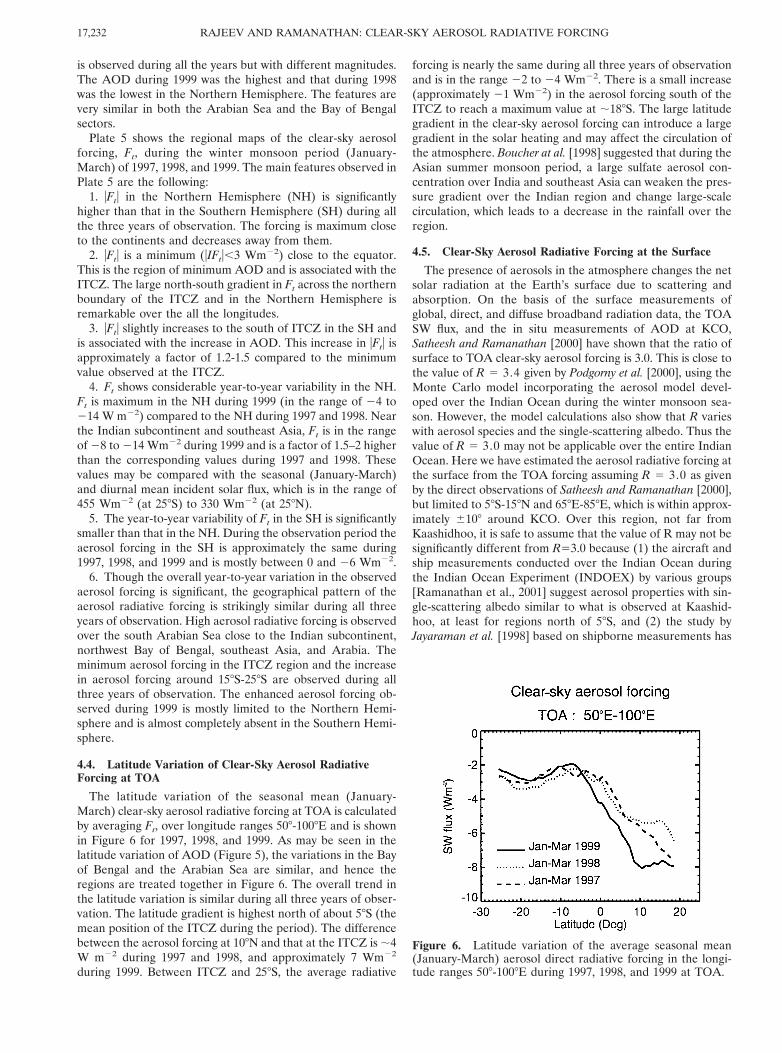
which corresponds to the wavelength of the observed AVHRRAOD, the value at 500 nm is shown in Figure 4 for comparisonwith other measurements, most of which are made at 500 nm.
The clear-sky aerosol forcing efficiency at 630 nm is convertedto 500 nm by dividing by 1.30, which is the average ratio ofaerosol optical depth at 500 nm to that at 630 nm based on the
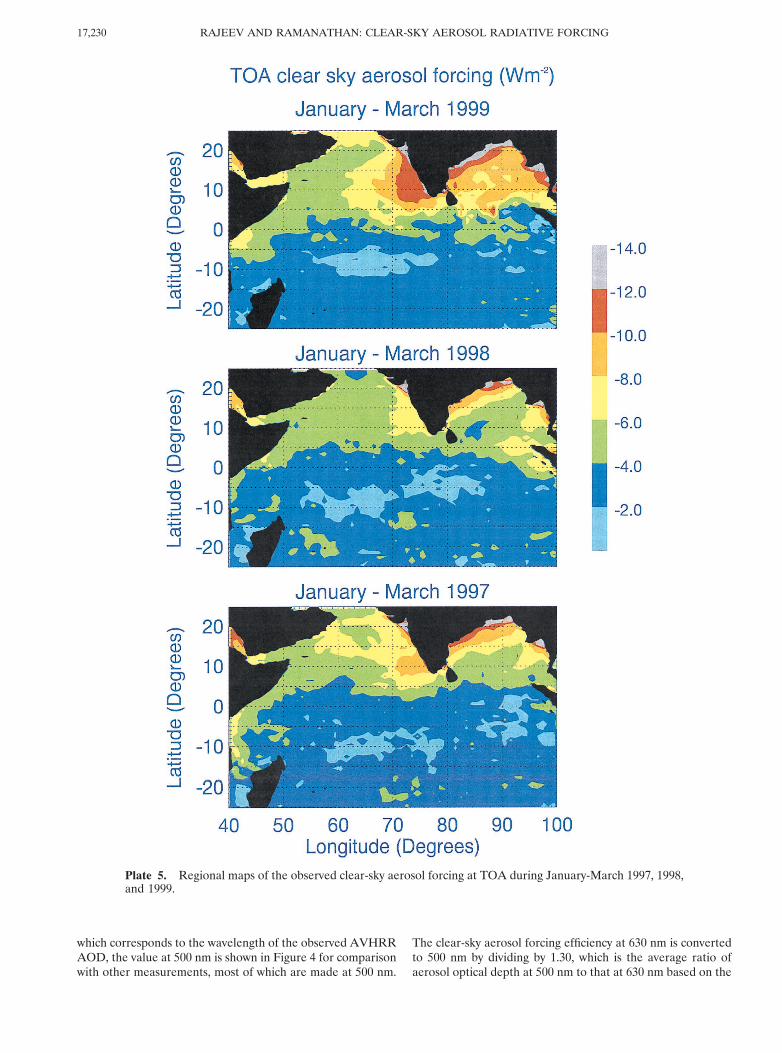
Plate 5. Regional maps of the observed clear-sky aerosol forcing at TOA during January-March 1997, 1998,and 1999.
RAJEEV AND RAMANATHAN: CLEAR-SKY AEROSOL RADIATIVE FORCING17,230
in situ measurements of AOD at KCO. The value of fd is in therange of 23- 27 W m22 (for unit increase in AOD at 500 nm),and on most of the latitudes and days of observation, fd is closeto 24 Wm22. The high value of fd seen at the southernmostlatitudes during January is because of the Sun’s being in theSouthern Hemisphere during this time, resulting in highersolar flux and increased duration of the daytime. The uncer-tainty of fd is ;20%, i.e., about 5 Wm22.
4.3. Regional Distribution of Clear-Sky Aerosol RadiativeForcing at TOA
The clear-sky aerosol radiative forcing at TOA (Ft) is calcu-lated by multiplying the observed AOD with the diurnal meanclear-sky aerosol forcing efficiency, fd, obtained in section 4.2.Here we present the seasonal and diurnal mean clear-sky aero-sol forcing during the period of January-March 1997, 1998, and1999. For deriving the seasonal mean aerosol forcing, the dataat a given location are averaged for the period of January toMarch of each year. However, the AOD has temporal varia-tions and is also limited only to the clear-sky conditions. Rep-resentativeness of the data to generate the seasonal mean isthus affected by these two factors. The number of days ofobservation over the area of study during January-March 1999is shown in Plate 3 (bottom). Since the aerosol retrieval ismade only in the antisolar region of the satellite scan and theoverlapping between successive satellite scans is insignificant atthe low latitudes, the maximum number of days of observationis approximately half of the total number of days. Furthermore,within the ITCZ region, the probability of cloudiness is verylarge, which results in a significantly reduced number of days ofobservations in this region. The number of observations overthe ITCZ around 858E-1008E (the region close to Sumatra) isvery low because of the very active convection in this region,particularly during 1999. Plate 3 also shows the ratio of theseasonal mean AOD to the standard error in AOD (defined asthe ratio of the standard deviation of AOD to square root of
the number of observations) during the period of January-March 1999 (top). The former may be considered as the signaland the latter as the noise. It may be noted that the signal-to-noise (S/N) ratio is sufficiently high (.6) over most of theregions of observation during the period except at the ITCZ.At the ITCZ the variability of AOD is higher. As seen later(e.g., Plate 4), the value of AOD is very small at ITCZ, whichalso contributes to the smaller signal-to-noise ratio. Consider-ing the S/N ratio and the number of days of observation, webelieve that the seasonal means derived are quite representa-tive for most of the regions, except around the equator close to858E-1008E during 1999. The features are similar during 1997and 1998. However, during 1997 and 1998 the number ofobservations at the equator close to 858E-1008E also was sig-nificantly higher than that during 1999.
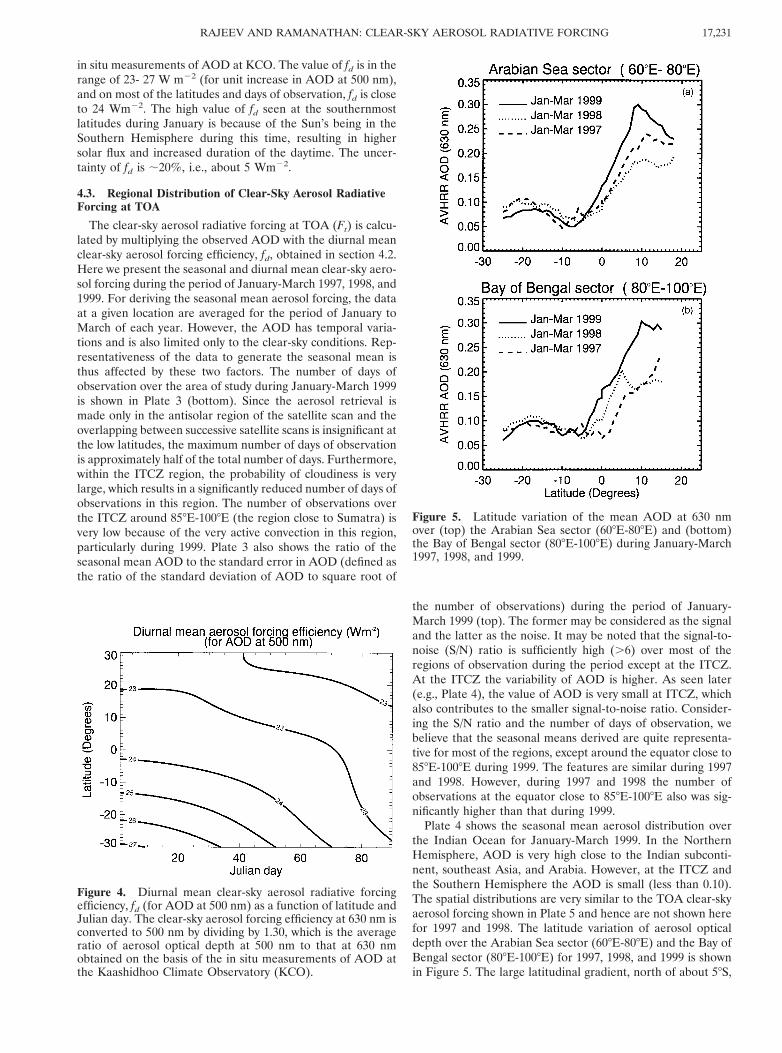
Plate 4 shows the seasonal mean aerosol distribution overthe Indian Ocean for January-March 1999. In the NorthernHemisphere, AOD is very high close to the Indian subconti-nent, southeast Asia, and Arabia. However, at the ITCZ andthe Southern Hemisphere the AOD is small (less than 0.10).The spatial distributions are very similar to the TOA clear-skyaerosol forcing shown in Plate 5 and hence are not shown herefor 1997 and 1998. The latitude variation of aerosol opticaldepth over the Arabian Sea sector (608E-808E) and the Bay ofBengal sector (808E-1008E) for 1997, 1998, and 1999 is shownin Figure 5. The large latitudinal gradient, north of about 58S,
Figure 4. Diurnal mean clear-sky aerosol radiative forcingefficiency, fd (for AOD at 500 nm) as a function of latitude andJulian day. The clear-sky aerosol forcing efficiency at 630 nm isconverted to 500 nm by dividing by 1.30, which is the averageratio of aerosol optical depth at 500 nm to that at 630 nmobtained on the basis of the in situ measurements of AOD atthe Kaashidhoo Climate Observatory (KCO).
Figure 5. Latitude variation of the mean AOD at 630 nmover (top) the Arabian Sea sector (608E-808E) and (bottom)the Bay of Bengal sector (808E-1008E) during January-March1997, 1998, and 1999.
17,231RAJEEV AND RAMANATHAN: CLEAR-SKY AEROSOL RADIATIVE FORCING
is observed during all the years but with different magnitudes.The AOD during 1999 was the highest and that during 1998was the lowest in the Northern Hemisphere. The features arevery similar in both the Arabian Sea and the Bay of Bengalsectors.
Plate 5 shows the regional maps of the clear-sky aerosolforcing, Ft, during the winter monsoon period (January-March) of 1997, 1998, and 1999. The main features observed inPlate 5 are the following:
1. uFtu in the Northern Hemisphere (NH) is significantlyhigher than that in the Southern Hemisphere (SH) during allthe three years of observation. The forcing is maximum closeto the continents and decreases away from them.
2. uFtu is a minimum (uIFtu,3 Wm22) close to the equator.This is the region of minimum AOD and is associated with theITCZ. The large north-south gradient in Ft across the northernboundary of the ITCZ and in the Northern Hemisphere isremarkable over the all the longitudes.
3. uFtu slightly increases to the south of ITCZ in the SH andis associated with the increase in AOD. This increase in uFtu isapproximately a factor of 1.2-1.5 compared to the minimumvalue observed at the ITCZ.
4. Ft shows considerable year-to-year variability in the NH.Ft is maximum in the NH during 1999 (in the range of 24 to214 W m22) compared to the NH during 1997 and 1998. Nearthe Indian subcontinent and southeast Asia, Ft is in the rangeof 28 to 214 Wm22 during 1999 and is a factor of 1.5–2 higherthan the corresponding values during 1997 and 1998. Thesevalues may be compared with the seasonal (January-March)and diurnal mean incident solar flux, which is in the range of455 Wm22 (at 258S) to 330 Wm22 (at 258N).
5. The year-to-year variability of Ft in the SH is significantlysmaller than that in the NH. During the observation period theaerosol forcing in the SH is approximately the same during1997, 1998, and 1999 and is mostly between 0 and 26 Wm22.
6. Though the overall year-to-year variation in the observedaerosol forcing is significant, the geographical pattern of theaerosol radiative forcing is strikingly similar during all threeyears of observation. High aerosol radiative forcing is observedover the south Arabian Sea close to the Indian subcontinent,northwest Bay of Bengal, southeast Asia, and Arabia. Theminimum aerosol forcing in the ITCZ region and the increasein aerosol forcing around 158S-258S are observed during allthree years of observation. The enhanced aerosol forcing ob-served during 1999 is mostly limited to the Northern Hemi-sphere and is almost completely absent in the Southern Hemi-sphere.
4.4. Latitude Variation of Clear-Sky Aerosol RadiativeForcing at TOA
The latitude variation of the seasonal mean (January-March) clear-sky aerosol radiative forcing at TOA is calculatedby averaging Ft, over longitude ranges 508-1008E and is shownin Figure 6 for 1997, 1998, and 1999. As may be seen in thelatitude variation of AOD (Figure 5), the variations in the Bayof Bengal and the Arabian Sea are similar, and hence theregions are treated together in Figure 6. The overall trend inthe latitude variation is similar during all three years of obser-vation. The latitude gradient is highest north of about 58S (themean position of the ITCZ during the period). The differencebetween the aerosol forcing at 108N and that at the ITCZ is ;4W m22 during 1997 and 1998, and approximately 7 Wm22
during 1999. Between ITCZ and 258S, the average radiative
forcing is nearly the same during all three years of observationand is in the range 22 to 24 Wm22. There is a small increase(approximately 21 Wm22) in the aerosol forcing south of theITCZ to reach a maximum value at ;188S. The large latitudegradient in the clear-sky aerosol forcing can introduce a largegradient in the solar heating and may affect the circulation ofthe atmosphere. Boucher at al. [1998] suggested that during theAsian summer monsoon period, a large sulfate aerosol con-centration over India and southeast Asia can weaken the pres-sure gradient over the Indian region and change large-scalecirculation, which leads to a decrease in the rainfall over theregion.
4.5. Clear-Sky Aerosol Radiative Forcing at the Surface
The presence of aerosols in the atmosphere changes the netsolar radiation at the Earth’s surface due to scattering andabsorption. On the basis of the surface measurements ofglobal, direct, and diffuse broadband radiation data, the TOASW flux, and the in situ measurements of AOD at KCO,Satheesh and Ramanathan [2000] have shown that the ratio ofsurface to TOA clear-sky aerosol forcing is 3.0. This is close tothe value of R 5 3.4 given by Podgorny et al. [2000], using theMonte Carlo model incorporating the aerosol model devel-oped over the Indian Ocean during the winter monsoon sea-son. However, the model calculations also show that R varieswith aerosol species and the single-scattering albedo. Thus thevalue of R 5 3.0 may not be applicable over the entire IndianOcean. Here we have estimated the aerosol radiative forcing atthe surface from the TOA forcing assuming R 5 3.0 as givenby the direct observations of Satheesh and Ramanathan [2000],but limited to 58S-158N and 658E-858E, which is within approx-imately 6108 around KCO. Over this region, not far fromKaashidhoo, it is safe to assume that the value of R may not besignificantly different from R53.0 because (1) the aircraft andship measurements conducted over the Indian Ocean duringthe Indian Ocean Experiment (INDOEX) by various groups[Ramanathan et al., 2001] suggest aerosol properties with sin-gle-scattering albedo similar to what is observed at Kaashid-hoo, at least for regions north of 58S, and (2) the study byJayaraman et al. [1998] based on shipborne measurements has
Figure 6. Latitude variation of the average seasonal mean(January-March) aerosol direct radiative forcing in the longi-tude ranges 508-1008E during 1997, 1998, and 1999 at TOA.
RAJEEV AND RAMANATHAN: CLEAR-SKY AEROSOL RADIATIVE FORCING17,232
shown similar aerosol forcing efficiencies over the study areanorth of about 58S. The difference between the surface forcingand the TOA forcing is the net radiative heating of the atmo-sphere due to the presence of aerosols, in contrast to the
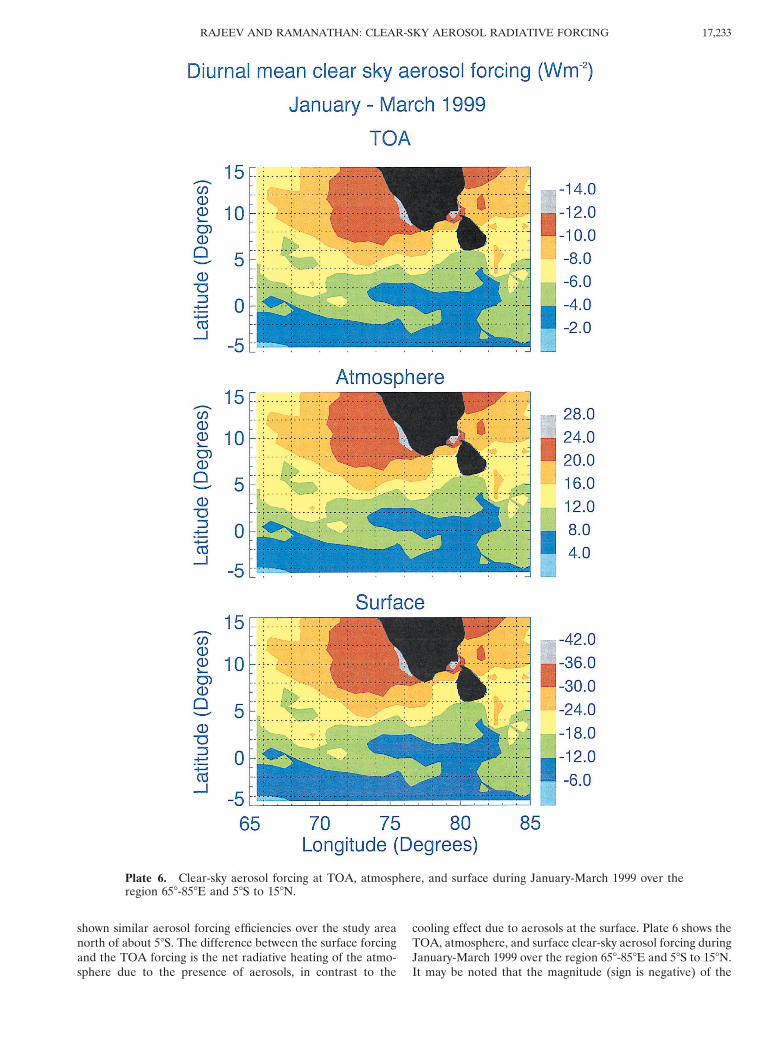
cooling effect due to aerosols at the surface. Plate 6 shows theTOA, atmosphere, and surface clear-sky aerosol forcing duringJanuary-March 1999 over the region 658-858E and 58S to 158N.It may be noted that the magnitude (sign is negative) of the
Plate 6. Clear-sky aerosol forcing at TOA, atmosphere, and surface during January-March 1999 over theregion 658-858E and 58S to 158N.
17,233RAJEEV AND RAMANATHAN: CLEAR-SKY AEROSOL RADIATIVE FORCING
aerosol forcing at the surface is greater than 18 Wm22 overmost of the regions in the NH, and about 230 to 242 Wm22
close to the coastal boundary of the Indian subcontinent. OverKaashidhoo, Satheesh and Ramanathan [2000] reported a valueof approximately 222 and 233 Wm22 during February andMarch 1999, respectively. This is in good agreement with222.8 W m22 over KCO during January-March 1999 esti-mated in the present study (the values of AOD and the aerosolforcing during January were less than those during Februaryand March 1999). The atmospheric heating due to aerosols isestimated to correspond to ;12–28 Wm22 over the NH and is;20–28 Wm22 near the coast of the Indian subcontinent.
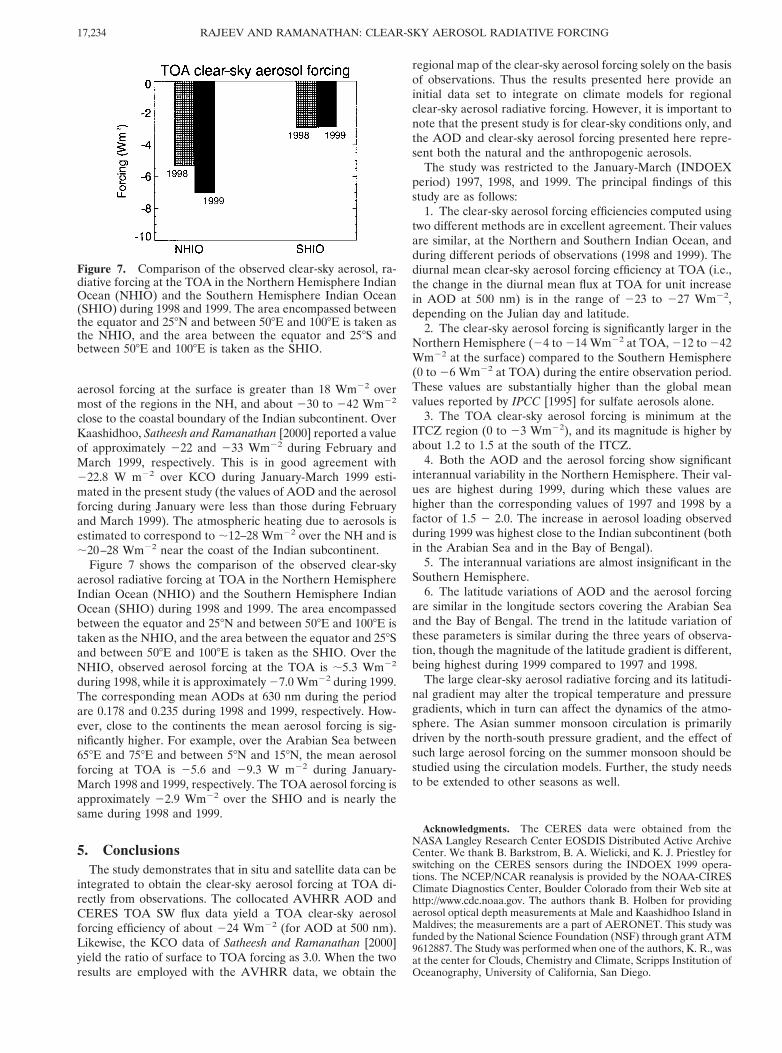
Figure 7 shows the comparison of the observed clear-skyaerosol radiative forcing at TOA in the Northern HemisphereIndian Ocean (NHIO) and the Southern Hemisphere IndianOcean (SHIO) during 1998 and 1999. The area encompassedbetween the equator and 258N and between 508E and 1008E istaken as the NHIO, and the area between the equator and 258Sand between 508E and 1008E is taken as the SHIO. Over theNHIO, observed aerosol forcing at the TOA is ;5.3 Wm22
during 1998, while it is approximately 27.0 Wm22 during 1999.The corresponding mean AODs at 630 nm during the periodare 0.178 and 0.235 during 1998 and 1999, respectively. How-ever, close to the continents the mean aerosol forcing is sig-nificantly higher. For example, over the Arabian Sea between658E and 758E and between 58N and 158N, the mean aerosolforcing at TOA is 25.6 and 29.3 W m22 during January-March 1998 and 1999, respectively. The TOA aerosol forcing isapproximately 22.9 Wm22 over the SHIO and is nearly thesame during 1998 and 1999.
5. ConclusionsThe study demonstrates that in situ and satellite data can be
integrated to obtain the clear-sky aerosol forcing at TOA di-rectly from observations. The collocated AVHRR AOD andCERES TOA SW flux data yield a TOA clear-sky aerosolforcing efficiency of about 224 Wm22 (for AOD at 500 nm).Likewise, the KCO data of Satheesh and Ramanathan [2000]yield the ratio of surface to TOA forcing as 3.0. When the tworesults are employed with the AVHRR data, we obtain the
regional map of the clear-sky aerosol forcing solely on the basisof observations. Thus the results presented here provide aninitial data set to integrate on climate models for regionalclear-sky aerosol radiative forcing. However, it is important tonote that the present study is for clear-sky conditions only, andthe AOD and clear-sky aerosol forcing presented here repre-sent both the natural and the anthropogenic aerosols.
The study was restricted to the January-March (INDOEXperiod) 1997, 1998, and 1999. The principal findings of thisstudy are as follows:
1. The clear-sky aerosol forcing efficiencies computed usingtwo different methods are in excellent agreement. Their valuesare similar, at the Northern and Southern Indian Ocean, andduring different periods of observations (1998 and 1999). Thediurnal mean clear-sky aerosol forcing efficiency at TOA (i.e.,the change in the diurnal mean flux at TOA for unit increasein AOD at 500 nm) is in the range of 223 to 227 Wm22,depending on the Julian day and latitude.
2. The clear-sky aerosol forcing is significantly larger in theNorthern Hemisphere (24 to 214 Wm22 at TOA, 212 to 242Wm22 at the surface) compared to the Southern Hemisphere(0 to 26 Wm22 at TOA) during the entire observation period.These values are substantially higher than the global meanvalues reported by IPCC [1995] for sulfate aerosols alone.
3. The TOA clear-sky aerosol forcing is minimum at theITCZ region (0 to 23 Wm22), and its magnitude is higher byabout 1.2 to 1.5 at the south of the ITCZ.
4. Both the AOD and the aerosol forcing show significantinterannual variability in the Northern Hemisphere. Their val-ues are highest during 1999, during which these values arehigher than the corresponding values of 1997 and 1998 by afactor of 1.5 2 2.0. The increase in aerosol loading observedduring 1999 was highest close to the Indian subcontinent (bothin the Arabian Sea and in the Bay of Bengal).
5. The interannual variations are almost insignificant in theSouthern Hemisphere.
6. The latitude variations of AOD and the aerosol forcingare similar in the longitude sectors covering the Arabian Seaand the Bay of Bengal. The trend in the latitude variation ofthese parameters is similar during the three years of observa-tion, though the magnitude of the latitude gradient is different,being highest during 1999 compared to 1997 and 1998.
The large clear-sky aerosol radiative forcing and its latitudi-nal gradient may alter the tropical temperature and pressuregradients, which in turn can affect the dynamics of the atmo-sphere. The Asian summer monsoon circulation is primarilydriven by the north-south pressure gradient, and the effect ofsuch large aerosol forcing on the summer monsoon should bestudied using the circulation models. Further, the study needsto be extended to other seasons as well.
Acknowledgments. The CERES data were obtained from theNASA Langley Research Center EOSDIS Distributed Active ArchiveCenter. We thank B. Barkstrom, B. A. Wielicki, and K. J. Priestley forswitching on the CERES sensors during the INDOEX 1999 opera-tions. The NCEP/NCAR reanalysis is provided by the NOAA-CIRESClimate Diagnostics Center, Boulder Colorado from their Web site athttp://www.cdc.noaa.gov. The authors thank B. Holben for providingaerosol optical depth measurements at Male and Kaashidhoo Island inMaldives; the measurements are a part of AERONET. This study wasfunded by the National Science Foundation (NSF) through grant ATM9612887. The Study was performed when one of the authors, K. R., wasat the center for Clouds, Chemistry and Climate, Scripps Institution ofOceanography, University of California, San Diego.
Figure 7. Comparison of the observed clear-sky aerosol, ra-diative forcing at the TOA in the Northern Hemisphere IndianOcean (NHIO) and the Southern Hemisphere Indian Ocean(SHIO) during 1998 and 1999. The area encompassed betweenthe equator and 258N and between 508E and 1008E is taken asthe NHIO, and the area between the equator and 258S andbetween 508E and 1008E is taken as the SHIO.
RAJEEV AND RAMANATHAN: CLEAR-SKY AEROSOL RADIATIVE FORCING17,234
ReferencesBoucher, O., M. Pham, and R. Sadourny, General circulation model
simulations of the Indian summer monsoon with increasing levels ofsulphate aerosols, Ann. Geophys., 16, 346–352, 1998.
Briegleb, B. P., P. Minnis, V. Ramanathan, and E. Harrison, Compar-ison of regional clear-sky albedos inferred from satellite observa-tions and model computations, J. Clim. Appl. Meteorol., 25, 214–226,1986.
Charlson, R. J., S. E. Schwartz, J. M. Hales, R. D. Cess, J. A. Coakley,J. E. Hansen, and D. J. Hofmann, Climate forcing by anthropogenicaerosols, Science, 255, 423–430, 1992.
Coakley, J. A., and F. P. Bretherton, Cloud cover from high resolutionscanner data: Detecting and allowing for partially filled fields ofview, J. Geophys. Res., 87, 4917–4932, 1982.
Cox, C., and W. Munk, Measurement of the roughness of the seasurface from photographs of the Sun-glitter, J. Opt. Soc. Am., 44,838–850, 1954.
Durkee, P. A., F. Pfeil, E. Frost, and R. Shema, Global analysis ofaerosol particle characteristics, Atmos. Environ., 25A, 2457–2471,1991.
Haywood, J. M., V. Ramaswamy, and B. J. Soden, Tropospheric aero-sol climate forcing in clear-sky satellite observations over the oceans,Science, 283, 1299–1303, 1999.
Hess, M., P. Koepke, and I. Schult, Optical properties of aerosols andclouds: The software package OPAC, Bull. Am. Meteorol. Soc., 79,831–844, 1998.
Hignett, P., J. P. Taylor, P. N. Francis, and N. D. Glew, Comparison ofobserved and modeled direct aerosol forcing during TARFOX, J.Geophys. Res., 104, 2279–2287, 1999.
Holben, B. N., T. F. Eck, I. Slutsker, D. Tanre, J. P. Buis, A. Setzer, E.Vermote, J. A. Reagan, Y. J. Kaufman, T. Nakajima, F. Lavenu, I.Jankowiak, and A. Smirnov, AERONET-A federated instrumentnetwork and data archive for aerosol characterization, Remote Sens.Environ., 66, 1–16, 1998.
Intergovernmental Panel on Climate Change (IPCC), Climate Change,1994: Radiative Forcing of Climate Change and Evaluation of IPCCIS92 Emission Scenarios, edited by J. H. Houghton, 339 pp., Cam-bridge Univ. Press, New York, 1995.
Jayaraman, A., Results on direct radiative forcing of aerosols obtainedover the tropical Indian Ocean, Curr. Sci., 76, 924–930, 1999.
Jayaraman, A., D. Lubin, S. Ramachandran, V. Ramanathan, E.Woodbridge, W. D. Collins, and K. S. Zalpuri, Direct observationsof aerosol radiative forcing over the tropical Indian Ocean duringthe January-February 1996 pre-INDOEX cruise, J. Geophys. Res.,103, 13,827–13,836, 1998.
Kalnay, E. et al., The NCEP/NCAR reanalysis 40-year project, Bull.Am. Meteorol. Soc., 77, 437–471. 1996
Kaufman, Y. J., et al., Smoke, Clouds and Radiation-Brazil (SCAR-B)experiment, J. Geophys. Res., 103, 31,783–31,808, 1998.
Kiehl, J. T., and B. P. Briegleb, The relative roles of sulfate aerosol andgreenhouse gases in climate forcing, Science, 260, 311–314, 1993.
Koepke, P., Effective reflectance of oceanic whitecaps, Appl. Opt., 23,1816–1824, 1984.
McClatchey, R. A., R. W. Fenn, J. E. A. Selby, F. E. Volz, and J. S.Garing, Optical properties of the atmosphere, 3rd ed., Environ. Res.Pap. 411, Air Force Cambridge Res. Lab., Bedford, Masse, 1972.
Meywerk, J., and V. Ramanathan, Observations of the spectral clear-
sky aerosol forcing over the tropical Indian Ocean, J. Geophys. Res.,104, 24,359–24,370, 1999.
Podgorny, I. A., W. Conant, V. Ramanathan, and S. K. Satheesh.Aerosol modulation of atmospheric and surface solar heating overthe tropical Indian Ocean, Tellus, Ser. B, 52, 947–958, 2000.
Rajeev, K., V. Ramanathan, and J. Meywerk, Regional aerosol distri-bution and its long range transport over the Indian Ocean, J. Geo-phys. Res., 105, 2029–2043, 2000.
Ramanathan, V., et al., Indian Ocean Experiment (INDOEX) whitepaper, Rep. C4, Scripps Inst. of Oceanogr., Univ. of Calif., SanDiego, La Jolla, Calif., Aug. 1995.
Ramanathan, V., et al., The Indian Ocean Experiment: An integratedanalysis of the climate forcing and effects of the great Indo-Asianocean haze, J. Geophys. Res., in press, 2001.
Rao, C.R.N., and J. Chen, Revised post-launch calibration of thevisible and near-infrared channels of the advanced very high reso-lution radiometer (AVHRR) on the NOAA-14 spacecraft, Int. J.Remote Sens., 20(18), 3485–3491, 1999.
Russell, P. B, P. V. Hobbs, and L. L. Stowe, Aerosol properties andradiative effects in the United States East Coast haze plume: Anoverview of the Tropospheric Aerosol Radiative Forcing Observa-tional Experiment (TARFOX), J. Geophys. Res., 104, 2213–2222,1999.
Satheesh, S. K., and V. Ramanathan, Large difference in tropicalaerosol forcing at the top of the atmosphere and Earth’s surfaceNature, 405, 60–63, 2000.
Satheesh, S. K., V. Ramanathan, X. Li-Jones, J. M. Lobert, I. A.Podgorny, J. M. Prospero, B. N. Holben, and N. G. Loeb., A modelfor the natural and anthropogenic aerosols over the tropical IndianOcean derived from Indian Ocean Experiment data, J. Geophys.Res., 104, 27,421–27,440, 1999.
Smith, G. L., R. N. Green, E. Raschke, L. M. Avis, J. T. Suttles, B. A.Wielicki, and R. Davies, Inversion methods for satellite studies ofthe Earths radiation budget: Development of algorithms for theERBE mission, Rev. Geophys., 24, 407–421, 1986.
Stamnes, K., S.-C. Tsay, W. Wiscombe, and K. Jayaweera, A numeri-cally stable algorithm for discrete-ordinate-method radiative trans-fer in multiple scattering and emitting layered media, Appl. Opt., 27,2502–2509, 1988.
Tahnk, W. R., and J. A. Coakley Jr., Improved calibration coefficientsfor NOAA-14 AVHRR visible and near-IR channels, Int. J. RemoteSens., in press, 2001.
Wielicki, B. A., et al., Clouds and Earth’s Radiant Energy System(CERES): An Earth Observing System Experiment, Bull. Am. Me-teorol. Soc., 77, 853–868, 1996.
Wielicki, B. A., et al., Clouds and the Earth’s Radiant Energy System(CERES): Algorithm overview, IEEE Trans. Geosci. Remote Sens.,36, 1127–1140, 1998.
K. Rajeev, Space Physics Laboratory, Vikram Sarathai Space Cen-tre, Trivandrum 695 022, India. ([email protected])
V. Ramanathan, Center for Clouds, Chemistry, and Climate, ScrippsInstitution of Oceanography, University of California, San Diego, 9500Gilman Drive, La Jolla, CA 92093. ([email protected])
(Received April 26, 2000; revised October 6, 2000;accepted October 11, 2000.)
17,235RAJEEV AND RAMANATHAN: CLEAR-SKY AEROSOL RADIATIVE FORCING

17,236