direct instruction vs. discovery: the long vie joseph krajcik and maria varelas, section coeditors...
TRANSCRIPT

LEARNING
Joseph Krajcik and Maria Varelas, Section Coeditors
Direct Instruction vs. Discovery:The Long View
DAVID DEAN JR., DEANNA KUHNTeachers College, Columbia University, New York, NY 10027, USA
Received 20 June 2006; revised 4 October 2006; accepted 12 October 2006
DOI 10.1002/sce.20194Published online 14 December 2006 in Wiley InterScience (www.interscience.wiley.com).
ABSTRACT: D. Klahr and M. Nigam (2004) make a case for the superiority of directinstruction over discovery learning in students’ mastery of the control-of-variables strategycentral to the scientific method. In the present work, we examine acquisition of this strategyamong students of the same age as those studied by Klahr and Nigam, as well as followcentral features of their design in directly comparing the two methods. In contrast to theirdesign, however, we follow progress over an extended time period and a range of equivalenttasks. Three groups of 15 fourth-grade students, of diverse socioeconomic background, werecompared. One group engaged in 12 sessions over 10 weeks working on problems thatrequired the control-of-variables strategy for effective solution. Another group engagedin the same activity, preceded by a session involving direct instruction on the control-of-variables strategy. A third group received only the initial direct instruction, withoutsubsequent engagement and practice. In this longer term framework, direct instructionappears to be neither a necessary nor sufficient condition for robust acquisition or formaintenance over time. The patterns of attainment observed here point instead to a gradualand extended process of acquisition and consolidation. C© 2006 Wiley Periodicals, Inc. SciEd 91:384 – 397, 2007
INTRODUCTION
A recent study by Klahr and Nigam (2004) presents evidence to support a claim of thesuperiority of direct instruction over discovery learning, a claim that a number of researchers
Correspondence to: Deanna Kuhn; e-mail: [email protected] address of David Dean Jr.: Center for AIDS and STD, School of Social Work, University of
Washington, Seattle, WA 98104, USA.
C© 2006 Wiley Periodicals, Inc.

DIRECT INSTRUCTION VS. DISCOVERY 385
(e.g., Kirschner, Sweller, & Clark, 2006; Mayer, 2004; Rittle-Johnson, 2006), as well aspolicymakers, now endorse. Klahr and Nigam administered brief direct instruction onthe control-of-variables procedure to a large group of third- and fourth-grade students.They indicate that in order to facilitate comparison with their other condition, they used“an extreme type of direct instruction in which the goals, the materials, the examples,the explanations, and the pace of instruction are all teacher controlled” (p. 662). In theircomparison condition, the same problem was presented but students were allowed to designtheir own procedures and received no instruction or feedback. The problem was one in whichstudents were provided with appropriate materials and asked to determine how differentvariables (ball material and surface, length, and steepness of ramp) affected the distancethat balls traveled after rolling down an incline. Students in the direct instruction condition,Klahr and Nigam report, outperformed those in the comparison condition on both directand transfer assessments.
In the work presented here, we study acquisition of the same strategy that Klahr andNigam (2004) studied (control of variables), among students of the same age, and incor-porate the central features of their design. A major difference is time frame. We examineacquisition and maintenance over a longer time period—almost 6 months—in contrast tothe single acquisition session, with transfer assessment 1 week later, in Klahr and Nigam’sstudy. Furthermore, we follow students’ mastery of this specific strategy across variedcontent over the entire period, whereas Klahr and Nigam’s follow-up assessment shiftedto a less well-defined variety of concepts associated with the scientific method. Under ourmore extended assessment, we hypothesized, the relative strengths of direct instruction anddiscovery might appear somewhat different. Given the significant policy implications ofthis debate, the “long view” adopted in the present work seems worthy of investigation.
The control-of-variables strategy studied by Klahr and Nigam (2004) is a key componentof inquiry skills, which now appear in the American national curriculum standards forscience (National Research Council, 1996) at every grade beginning with second or thirdthrough twelfth and appear in most state standards as well. In the national science standards,the goals of inquiry skill development for grades 5–8 are the following (National ResearchCouncil, 1996):
– identify questions that can be answered through scientific investigations;– design and conduct a scientific investigation;– use appropriate tools and techniques to gather, analyze, and interpret data;– develop descriptions, explanations, predictions, and models using evidence;– think critically and logically to make the relationships between evidence and
explanations.
Under “design and conduct a scientific investigation,” subskills identified include“. . . systematic observation, making accurate measurements, and identifying and control-ling variables.”
Klahr and Nigam’s (2004) intention is to demonstrate that direct instruction is a moreeffective means of acquiring the control-of-variables strategy than is “discovery learning,”which they define as the student discovering or constructing this skill for himself or herself.There exists a certain irony, if not conceptual incoherence, in their intention, in that thecontrol-of-variables strategy is a component of inquiry skill and inquiry skill is broadlyunderstood to mean skill in discovering or constructing knowledge for oneself. Nonetheless,it is conceivable that inquiry methods are not the best ones for teaching inquiry skills andKlahr and Nigam’s proposition thus deserves empirical investigation. The counterintuitivenature of the proposition, however—in suggesting the superiority of a method other than
Science Education DOI 10.1002/sce

386 DEAN AND KUHN
involving students in activities that demand inquiry as a means of fostering inquiry skills—means that claims for such superiority should be especially well documented, particularlyin demonstrating the scope and stability of what students have acquired. Hence, the longview taken here.
METHOD
Participants
Participants were 44 fourth-grade students in a university-affiliated urban independentelementary school. The school is unique in that 50% of its enrollment consists of children ofthe university faculty and senior administrators, while the other 50% of spaces in the schoolare reserved for children of families in the surrounding, largely lower income neighborhood,chosen by lottery and provided sufficient financial aid to enable them to attend. The studentbody is thus more diverse than is typical in most schools with respect to race, ethnicity,parent education level, and student ability. Once students enroll in the school, they arenot distinguished as to mode of entry. It was therefore not feasible, nor did we considerit appropriate, to identify them or examine their performance in the present study as afunction of family (university or community) status.
Design
Previous assessments with fourth and sixth graders at this school (described below) hadestablished that students in fourth grade showed no initial competence with respect tothe strategy under investigation, a conclusion consistent with much previous research (seeKuhn, 2001, for review). Individual pretest assessment was therefore deemed unnecessary,and the design consists of postintervention comparisons of three groups who underwentdifferent forms of intervention.
The three fourth-grade classes at the school each contained 15 students and had beencomposed so as to be equivalent with respect to children’s gender, ability and achieve-ment, and social characteristics. Although we did not have access to these data, schooladministrators informed us that median and range of scores on standardized academicachievement tests were equivalent across the three groups. These classes were randomlyassigned to one of three conditions: (a) extended engagement with problems requiring thecontrol-of-variables strategy for effective solution (henceforth referred to as the practicecondition), hypothesized to give students opportunity to develop the strategy of interest, (b)single-session direct instruction, designed to teach the strategy, and (c) a third conditionconsisting of the combination of the first two (direct instruction plus practice). The groupsare henceforth referred to as the PR, DI, and DI/PR groups, respectively.
The DI condition was modeled after Klahr and Nigam’s (2004) direct-instruction proce-dures as closely as possible (see description below). Except for its extension over a muchlonger period of time, the practice condition resembled Klahr and Nigam’s discovery con-dition in engaging students in a problem that required the control of variables strategy foreffective solution and hence providing them opportunity to construct the strategy.
In addition to the overall analysis implied by the design, we addressed two specificresearch questions: (a) How does practice, with or without DI, compare to DI alone? (b)Do effects differ at different time intervals?
Tasks
Three parallel computer-based inquiry tasks were employed during practice and assess-ment: ocean voyage (OV), earthquake forecaster (EF), and avalanche hunter (AH). The
Science Education DOI 10.1002/sce

DIRECT INSTRUCTION VS. DISCOVERY 387
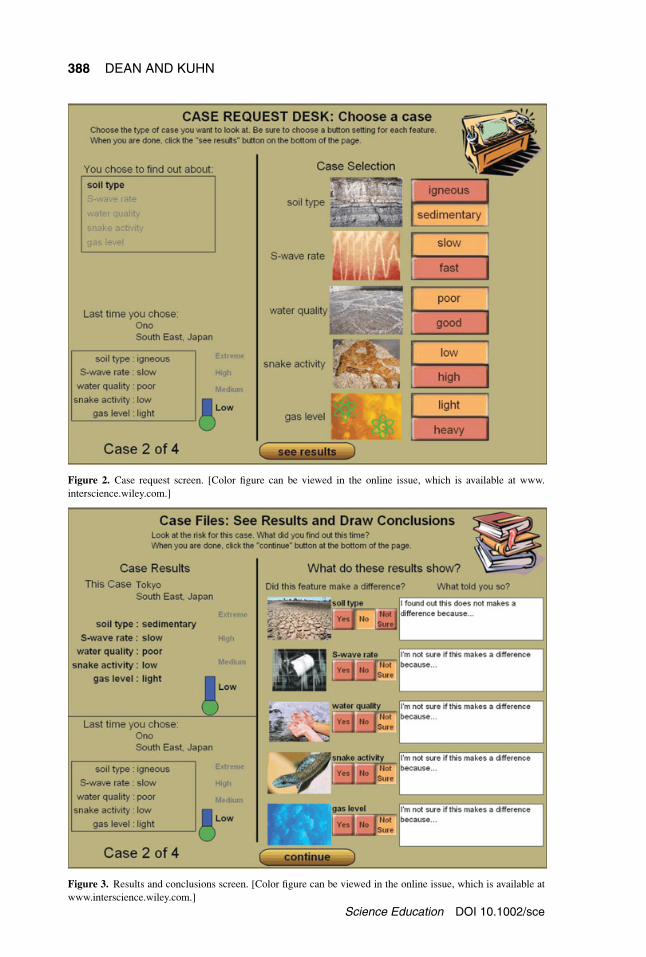
three are structurally identical and differ only in content. Each introduces five potentialvariables that may affect an outcome and asks the student to investigate and determinewhich do and which do not affect outcome. In each version, two of the five variables haveno effect and the other three have additive (noninteractive) effects on outcome. Figures 1–3show the main screens for earthquake forecaster. As each screen is displayed, a voiceoverpresents the identical text orally, thus eliminating any challenge that reading the text mayhave posed for any of the participants while at the same time accommodating those whoprefer the visual mode.
Introductory screens describe the importance of identifying earthquake risk and explainthe student’s task as junior earthquake forecaster. The first interactive screen (Figure 1)asks students to identify the goal of their first investigation. The next (Figure 2) asks themto select a particular instance for examination. The next (Figure 3) presents the outcomeassociated with this instance and asks the student to draw conclusions (makes a difference,doesn’t make a difference, or don’t know, for each variable). A final screen (not shown here)offers the opportunity to make notes in an electronic notebook. The cycle then repeats fourtimes, giving the student the opportunity to examine four instances and draw conclusionsregarding each variable after each one. In the second through fourth iterations of the cycle,the results for the preceding cycle remain displayed (as shown in Figure 3).
To execute the task effectively, a student must access and compare two instances thatdiffer with respect to the levels of only a single variable, in order to assess the effect of thatvariable, and then must draw the appropriate conclusion (based on whether the manipulationis associated with a change in the outcome variable). This procedure must be repeated toidentify the causal or noncausal status of each of the variables.
Figure 1. Find out screen. [Color figure can be viewed in the online issue, which is available at www.interscience.wiley.com.]
Science Education DOI 10.1002/sce
388 DEAN AND KUHN
Figure 2. Case request screen. [Color figure can be viewed in the online issue, which is available at www.interscience.wiley.com.]
Figure 3. Results and conclusions screen. [Color figure can be viewed in the online issue, which is available atwww.interscience.wiley.com.]
Science Education DOI 10.1002/sce
DIRECT INSTRUCTION VS. DISCOVERY 389
Pilot Assessment
Pilot assessment was undertaken during the spring of the year preceding the study toestablish the general skill level of students at this school with respect to the skills of interest.For this purpose, the EF task was administered individually to two classes of that year’sfourth graders (30 students) and one class of sixth graders (19 students). None of thesestudents participated in the present study, which was conducted with fourth graders thefollowing school year.
In their work on the EF task, none of these pilot fourth graders ever displayed the control-of-variables strategy, and two sixth graders displayed it. Neither of the sixth graders, how-ever, followed his controlled comparisons of two instances with an appropriate inference.On this basis, it was concluded that fourth graders from this population show no com-petence in this strategy, and individual pretest assessment of the study participants wasdeemed unnecessary.
Procedure
Introductory and Direct-Instruction Session. Students in all conditions participated inan introductory session. Its purpose was to introduce the activity to all groups and in additionto present the direct instruction to those groups receiving it (DI and DI/PR groups). Theinstruction was modeled after that used by Klahr and Nigam (2004), except for the contentwhich was mail-order music catalogs, chosen to be familiar and of interest to students. Allgroups underwent the introductory and postinstruction phases of this introductory session,to ensure group equivalence except for the direct instruction. Only the DI and DI/PR groupsunderwent the instruction phase. The session lasted approximately 45 minutes for each ofthese two groups and 35 minutes for the PR group since the direct instruction phase wasomitted in their case.
Introduction (All Groups). The researcher introduced mock-ups of types of catalogs itwas explained a CD company was contemplating using to advertise. The catalogs variedon four dimensions: format (booklet or foldout), color (multi or single), illustration (artistphotos or CD covers), and number of CDs displayed (few or many). The student workedwith a set of the 16 possible catalogs (actual physical mock-ups of the different kinds ofcatalogs). The student was asked to identify possible comparisons that would help to find outwhether features made a difference or made no difference to catalog sales. It was indicatedthat sales records for each catalog were available, but no records were actually shown.Students were first asked to identify one comparison (pair of catalogs), and then a secondcomparison, to find out if one of the features (format) made a difference. The procedure wasthen repeated for a second feature (color), yielding a total of four comparisons constructedby each student.
Direct Instruction (DI and DI/PR Groups Only). Again following Klahr and Nigam(2004), the researcher then introduced a series of four comparisons and commented onthem as follows:
Comparison 1 (confounded—format and color both varied). Is this a good compar-ison? No. Let me tell you why. This is a bad comparison because Pat changed bothfeatures. If you change both features in a comparison you can’t tell which one makesa difference.
Science Education DOI 10.1002/sce

390 DEAN AND KUHN
Comparison 2 (unconfounded—only format varied). Is this a good comparison? Yes.Let me tell you why. This is a good comparison because Pat only changed one featurein the comparison so Pat can be sure that it’s that feature that made the difference.Comparison 3 (unconfounded—only color varied). Same instruction as comparison2.Comparison 4 (confounded—format and color both varied). Same instruction ascomparison 1.
Postinstruction Assessment (All Groups). The procedure was identical to that of theintroductory phase, except that students were first asked to investigate a new feature (numberof CDs) and then one of the features (color) that they had previously investigated.
Practice Sessions. These sessions, extending over multiple weeks, allowed students inthe PR and DI/PR conditions opportunity to construct the control-of-variables strategyover time (or, in the case of DI/PR students, if they were able to do so, to apply andconsolidate the direct instruction they had received at the initial session as they worked onthese problems).
Practice-Only (PR) Condition. The initial practice session took place the following weekand began with an introduction to the first computer program (OV) students would use. Itwas explained that if they investigated very carefully, they would be able to find out whichfeatures make a difference to outcome and which do not. It was also emphasized that whatthey find out may be different from what they think now might make a difference. Theywere also told:
Even if you think that you have it all figured out, we’re going to ask you to keep workingon the problems and checking your conclusions a little longer to be absolutely sure, sincesometimes peoples’ conclusions change as they keep investigating. You want to be able toshow others how you know what you’re claiming is correct. It’s going to take you morethan one class period to figure everything out, so you’ll have more chances after today tocontinue your investigation.
Finally, students were told that they would work in pairs and that they needed to dis-cuss with their partner and make sure both partners were in agreement before they madeany choices or decisions. Before pairs began working independently, the teacher used anaudio/video projector to take the group as a whole through one cycle of the program, makingsure they understood what to do at each point in the cycle.
Students worked on the OV task for a total of 12 sessions, at a frequency of once or twiceper week (depending on the school schedule), over a total period of 10 weeks. In subsequentsessions, the teacher reminded students of the preceding information as necessary but theneed for instruction became minimal and was phased out over the next few sessions. Asadditional practice, at the fifth session, and again at the ninth and eleventh sessions, a“claim sheet” was introduced, asking the pair of students to make a claim of causality ornoncausality (“makes a difference” or “doesn’t make a difference”) about a feature and toindicate what evidence they had to show their claim was correct.
DI and DI/PR Conditions. The practice sessions for the DI/PR group were identical tothose just described for the PR group. The DI group received their regular classroom scienceinstruction in lieu of any practice sessions.
Science Education DOI 10.1002/sce

DIRECT INSTRUCTION VS. DISCOVERY 391
Assessment and Maintenance Sessions
Following the 10-week period just described, the procedure from this point was identicalfor all three groups, except that the DI group did not participate in the maintenance phasedescribed below.
First Posttest Assessment (Familiar Content). The first posttest assessment occurredthe week after the PR and DI/PR groups had completed 12 OV practice sessions. All studentswere assessed individually. The student was asked to demonstrate using the OV program“how to find out whether a feature makes a difference or doesn’t make a difference.” If astudent indicated she or he already knew the effect of all features, the student was asked toimagine that another student disagreed and to demonstrate how it could be demonstratedto that student that the feature does or does not make a difference.
Transfer Assessment (Unfamiliar Content). During this same week, students in allgroups were assessed individually using a new task identical in structure but differing incontent (EF). Procedure was identical to that for the preceding assessment.
Maintenance Sessions (PR and DI/PR Groups Only). To consolidate and help ensurethat skills attained during the practice sessions would be maintained, beginning the nextweek PR and DI/PR groups engaged in additional practice, once per week for 5 weeks,working with the EF task. The procedure was identical to that used in the earlier practicesessions.
Delayed Posttest Assessment (Familiar Content). During the next week, all studentsunderwent individual assessment with the EF task. The procedure was identical to that usedin the first two posttest assessments.
Delayed Transfer Assessment (Unfamiliar Content). During this same week, all stu-dents underwent individual assessment with a new task (AH). The procedure was identicalto that used in previous assessments.
RESULTS
Immediate Effects of Direct Instruction
Before conducting the main analyses, we wished to confirm that the direct instructionhad been successful in producing the anticipated learning. Accordingly, we conductedan analysis of performance at the initial instruction session itself. Consistent with thefindings of microgenetic research (Kuhn, 1995; Siegler, 2006), students did not performconsistently across the four comparisons that constituted the postinstruction assessmentat this initial session; most showed a mixture of correct (unconfounded) and incorrect(confounded) comparisons. The two DI groups were combined for analysis, since theirexperience had not differed at this point. For the 29 students receiving DI, the mean numberof correct (unconfounded) comparisons constructed was 1.76 (SD = 1.13), of a possible 4.In contrast, the mean for those in the PR condition was 1.00 (SD = 0.66).1 This differencewas significant, t(42) = 2.25, p = .030, indicating the instruction had an effect.
1Because no justifications were required, some of these comparisons could have been unconfounded bychance and do not necessarily represent true competence.
Science Education DOI 10.1002/sce

392 DEAN AND KUHN
0.00
0.20
0.40
0.60
0.80
1.00
1.20
1.40
1.60
Immediateposttest (OV):
Week 11
Immediatetransfer (EF):
Week 11
Delayedposttest (EF):
Week 17
Delayedtransfer (AH):
Week 17
Mea
n nu
mbe
r of
inst
ance
s(V
alid
str
ateg
y +
infe
renc
e)
DI+PRPR-onlyDI-only
Figure 4. Means for valid strategy + inference by group. Maximum score = 3. [Color figure can be viewed inthe online issue, which is available at www.interscience.wiley.com.]
Performance of Groups Over Time
Strategy and Inference. In analyses of the four main assessments indicated above, andagain following Klahr and Nigam (2004) as closely as possible, we considered studentsto have demonstrated mastery of the control of variables strategy if they compared twoinstances that differed with respect to a single variable and then drew an appropriateinference with respect to the varied variable (thereby confirming that selection of the twounconfounded instances had not been by chance). At each of the four assessments describedabove, the number of such correct comparison–inference sequences (of a possible 3)executed by a student was identified. (No comparisons were possible following the firstof the four instances examined because only one instance was available.) Means acrossstudents for each of the four assessments are shown in Figure 4.
Because we had multiple objectives in examining these data, we followed the recom-mendation of a statistical specialist and conducted an overall ANOVA to establish thatexperimental condition had a significant effect, as well as two specific comparisons toidentify the effects of the variables of theoretical interest, DI and time.
Repeated measures ANOVA of the data shown in Figure 4 yielded a main effect forgroup, F (2, 41) = 4.74, p = .014, a main effect for assessment occasion, F (3, 123) = 2.85,p = .040, and also a significant interaction between them, F (6, 123) = 2.72, p = .016.A comparison of the DI group (M = 0.53), against the two practice groups (M = 1.16for the DI/PR group and 0.93 for the PR group), was also significant, F (1, 41) = 11.34,p < .05 (although the two PR groups did not differ significantly from one another).Also significant was a contrast between the two initial and two delayed assessments, withcorrect explanations more frequent at the delayed assessments as reflected in Figure 4, F (1,41) = 6.09, p < .05.
Explanation. Each of the three assessment tasks required students to explain the basisfor each inference made. Regarded as adequate explanations for indeterminacy inferences(those not asserting a definite conclusion) were those that referred to the evidence that hadbeen generated and indicated it was insufficient to allow an inference (e.g., “I haven’t found
Science Education DOI 10.1002/sce
DIRECT INSTRUCTION VS. DISCOVERY 393
out yet”). Regarded as adequate explanations for determinant inferences (the feature makesa difference or does not make a difference) were explanations that referred to evidencethat had been generated and that was sufficient to support the inference. Such explanationswere counted as correct only if they accompanied a valid (nonconfounded) comparison andappropriate determinant inference.
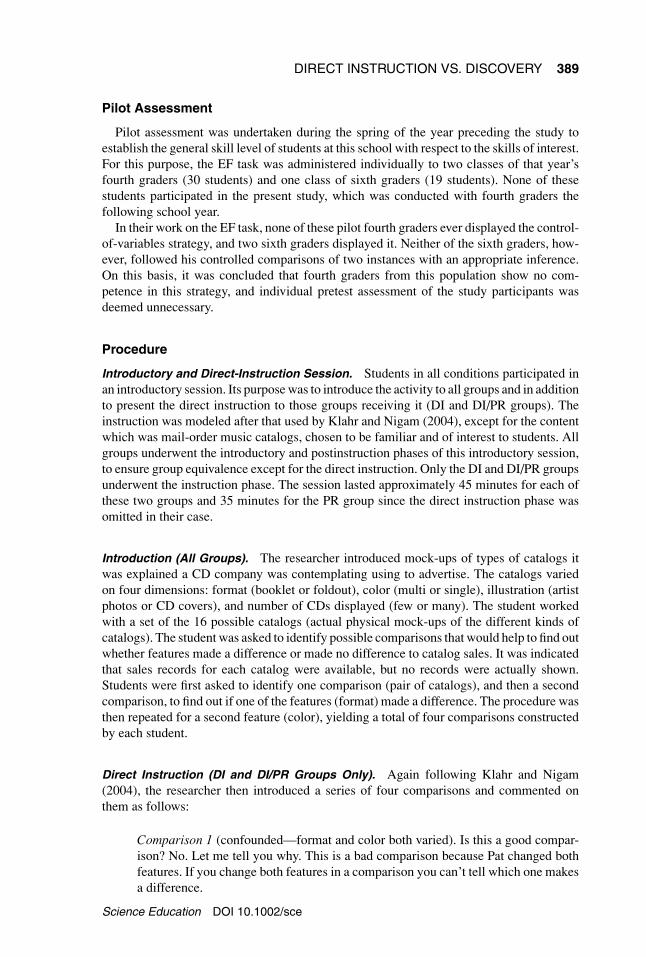
The number of correct explanations (of a possible 20, the maximum number of inferencesthe student had an opportunity to make given four instances, each involving five variables)was identified for each participant at each assessment. Means across participants for eachof the four assessments are shown in Figure 5. Repeated measures ANOVA yielded nosignificant effects for group or for assessment occasion. However, the interaction of groupand assessment type was significant, F (6, 123) = 2.40, p = .031, The contrast betweenthe two immediate and two delayed assessments was significant, with correct explanationsmore frequent at the delayed assessments as reflected in Figure 5, F (1, 41) = 5.54, p < .05.The contrast between the DI group (M = 5.20) and the two practice groups (means = 7.38for the DI/PR group and 8.82 for the PR group), however, did not reach significance.
Patterns of Performance Across Time and Tasks. The patterns in Figures 4 and 5do not tell the complete story of performance over time, as they do not indicate howmany individuals contributed to successful group performance. Given the means were farfrom ceiling, they could reflect the very high achievement of a few or the more modestachievement of a larger number. For this reason, we also examined results in the formseen in Figure 6, which shows the proportion of students in each group who showedmastery a majority of the time (two of three possible instances of valid strategy followedby appropriate inference). We also identified the proportion of students in each group whoever showed the correct strategy–inference sequence (not shown); these proportions wereof course higher (mostly in the range of 60%–75%), but the patterns across groups weresimilar and hence this figure is omitted. We also identified the proportions by group whoshowed the correct strategy–inference–explanation sequence a majority of the time. Withthe added criterion of correct explanation, these proportions are lower (mostly in the rangeof 10%–30%) but again are not shown as the pattern was similar.
It is Figure 4, in conjunction with Figure 6, that tells the clearest story. The DI/PR group,we see, shows an initial advantage, one that is not matched by the group who received
0.00
2.00
4.00
6.00
8.00
10.00
12.00
14.00
16.00
Immediateposttest (OV):
Week 11
Immediatetransfer (EF):
Week 11
Delayedposttest (EF):
Week 17
Delayedtransfer (AH):
Week 17
Mea
n nu
mbe
r of
cor
rect
exp
lana
tion
s
DI+PR
PR-only
DI-only
Figure 5. Means for explanation by group. Maximum score = 20. [Color figure can be viewed in the online issue,which is available at www.interscience.wiley.com.]
Science Education DOI 10.1002/sce

394 DEAN AND KUHN
0
10
20
30
40
50
60
70
80
90
100
Immediateposttest (OV):
Week 11
Immediatetransfer (EF):
Week 11
Delayedposttest (EF):
Week 17
Delayedtransfer (AH):
Week 17
Pro
port
ions
of
stud
ents
wit
h 2–
3 in
stan
ces
DI+PRPR-onlyDI-only
Figure 6. Proportions of successful students by group and time. [Color figure can be viewed in the online issue,which is available at www.interscience.wiley.com.]
only DI without the additional benefit of PR. This high level of performance, however,is not maintained with additional time, dropping sharply at the third assessment althoughrecovering to a good extent when the final new task is introduced.
The DI group, in contrast, shows negligible effect of the instruction by the time of theinitial assessment (at 11 weeks). This group improves steadily, although modestly, over timeand assessments, an effect that may be attributable to the practice effect of the assessmentsthemselves.
The PR group also improves steadily. At the first assessment, hardly any students in thisgroup have consolidated use of the new strategy (Figure 6), but the additional practice ona different new task between second and third assessments enables nearly half of them todo so.
Performance on a new task at the end of an extended time interval (fourth assessment)might be regarded as the most significant measure of students’ ultimate gains. Here theresults are clear. The two practice groups, with or without direct instruction, do better thanthe DI-only group.
DISCUSSION
The present results replicate Klahr and Nigam’s (2004) finding that among children ofthis age, brief direct instruction is capable of producing a significant level of correct perfor-mance with respect to the control of variables strategy, immediately following instruction.Examined over a longer time frame, however, our results indicate that direct instructionis neither necessary nor sufficient to accomplish this goal. Klahr and Nigam’s study, note,does not speak to the issue of maintenance over time, nor does it directly address transfer,since the target strategy is not specifically assessed in their transfer assessment.2 In thepresent study, in contrast, we examine transfer of the specific strategy under considerationacross multiple parallel versions of the task over an extended time period.
2Earlier studies by Klahr and associates, e.g., Chen and Klahr (1999), similarly have limitations withrespect to their demonstration of transfer and/or maintenance. For further discussion, see Kuhn and Dean(2005), Kuhn and Franklin (2006), and Zimmerman (2006).
Science Education DOI 10.1002/sce

DIRECT INSTRUCTION VS. DISCOVERY 395
The trends reflected in Figure 4 are informative in several respects. At the initial as-sessment, some 11 weeks after the direct instruction session, the instruction still shows aneffect, but only when it is combined with regular practice (DI/PR group). DI without thispractice is not sufficient to sustain, after 12 weeks or longer, a result any better than whatcan be achieved without it, merely through engagement, or practice. This practice, with orwithout DI, appears sufficient to produce at least as strong, if not stronger, performance.DI is not a necessary component.
Such practice, however, does not achieve its maximum effect after 12 sessions workingwith a single problem. The new content introduced at the second assessment shows somesuggestion of reinvigorating the engagement of the PR group, some of whom we suspectedmay have developed habitual modes of response to the first task toward the end of the 12sessions they worked on it. Further advance is seen, however, after they had the opportunityfor sustained engagement with a different problem (third assessment). At this point, theinitial advantage shown by the DI/PR group drops off sharply and the PR group in factshows a higher level of performance, although by the fourth assessment, with new content,performance of the DI/PR and PR groups is identical with respect to both strategy–inference(Figure 4) and explanation (Figure 5). DI, then, has yielded no long-term advantage. Themodest improvement over time shown by the DI group suggests that, rather than DI, it is theengagement with the assessment tasks that functions as a form of practice that contributesto improvement of performance, possibly along with any natural mental development thatmight occur over this 6-month period.
The present study, note, does not purport to demonstrate the merits of engagement/practicemethods, compared to direct instruction, with regard to efficiency of instruction. Our in-terest is not in establishing how fast the strategic understanding examined here can beacquired, but rather how well it can be acquired. Students in the two practice conditionsspent much greater “time on task” than those in the direct instruction condition. Giventhis practice led to significant and lasting gains in strategic understanding for the majorityof students, do we then need to ask whether these gains could not be accomplished morequickly, with less student time devoted to their accomplishment? If so, does the time savedwarrant the introduction of direct instruction that would not be necessary if more time weretaken? Given the centrality of scientific investigation to the epistemology of science (not tomention to the U.S. science education standards), we do not see the student time devotedto attaining and consolidating this strategic and metastrategic understanding as needingto be minimized. Indeed, Klahr and Nigam’s adoption of the experimental psychologist’sfocus on efficiency of instruction departs significantly from the perspectives of those in thefield of science education concerned with the teaching of science process skills (Duschl &Grandy, 2005; Metz, 2004; Reiser, 2004; Sandoval, 2005: White & Frederiksen, 2005).
All of the conclusions drawn here of course hold only for the specific age group inves-tigated. Older or younger students could exhibit different effects of the various forms ofintervention we have examined, and replication of the kinds of comparisons undertakenhere is necessary to determine whether this is the case. Yet, the specific competency ex-amined here is highlighted as a core component of the scientific inquiry skills that are nowmandated in virtually all state and national science education standards by the fourth grade(National Research Council, 1996). How mastery of these skills is best achieved at thisparticular age level is thus a matter having enormous implications for current educationalpolicy and practice.
In this context of educational implications, a final point to be noted is that our resultssuggest that such competency remains fragile at this age level. Our own and others’ exten-sive work with this age group shows negligible spontaneously emerging competence at thisage, even among academically able children, a finding corroborated in the pilot assessment
Science Education DOI 10.1002/sce

396 DEAN AND KUHN
reported here. Despite the extensive practice fourth graders in the present study underwent,some of them still showed minimal to no indication of proficiency. Moreover, even amongthose who did show indications of having attained proficiency, the norm remains a mixtureof usage of correct and incorrect strategies. Thus, both interindividual and intraindividualvariability are the norm—a result consistent with the microgenetic literature on repeatedengagement with the same or similar tasks (Kuhn, 1995; Kuhn & Franklin, 2006; Siegler,2006; Siegler & Crowley, 1991). This pattern further supports our claim that a single in-struction session is insufficient to produce the desired mastery. Although we have focusedon only one key component of scientific inquiry here, development of the desired compe-tence has a variety of interconnected components, as we have argued elsewhere (Kuhn &Dean, 2005), and does not occur overnight. In terms of both scope and time frame, itwould appear to be a gradual and extended acquisition process that researchers hoping tocontribute to educational practice should seek to understand.
The research reported here is drawn from a dissertation presented by the first author to the secondauthor in partial fulfillment of the requirements for a Ph.D. degree at Teachers College, ColumbiaUniversity. The authors would like to thank the students and teachers who participated in this work:Erica Chutuape, Jenny Lander, Mari McGrath, Nani Pease, and Nava Silton for assisting in datacollection; Daniel Rubin for programming the data extraction program; Jane Monroe for statisticaladvice; and Jared Katz for programming the intervention task and assisting with the analysis. Theauthors would also like to thank the anonymous reviewers for helpful comments on earlier versionsof the manuscript.
REFERENCES
Chen, Z., & Klahr, D. (1999). All other things being equal: Children’s acquisition of the control of variablesstrategy. Child Development, 70(5), 1098 – 1120.
Duschl, R., & Grandy, R. (2005). Reconsidering the character and role of inquiry in school science: Framing thedebates. Unpublished manuscript, Rice University, Houston, TX.
Kirschner, P., Sweller, J., & Clark, R. (2006). Why minimal guidance during instruction does not work: An analysisof the failure of constructivist discovery, problem-based, experiential, and inquiry-based teaching. EducationalPsychologist, 41, 75 – 86.
Klahr, D., & Nigam, M. (2004). The equivalence of learning paths in early science instruction: Effects of directinstruction and discovery learning. Psychological Science, 15, 661 – 667.
Kuhn, D. (1995). Microgenetic study of change: What has it told us? Psychological Science, 6, 133 – 139.Kuhn, D. (2001). Why development does (and doesn’t) occur: Evidence from the domain of inductive reasoning. In
R. Siegler & J. McClelland (Eds.), Mechanisms of cognitive development: Neural and behavioral perspectives.Mahwah, NJ: Erlbaum.
Kuhn, D., & Dean, D. (2005). Is developing scientific thinking all about learning to control variables? PsychologicalScience, 16, 866 – 870.
Kuhn, D., & Franklin, S. (2006). The second decade: What develops (and how)? In W. Damon & R. Lerner (SeriesEds.), D. Kuhn & R. Siegler (Vol. Eds.), Handbook of child psychology: Vol. 2. Cognition, perception, andlanguage (6th ed.). Hoboken, NJ: Wiley.
Mayer, R. E. (2004). Should there be a three-strikes rule against pure discovery learning? American Psychologist,59, 14 – 19.
Metz, K. (2004). Children’s understanding of scientific inquiry: Their conceptualization of uncertainty in investi-gations of their own design. Cognition and Instruction, 22, 219 – 290.
National Research Council (1996). The National Science Education Standards. Washington DC: NationalAcademy Press.
Reiser, B. (2004). Scaffolding complex learning: The mechanisms of structuring and problematizing student work.Journal of the Learning Sciences, 13, 273 – 304.
Rittle-Johnson, B. (2006). Promoting transfer: Effects of self-explanation and direct instruction. ChildDevelopment, 77, 1 – 15.
Sandoval, W. (2005). Understanding students’ practical epistemologies and their influence. Science Education,89, 634 – 656.
Science Education DOI 10.1002/sce

DIRECT INSTRUCTION VS. DISCOVERY 397
Siegler, R. (2006). Microgenetic studies of learning. In W. Damon & R. Lerner (Series Eds.), D. Kuhn & R.Siegler (Eds.), Handbook of child psychology: Vol. 2. Cognition, perception, and language (6th ed.). Hoboken,NJ: Wiley.
Siegler, R., & Crowley, K. (1991). The microgenetic method: A direct means for studying cognitive development.American Psychologist, 46(6), 606 – 620.
White, B., & Frederiksen, J. (2005). A theoretical framework and approach for fostering metacognitive develop-ment. Educational Psychologist, 40, 211 – 223.
Zimmerman, C. (2006). The development of scientific reasoning skills: What psychologists contribute to an un-derstanding of elementary science learning. Final draft of a report to the National Research Council Committeeon Science Learning Kindergarten through Eighth Grade. Washington, DC: National Research Council.
Science Education DOI 10.1002/sce