direct comparison of traditional elisas and membrane protein arrays for detection and quantification...
TRANSCRIPT
www.elsevier.com/locate/jim
Journal of Immunological Methods 284 (2004) 99–106
Direct comparison of traditional ELISAs and membrane protein
arrays for detection and quantification of human cytokines
S. Copeland, J. Siddiqui, D. Remick*
Department of Pathology, University of Michigan Medical School, M2210 Med. Sci. I, 1301 Catherine Road, Ann Arbor, MI 48109-0602, USA
Received 22 July 2003; received in revised form 14 October 2003; accepted 14 October 2003
Abstract
Many labs wish to measure cytokines in an accurate, reproducible, and rapid manner. An antibody-based membrane array
for measuring cytokines has been developed based on the same technology as the traditional ELISA. The aim of this study was
to compare results obtained with the traditional ELISA method with those from the membrane array technology, a form of low-
cost proteomics. Diluted human whole blood was stimulated with live bacteria (Escherichia coli, or Staphylococous aureus), or
LPS and cytokines were measured both by ELISA and the membrane protein array. Of the 16 cytokines measured via ELISA,
only IFN-g was below detection level. The other 15 cytokines were present in concentrations up to several thousand picograms/
ml. Of the 20 cytokines measured via membrane protein array, only 3 could be detected (IL-6, IL-8 and MIP-1h). Additionally,the membrane protein array did not detect TNF-a from the LPS-stimulated blood. These results indicate that the low-cost
membrane protein array may lack sufficient sensitivity to adequately detect cytokines levels in complex biological fluids such as
human plasma.
D 2003 Elsevier B.V. All rights reserved.
Keywords: Blood; Proteomics; Inflammation; Multiplex assay
1. Introduction bound proteins are subsequently detected and quanti-
With the advent of genomic profiling, the improve-
ments in protein detection have been driven to decode
unknown relationships between disease patterns and
protein profiles. One of the frontiers for profiling lies
in the development of low-cost proteomics, including
protein-detecting micorarrays. Typically, a protein-
detecting microarray consists of numerous affinity
reagents arrayed on a solid surface. A complex mixture
of proteins binds to its specific target protein, and those
0022-1759/$ - see front matter D 2003 Elsevier B.V. All rights reserved.
doi:10.1016/j.jim.2003.10.011
* Corresponding author. Tel.: +1-734-763-6454; fax: +1-734-
763-6476.
E-mail address: [email protected] (D. Remick).
fied (MacBeath, 2002). These micorarrays may be
used to detect multiple low-abundance proteins from
one sample, such as cytokines. However, the measure-
ment of low abundance proteins is often fraught with
problems such as the high cost of dedicated equipment
and the specificity of the affinity reagents (MacBeath,
2002). Furthermore, there has not been the develop-
ment of a high-throughput technology for isolation of
highly specific protein ligands, lending to difficulty in
the ability to distinguish between different forms of the
same protein (Cahill, 2001). Additional problems exist
with analysis of conventional proteomic approaches,
which employ two-dimensional polyacrylamide gel
electrophoresis coupled with mass spectrometry;
S. Copeland et al. / Journal of Immunological Methods 284 (2004) 99–106100
therefore, absolute quantitation is difficult (Kodadek,
2001). In this technology-driven atmosphere for
change, new technologies have attempted to overcome
these limitations.
Recently, Schweitzer et al. (2002) described cou-
pling of isothermal rolling-circle amplification (RCA)
to antibodies for the simultaneous detection of 75
cytokines. RCA has allowed the development of highly
sensitive and multiplexed microarrays. Through the
RCA-amplified signals located on the microarrayed
spot, detection of protein can be seen at the zeptomolar
concentration (Schweitzer et al., 2002). In this appli-
cation, supernatants from human dendritic cells ex-
posed to LPS and/or TNFa were analyzed via RCA.
Results, confirmed through standard ELISA, revealed
LPS and TNF-a-induced 16 and 12 cytokines, respec-
tively (Schweitzer et al., 2002). However, the sophis-
ticated technology required to develop the RCA limits
its broad application, and this restriction has led to the
development of alternative, less expensive methods for
quantitation. Onemethod for human cytokine detection
was reported by Huang et al. (2001). This technology
employs a microspotted nitrocellulose membrane-
based array developed using enhanced chemilumines-
cence (Huang et al., 2001). This type of antibody-based
membrane array is based on the same type of technol-
ogy as the conventional ELISA. The antibody-spotted
membranes are incubated with biological samples, and
the bound proteins are recognized by biotin-conjugated
antibodies (Huang et al., 2001). RayBiok Human
Cytokine Array, the first membrane-based human cy-
tokine protein array commercially available, proposed
to have the ability to identify protein expression pro-
files on spotted arrays. However, there are no definitive
results correlating this form of low-cost proteomics
with the conventional method for measuring human
cytokines. Therefore, the aim of this study was to
compare the traditional ELISA method with the
RayBiok Human Cytokine Array for analysis of
cytokine production in stimulated human whole blood.
2. Materials and methods
2.1. Basic experimental design
Whole blood (10 ml) was collected from five
normal human volunteers. Results from donor four
were excluded from all statistical analyses due to
abnormally high baseline cytokine concentrations
(i.e. before any stimulation). Blood was drawn and
anticoagulated with 10 Al/ml heparin, and diluted
1:3 with Dulbecco’s modified Eagle’s medium
(DMEM; Bio-Whittaker, Walkersville, MD), for a
total volume of 12 ml. An initial sample (3 ml) of
unstimulated blood was collected for the Time 0
(T0) cytokine measurements. The experimental
groups consisted of the following: 1�107 colony-
forming units (CFUs) of Methicillin-resistant Staph-
ylococcus aureus (MRSA), 2� 107 CFUs of Escher-
ichia coli, 3� 10 ng/ml lipopolysaccharide (LPS), 4.
100 Al DMEM. Based on extensive and successful
therapeutic use of the antibiotic imipenem in a sepsis
mouse model, it was included in the preparation of
all whole blood stimulations. Imipenem is bacteri-
cidal resulting in the inhibition of cell wall synthesis
(Balfour et al., 1996). Imipenem has in vitro activity
against a wide range of Gram-positive and Gram-
negative organisms (Balfour et al., 1996).
2.2. Bacteria and antibiotics
2.2.1. Methicillin-resistant S. aureus (MRSA)
The initial isolate was obtained from a patient at
the University of Michigan. Organisms were stored
at � 20 jC and prior to use were subcultured on
blood agar plates. One colony was suspended in 3
ml of LB broth base (Gibco, Life Technologies,
Rockville, MD) and the suspension was incubated
for 16 h at 37 jC. Bacteria were quantitated via
spectrophotometry using the 0.5 McFarland Stan-
dard (an absorbance of 0.075 at 670 nm= 1.5� 108
CFU/ml).
2.2.2. E. coli (ATCC strain 25922)
The organisms were stored at � 20 jC and prior
to use were subcultured on blood agar plates. One
colony was suspended in 3 ml of LB broth base
(Gibco, Life Technologies) and the suspension was
incubated for 16 h at 37 jC. Bacteria were quanti-
tated via spectrophotometry using the 0.5 McFarland
Standard.
2.2.3. Imipenem
(PrimaxinR I.V., Merck) was diluted in sterile
saline for stock concentration of 10 Ag/ml. The final
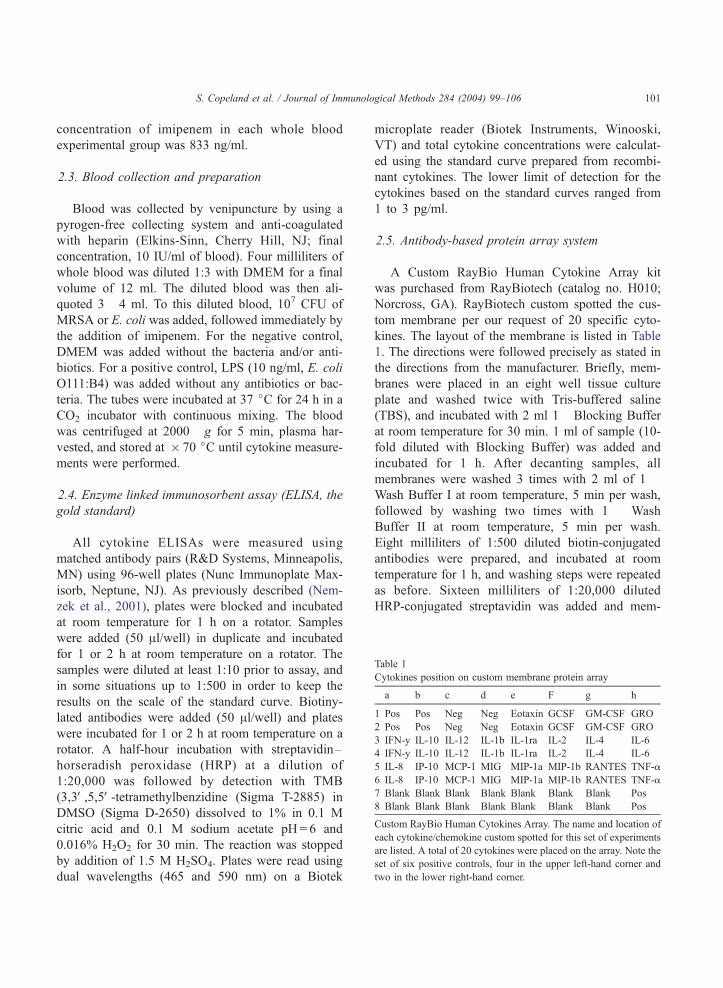
Table 1
Cytokines position on custom membrane protein array
a b c d e F g h
1 Pos Pos Neg Neg Eotaxin GCSF GM-CSF GRO
2 Pos Pos Neg Neg Eotaxin GCSF GM-CSF GRO
3 IFN-y IL-10 IL-12 IL-1b IL-1ra IL-2 IL-4 IL-6
4 IFN-y IL-10 IL-12 IL-1b IL-1ra IL-2 IL-4 IL-6
5 IL-8 IP-10 MCP-1 MIG MIP-1a MIP-1b RANTES TNF-a
6 IL-8 IP-10 MCP-1 MIG MIP-1a MIP-1b RANTES TNF-a
7 Blank Blank Blank Blank Blank Blank Blank Pos
8 Blank Blank Blank Blank Blank Blank Blank Pos
Custom RayBio Human Cytokines Array. The name and location of
each cytokine/chemokine custom spotted for this set of experiments
are listed. A total of 20 cytokines were placed on the array. Note the
set of six positive controls, four in the upper left-hand corner and
two in the lower right-hand corner.
S. Copeland et al. / Journal of Immunological Methods 284 (2004) 99–106 101
concentration of imipenem in each whole blood
experimental group was 833 ng/ml.
2.3. Blood collection and preparation
Blood was collected by venipuncture by using a
pyrogen-free collecting system and anti-coagulated
with heparin (Elkins-Sinn, Cherry Hill, NJ; final
concentration, 10 IU/ml of blood). Four milliliters of
whole blood was diluted 1:3 with DMEM for a final
volume of 12 ml. The diluted blood was then ali-
quoted 3� 4 ml. To this diluted blood, 107 CFU of
MRSA or E. coli was added, followed immediately by
the addition of imipenem. For the negative control,
DMEM was added without the bacteria and/or anti-
biotics. For a positive control, LPS (10 ng/ml, E. coli
O111:B4) was added without any antibiotics or bac-
teria. The tubes were incubated at 37 jC for 24 h in a
CO2 incubator with continuous mixing. The blood
was centrifuged at 2000� g for 5 min, plasma har-
vested, and stored at � 70 jC until cytokine measure-
ments were performed.
2.4. Enzyme linked immunosorbent assay (ELISA, the
gold standard)
All cytokine ELISAs were measured using
matched antibody pairs (R&D Systems, Minneapolis,
MN) using 96-well plates (Nunc Immunoplate Max-
isorb, Neptune, NJ). As previously described (Nem-
zek et al., 2001), plates were blocked and incubated
at room temperature for 1 h on a rotator. Samples
were added (50 Al/well) in duplicate and incubated
for 1 or 2 h at room temperature on a rotator. The
samples were diluted at least 1:10 prior to assay, and
in some situations up to 1:500 in order to keep the
results on the scale of the standard curve. Biotiny-
lated antibodies were added (50 Al/well) and plates
were incubated for 1 or 2 h at room temperature on a
rotator. A half-hour incubation with streptavidin–
horseradish peroxidase (HRP) at a dilution of
1:20,000 was followed by detection with TMB
(3,3V,5,5V-tetramethylbenzidine (Sigma T-2885) in
DMSO (Sigma D-2650) dissolved to 1% in 0.1 M
citric acid and 0.1 M sodium acetate pH= 6 and
0.016% H2O2 for 30 min. The reaction was stopped
by addition of 1.5 M H2SO4. Plates were read using
dual wavelengths (465 and 590 nm) on a Biotek
microplate reader (Biotek Instruments, Winooski,
VT) and total cytokine concentrations were calculat-
ed using the standard curve prepared from recombi-
nant cytokines. The lower limit of detection for the
cytokines based on the standard curves ranged from
1 to 3 pg/ml.
2.5. Antibody-based protein array system
A Custom RayBio Human Cytokine Array kit
was purchased from RayBiotech (catalog no. H010;
Norcross, GA). RayBiotech custom spotted the cus-
tom membrane per our request of 20 specific cyto-
kines. The layout of the membrane is listed in Table
1. The directions were followed precisely as stated in
the directions from the manufacturer. Briefly, mem-
branes were placed in an eight well tissue culture
plate and washed twice with Tris-buffered saline
(TBS), and incubated with 2 ml 1� Blocking Buffer
at room temperature for 30 min. 1 ml of sample (10-
fold diluted with Blocking Buffer) was added and
incubated for 1 h. After decanting samples, all
membranes were washed 3 times with 2 ml of 1�Wash Buffer I at room temperature, 5 min per wash,
followed by washing two times with 1� Wash
Buffer II at room temperature, 5 min per wash.
Eight milliliters of 1:500 diluted biotin-conjugated
antibodies were prepared, and incubated at room
temperature for 1 h, and washing steps were repeated
as before. Sixteen milliliters of 1:20,000 diluted
HRP-conjugated streptavidin was added and mem-
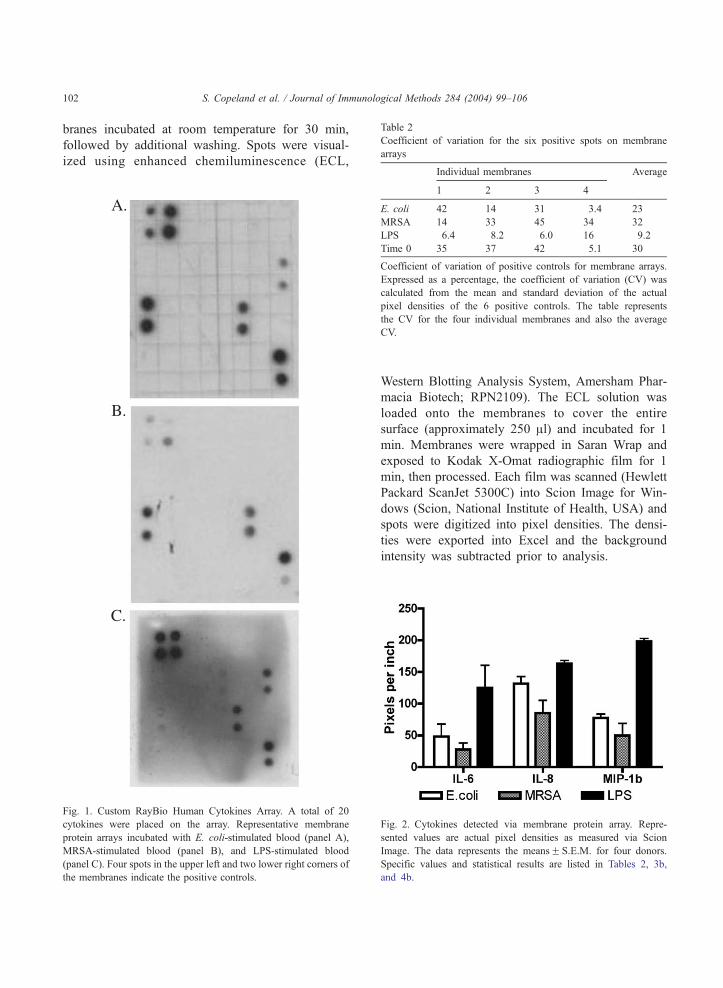
Table 2
Coefficient of variation for the six positive spots on membrane
arrays
S. Copeland et al. / Journal of Immunological Methods 284 (2004) 99–106102
branes incubated at room temperature for 30 min,
followed by additional washing. Spots were visual-
ized using enhanced chemiluminescence (ECL,
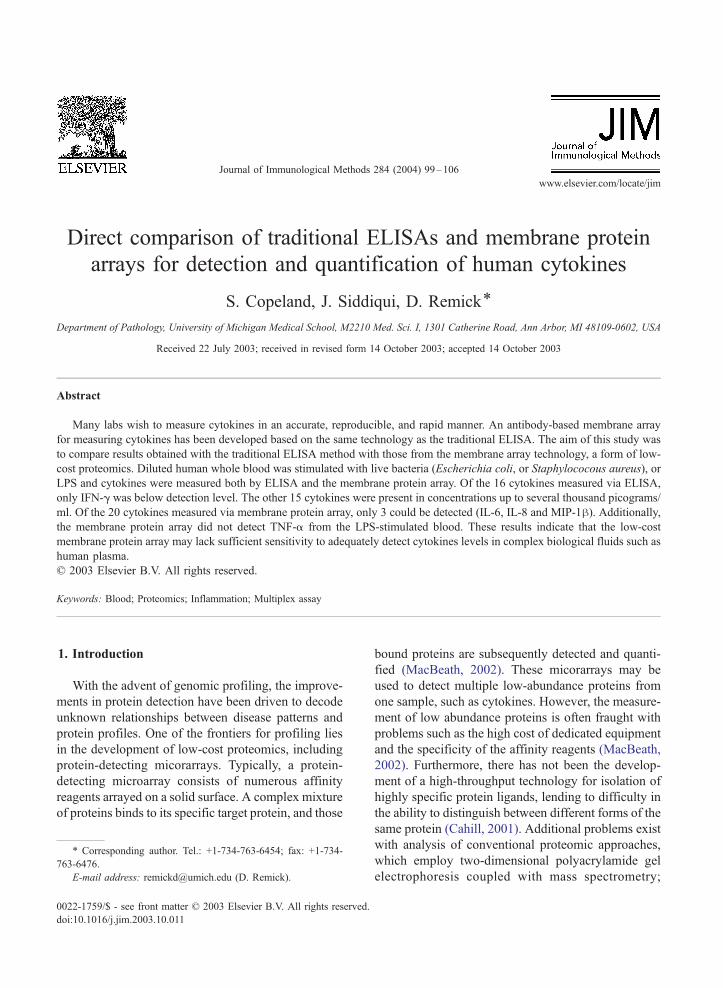
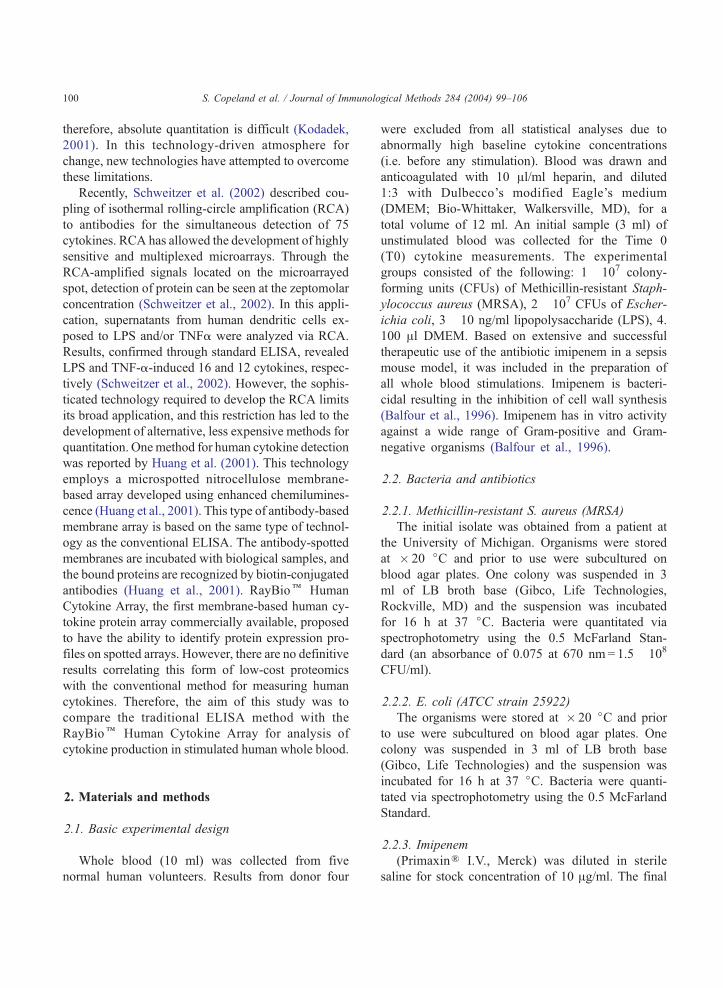
Fig. 1. Custom RayBio Human Cytokines Array. A total of 20
cytokines were placed on the array. Representative membrane
protein arrays incubated with E. coli-stimulated blood (panel A),
MRSA-stimulated blood (panel B), and LPS-stimulated blood
(panel C). Four spots in the upper left and two lower right corners of
the membranes indicate the positive controls.
Individual membranes Average
1 2 3 4
E. coli 42 14 31 3.4 23
MRSA 14 33 45 34 32
LPS 6.4 8.2 6.0 16 9.2
Time 0 35 37 42 5.1 30
Coefficient of variation of positive controls for membrane arrays.
Expressed as a percentage, the coefficient of variation (CV) was
calculated from the mean and standard deviation of the actual
pixel densities of the 6 positive controls. The table represents
the CV for the four individual membranes and also the average
CV.
Western Blotting Analysis System, Amersham Phar-
macia Biotech; RPN2109). The ECL solution was
loaded onto the membranes to cover the entire
surface (approximately 250 Al) and incubated for 1
min. Membranes were wrapped in Saran Wrap and
exposed to Kodak X-Omat radiographic film for 1
min, then processed. Each film was scanned (Hewlett
Packard ScanJet 5300C) into Scion Image for Win-
dows (Scion, National Institute of Health, USA) and
spots were digitized into pixel densities. The densi-
ties were exported into Excel and the background
intensity was subtracted prior to analysis.
Fig. 2. Cytokines detected via membrane protein array. Repre-
sented values are actual pixel densities as measured via Scion
Image. The data represents the meansF S.E.M. for four donors.
Specific values and statistical results are listed in Tables 2, 3b,
and 4b.
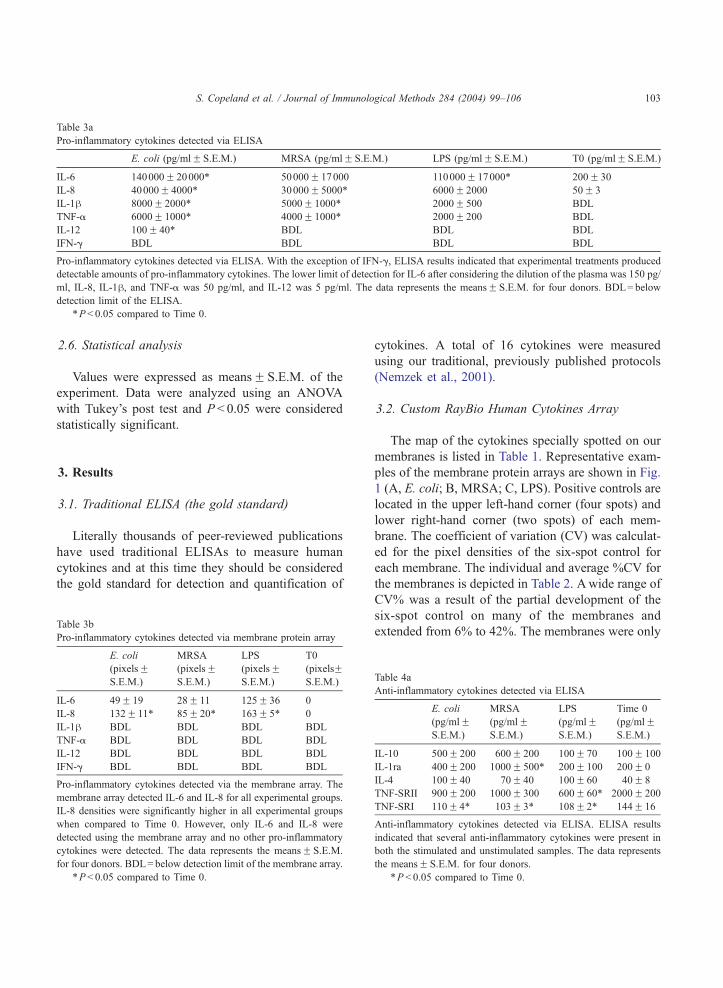
Table 3a
Pro-inflammatory cytokines detected via ELISA
E. coli (pg/mlF S.E.M.) MRSA (pg/mlF S.E.M.) LPS (pg/mlF S.E.M.) T0 (pg/mlF S.E.M.)
IL-6 140000F 20000* 50000F 17000 110000F 17000* 200F 30
IL-8 40000F 4000* 30000F 5000* 6000F 2000 50F 3
IL-1h 8000F 2000* 5000F 1000* 2000F 500 BDL
TNF-a 6000F 1000* 4000F 1000* 2000F 200 BDL
IL-12 100F 40* BDL BDL BDL
IFN-g BDL BDL BDL BDL
Pro-inflammatory cytokines detected via ELISA. With the exception of IFN-g, ELISA results indicated that experimental treatments produced
detectable amounts of pro-inflammatory cytokines. The lower limit of detection for IL-6 after considering the dilution of the plasma was 150 pg/
ml, IL-8, IL-1h, and TNF-a was 50 pg/ml, and IL-12 was 5 pg/ml. The data represents the meansF S.E.M. for four donors. BDL= below
detection limit of the ELISA.
S. Copeland et al. / Journal of Immunological Methods 284 (2004) 99–106 103
2.6. Statistical analysis
Values were expressed as meansF S.E.M. of the
experiment. Data were analyzed using an ANOVA
with Tukey’s post test and P < 0.05 were considered
statistically significant.
*P< 0.05 compared to Time 0.
3. Results
3.1. Traditional ELISA (the gold standard)
Literally thousands of peer-reviewed publications
have used traditional ELISAs to measure human
cytokines and at this time they should be considered
the gold standard for detection and quantification of
Table 3b
Pro-inflammatory cytokines detected via membrane protein array
E. coli
(pixelsFS.E.M.)
MRSA
(pixelsFS.E.M.)
LPS
(pixelsFS.E.M.)
T0
(pixelsFS.E.M.)
IL-6 49F 19 28F 11 125F 36 0
IL-8 132F 11* 85F 20* 163F 5* 0
IL-1h BDL BDL BDL BDL
TNF-a BDL BDL BDL BDL
IL-12 BDL BDL BDL BDL
IFN-g BDL BDL BDL BDL
Pro-inflammatory cytokines detected via the membrane array. The
membrane array detected IL-6 and IL-8 for all experimental groups.
IL-8 densities were significantly higher in all experimental groups
when compared to Time 0. However, only IL-6 and IL-8 were
detected using the membrane array and no other pro-inflammatory
cytokines were detected. The data represents the meansF S.E.M.
for four donors. BDL= below detection limit of the membrane array.
*P< 0.05 compared to Time 0.
cytokines. A total of 16 cytokines were measured
using our traditional, previously published protocols
(Nemzek et al., 2001).
3.2. Custom RayBio Human Cytokines Array
The map of the cytokines specially spotted on our
membranes is listed in Table 1. Representative exam-
ples of the membrane protein arrays are shown in Fig.
1 (A, E. coli; B, MRSA; C, LPS). Positive controls are
located in the upper left-hand corner (four spots) and
lower right-hand corner (two spots) of each mem-
brane. The coefficient of variation (CV) was calculat-
ed for the pixel densities of the six-spot control for
each membrane. The individual and average %CV for
the membranes is depicted in Table 2. Awide range of
CV% was a result of the partial development of the
six-spot control on many of the membranes and
extended from 6% to 42%. The membranes were only
Table 4a
Anti-inflammatory cytokines detected via ELISA
E. coli
(pg/mlFS.E.M.)
MRSA
(pg/mlFS.E.M.)
LPS
(pg/mlFS.E.M.)
Time 0
(pg/mlFS.E.M.)
IL-10 500F 200 600F 200 100F 70 100F 100
IL-1ra 400F 200 1000F 500* 200F 100 200F 0
IL-4 100F 40 70F 40 100F 60 40F 8
TNF-SRII 900F 200 1000F 300 600F 60* 2000F 200
TNF-SRI 110F 4* 103F 3* 108F 2* 144F 16
Anti-inflammatory cytokines detected via ELISA. ELISA results
indicated that several anti-inflammatory cytokines were present in
both the stimulated and unstimulated samples. The data represents
the meansF S.E.M. for four donors.
*P < 0.05 compared to Time 0.
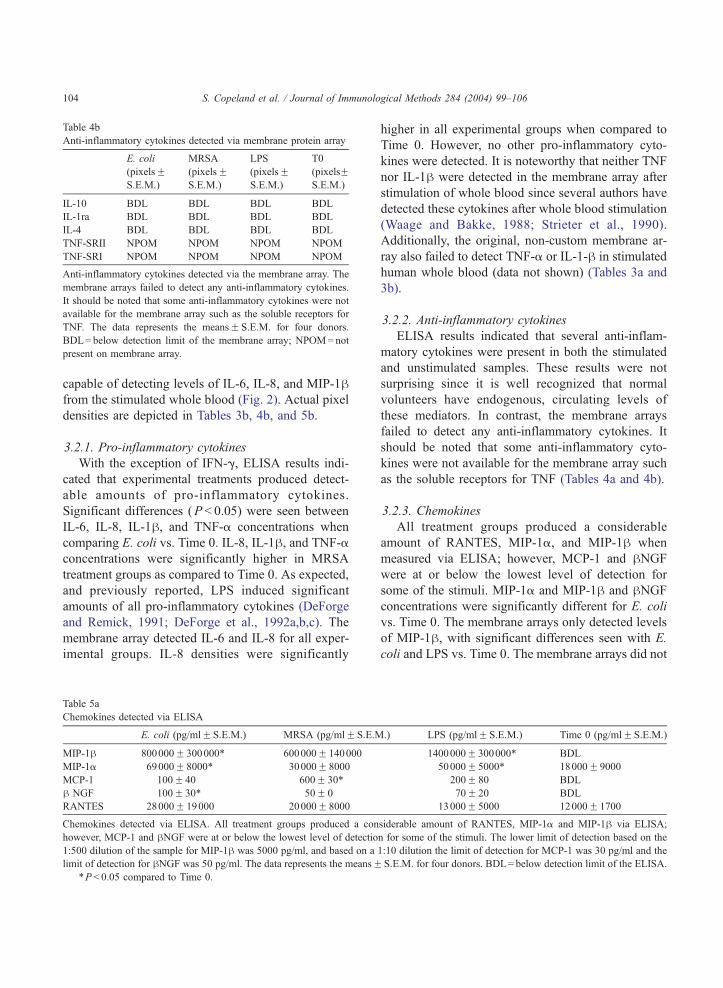
Table 4b
Anti-inflammatory cytokines detected via membrane protein array
E. coli
(pixelsFS.E.M.)
MRSA
(pixelsFS.E.M.)
LPS
(pixelsFS.E.M.)
T0
(pixelsFS.E.M.)
IL-10 BDL BDL BDL BDL
IL-1ra BDL BDL BDL BDL
IL-4 BDL BDL BDL BDL
TNF-SRII NPOM NPOM NPOM NPOM
TNF-SRI NPOM NPOM NPOM NPOM
Anti-inflammatory cytokines detected via the membrane array. The
membrane arrays failed to detect any anti-inflammatory cytokines.
It should be noted that some anti-inflammatory cytokines were not
available for the membrane array such as the soluble receptors for
TNF. The data represents the meansF S.E.M. for four donors.
BDL= below detection limit of the membrane array; NPOM=not
present on membrane array.
S. Copeland et al. / Journal of Immunological Methods 284 (2004) 99–106104
capable of detecting levels of IL-6, IL-8, and MIP-1hfrom the stimulated whole blood (Fig. 2). Actual pixel
densities are depicted in Tables 3b, 4b, and 5b.
3.2.1. Pro-inflammatory cytokines
With the exception of IFN-g, ELISA results indi-
cated that experimental treatments produced detect-
able amounts of pro-inflammatory cytokines.
Significant differences (P < 0.05) were seen between
IL-6, IL-8, IL-1h, and TNF-a concentrations when
comparing E. coli vs. Time 0. IL-8, IL-1h, and TNF-aconcentrations were significantly higher in MRSA
treatment groups as compared to Time 0. As expected,
and previously reported, LPS induced significant
amounts of all pro-inflammatory cytokines (DeForge
and Remick, 1991; DeForge et al., 1992a,b,c). The
membrane array detected IL-6 and IL-8 for all exper-
imental groups. IL-8 densities were significantly
Table 5a
Chemokines detected via ELISA
E. coli (pg/mlF S.E.M.) MRSA (pg/mlF S.E.M
MIP-1h 800000F 300000* 600000F 140000
MIP-1a 69000F 8000* 30000F 8000
MCP-1 100F 40 600F 30*
h NGF 100F 30* 50F 0
RANTES 28000F 19000 20000F 8000
Chemokines detected via ELISA. All treatment groups produced a con
however, MCP-1 and hNGF were at or below the lowest level of detectio
1:500 dilution of the sample for MIP-1h was 5000 pg/ml, and based on a
limit of detection for hNGF was 50 pg/ml. The data represents the meansF*P < 0.05 compared to Time 0.
higher in all experimental groups when compared to
Time 0. However, no other pro-inflammatory cyto-
kines were detected. It is noteworthy that neither TNF
nor IL-1h were detected in the membrane array after
stimulation of whole blood since several authors have
detected these cytokines after whole blood stimulation
(Waage and Bakke, 1988; Strieter et al., 1990).
Additionally, the original, non-custom membrane ar-
ray also failed to detect TNF-a or IL-1-h in stimulated
human whole blood (data not shown) (Tables 3a and
3b).
3.2.2. Anti-inflammatory cytokines
ELISA results indicated that several anti-inflam-
matory cytokines were present in both the stimulated
and unstimulated samples. These results were not
surprising since it is well recognized that normal
volunteers have endogenous, circulating levels of
these mediators. In contrast, the membrane arrays
failed to detect any anti-inflammatory cytokines. It
should be noted that some anti-inflammatory cyto-
kines were not available for the membrane array such
as the soluble receptors for TNF (Tables 4a and 4b).
3.2.3. Chemokines
All treatment groups produced a considerable
amount of RANTES, MIP-1a, and MIP-1h when
measured via ELISA; however, MCP-1 and hNGFwere at or below the lowest level of detection for
some of the stimuli. MIP-1a and MIP-1h and hNGFconcentrations were significantly different for E. coli
vs. Time 0. The membrane arrays only detected levels
of MIP-1h, with significant differences seen with E.
coli and LPS vs. Time 0. The membrane arrays did not
.) LPS (pg/mlF S.E.M.) Time 0 (pg/mlF S.E.M.)
1400000F 300000* BDL
50000F 5000* 18000F 9000
200F 80 BDL
70F 20 BDL
13000F 5000 12000F 1700
siderable amount of RANTES, MIP-1a and MIP-1h via ELISA;
n for some of the stimuli. The lower limit of detection based on the
1:10 dilution the limit of detection for MCP-1 was 30 pg/ml and the
S.E.M. for four donors. BDL= below detection limit of the ELISA.
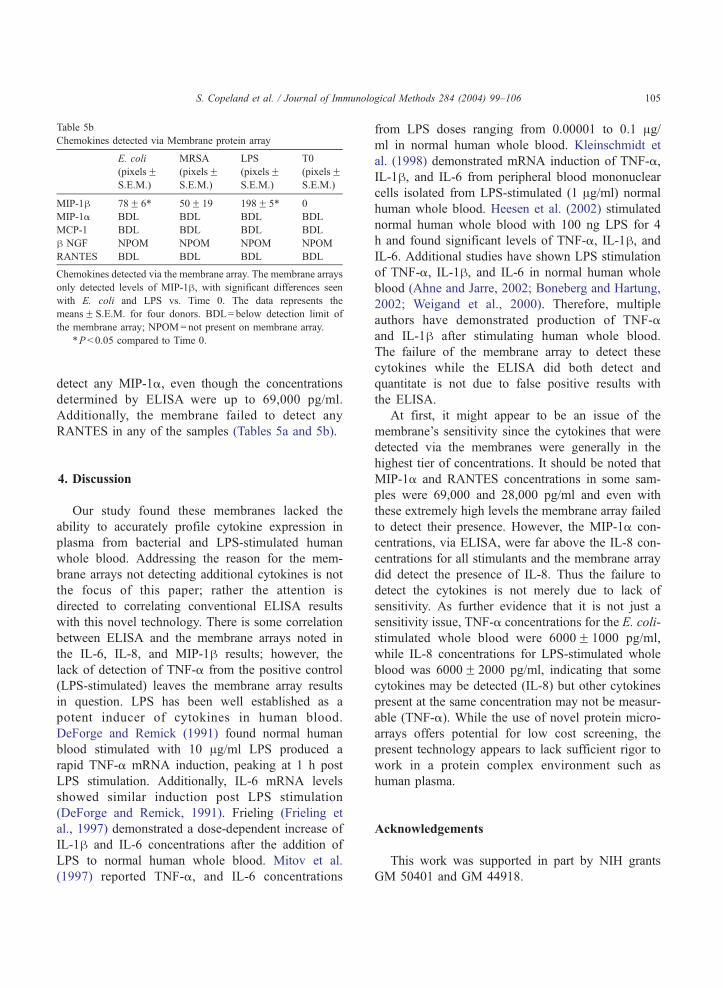
Table 5b
Chemokines detected via Membrane protein array
E. coli
(pixelsFS.E.M.)
MRSA
(pixelsFS.E.M.)
LPS
(pixelsFS.E.M.)
T0
(pixelsFS.E.M.)
MIP-1h 78F 6* 50F 19 198F 5* 0
MIP-1a BDL BDL BDL BDL
MCP-1 BDL BDL BDL BDL
h NGF NPOM NPOM NPOM NPOM
RANTES BDL BDL BDL BDL
Chemokines detected via the membrane array. The membrane arrays
only detected levels of MIP-1h, with significant differences seen
with E. coli and LPS vs. Time 0. The data represents the
meansF S.E.M. for four donors. BDL= below detection limit of
the membrane array; NPOM=not present on membrane array.
*P< 0.05 compared to Time 0.
S. Copeland et al. / Journal of Immunological Methods 284 (2004) 99–106 105
detect any MIP-1a, even though the concentrations
determined by ELISA were up to 69,000 pg/ml.
Additionally, the membrane failed to detect any
RANTES in any of the samples (Tables 5a and 5b).
4. Discussion
Our study found these membranes lacked the
ability to accurately profile cytokine expression in
plasma from bacterial and LPS-stimulated human
whole blood. Addressing the reason for the mem-
brane arrays not detecting additional cytokines is not
the focus of this paper; rather the attention is
directed to correlating conventional ELISA results
with this novel technology. There is some correlation
between ELISA and the membrane arrays noted in
the IL-6, IL-8, and MIP-1h results; however, the
lack of detection of TNF-a from the positive control
(LPS-stimulated) leaves the membrane array results
in question. LPS has been well established as a
potent inducer of cytokines in human blood.
DeForge and Remick (1991) found normal human
blood stimulated with 10 Ag/ml LPS produced a
rapid TNF-a mRNA induction, peaking at 1 h post
LPS stimulation. Additionally, IL-6 mRNA levels
showed similar induction post LPS stimulation
(DeForge and Remick, 1991). Frieling (Frieling et
al., 1997) demonstrated a dose-dependent increase of
IL-1h and IL-6 concentrations after the addition of
LPS to normal human whole blood. Mitov et al.
(1997) reported TNF-a, and IL-6 concentrations
from LPS doses ranging from 0.00001 to 0.1 Ag/ml in normal human whole blood. Kleinschmidt et
al. (1998) demonstrated mRNA induction of TNF-a,
IL-1h, and IL-6 from peripheral blood mononuclear
cells isolated from LPS-stimulated (1 Ag/ml) normal
human whole blood. Heesen et al. (2002) stimulated
normal human whole blood with 100 ng LPS for 4
h and found significant levels of TNF-a, IL-1h, andIL-6. Additional studies have shown LPS stimulation
of TNF-a, IL-1h, and IL-6 in normal human whole
blood (Ahne and Jarre, 2002; Boneberg and Hartung,
2002; Weigand et al., 2000). Therefore, multiple
authors have demonstrated production of TNF-a
and IL-1h after stimulating human whole blood.
The failure of the membrane array to detect these
cytokines while the ELISA did both detect and
quantitate is not due to false positive results with
the ELISA.
At first, it might appear to be an issue of the
membrane’s sensitivity since the cytokines that were
detected via the membranes were generally in the
highest tier of concentrations. It should be noted that
MIP-1a and RANTES concentrations in some sam-
ples were 69,000 and 28,000 pg/ml and even with
these extremely high levels the membrane array failed
to detect their presence. However, the MIP-1a con-
centrations, via ELISA, were far above the IL-8 con-
centrations for all stimulants and the membrane array
did detect the presence of IL-8. Thus the failure to
detect the cytokines is not merely due to lack of
sensitivity. As further evidence that it is not just a
sensitivity issue, TNF-a concentrations for the E. coli-
stimulated whole blood were 6000F 1000 pg/ml,
while IL-8 concentrations for LPS-stimulated whole
blood was 6000F 2000 pg/ml, indicating that some
cytokines may be detected (IL-8) but other cytokines
present at the same concentration may not be measur-
able (TNF-a). While the use of novel protein micro-
arrays offers potential for low cost screening, the
present technology appears to lack sufficient rigor to
work in a protein complex environment such as
human plasma.
Acknowledgements
This work was supported in part by NIH grants
GM 50401 and GM 44918.
S. Copeland et al. / Journal of Immunological Methods 284 (2004) 99–106106
References
Ahne, W., Jarre, T., 2002. Environmental toxicology: polychlori-
nated biphenyls impair TNF-alpha release in vitro. J. Vet. Med.,
A. Physiol. Pathol. Clin. Med. 49, 105–106.
Balfour, J.A., Bryson, H.M., Brogden, R.N., 1996. Imipenem/cilas-
tatin: an update of its antibacterial activity, pharmacokinetics
and therapeutic efficacy in the treatment of serious infections.
Drugs 51, 99–136.
Boneberg, E.M., Hartung, T., 2002. Granulocyte colony-stimulating
factor attenuates LPS-stimulated IL-1beta release via suppressed
processing of proIL-1beta, whereas TNF-alpha release is in-
hibited on the level of proTNF-alpha formation. Eur. J. Immu-
nol. 32, 1717–1725.
Cahill, D.J., 2001. Protein and antibody arrays and their medical
applications. J. Immunol. Methods 250, 81–91.
DeForge, L.E., Remick, D.G., 1991. Kinetics of TNF, IL-6, and IL-
8 gene expression in LPS-stimulated human whole blood. Bio-
chem. Biophys. Res. Commun. 174, 18–24.
DeForge, L.E., Fantone, J.C., Kenney, J.S., Remick, D.G.,
1992a. Oxygen radical scavengers selectively inhibit interleu-
kin 8 production in human whole blood. J. Clin. Invest. 90,
2123–2129.
DeForge, L.E., Kenney, J.S., Jones, M.L., Warren, J.S., Remick,
D.G., 1992b. Biphasic production of IL-8 in lipopolysaccharide
(LPS)-stimulated human whole blood. Separation of LPS- and
cytokine-stimulated components using anti-tumor necrosis fac-
tor and anti-IL-1 antibodies. J. Immunol. 148, 2133–2141.
DeForge, L.E., Tracey, D.E., Kenney, J.S., Remick, D.G., 1992c.
Interleukin-1 receptor antagonist protein inhibits interleukin-8
expression in lipopolysaccharide-stimulated human whole
blood. Am. J. Pathol. 140, 1045–1054.
Frieling, J.T., Mulder, J.A., Hendriks, T., Curfs, J.H., van der Lin-
den, C.J., Sauerwein, R.W., 1997. Differential induction of pro-
and anti-inflammatory cytokines in whole blood by bacteria:
effects of antibiotic treatment. Antimicrob. Agents Chemother.
41, 1439–1443.
Heesen, M., Bloemeke, B., Heussen, N., Kunz, D., 2002. Can the
interleukin-6 response to endotoxin be predicted? Studies of the
influence of a promoter polymorphism of the interleukin-6 gene,
gender, the density of the endotoxin receptor CD14, and inflam-
matory cytokines. Crit. Care Med. 30, 664–669.
Huang, R.P., Huang, R., Fan, Y., Lin, Y., 2001. Simultaneous de-
tection of multiple cytokines from conditioned media and pa-
tient’s sera by an antibody-based protein array system. Anal.
Biochem. 294, 55–62.
Kleinschmidt, S., Wanner, G.A., Bussmann, D., Kremer, J.P., Zie-
genfuss, T., Menger, M.D., Bauer, M., 1998. Proinflammatory
cytokine gene expression in whole blood from patients under-
going coronary artery bypass surgery and its modulation by
pentoxifylline. Shock 9, 12–20.
Kodadek, T., 2001. Protein microarrays: prospects and problems.
Chem. Biol. 8, 105–115.
MacBeath, G., 2002. Protein microarrays and proteomics. Nat.
Genet. 32, 526–532.
Mitov, I.G., Kropec, A., Benzing, A., Just, H., Garotta, G., Galanos,
C., Freudenberg, M., 1997. Differential cytokine production in
stimulated blood cultures from intensive care patients with bac-
terial infections. Infection 25, 206–212.
Nemzek, J.A., Siddiqui, J., Remick, D.G., 2001. Development and
optimization of cytokine ELISAs using commercial antibody
pairs. J. Immunol. Methods 255, 149–157.
Schweitzer, B., Roberts, S., Grimwade, B., Shao, W., Wang, M., Fu,
Q., Shu, Q., Laroche, I., Zhou, Z., Tchernev, V.T., Christiansen,
J., Velleca, M., Kingsmore, S.F., 2002. Multiplexed protein
profiling on microarrays by rolling-circle amplification. Nat.
Biotechnol. 20, 359–365.
Strieter, R.M., Remick, D.G., Ham, J.M., Colletti, L.M., Lynch,
J.P.d., Kunkel, S.L., 1990. Tumor necrosis factor-alpha gene
expression in human whole blood. J. Leukoc. Biol. 47,
366–370.
Waage, A., Bakke, O., 1988. Glucocorticoids suppress the produc-
tion of tumour necrosis factor by lipopolysaccharide-stimulated
human monocytes. Immunology 63, 299–302.
Weigand, M.A., Schmidt, H., Zhao, Q., Plaschke, K., Martin, E.,
Bardenheuer, H.J., 2000. Ketamine modulates the stimulated
adhesion molecule expression on human neutrophils in vitro.
Anesth. Analg. 90, 206–212.