dimensionality reduction and classification of hyperspectral image
TRANSCRIPT

466 IEEE TRANSACTIONS ON GEOSCIENCE AND REMOTE SENSING, VOL. 43, NO. 3, MARCH 2005
Dimensionality Reduction and Classification ofHyperspectral Image Data Using Sequences of
Extended Morphological TransformationsAntonio Plaza, Member, IEEE, Pablo Martínez, Javier Plaza, and Rosa Pérez
Abstract—This paper describes sequences of extended mor-phological transformations for filtering and classification ofhigh-dimensional remotely sensed hyperspectral datasets. Theproposed approaches are based on the generalization of conceptsfrom mathematical morphology theory to multichannel imagery.A new vector organization scheme is described, and funda-mental morphological vector operations are defined by extension.Extended morphological transformations, characterized by si-multaneously considering the spatial and spectral informationcontained in hyperspectral datasets, are applied to agriculturaland urban classification problems where efficacy in discriminatingbetween subtly different ground covers is required. The methodsare tested using real hyperspectral imagery collected by theNational Aeronautics and Space Administration Jet PropulsionLaboratory Airborne Visible-Infrared Imaging Spectrometerand the German Aerospace Agency Digital Airborne ImagingSpectrometer (DAIS 7915). Experimental results reveal that, bydesigning morphological filtering methods that take into accountthe complementary nature of spatial and spectral information ina simultaneous manner, it is possible to alleviate the problemsrelated to each of them when taken separately.
Index Terms—Hyperspectral image analysis, morphological fil-tering, multichannel morphological transformations, neural net-work classifiers.
I. INTRODUCTION
HYPERSPECTRAL remote sensing provides very highspectral resolution image data and the potential for
discrimination of subtle differences in ground covers [1],[2]. However, the high-dimensional data space generatedby hyperspectral sensors introduces new challenges in thedevelopment of data analysis techniques [3], [4]. Previousresearch has demonstrated that high-dimensional data spacesare mostly empty, indicating that the data structure involvedexists primarily in a subspace [5]. As a result, there is a need forfeature extraction methods that can reduce the dimensionalityof the data to the right subspace without losing the originalinformation that allows for the separation of classes. In otherwords, dimension reduction is the transformation that brings
Manuscript received February 23, 2004; revised October 17, 2004. This workwas supported in part by the European Community within the HySens Projectunder Contract HPRI-1999-00057 and in part by Junta de Extremadura underContract 2PR03A026. A. Plaza was supported in part by the Spanish Ministeryof Science and Education under a PR2003-0360 Fellowship.
The authors are with the Neural Networks and Signal Processing Group,Computer Science Department, Polytechnic Institute of Cáceres, Univer-sity of Extremadura, E-10071 Cáceres, Spain (e-mail: [email protected];[email protected]; [email protected]; [email protected]).
Digital Object Identifier 10.1109/TGRS.2004.841417
data from a high order dimension to a low order dimension,thus overcoming the “curse” of dimensionality [6].
One of the most widely used dimension reduction tech-niques in remote sensing is the principal component analysis(PCA). PCA computes orthogonal projections that maximizethe amount of data variance, and yields a dataset in a newuncorrelated coordinate system. Unfortunately, informationcontent in hyperspectral images does not always match suchprojections [7]. This rotational transform is characterized byits global nature, and as a result, it might not preserve all theinformation useful to obtain a good classification. In order toseparate fine-scale from large-scale information, multiscaleapproaches such as derivative spectroscopy [8] and the wavelettransform [9] have been previously applied to extract relevantfeatures from hyperspectral signals. In derivative spectroscopy,a smoothing operator is followed by a derivative operator to de-tect “hills” and “valleys” in the spectral curves. More recently,methods using the continuous wavelet transform (CWT) andthe discrete wavelet transform (DWT) have been investigatedas a means of systematically analyzing hyperspectral curvesvia windows of varying width. Although the approaches aboveare particularly suitable for the development of target detectiontechniques operating at a subpixel level [3], their applicationto land-cover classification scenarios is limited by the factthat they rely on spectral properties of the data alone, thusneglecting the information related to the spatial arrangementof the pixels in the scene. As a result, feature extraction iscarried out without incorporating information on the spatiallyadjacent data, i.e., the data is managed not as an image butas a disarranged listing of spectral measurements where thespatial coordinates can be randomly shuffled without affectingthe analysis [10]. However, one of the distinguishing proper-ties of hyperspectral data, as collected by available imagingspectrometers, is the multivariate information coupled with atwo-dimensional (2-D) pictorial representation amenable toimage interpretation. Subsequently, there is a need to incorpo-rate the image representation of the data in the development ofappropriate feature extraction techniques for the understandingof hyperspectral data.
This paper focuses on the problem of multiscale feature ex-traction from a broader scope than the individual methods listedabove. Instead of focusing exclusively on the spectral informa-tion contained in the data, we focus on the analysis of spatial andspectral patterns simultaneously by the design of multichannelfilters. Our previous research [11], [12] has examined the appli-cation of multichannel mathematical morphology (MM) opera-
0196-2892/$20.00 © 2005 IEEE

PLAZA et al.: DIMENSIONALITY REDUCTION AND CLASSIFICATION OF HYPERSPECTRAL IMAGE DATA 467
tions to integrate both spatial and spectral responses in hyper-spectral data analysis. Classic MM is a nonlinear spatial pro-cessing technique [13], [14] that provides a remarkable frame-work to achieve the desired integration [11]. For perspective,we briefly discuss fundamental operations of classic MM in thecontext of their application to geoscience and remote sensingproblems, and then introduce our multichannel approach.
A. Classic Mathematical Morphology
Based on set theory, binary MM was established by intro-ducing fundamental operators applied to two sets [15]. One setis processed by another having a carefully selected shape andsize, known as the structuring element (SE), which is translatedover the image. The SE acts as a probe for extracting or sup-pressing specific image structures by checking that each posi-tion of the SE fits within the image objects. Based on these no-tions, two fundamental operators are defined in MM, namelyerosion and dilation. The application of the erosion operator toan image gives an output image, which shows where the SE fitsthe objects in the image. In contrast, the application of the dila-tion operator to an image gives an output image, which showswhere the SE hits the objects in the image. All other MM op-erations can be expressed in terms of erosion and dilation [13].For instance, the notion behind the opening operator is to dilatean eroded image in order to recover as much as possible of theeroded image. In contrast, the closing operator erodes a dilatedimage so as to recover the initial shape of image structures thathave been dilated. The filtering properties of the opening andclosing are based on the fact that, depending on the size andshape of the considered SE, not all structures from the originalimage will be recovered when these operators are applied [14].
Binary MM operators have been extended to gray-tone(monochannel) images by viewing these data as an imaginarytopographic relief; in this regard, the brighter the gray tone,the higher the corresponding elevation [16]. It follows that, ingrayscale morphology, each 2-D gray tone image is viewedas if it were a digital elevation model (DEM). In practice, setoperators are directly generalized to gray-tone images. Forinstance, the intersection (respectively, union ) of two setsbecomes the pointwise minimum (respectively, maximum )operator [14]. Following a usual notation [17], let us considera grayscale image , defined on the 2-D discrete space , anda SE designed by . The latter is usually “flat” in thesense that it is defined in the spatial domain of the image (the
- plane) [14]. The flat erosion of by is defined by thefollowing expression:
(1)where denotes the set of discrete spatial coordinates as-sociated to pixels lying within the neighborhood defined byand denotes the minimum. In contrast, the flat dilation ofby is defined by
(2)
where denotes the maximum. Using the same notation above,standard opening and closing filters [18] can be, respectively,defined by
(3)
The basic operations above have been successfully employedin a variety of geoscience and remote sensing applications [14].In particular, the idea of using sequences of opening and closingfilters to extract adequate features from monochannel remotelysensed data has been widely used by recent research. A com-position of geodesic opening and closing operations [18] usingSEs of different sizes was used in [19] and [20] in order to buildpixel-level differential morphological profiles, which were thenused to characterize image structures in high-resolution urbansatellite data [21]. Neural-network-based approaches werethen used for the classification of the resulting morphologicalfeatures [21], [22]. More recently, sensor noise-independentmorphological profiles were constructed by applying sequencesof opening and closing operators alternately, using increasingSE sizes [23]. Extension of the above spatial-based sequen-tial approaches to multichannel imagery has not been fullyaccomplished yet. An available technique computes the firstprincipal component of the multichannel dataset for use as thebase image for constructing morphological profiles by applyingmonochannel morphological filters [22], [24]. However, ex-tended (multichannel) morphological operations, based on theintegration of spatial and spectral properties of the data, shouldbe more effective in discrimination of relevant image features.
B. Multichannel Mathematical Morphology
The extension of classic MM operations to multichannelimage data is not straightforward. When such techniques areapplied independently to each image channel (marginal MM),there is a possibility for loss or corruption of information ofthe image due to the probability that new spectral constituents(not present in the original image) may be created as a resultof processing image channels separately [25]. An alternativeway to approach the problem of multivariate morphology is totreat the data at each pixel as a vector. In order to define vectorMM operations, a concept for a maximum (or minimum) isnecessary, and thus it is important to define an appropriatearrangement of vectors in the selected vector space. Since thereare no natural means of defining arrangement in -dimensionalspaces, a number of vector ordering schemes has been explored[26], [27]. In reduced ordering, a scalar parameter functionis computed for each pixel of the image and the ordering isperformed according to the resulting scalar values. In partialordering, the input multivariate samples are partitioned intosmaller groups, which are then ordered. In conditional ordering,the vectors are initially ordered according to the ordered valuesof their components, e.g., the first component. As a second step,vectors that have the same value for the first component areordered according to the ordered values of another component,e.g., the second component, and so on. Our approach to thisproblem has been the definition of a reduced vector orderingscheme based on the spectral purity of pixel vectors [11]. First,
468 IEEE TRANSACTIONS ON GEOSCIENCE AND REMOTE SENSING, VOL. 43, NO. 3, MARCH 2005
a lattice structure is imposed onto the -dimensional space byordering input vectors over the values obtained after calculatinga spectral-based distance between a certain sample and allthe other ordered ones. Second, morphological operations aredefined by extension [12].
C. Scale-Orientation Morphological Profiles (SOMPs)
One of our main goals in this paper is to incorporate the ideaof multiscale analysis into extended MM transformations. Incomplex image scenes containing structures with several signif-icant derivative maxima and directional features (for instance,urban environments), orientation is worthwhile as an additionto scale information in order to characterize image structures[28], [29]. Morphological directional profiles were defined in[30] by performing openings and closings with line segment SEsof varying orientation [31]. Such profiles were then applied todetermine the local orientation of thin elongated structures suchas roads on satellite images. Taking advantage of our defini-tion of multichannel morphological transformations, we extendthe concepts of differential and scale-orientation morphologicalprofiles to hyperspectral image analysis in this work.
The remainder of the paper is organized as follows. Section IIdescribes the approach followed to extend MM operations tohyperspectral imagery. Section III provides a framework forthe calculation of extended morphological sequences, givingvarious examples. Section IV shows how the above sequencescan be used to design a supervised, neural-network-based clas-sification system that is then applied to precision agriculturaland urban classification problems. That system is tested usingreal hyperspectral datasets collected by the Airborne Visible-Infrared Imaging Spectrometer (AVIRIS) and the Digital Air-borne Imaging Spectrometer (DAIS 7915) imaging spectrome-ters. The last section summarizes relevant points made and hintsat plausible future research.
II. EXTENDED MORPHOLOGICAL TRANSFORMATIONS
Our attention in this section focuses primarily on the develop-ment of a mechanism to extend classic MM filters to hyperspec-tral image analysis. First, we provide a mathematical formula-tion for the extension of basic erosion and dilation operationsto multichannel imagery. The section ends with an in-depth de-scription of extended opening and closing by reconstruction, aspecial class of morphological filters that will be used in thiswork for multiscale image processing.
A. Mathematical Formulation for Extended Dilationsand Erosions
Following the notation in [17], let us consider a hyperspec-tral image , defined on the -dimensional continuous space
, where is the number of spectral channels. An orderingrelation can be imposed in the set of pixels lying within an SE,denoted by , by defining metrics that calculate the cumulativedistance between one particular pixel , where de-notes an -dimensional vector at discrete spatial coordinates
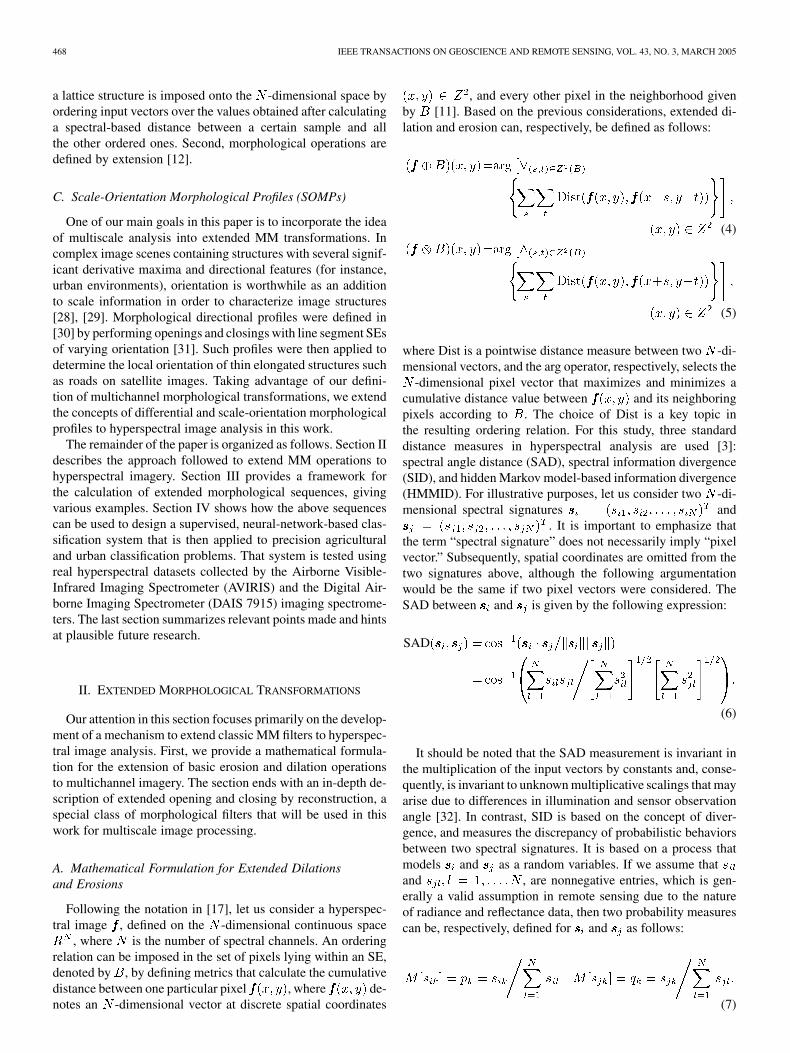
, and every other pixel in the neighborhood givenby [11]. Based on the previous considerations, extended di-lation and erosion can, respectively, be defined as follows:
(4)
(5)
where Dist is a pointwise distance measure between two -di-mensional vectors, and the arg operator, respectively, selects the
-dimensional pixel vector that maximizes and minimizes acumulative distance value between and its neighboringpixels according to . The choice of Dist is a key topic inthe resulting ordering relation. For this study, three standarddistance measures in hyperspectral analysis are used [3]:spectral angle distance (SAD), spectral information divergence(SID), and hidden Markov model-based information divergence(HMMID). For illustrative purposes, let us consider two -di-mensional spectral signatures and
. It is important to emphasize thatthe term “spectral signature” does not necessarily imply “pixelvector.” Subsequently, spatial coordinates are omitted from thetwo signatures above, although the following argumentationwould be the same if two pixel vectors were considered. TheSAD between and is given by the following expression:
SAD
(6)
It should be noted that the SAD measurement is invariant inthe multiplication of the input vectors by constants and, conse-quently, is invariant to unknown multiplicative scalings that mayarise due to differences in illumination and sensor observationangle [32]. In contrast, SID is based on the concept of diver-gence, and measures the discrepancy of probabilistic behaviorsbetween two spectral signatures. It is based on a process thatmodels and as a random variables. If we assume thatand , are nonnegative entries, which is gen-erally a valid assumption in remote sensing due to the natureof radiance and reflectance data, then two probability measurescan be, respectively, defined for and as follows:
(7)

PLAZA et al.: DIMENSIONALITY REDUCTION AND CLASSIFICATION OF HYPERSPECTRAL IMAGE DATA 469
Using the above definitions, the self-information provided byfor band l is given by . We can further define
the relative entropy of with respect to , by [3]
(8)
By means of (8), a symmetric hyperspectral measure, referredto as SID, is defined as follows:
SID (9)
SID offers a new look at the spectral similarity between twospectral signatures by making use of relative entropy, and ac-counts for the spectral information provided by each signature[33]. Following a similar approach, the HMMID makes use of ahidden Markov model (HMM) to characterize spectral correla-tion as well as band-to-band variability of hyperspectral imagepixel vectors. The HMM process is used to capture the unob-served and hidden spectral properties of the hyperspectral sig-nals. A detailed description of HMMID is available in [34] andwill not be discussed here due to similarities with respect to SIDand space considerations. Both SID and HMMID are informa-tion-theorretic measures that use the concept of self-information[3]. They can be viewed as stochastic measures as opposed toSAD, which is considered to be a deterministic measure.
The use of any of the spectral similarity metrics addressedabove as the standard distance measure allows us to impose apartial order relationship of the vectors within a SE in terms oftheir spectral singularity. It is important to notice that, regard-less of the distance metric used in (4) and (5), the proposed op-erators are vector preserving in the sense that no single vector(constituent) absent from the input data is generated as a resultof the extension process.
B. Extended Opening and Closing by Reconstruction Filters
Extended erosion and dilation allow for the construction ofmore complex filtering operations with additional properties.The sequential techniques developed in our research are mainlybased on opening and closing by reconstruction, a class ofmorphological filters that do not introduce discontinuities andtherefore preserve the shapes observed in input images [35].Thus, the basic contrast imposed by conventional openingand closing [see (3)] versus reconstruction-based opening andclosing can be described as follows. Conventional opening andclosing remove the parts of the objects that are smaller thanthe SE, whereas opening and closing by reconstruction eithercompletely removes the features or retains them as a whole.Following the notation introduced above, extended opening byreconstruction is defined by
(10)
where
(11)
The elementary term is an extendedgeodesic dilation [36], defined as the pointwise minimum be-tween the elementary dilation of using at pixeland the value of
(12)
As shown in (11), this operation is repeated k times until sta-bility (i.e., no more pixel value modifications) is achieved [14].In a similar fashion, extended closing by reconstruction is givenby
(13)
where
(14)
The elementary term is an extendedgeodesic erosion [36], defined as the pointwise maximum be-tween the elementary erosion of using at pixeland the value of
(15)
Extended opening and closing by reconstruction will beconsidered hereinafter as the two letters of our morphologicalalphabet. These filters demonstrate excellent properties whenemployed to construct sequential morphological operationsfor hyperspectral image analysis, in particular, when they arecombined with disk-shaped SEs due to their isotropy [22].Let us denote by a square SE of width pixels.Similarly, let be a diamond-shaped SE with a sideof pixels . By definition, is a singlepixel, and is the elementary diamond (a pixel andits four direct neighbors). Using the above definitions, disk SEsof increasing radiuses can be approximated by starting with
and then alternating binary dilations byand [14]
(16)
where is the radius in pixels of the approximated diskSE and is the binary dilation operator. In order to illustratethe geodesic operations in (11) and (14), let be a hyperspec-tral image collected by the DLR ROSIS imaging spectrometer[37] over a semiarid area in Cáceres, southwest Spain. The sceneconsists of 1.2-m 88 134 pixels, each containing 92 spectralbands covering the spectral range from 504–864 nm. Fig. 1(a)shows the spectral band collected at 584-nm wavelength by theROSIS imaging spectrometer, where three different materialscan be visually identified: cork-oak trees (dark areas), pasture(gray areas), and soil (bright areas). Four target pixels circledin Fig. 1(a) were identified by using an ASD FieldSpec Prospectroradiometer during a visit to the test site. The pixels in-

470 IEEE TRANSACTIONS ON GEOSCIENCE AND REMOTE SENSING, VOL. 43, NO. 3, MARCH 2005
(a) (b) (c) (d) (e)
Fig. 1. Spectral band at 584 nm of a ROSIS hyperspectral image and spatialpositions of four target pixels of interest (a). The same band in the resultingimage after applying a geodesic erosion to the original image using (b) k = 1
and (c) k = 2 repetitions. The same band in the resulting image after applyinga geodesic dilation to the original image using (d) k = 1 and (e) k = 2
repetitions.
clude a small cork-oak tree (T1), a medium-sized cork-oak tree(T2), a pure soil area (S), and a mixed area formed by soil andpasture (M). Data collection revealed that T1, T2, and S canbe considered spectrally pure at a macroscopic level, while thesensor spatial resolution available does not allow to separatesoil from pasture at M, which was labeled as spectrally mixed.Fig. 1(b) and (c), respectively, shows the band at 584 nm ofthe resulting image after applying an extended geodesic erosionusing and repetitions [see (11)] to the originalhyperspectral image in Fig. 1(a). Similarly, Fig. 1(d) and (e),respectively, shows the band at 584 nm of the resulting imageafter an extended geodesic dilation using and rep-etitions [see (14)]. In all cases, the considered SE is given by
. This figure intuitively shows how extended mor-phological operations affect four pixels with different spectraland spatial properties.
III. EXTENDED MORPHOLOGICAL SEQUENCES
We present below three different approaches to the construc-tion of multiscale sequences of extended MM transformations.Examples illustrating the application of extended morpholog-ical sequences to extract relevant features from real hyperspec-tral datasets are also provided in each subsection.
A. Extended Differential Morphological Profiles
Morphological profiles for grayscale (monochannel) re-motely sensed imagery rely on the sequential application ofopening and closing by reconstruction operations using SEs ofincreasing size [19], [20]. An extended differential morpho-logical profile (EDMP) is defined as a vector where a measureof the spectral variation of the multichannel opening-closingprofile is stored for every step of an increasing SE series. Using(10) and (13), we can create EDMPs as follows. Letbe a matrix of dimension , which contains theopening by reconstruction morphological profile at the point
of a hyperspectral image , given by
(17)
where is the opening by reconstruction operation.Similarly, let be a matrix of dimension ,which contains the extended closing by reconstruction morpho-logical profile at the point of , defined by
(18)
TABLE ISAD-BASED LEVEL OF THE DERIVATIVE RELATIVE TO A SERIES OF
OPENING AND CLOSING OPERATIONS FOR SEVERAL PIXELS IN A ROSISHYPERSPECTRAL SCENE OVER A SEMIARID AREA IN SPAIN: T1
(SMALL CORK-OAK TREE), T2 (MEDIUM-SIZED CORK-OAK TREE),S (PURE SOIL) AND M (MIXED PIXEL FORMED BY SOIL AND PASTURE)
where is the closing by reconstruction operation.Here for bythe definition of opening and closing by reconstruction [14]. Wedefine the derivative of the extended opening profile, ,as the k-D vector
(19)
where Dist refers to a spectral-based distance metric such asSAD, SID, or HMMID. By duality, the derivative of the ex-tended closing profile is the k-D vector
(20)
For illustrative purposes, Table I shows the level of the deriva-tive relative to a series of opening and closing operations for thetarget pixels shown in Fig. 1(a), where
SAD
SAD
and . As displayed in Table I, pixels that arespectrally pure (T1, T2, and S) show the maximum derivativescore in the opening series, while mixed pixels show the max-imum derivative score in the closing series. The step of theopening/closing series iteration at which the derivative profileprovides a maximum value gives an intuitive idea of both thespectral purity of the pixel and the spatial distribution of the ob-ject in the scene. As a result, the derivative profile can be used asa feature vector on which the classification is performed usinga spatial/spectral criterion.
B. Extended Alternated Sequential Filters
Before describing our approach to extend alternated sequen-tial filters (ASFs) to hyperspectral imagery, it is important tonote that ASFs rely on reconstruction-based morphological op-erations [35], [38]. Each opening and closing is followed by ageodesic reconstruction [see (11) and (14)], enabling a perfectpreservation of the remaining image features. The sequential ap-plication can be based on open–close or close–open filters, i.e.,an arbitrary choice must be made on whether to start the se-quence with an opening or a closing by reconstruction filter.That choice results in the loss of the morphological self-du-ality property [23], which was ensured by the EDMP approach(two-sided morphological profile). Let be a matrix of

PLAZA et al.: DIMENSIONALITY REDUCTION AND CLASSIFICATION OF HYPERSPECTRAL IMAGE DATA 471
dimension , which contains the extended open–closealternated sequential filter (EOASF) at the point of a hy-perspectral image , defined by
(21)Similarly, let be a matrix of dimension ,
which contains the extended close–open alternated sequentialfilter (ECASF) at the point of the image , defined by
(22)With the above definitions in mind, we should note that both
EOASFs and ECASFs could be seen as one-sided morpho-logical profiles, derived by applying alternately opening andclosing by reconstruction operators with increasing SE sizes.The derivatives of the EOASF and ECASF are, respectively,given by the k-D vectors
(23)
(24)
For illustrative purposes, Table I shows the level of the deriva-tive relative to a series of alternated openings and closings forthe target pixels shown in Fig. 1(a), where
SAD
SAD
and . As shown in Table I, open–close filters areparticularly useful to discriminate pure spectral features. Forinstance, the maximum derivative score for pixels T1, T2, and Sis obtained in the open–close series. In contrast, the maximumderivative score for mixed pixel M is obtained in the close–openseries.
C. Scale-Orientation Morphological Profiles
In order to extend the concept of directional morphologicalprofiles to multichannel imagery, we should first denote by
a line segment SE with minimal length, where p isthe number of pixels along the line and is the slope ofthe line segment [31]. By assuming a management of imagesdigitized on a square grid, we can restrict our analysis to lineslopes in the form of an irreducible fraction (i.e.,and are integers with no common divisors). By convention,we include the forms and for referring to horizontaland vertical lines, respectively [31]. Let us assume that: 1) abasis set contains a collection of pairs that definethe orientations of the considered line segment SE and 2) theresulting line segment SEs are approximated on a discrete griddepending on the length of the line segment [14]. With the
above assumptions in mind, we define the SOMP by opening ata given pixel of a hyperspectral image as
(25)
Similarly, we define the SOMP by closing at the pixelas
(26)
In both cases, a measure of line strength can be computed foreach scale and orientation by calculating the spectral distance(Dist) between the spectral signature in the original image at thepixel and the spectral signature at the same location in theimage filtered by the considered line segment SE as follows:
(27)
(28)
where Dist is one of the previously defined SAD, SID orHMMID distance metrics. The resulting values are combinedin a feature vector with dimensionality , where isthe number of considered orientations. This feature vectorcan be used for classification purposes. If required by theapplication under study, the SOMP at a given pixel can beanalyzed by plotting the opened and closed values versusthe orientation of the line segment by using a polar diagramcalled “rose of directions” (ROD) [14]. In Fig. 2, the SADdistance was used to construct ROD diagrams associated tofour different target object pixels in a DAIS 7915 hyperspectralscene over the city of Pavia, Italy. The scene consists of 5-m400 400 pixels, each containing 40 spectral bands coveringthe spectral range from 496–1756 nm [22]. Selected targetobjects include a small building [see Fig. 2(a)], a river [seeFig. 2(b)], a shaded road [see Fig. 2(c)], and a large building[see Fig. 2(d)]. For the sake of simplicity, we consider linesegment SEs with equal to 3, 5, and 7 pixels and four ori-entations, . It should benoted that, in the ROD diagrams, the axis denoted by(respectively, ) represents line strength values pro-duced by morphological openings (respectively, closings) usinga line segment SE with a slope. As shown in Fig. 2,directional openings produce a high response with spectrallypure image structures that occur in the direction of the consid-ered line segment SE [see Fig. 2(a) and (d)]. Also, directionalclosings are appropriate to characterize spectrally mixed imagestructures in the direction of the considered line segment SE[see Fig. 2(c)]. In both cases, line strength scores are highly

472 IEEE TRANSACTIONS ON GEOSCIENCE AND REMOTE SENSING, VOL. 43, NO. 3, MARCH 2005
Fig. 2. Roses of directions showing SOMP-based values of line strength, calculated using line segment SEs with p = 3,p = 5, and p = 7 pixels in length, fordifferent target objects in a DAIS 7915 hyperspectral scene over Pavia, Italy. (a) Small building. (b) River. (c) Shaded road. (d) Large building.
influenced by the relation between and the length in pixelsof the object. It should be noted that, for pixels belonging towide (with respect to the line segment SE) objects of similarspectral properties, several distinct orientations might outputsimilar distance values [see Fig. 2(b)]. In the case above, linesegment SEs having an increased length may be required inorder to accurately characterize the object.
IV. APPLICATIONS
This section presents two applications of extended morpho-logical transformations focused on the extraction of relevantfeatures for hyperspectral data classification, respectively domi-nated by agricultural and urban features. In the first application,a portion of an AVIRIS imaging spectrometer dataset taken overan agricultural test site located in Salinas Valley, CA, is usedto investigate the accuracy of extended MM sequences in dis-criminating among several agricultural classes with very similarspectral signatures. In the second application, data collected bythe DAIS 7915 airborne imaging spectrometer over the city ofPavia, Italy, were used to test the performance of the morpho-logical filtering techniques above in a more complex scenariodominated by nested regions and directional urban features. Inboth cases, the proposed analysis system is based on the archi-tecture shown in Fig. 3. First, relevant morphological featuresare extracted from the original image by using sequences of
Fig. 3. General architecture of the proposed classification system.
multichannel MM filters. Although morphological filtering usu-ally reduces the dimensionality of the original hyperspectral im-ages, redundancies may still be present in the resulting vectorsafter the filtering process. Therefore, the application of featureextraction techniques is of great interest to select the most rel-evant morphological features for class discrimination. In pre-vious literature, Lee and Landgrebe’s decision boundary fea-ture extraction (DBFE) [39], [40] has been demonstrated to be avery powerful approach for extracting all the necessary features

PLAZA et al.: DIMENSIONALITY REDUCTION AND CLASSIFICATION OF HYPERSPECTRAL IMAGE DATA 473
(a) (b)
Fig. 4. (a) Spectral band at 488 nm of an AVIRIS hyperspectral imagecomprising several agricultural fields in Salinas Valley, CA, and a subscene ofthe dataset (Salinas A), outlined by a white rectangle. (b) Land-cover groundtruth classes.
for classification of morphological feature vectors [21]. Lee andLandgrebe have extended DBFE for neural networks [41]. Thisapproach has the advantage of preserving the nature of neuralnetworks. Since neural networks can define quite complex de-cision boundaries without assuming any underlying probabilityfunctions, and the DBFE algorithm can find a relevant subspacein a way no other feature extraction method can, they can to-gether provide a helpful insight into the valued applications. Inour research, the adopted neural network classifier uses standardbackpropagation for supervised learning [4]. This technique canbe used to perform efficient nonlinear supervised classification.
A. Experiment 1: AVIRIS Data Over Salinas Valley
This subsection is a report on the application of the pro-posed analysis system to real hyperspectral data collected bythe AVIRIS imaging spectrometer over Salinas Valley, CA,in 1998. The full scene consists of 512 lines 217 sampleswith 192 spectral bands from 0.4–2.5 m after removing thewater absorption bands [7], [42], and it was taken at a lowaltitude with a 3.7-m-pixel size. These data were availableonly as at-sensor radiance data and include vegetables, baresoils and vineyard fields. Fig. 4(a) shows the entire scene anda subscene of the dataset (called hereinafter Salinas A), whichcomprises 83 86 pixels and is dominated by directional fea-tures. Fig. 4(b) shows available ground truth regions. Groundtruth is available for nearly half of the entire Salinas scene.A random sample of less than 2% of the pixels was chosenfrom the known ground truth of the 15 land-cover classes inFig. 4(b). The resulting number of training and testing pixels foreach class are given in Table II. Morphological sequences wereconstructed for the selected training samples, and DBFE wasapplied to extract the most relevant features from the sequencesabove. The resulting features were used to train a backpropa-gation neural-network-based classifier with one hidden layer,where the number of hidden neurons was selected empirically.The general rule was to select the number of hidden neurons asthe square root of the product of the number of input features
TABLE IIINFORMATION CLASSES AND SAMPLES FOR EXPERIMENT 1
(SALINAS AVIRIS SCENE)
and information classes [22]. However, in all cases, severalconfigurations of the hidden layer were tested and the one thatgave the higher overall accuracies was reported. In the twoconsidered experiments, the best performance was generallyobserved by selecting the number of hidden neurons as twicethe number of input features. The trained classifier was thenapplied to the remaining 98% of the known ground truth pixelsin the scene, yielding the results depicted in Fig. 5 for a varietyof input morphological sequences.
In order to ensure the fairest possible comparison betweenthe different feature extraction approaches tested, it is impor-tant to find the most appropriate parameter values for eachmethod. Then, prior to a full examination and discussion ofthe results, it is important to outline parameter values used forthe construction of morphological sequences. Fig. 5(a)–(c),respectively, plots the overall test classification accuracies,obtained after combining the DBFE-based system with multi-channel EDMP, EOASF, and ECASF sequences, as a functionof the number of opening/closing operations. For compar-ative purposes, standard differential morphological profiles(DMPs), open–close alternated sequential filters (OASFs), andclose–open alternated sequential filters (CASFs) were alsoconstructed. These methods are equivalent to EDMP, EOASF,and ECASF, respectively, but they are based on monochannelmorphological processing of the first principal component. Itshould be noted that, according to our experiments, the use ofother widely used component transformations such as the max-imum noise fraction or singular value decomposition does nothave a significant impact on the performance of DMP, OASF,and CASF methods. Three different distance metrics (SAD,SID, and HMMID) were used for the development of EDMP,EOASF, and ECASF sequences, while the base distance forthe construction of DMP, OASF, and CASF sequences was theEuclidean distance (ED). The 3-D graphs in Fig. 5(d)–(f) plottest accuracies, produced by using SOMP-based morphologicalsequences, as a function of both the length in pixels and thenumber of directions considered in the design of line segment

474 IEEE TRANSACTIONS ON GEOSCIENCE AND REMOTE SENSING, VOL. 43, NO. 3, MARCH 2005
(a) (b) (c)
(d) (e) (f)
Fig. 5. Overall test accuracies obtained after applying the proposed classification system, based on morphological sequences, to the Salinas AVIRIS scene.(a) DMP- and EDMP-based sequences. (b) OASF- and EOASF-based sequences. (c) CASF- and ECASF-based sequences. (d)–(f) SOMP-based sequences.
SEs. Again, the SAD [Fig. 5(d)], SID [Fig. 5(e)], and HMMID[Fig. 5(f)] distance metrics were considered for the constructionof the sequences.
From Fig. 5(a)–(c), it is clear that the pixelwise width ofinteresting patterns in the Salinas AVIRIS scene makes nineopening/closing iterations a reasonable parameter selection forboth multi and monochannel morphological methods tested inthis experiment (the number of openings is always equal tothe number of closings). In particular, the best overall accura-cies in Fig. 5(a) were achieved when EDMP sequences wereconstructed using the SID distance (EDMP-SID hereinafter).Both EDMP-HMMID and EDMP-SAD performed slightlybetter than DMP-ED. It should be noted that EOASF-SIDalso produced slightly better results than EOASF-SAD andEOASF-HMMID [see Fig. 5(b)], while ECASF-SID improvedboth ECASF-SAD and ECASF-HMMID [see Fig. 5(c)]. Thisfact points out that SID has a better ability than HMMID andSAD in characterizing spectral properties of land-cover classesin this particular scene. However, DMP-ED produced clearlybetter results than all EOASF- and ECASF-based approaches,as shown in Fig. 5(b) and (c). This confirms the effectivenessof two-sided morphological profiles with regards to one-sidedalternate filters in this example. Finally, the higher accuraciesfor SOMP-based sequences were also found when the SIDdistance was used [Fig. 5(e)]. A general trend observed inFig. 5(d)–(f) is that SOMP series produced the best classifica-tion scores when line segment SEs having nine pixels in lengthand eight equidistant directions were used. As a result, ourfinal choice for the construction of scale-orientation sequencesin this experiment was eight directions and . In gen-eral, the best results for accuracy assessments were obtained
from utilizing a moderate number of scales and orientations.The construction of morphological feature vectors with verylarge data dimensions generally caused a loss in classificationperformance.
With the above parameter settings in mind, the dimensionof feature vectors after morphological filtering, number offeatures used for classification after DBFE feature extraction,overall (OA), average (AVE) and individual test accuracies inpercentage exhibited by the aforementioned classifiers on theSalinas dataset are given in Table III. For comparative purposes,classification accuracies obtained using the original spectralinformation in the hyperspectral image are also reported. TheOA and AVE accuracies were calculated as follows. Let usassume that ground truth categories are given,and spectrum data of test samples from the categories areobserved for . We classify all test samples into oneof the categories by a certain classification method. Let the term
represent the number of test samples that actually belongto class and are classified into , for . Therow total is equal to the sample number from ,
and the column total denotes the number of samplesclassified into . Let be the total number ofsamples. The following coefficients for accuracy assessmentare used in this work:
OA AVE (29)
As shown in Table III, DBFE did not require many featuresto produce high test accuracies. As a result, it was possible, in

PLAZA et al.: DIMENSIONALITY REDUCTION AND CLASSIFICATION OF HYPERSPECTRAL IMAGE DATA 475
TABLE IIIDIMENSION OF FEATURE VECTORS (DFV), NUMBER OF FEATURES (NOF) USED FOR CLASSIFICATION AFTER DBFE FEATURE EXTRACTION, OVERALL (OA),
AVERAGE (AVE), AND INDIVIDUAL TEST ACCURACIES IN PERCENTAGE OBTAINED AFTER APPLYING THE PROPOSED CLASSIFICATION SYSTEM, BASED ON
MORPHOLOGICAL SEQUENCES WITH NINE OPENING/CLOSING OPERATIONS, TO THE SALINAS AVIRIS SCENE (SOMP-BASED FEATURES WERE OBTAINED
BY APPLYING LINE SEGMENT STRUCTURING ELEMENTS WITH LENGTH OF NINE PIXELS AND EIGHT ORIENTATIONS). CLASSIFICATION RESULTS
OBTAINED USING THE ORIGINAL SPECTRAL INFORMATION OF THE HYPERSPECTRAL SCENE ARE ALSO INCLUDED FOR COMPARISON
most cases, to keep the number of features very low without sac-rificing OA and AVE scores. As can be seen, the OAs exhibitedby both EDMP- and SOMP-based approaches are very high forthe three distance measures (i.e., 93.85%, and 94.34% for theSAD, 94.12% and 95.27% for the SID, and 93.08% and 95.03%for the HMMID). These scores are sensibly higher than the ac-curacy obtained using the original spectral information of theimage (i.e., 87.55%). It is important to note that the dimensionof feature vectors (DFV) of the original spectral information inTable III is 192. Since the network was trained using 695 sam-ples, the performance of the baseline method suffers from lim-ited training samples. However, we observed, that even whenthe number of training samples was increased to 22 600 (i.e.,half of the available ground-truth), the results obtained by theclassifier based on the original spectral information could notimprove those found by EDMP- and SOMP-based approachesusing only 695 training samples, as pointed out below. Finally,the OAs provided by EOASF- and ECASF-based approaches(i.e., 84.31%, and 77.05% for the SAD, 87.89%, and 80.23%for the SID, and 86.27% and 78.49% for the HMMID) are alllower than the OA produced by DMP-ED (i.e., 88.21%).
Comparisons between multichannel sequential filters (i.e.,EDMP versus SOMP) point out that SOMP-based sequencesprovide slightly better classification accuracies, although thenumber of features required to produce optimal scores weresmaller in the case of EDMP. However, further analysis ofthe results reveals important differences between the twoconsidered classifiers. For example, the accuracy exhibitedby SOMP-SID on directional features present in the SalinasA subscene [see Fig. 4(a)] is significantly higher than theone exhibited by EDMP-SID (it should be noted that theromaine lettuce is at different weeks since planting and withgrowth increasingly covering the soil, thus resulting in distinctspectral signatures at the different lettuce romaine fields).From Table III, it is also clear that SOMP-SID outperformsEDMP-SID in the six Salinas A classes in terms of individualtest accuracies, a fact that leads to a significant decrease in theAVE score associated to EDMP-SID with regard to the one
(a) (b)
Fig. 6. (a) Band at 639 nm of a DAIS 7915 scene over Pavia city, Italy.(b) Available ground truth classes.
TABLE IVINFORMATION CLASSES AND SAMPLES FOR EXPERIMENT 2
(DAIS 7915 PAVIA SCENE)
exhibited by SOMP-SID. This last item, which also applies tothe SAD and HMMID distances, confirms the effectivenessof SOMP-based sequences in exploiting both the spectral andorientation information provided by directional features in thescene.
As a final comment, it should be noted that increasing thenumber of training samples to half of the available ground truthdid not have a significant impact on the performance of EDMP-

476 IEEE TRANSACTIONS ON GEOSCIENCE AND REMOTE SENSING, VOL. 43, NO. 3, MARCH 2005
(a) (b) (c)
(d) (e) (f)
Fig. 7. Overall test accuracies obtained after applying the proposed classification system, based on morphological sequences, to the Pavia DAIS 7915 scene.(a) DMP- and EDMP-based sequences. (b) OASF- and EOASF-based sequences. (c) CASF- and ECASF-based sequences. (d)–(f) SOMP-based sequences.
TABLE VDIMENSION OF FEATURE VECTORS (DFV), NUMBER OF FEATURES (NOF) USED FOR CLASSIFICATION AFTER DBFE FEATURE EXTRACTION, OVERALL (OA),
AVERAGE (AVE) AND INDIVIDUAL TEST ACCURACIES IN PERCENTAGE OBTAINED AFTER APPLYING THE PROPOSED CLASSIFICATION SYSTEM, BASED ON
MORPHOLOGICAL SEQUENCES WITH 10 OPENING/CLOSING OPERATIONS, TO THE PAVIA DAIS 7915 SCENE (SOMP-BASED FEATURES WERE OBTAINED
BY APPLYING LINE SEGMENT STRUCTURING ELEMENTS WITH LENGTH OF 10 PIXELS AND 12 ORIENTATIONS). CLASSIFICATION RESULTS
OBTAINED USING THE ORIGINAL SPECTRAL INFORMATION OF THE HYPERSPECTRAL SCENE ARE ALSO INCLUDED FOR COMPARISON
and SOMP-based methods; the observed increase was alwaysbelow 1% in terms of OA. A more significant improvementwas observed when the original spectral information was used.Specifically, the OA increased to 92.14%, which is below theOAs obtained by using EDMP- and SOMP-based classifierswith less training samples. This fact reveals that the proposedmorphological methods can perform well with limited trainingsamples. In order to fully assess the effectiveness of the pro-posed approaches, we must take into account that large andspectrally homogeneous regions dominate the Salinas scene. Asa result, a very simple behavior of morphological profiles wasgenerally observed, where each feature had only one or two sig-nificant derivative maxima. Complex scenarios such as urbanenvironments are, however, characterized by small directional
features with several significant derivative maxima and nestedregions. As a result, further experimentation using real hyper-spectral data collected over urban areas is rather pertinent.
B. Experiment 2: DAIS 7915 Data Over Pavia City, Italy
For this trial, data from the DAIS 7915 airborne imagingspectrometer of DLR were used. The data were collected at1500 m over the city of Pavia, Italy. The flight altitude waschosen as the lowest available for the airplane, which resultedin a 5-m spatial resolution [43]. Fig. 6(a) shows a 400 400pixel scene collected at 639 nm by the DAIS 7915 imagingspectrometer, which reveals a dense residential area on oneside of the river, as well as open areas and meadows on theother side. Ground truth information is available for several

PLAZA et al.: DIMENSIONALITY REDUCTION AND CLASSIFICATION OF HYPERSPECTRAL IMAGE DATA 477
areas of the scene [see Fig. 6(b)], comprising the followingland-cover classes: 1) Water; 2) Trees; 3) Asphalt; 4) Parkinglot; 5) Bitumen; 6) Brick roofs; 7) Meadows; 8) Bare soil; 9)Shadows. Following a previous research study on this scene[22], we take into account only 40 spectral bands of reflec-tive energy, and thus skip thermal infrared bands and middleinfrared bands above 1958 nm because of low SNR in thosebands. A DBFE-based classifier was trained with a variety ofmorphological sequences, constructed for a sample of 5% ofthe pixels from the ground truth of the nine classes in Fig. 6(b)where the information classes and training and test samples arelisted in Table IV.
A summary of the overall classification accuracies obtainedby the above system for test data as a function of the number ofopening/closing operations for multichannel (EDMP, EOASF,and ECASF) and monochannel (DMP, OASF, and CASF)morphological sequences is shown in Fig. 7(a)–(c). From thisfigure, it is clear that classification based on EDMP and DMPsequences was more accurate than classification based onEOASF/ECASF, and on OASF/CASF. In all cases, the SIDdistance was found to be the most effective in characterizingspectral features. A maximum in overall classification accuracywas generally observed when the number of opening/closingoperations was set to 10. It is also interesting to note that theoverall accuracies for the EDMP-based sequences did notimprove much those found using DMP-ED sequences in thisexperiment. This fact provides an objective confirmation of ourintrospection: that scale-orientation information is required inorder to complement spectral information when complex imagescenes are to be analyzed.
Fig. 7(d)–(f) plots test classification accuracies obtained bySOMP sequences as a function of the length in pixels (scale)and number of directions (orientation). The difference from Ex-periment 1 is that much more improvement was achieved as thenumber of directions was increased. A probable reason for thisimprovement is that the DAIS 7915 scene contains proportion-ally more straight lines with arbitrary orientations and nestedregions than the AVIRIS scene. However, when the number ofdirections was very high, a loss in classification performancewas generally observed. With the above results in mind, we useline segment SEs with pixels in length and 12 orienta-tions to create SOMP-based sequences in this experiment. Asdepicted in Table V, SOMP-based approaches clearly outper-formed their EDMP-based counterparts. However, in terms ofboth OA and AVE accuracies, using the feature set consistingof EDMP-based sequences gave very similar results to the caseswhen DMP-ED and the original spectral information in the hy-perspectral image were used. Interestingly, SOMP-based pro-files produced very accurate classification results for the classesdominated by small directional features (Asphalt, Brick roofs,and Shadows). The incorporation of scale-orientation informa-tion also helped characterize large oriented objects (Water) andclasses given by a combination of homogeneous regions and di-rectional features (Bitumen, Parking lot, Bare soil). The aboveresults were also observed when the number of training sampleswas increased to half of the available ground truth. Specifically,
SOMP achieved at least 96% OA for the three considered dis-tances and outperformed all the other approaches including thespectral information, which achieved 92.79% OA.
In conclusion, we can state that experiments have demon-strated that EDMPs and SOMPs can work efficiently at local andglobal scales. This success is achieved by the fact that they pro-vide a final classification output that is coherent in both spectraland spatial terms for a complex, real-world analysis scenario.Results in this section also point to the importance of having asystem that can resolve both scale- and orientation-based spec-tral variations due to the integration of spatial/spectral infor-mation. This significance may also lead to new fields of ap-plication. For instance, in certain parts of the Pavia scene wecan appreciate a more regular urban structure. Scale-orientationinformation may not be fully required in order to characterizethese features. However, EDMPs alone may be unreliable whenused for the accurate modeling of other areas in the scene wherethe shape and location of buildings is more irregular. This em-phasizes the possibility of combining both approaches in orderto solve problems related to city classification.
V. CONCLUSION AND FUTURE WORK
This paper has described new morphological filtering tech-niques for hyperspectral image data analysis that take into ac-count both the spatial and spectral information simultaneously.The considered approaches were: 1) extended differential mor-phological profiles; 2) extended alternated sequential filters; and3) scale-orientation morphological profiles. The above methodswere used in this paper to build feature vectors for supervisedclassification using DBFE for neural networks. Experimental re-sults using two real hyperspectral datasets have demonstratedthat morphological operations, extended to multichannel im-agery by using well-known spectral-based distance metrics suchas SAD, SID, and HMMID, provide an excellent tool for clas-sification purposes. In addition, morphological operations pre-serve the relevant spatial/spectral information that allows for theseparation of classes. Although the test data were different inmany ways (e.g., application areas, spatial, and spectral reso-lution, radiance/reflectance data and sensor SNR), high overallaccuracies were achieved for both datasets. In particular, featureextraction methods based on multichannel differential morpho-logical operations were more effective than other approachesthat consider spatial and spectral features separately. It was alsofound in the experiments that the incorporation of scale-orien-tation information to morphological profiles allows for accuratemodeling of hyperspectral image scenes dominated by compleximage structures, such as those present in urban areas.
As with any new approach, there are some unresolved issuesthat may present challenges over time. Specifically, the pro-posed techniques are particularly well suited to separate slightlydifferent spectral features that are clearly distinct in the spatialdomain. However, in order to associate together features withvery similar spectral properties but different spatial properties,further work is still needed. In such cases, joint spatial–spectralclassifiers may need to be replaced by more spectrally guided

478 IEEE TRANSACTIONS ON GEOSCIENCE AND REMOTE SENSING, VOL. 43, NO. 3, MARCH 2005
techniques. A drawback in the proposed approaches has to dowith the need to heed a range of morphological filters withincreasing scale and orientation features, which may result ina heavy computational burden when processing high-dimen-sional data. This phenomenon is particularly important in thecase of images with large and spectrally homogeneous regions.In order to empower the proposed techniques with near real-timecapabilities, we currently experiment with their efficient im-plementation on high-performance parallel computing architec-tures such as field-programmable gate arrays and Beowulf-typeclusters.
ACKNOWLEDGMENT
The authors gratefully thank P. Gamba for providing theDAIS 7915 data over Pavia, Italy, along with the training andtest sets. The authors would also like to thank J. A. Gualtierifor his valuable comments and also for his presentation of apreliminary version of this research at the IEEE Workshop onAdvances in Techniques for Analysis of Remotely Sensed Data,a workshop honoring Prof. D. A. Landgrebe’s outstandingcareer that has served as a guide and inspiration to the authors.In addition, the authors would like to express their gratitude toC.-I Chang, R. O. Green, and J. C. Tilton for their support tothis research, and to J. Chanussot for some helpful discussionson multichannel morphological operations. The authors greatlyappreciate the suggestions and comments by the anonymousreviewers and the linguistic revision of this paper by A. Curado(Department of English at UEX).
REFERENCES
[1] D. A. Landgrebe, Signal Theory Methods in Multispectral RemoteSensing. Hoboken, NJ: Wiley, 2003.
[2] R. O. Green et al., “Imaging spectroscopy and the Airborne Vsible/In-frared Imaging Spectrometer (AVIRIS),” Remote Sens. Environ., vol. 65,pp. 227–248, 1998.
[3] C.-I Chang, Hyperspectral Imaging: Techniques for Spectral Detectionand Classification. New York: Kluwer/Plenum, 2003.
[4] X. Jia, J. A. Richards, and D. E. Ricken, Remote Sensing Digital ImageAnalysis: An Introduction. Berlin, Germany: Springer-Verlag, 1999.
[5] L. Jimenez and D. A. Landgrebe, “Supervised classification in high-di-mensional space: Geometrical, statistical, and asymptotical propertiesof multivariate data,” IEEE Trans. Syst., Man, Cybern. C, vol. 28, pp.39–54, 1998.
[6] D. W. Scott, “The curse of dimensionality and dimension reduction,”in Multivariate Density Estimation: Theory, Practice, and Visualiza-tion. New York: Wiley, 1992, ch. 7, pp. 195–217.
[7] S. Kaewpijit, J. Le Moigne, and T. El-Ghazawi, “Automatic reductionof hyperspectral imagery using wavelet spectral analysis,” IEEE Trans.Geosci. Remote Sens., vol. 41, no. 4, pp. 863–871, Apr. 2003.
[8] F. Tsai and W. Philpot, “Derivative analysis of hyperspectral data,” Re-mote Sens. Environ., vol. 66, pp. 41–51, 1998.
[9] L. M. Bruce, C. H. Koger, and J. Li, “Dimensionality reduction of hyper-spectral data using discrete wavelet transform feature extraction,” IEEETrans. Geosci. Remote Sens., vol. 40, no. 10, pp. 2331–2338, Oct. 2002.
[10] V. Madhok and D. Landgrebe, “Spectral-spatial analysis of remotesensing data: An image model and a procedural design,” Ph.D. disser-tation, School of Elect. Eng. Comput. Sci., Purdue Univ., Lafayette, IN,1998.
[11] A. Plaza, P. Martinez, R. Perez, and J. Plaza, “Spatial/spectral end-member extraction by multidimensional morphological operations,”IEEE Trans. Geosci. Remote Sens., vol. 40, no. 9, pp. 2025–2041, Sep.2002.
[12] A. Plaza, “Development, validation, and testing of a new morpholog-ical method for hyperspectral image analysis that integrates spatial andspectral information,” Ph.D. dissertation, Comput. Sci. Dept., Univ. Ex-tremadura, Cáceres, Spain, 2002.
[13] J. Serra, Image Analysis and Mathematical Morphology. New York:Academic, 1982.
[14] P. Soille, Morphological Image Analysis: Principles and Applications,2nd ed. Berlin, Germany: Springer-Verlag, 2003.
[15] G. Matheron and J. Serra, “The birth of mathematical morphology,” inProc. 6th Intl. Symp. Mathematical Morphology, H. Talbot and R. Beare,Eds., Sydney, Australia, 2002, pp. 1–16.
[16] S. R. Sternberg, “Grayscale morphology,” Comput. Vision GraphicsImage Process., vol. 35, pp. 333–355, 1986.
[17] J. Goutsias and H. Heijmans, “Fundamenta morphologicae mathemat-icae,” Fund. Inf., vol. 41, pp. 1–30, 1999.
[18] C. Ronse and H. Heijmans, “The algebraic basis of mathematicalmorphology: II. Openings and closings,” Comput. Vis., Graph., ImageProcess.: Image Understand., vol. 54, pp. 74–97, 1991.
[19] M. Pesaresi and J. A. Benediktsson, “A new approach for the morpho-logical segmentation of high resolution satellite imagery,” IEEE Trans.Geosci. Remote Sens., vol. 39, no. 2, pp. 309–320, Feb. 2001.
[20] M. Pesaresi and I. Kannellopulos, “Detection of urban features usingmorphological based segmentation and very high resolution remotelysensed data,” in Machine Vision and Advanced Image Processing in Re-mote Sensing, I. Kanellopoulos, G. G. Wilkinson, and T. Moons, Eds,Berlin, Germany: Springer-Verlag, 1999.
[21] J. A. Benediktsson, M. Pesaresi, and K. Arnason, “Classification andfeature extraction for remote sensing images from urban areas based onmorphological transformations,” IEEE Trans. Geosci. Remote Sens., vol.41, no. 9, pp. 1940–1949, Sep. 2003.
[22] J. A. Palmason, J. A. Benediktsson, and K. Arnason, “Morphologicaltransformations and feature extraction for urban data with high spectraland spatial resolution,” in Proc. IGARSS, Toulouse, France, 2003.
[23] J. Chanussot, J. A. Benediktsson, and M. Pesaresi, “On the use of mor-phological alternated sequential filters for the classification of remotesensing images from urban areas,” in Proc. IGARSS, Toulouse, France,2003.
[24] J. Goutsias, H. Heijmans, and K. Sivakumar, “Morphological opera-tors for image sequences,” Comput. Vis. Image Understand, vol. 62, pp.326–346, 1995.
[25] G. Louverdis, M. I. Vardavoulia, I. Andreadis, and Ph. Tsalides, “A newapproach to morphological color processing,” Pattern Recognit., vol. 35,pp. 1733–1741, 2002.
[26] I. Pitas and C. Kotropoulos, “Multichannel L filters based on marginaldata ordering,” IEEE Trans. Signal Process., vol. 42, pp. 2581–2595,1994.
[27] K. Tang, J. Astola, and Y. Neuvo, “Nonlinear multivariate image filteringtechniques,” IEEE Trans. Image Process., vol. 4, no. 6, pp. 788–798, Jun.1995.
[28] A. Plaza, P. Martinez, R. Perez, and J. Plaza, “Spatial/spectral analysisof hyperspectral image data,” presented at the IEEE Workshop Advancesin Techniques for Remotely Sensed Data Analysis, Greenbelt, MD, 2003.
[29] , “Hyperspectral image analysis by scale-orientation morphologicalprofiles,” in Proc. SPIE Conf. Image and Signal Process. for RemoteSensing, Barcelona, Spain, 2003.
[30] P. Soille and M. Pesaresi, “Advances in mathematical morphology ap-plied to geoscience and remote sensing,” IEEE Trans. Geosci. RemoteSens., vol. 40, no. 9, pp. 2042–2055, Sep. 2002.
[31] P. Soille and H. Talbot, “Directional morphological filtering,” IEEETrans. Pattern Anal. Machine Intell., vol. 23, no. 11, pp. 1313–1329,Nov. 2001.
[32] N. Keshava and J. F. Mustard, “Spectral unmixing,” IEEE SignalProcess. Mag., vol. 19, no. 1, pp. 44–57, Jan. 2002.
[33] C.-I Chang, “An information theoretic-based approach to spectralvariability, similarity, and discriminability for hyperspectral imageanalysis,” IEEE Trans. Inform. Theory, vol. 46, no. 5, pp. 1927–1932,Aug. 2000.
[34] Q. Du and C.-I Chang, “Hidden Markov model approach to spectral anal-ysis for hyperspectral imagery,” Opt. Eng., vol. 40, pp. 2277–2284, 2001.
[35] J. Crespo, J. Serra, and R. Schafer, “Theoretical aspects of morpholog-ical filters by reconstruction,” Signal Process., vol. 47, pp. 201–225,1995.
[36] I. Bloch, “Geodesic balls in a fuzzy set and fuzzy geodesic mathematicalmorphology,” Pattern Recognit., vol. 33, pp. 897–905, 2000.
[37] A. Müeller, A. Hausold, and P. Strobl, “HySens—DAIS/ROSIS imagingspectrometers at DLR,” in Proc. VIII SPIE Intl. Symp. Remote Sensing,Toulouse, France, 2001.

PLAZA et al.: DIMENSIONALITY REDUCTION AND CLASSIFICATION OF HYPERSPECTRAL IMAGE DATA 479
[38] M. Lybanon, “Maltese front variability from satellite observations basedon automated detection,” IEEE Trans. Geosci. Remote Sens., vol. 34, no.5, pp. 1159–1165, Sep. 1996.
[39] C. Lee and D. A. Landgrebe, “Feature extraction based on decisionboundaries,” IEEE Trans. Pattern Anal. Machine Intell., vol. 15, no. 4,pp. 388–400, Apr. 1993.
[40] J. A. Benediktsson, J. R. Sveinsson, and K. Arnason, “Classification andfeature extraction of AVIRIS data,” IEEE Trans Geosci. Remote Sens.,vol. 33, no. 6, pp. 1194–1205, Nov. 1993.
[41] C. Lee and D. A. Landgrebe, “Decision boundary feature extraction forneural networks,” IEEE Trans. Neural Networks, vol. 8, no. 1, pp. 75–83,Jan. 1997.
[42] J. A. Gualtieri, S. R. Chettri, R. F. Cromp, and L. F. Johnson, “Supportvector machine classifiers as applied to AVIRIS data,” in Summaries ofthe 8th JPL Airborne Earth Science Workshop, R. O. Green, Ed., 1999,JPL Pub. 99–17, pp. 217–227.
[43] F. Dell’Aqua, P. Gamba, and A. Ferrari, “Exploiting spatial and spectralinformation for classifying hyperspectral data in urban areas,” in Proc.IGARSS, Toulouse, France, 2003.
Antonio Plaza (M’05) received the M.S. and Ph.D.degrees in computer science from the Universityof Extremadura, Cáceres, Spain, in 1997 and 2002,respectively.
He is currently an Associate Professor withthe Computer Science Department, University ofExtremadura, since 2000, where he was a ResearchAssociate and Assistant Professor from 1997 to1999. He was also a Visiting Researcher with theRemote Sensing Signal and Image Processing Lab-oratory, University of Maryland Baltimore County,
and also with the Applied Information Sciences Branch, Goddard Space FlightCenter, Greenbelt, MD, and the AVIRIS Group, Jet Propulsion Laboratory,Pasadena, CA. His main research interests span computer vision, imageprocessing, pattern recognition, and development and efficient implementationof hyperspectral image analysis algorithms on massively parallel computingfacilities and VLSI hardware-based computer architectures. He has authored orcoauthored more than 70 publications including journal papers and conferenceproceedings.
Dr. Plaza is currently serving as a reviewer for the IEEE TRANSACTIONS
ON GEOSCIENCE AND REMOTE SENSING, IEEE TRANSACTIONS ON IMAGE
PROCESSING, IEEE TRANSACTIONS ON PARALLEL AND DISTRIBUTED SYSTEMS,IEEE TRANSACTIONS ON INFORMATION THEORY, and IEEE GEOSCIENCE AND
REMOTE SENSING LETTERS.
Pablo Martínez received the Ph.D. degree in physicsfrom the University of Granada, Granada, Spain, in1992.
He has been a Professor of computer sciencewith the University of Extremadura, Cáceres, Spain,since 1985. He is currently the Head Scientist ofthe Neural Networks and Signal Processing Group(GRNPS). He has held Visiting Researcher posi-tions at the Applied Information Sciences Branch,Goddard Space Flight Center, Greenbelt, MD, theDepartment of Electrical Engineering, University of
Maryland, College Park, and the AVIRIS Group, Jet Propulsion Laboratory,Pasadena, CA. His main research interests include remote sensing, digitalimage analysis, hardware-based architectures, operating systems managementand configuration, and neural-network-based pattern recognition.
Dr. Martínez has been a reviewer for the IEEE TRANSACTIONS ON
GEOSCIENCE AND REMOTE SENSING.
Javier Plaza received the M.Sc. degree in computerscience from the University of Extremadura, Cáceres,Spain, in 2002, where he is currently pursuing thePh.D. degree.
He is currently an Assistant Professor in theComputer Science Department, University of Ex-tremadura. His current research work is focusedon the development of efficient implementationsof nonlinear mixture model-based algorithms forabundance estimation of materials in hyperspectralscenes. He is also involved in the design and config-
uration of commodity cluster computing architectures for high-performancehyperspectral analysis. Other major research interests include development ofquantitative and comparative applications for remote sensing, and the study ofconfiguration and training of neural network architectures for hyperspectralimage analysis.
Rosa Pérez received the M.S. degree in mathematicsfrom the University of Extremadura, Cáceres, Spain,in 1985, and the Ph.D. degree in computer sciencefrom the Polytechnic University of Madrid, Madrid,Spain, in 1995.
She is currently a Professor of computer sciencein the Computer Science Department, Universityof Extremadura, Cáceres, where she has been since1985. Her main research interests include neuralnetworks, systolic array- and FPGA-based design,pattern recognition, and signal processing.