dimensional analysis of airline quality - bauer … dimensional analysis of airline quality...
TRANSCRIPT

Dimensional Analysis of Airline Quality
Everette S. Gardner, Jr., Ph.D. Decision and Information Sciences Department
C. T. Bauer College of Business University of Houston
4800 Calhoun Houston, Texas 77204-6021
Telephone 713-743-4720
November 7, 2003

Dimensional Analysis of Airline Quality
Dimensional analysis is widely used in physics and engineering to contribute to the
modeling of systems in which variables are measured in incompatible units. I
used dimensional analysis to rank the airlines in overall quality based on U.S.
Department of Transportation data: on-time arrivals, denied boardings,
mishandled baggage, and customer complaints. The results conflict with the well
known Airline Quality Rating (AQR), published since 1991. Weighted averages of
quality data in the AQR are dimensionally incorrect and produce illogical rankings
that are virtually independent of on-time arrivals. For example, the 2001 AQR
ranks Alaska Airlines first in overall quality, despite the worst on-time performance
in the industry. Dimensional analysis places Alaska Airlines near the bottom of the
industry, seventh in overall quality.

1
Dimensional Analysis of Airline Quality
Introduction
In physics and engineering, dimensional analysis is a standard
methodology for reducing physical properties such as energy and acceleration to
their fundamental dimensions of length, mass, and time. In general, dimensional
analysis facilitates mathematical modeling, usually by reducing the number of
variables, and avoids the nuisance of incompatible units. For example,
acceleration is expressed via dimensional analysis as length or distance per unit of
time squared. Whether distance is measured in English or metric units does not
matter.
In operations research, Epstein (1957) appears to have been the first to
recognize the value of dimensional analysis. He presented a general procedure,
based on Bridgman’s (1922) tutorial for physicists, for computing dimensionless
indices to assist in choosing between competing engineering designs. Naddor
(1966) demonstrated that dimensional analysis can simplify solutions and assist in
interpreting the behavior of queuing, inventory lot-sizing, and linear programming
models. Since Naddor’s work appeared, there have been only a few published
applications of dimensional analysis in operations research. These include
inventory modeling (Sivazlian, 1971; Ehrhardt, 1979; Silver, 1983; Ehrhardt and
Mosier, 1984; Vignaux and Jain, 1988), warehouse layout (Mahoney and Ventura,
1985), logistics networks (Daganzo, 1987), facility location (Starr, 1996), supplier

2
performance evaluation (Willis, Huston, and Pohlkamp, 1993; Li, Fun, and Hung,
1997), and selection of industrial robots (Braglia and Gabbrielli, 2000).
It is unfortunate that more operations researchers are not aware of
dimensional analysis. Huntley (1951) lists a number of ways that dimensional
analysis can serve the physicist as an analytical tool. They are repeated here
because they apply to operations research as well:
1. In aiding the memory to reconstitute forgotten formulae and equations.
2. In checking algebraic errors, which are revealed by the lack of dimensional homogeneity of equations.
3. In providing a conversion factor for changing from one system of units to
another. 4. In interpreting the behavior of scale models and capitalizing the information
gained from them.
5. In guiding the experimenter in the selection of experiments capable of yielding significant information, and in the avoidance of redundant experiments.
6. In obtaining partial solutions of problems too complex for ordinary
mathematical analysis.
This paper demonstrates several of Huntley’s points in applying
dimensional analysis to the evaluation of airline quality. The results differ
substantially from the Airline Quality Rating (AQR), published annually since 1991
by Bowen and Headley (2003). The AQR ranks U.S. domestic airlines in overall
quality using weighted averages of various data published by the U.S. Department
of Transportation (DOT). Since its inception, the AQR annual report has received
a great deal of attention in the news media. For examples, see Bowen and

3
Headley (2003), who list television programs, newspapers, and magazines that
have featured the AQR. In the airline industry, the AQR appears to be generally
accepted judging from the awards its authors have received from organizations
such as the American Institute of Aeronautics and Astronautics and the Travel and
Transportation Research Association.
The AQR weighted averages are shown to be dimensionally incorrect (see
Huntley’s second point above) and seriously misleading. To illustrate the problem,
using Naddor’s (1966) notation, let [A] represent the dimension of some quantity
A. If A + B = C, then [A] = [B] = [C]. This rule is referred to as dimensional
homogeneity, that is “it makes no sense to add apples and oranges,” which is
precisely the problem with the AQR. The AQR overall quality rating is the sum of
a percentage of on-time arrivals, a rate of mishandled bags per 1,000 passengers,
a rate of denied boardings per 10,000, and a rate of customer complaints per
100,000.
Perhaps the most bizarre airline rankings occurred in 2001, when Bowen
and Headley placed Alaska Airlines first in overall quality despite an on-time arrival
rate of 69%, the worst in the industry. This paper corrects the defects in the AQR
by developing a dimensionless value function for ranking the airlines. The 2001
results place Alaska Airlines near the bottom of the industry, seventh in overall
quality.

4
Department of Transportation Airline Quality Data
From 1991 - 1997, the AQR was based on a weighted average of nineteen
quality factors collected from the National Transportation Safety Board, the
Federal Aviation Administration, and other sources within the DOT (Bowen and
Headley, 2003). The relationship to quality of many of these factors was unclear
from the viewpoint of the customer. Examples were corporate bond ratings,
average seat-mile cost, and number of aircraft in the carriers’ fleets. Beginning
with 1998 data, Bowen and Headley simplified the weighted average to include
only four quality factors: on-time arrivals, involuntary denied boardings,
mishandled baggage, and customer complaints. These factors are listed in Table
1 for 1998 - 2002. I did not reexamine the data for 1991 - 1997 because I did not
believe that models including so many dubious quality measures would produce
meaningful results. Another consideration is that I could not confirm all of the DOT
data for the earlier years.
All data in Table 1 are taken from the DOT’s Air Travel Consumer Reports
(2003) for the U.S. carriers that have at least one percent of total domestic
scheduled-service passenger revenues. The on-time arrival percentage covers
nonstop flights between points within the United States. Flights are considered on
time if they arrive at the gate within 15 minutes of scheduled times shown in the
carriers’ Computerized Reservations Systems. Canceled and diverted flights are
counted as late.

5
On-Time Denied Mishandled CustomerAirline AQR Dim. Anal. Arrival % Boardings Baggage Complaints
1998 Alaska 8 8 0.72 1.30 7.27 0.54America West 6 9 0.69 1.14 3.88 2.11American 3 4 0.80 0.46 4.40 1.14Continental 2 1 0.77 0.14 4.06 1.02Delta 4 5 0.80 1.31 4.27 0.79Northwest 9 6 0.71 0.30 6.63 2.21Southwest 5 3 0.81 1.73 4.53 0.25TWA 7 10 0.78 2.61 5.39 1.29United 10 7 0.74 0.57 7.79 1.28US Airways 1 2 0.79 0.22 4.09 0.84
1999 Alaska 5 6 0.71 0.91 5.75 1.64America West 8 10 0.70 1.39 4.52 3.73American 7 4 0.74 0.43 5.21 3.50Continental 2 3 0.77 0.34 4.42 2.62Delta 3 8 0.78 1.53 4.39 1.82Northwest 4 1 0.80 0.18 4.81 2.93Southwest 1 2 0.80 1.38 4.22 0.40TWA 9 7 0.81 0.73 5.38 3.45United 10 9 0.74 0.90 7.01 2.66US Airways 6 5 0.71 0.52 5.08 3.15
2000 Alaska 2 6 0.68 1.41 3.48 2.04America West 10 10 0.66 1.12 6.62 7.51American 6 4 0.73 0.42 5.50 3.54Continental 7 7 0.78 1.80 5.35 2.84Delta 1 1 0.75 0.33 4.49 2.01Northwest 5 3 0.77 0.57 5.24 2.61Southwest 3 2 0.75 1.89 5.00 0.47TWA 8 8 0.77 2.54 6.06 3.47United 9 9 0.61 1.43 6.57 5.30US Airways 4 5 0.72 0.65 4.76 2.59
2001 Alaska 1 7 0.69 1.36 3.00 1.27America West 7 5 0.75 0.38 4.22 3.72American 6 4 0.76 0.36 4.60 2.51American Eagle 10 6 0.71 0.43 7.36 1.70Continental 8 9 0.81 1.51 4.29 2.23Delta 5 8 0.78 0.77 4.11 2.16Northwest 3 3 0.80 0.45 4.19 1.97Southwest 4 2 0.82 1.50 4.77 0.38TWA 11 11 0.81 1.83 6.35 2.54United 9 10 0.74 0.92 5.07 3.24US Airways 2 1 0.78 0.34 3.86 1.87
2002 Alaska 2 6 0.78 1.17 2.63 0.91America West 4 1 0.83 0.20 3.55 1.63American 6 5 0.84 0.31 4.27 1.29American Eagle 10 3 0.79 0.19 9.81 0.60Continental 5 7 0.84 0.87 3.14 1.41Delta 7 10 0.80 1.11 3.57 1.37Northwest 9 8 0.81 0.60 4.52 1.45Southwest 3 4 0.83 1.09 3.52 0.33United 8 9 0.84 0.69 3.76 1.71US Airways 1 2 0.83 0.35 2.95 1.13
AQR Weight 8.63 -8.03 -7.92 -7.17
Overall rankDOT Statistics
Table 1. The Airline Quality Rating (AQR) ranks airlines using weighted averages of four DOT
quality factors. The averages are dimensionally incorrect because the data are measured on four
different scales. Alternative rankings are based on dimensional analysis, a method of combining
multiple criteria into a single performance measure. The rankings are often considerably different.
6
On-time arrival performance has always been controversial because the
numbers can be biased by air traffic control policies and the geographic regions in
which an airline’s flights are concentrated. The numbers are also difficult to
interpret because there is little public information on the specific causes of delays
and cancellations. In hopes of providing more useful reports, the DOT required
carriers to collect the causes of airline cancellations and delays (DOT, 2002)
starting in June, 2003. The new rules create four broad categories for reporting
the causes of cancellations: (1) circumstances within the control of the carrier,
(2) extreme weather, (3) security, and (4) a catch-all “National Aviation System”
category, including non-extreme weather, airport operations, heavy traffic volume,
and air-traffic control. Delays are reported in the same way except that an
additional category collects data on delays due to late incoming aircraft from a
previous flight. The new rules were imposed over the opposition of the industry
trade group, the Air Transport Association, which believes that causal data are
proprietary and should only be released to the public in aggregate form, with no
identification of individual carriers.
The second quality factor, involuntary denied boardings, is the number of
passengers per 10,000 who hold confirmed reservations and are denied boarding
(“bumped”) from flights because they are oversold. Cancelled, delayed, or
diverted flights are not counted in denied boardings. Flights include both domestic
and international flight segments that originate in the United States. Many
involuntary denied boardings are actually voluntary because the DOT counts
passengers who volunteer to take other flights in return for compensation. There

7
are no public data on the number of passengers who receive compensation
although the practice is common in the industry. Another problem in denied
boardings data is that the DOT counts passengers who purchased discounted
tickets that specifically rule out compensation for denied boardings.
Mishandled bags are the number of enplaned passengers per 1,000 who
report loss, damage, delay, or pilferage. The figures include all such reports,
regardless of whether bags were ultimately found in good condition or passengers
were subsequently compensated. The validity of mishandled baggage reports is
not considered in reporting.
Finally, customer complaints are the number of passengers per 100,000
who file complaints with the DOT. About 24% of the complaints in 2002 were
caused by cancellations, delays, or other deviations from flight schedules.
Another 19% were about customer service in general with no further explanation.
About 16% dealt with oversales, reservations, ticketing, and boarding, and 14%
dealt with baggage handling. Remaining complaints included a host of
miscellaneous problems. Safety issues are excluded from customer complaints
because they are referred to the Federal Aviation Administration.
In most industries, customer complaints are the most important quality
measure. For an excellent discussion of the importance of complaint data and
how it should be used in quality management, see Evans and Lindsay (2002). In
the airline industry, my opinion is that customer complaint data are the least
important of the DOT quality measures. The proportion of customers who
complain is so small and oddly distributed over time that it is difficult to accept that

8
complaints are in any sense representative of the population of airline passengers.
In 2002, there were more than 510 million enplanements (for the ten airlines listed
in Table 1) but only 6,229 customers complained to the DOT. Thus one in 82,000
customers complained, compared to an average rate of one in 25 customers in
other industries (Evans and Lindsay, 2002). It seems likely that most complaints
are made directly to the airlines rather than the DOT, but there is no public
information on direct complaints. Within the tiny sample of those who did complain
to the DOT, there is much double-counting. Most baggage complaints relate to
problems already counted in the rate of mishandled baggage, while most
complaints about oversales are duplicated in the rate for involuntary denied
boardings.
The terrorist attacks certainly distorted DOT data from September –
December, 2001, although adjustments in DOT reports are inconsistent. For
example, the on-time arrival report for the month of September excludes 11 - 30
but the entire month was used in the final percentage for the year. Mishandled
bags exclude September 11 - 30 both for the month and year. Denied boardings
and customer complaints include all of September both for the month and year.
The DOT receives most customer complaints via mail and there were substantial
mail disruptions in the Washington, D.C. area due to the anthrax attacks during
September - December, 2001. The number of complaints for this period was
substantially lower than for the same period in 2000, and it is not clear whether
some airlines were affected disproportionately. Nevertheless, Bowen and Headley
used the DOT data and I did the same for the sake of consistency in Table 1.
9
AQR Methodology
The AQR (Bowen and Headley, 2003) is a weighted average of DOT quality
data, with the weights derived from a survey of 65 airline industry experts
regarding their opinion “as to what consumers would rate as important (on a scale
of 1 to 10) in judging airline quality.” The AQR documentation does not specify
when this survey was taken but the weights have not been changed since at least
1995, the earliest AQR report I could find that contained detailed information on
the computations.
Weights are given signs that reflect the “direction of impact that the criteria
should have on the consumer’s rating of airline quality.” The on-time arrival weight
(8.63) receives a positive sign, while all other weights are negative and similar in
magnitude. Involuntary denied boardings are weighted at –8.03, mishandled
bags at –7.92, and customer complaints at –7.17. AQR reports do not disclose
the identity of the experts, how they were selected, if they knew how their opinions
would be used, or why experts rather than passengers themselves were surveyed
to determine weights. Another reason to question the original survey is that
absolute weights are so similar. If all weights are reset to unity (with signs
retained), there is no significant difference in AQR rankings from 1998 - 2002.
The annual AQR quality rankings for 1998 - 2002 and the data behind them
are shown in Table 1. Rankings are based on a weighted average of a
percentage (on-time arrivals), a rate per 1,000 passengers (denied boardings), a
rate per 10,000 passengers (mishandled baggage), and a rate per 100,000

10
passengers (customer complaints). This jumble of dimensions often produces
illogical rankings.
To illustrate, consider the 2001 AQR rankings, which were extremely
controversial in the airline industry. The only quality factor in which Alaska Airlines
led the industry was in the rate of mishandled bags. Alaska was last in on-time
arrivals yet ranked first in AQR overall quality. How did this ranking come about?
On-time arrivals in the AQR weighted average are fractional numbers less than
one while the other numbers are much larger. Because the weights are almost
equal, on-time arrivals are virtually irrelevant in average scores. Sensitivity
analysis shows that Alaska Airlines’ 2001 on-time arrivals could have fallen from
69% to 45% and it would still have ranked first in the AQR. Now suppose that all
airlines except Alaska were never late, that is they achieved 100% on-time arrivals
for all flights in 2001; if Alaska achieved only 69% on-time arrivals, it would still
have been ranked first.
Similar results occur in the AQR rankings in other years. For example, in
2002, U.S. Airways ranked first in the AQR. This carrier’s on-time arrivals could
have fallen from 83.4% to 50% and it would still have ranked first. If all other
carriers achieved 100% on-time arrivals for the entire year, U.S. Airways would
still have ranked first with a rate of 83.4%.

11
Dimensional analysis
The analytical problem in ranking the airlines using DOT quality data
appears to be complex at first glance although the solution is relatively simple. We
must identify a special kind of function, a value function that combines
measurements of multiple quality factors into a single index of overall
performance. To prevent dimensional problems, the value function must satisfy
the condition that the ratio of the numbers measuring any two examples of the
same quality factor shall not depend on the size of the units in which the
measurement was made. In the terminology of dimensional analysis, this
condition is called the “absolute significance of relative magnitude” (Bridgman,
1922). For example, the statement that one airline has twice as many mishandled
bags as another has absolute significance, independent of the units in which
mishandled bags are stated. The condition of absolute significance of relative
magnitude is essential to all scientific systems of measurement but is really
nothing more than common sense. Surely any sound value function cannot
depend on units of measure.
The condition restricts the form that the value function may take. In a
comparison of any two airlines, it can be proven (see Appendix) that the required
value function is a geometric weighted average defined as the product of quality
measurements, with each measurement raised to an exponent equal to its weight.
Only ratio-scale values may be used for both exponents and measurements.
Exponents are positive for desirable quality factors and negative for undesirable
factors.
12
To construct a dimensionally correct quality ranking of the airlines, all that is
necessary is to sort their value functions. A little algebra shows that an equivalent
ranking occurs when the airlines are scored using a weighted average of the
logarithms of the quality measures. More complex but equivalent value ranking
procedures based on dimensional analysis are available in Willis, Huston, and
Pohlkamp (1993) and Li, Fun, and Hung (1997).
To understand the implications of dimensional analysis, it is helpful to study
the effects of rescaling the airline quality measurements. It seems that one way
to generate sensible rankings using the AQR weighted averages may be to
rescale all quality measurements to the same rate of occurrence, say per hundred.
In the original AQR rankings, on-time arrivals were shown to be irrelevant. With
rates per hundred, we have just the opposite result: airline rankings depend solely
on on-time arrivals and everything else is irrelevant. The reason is that the rate of
on-time arrivals per hundred is enormous compared to the other rates. See for
example Table 2, which ranks America West and Southwest using 2002 DOT data
and equal absolute weights. In the first comparison, DOT data in original rates
are used in the AQR average (last column of the table) and Southwest receives
the larger score. In the second comparison, DOT data are rescaled to rates per
hundred and America West receives the larger score.

On-Time Denied Mishandled Customer Value Weighted AQRRate Arrivals Boardings Baggage Complaints Function avg. of logs Average
America West Original 0.829 0.200 3.550 1.630 0.716 -0.145 -1.138Southwest 0.826 1.090 3.520 0.330 0.652 -0.186 -1.029Ratio 1.098 0.781 1.106Difference 0.064 0.041 -0.109
America West Per 100 82.900 0.020 0.036 0.002 71,632,247 7.855 20.711Southwest 82.600 0.109 0.035 0.000 65,237,445 7.814 20.614Ratio 1.098 1.005 1.005Difference 6,394,802 0.041 0.097
Weight 1 -1 -1 -1
2002 DOT Statistics Dimensional Analysis
Table 2. This table demonstrates the effects of changing the size of units of
measurement in ranking a pair of airlines. In the first comparison, with original
DOT statistics and equal absolute weights, the AQR average (last column) gives
Southwest the larger score; in the second comparison, all statistics are rescaled
to rates per hundred and the AQR reverses the rankings. In dimensional analysis,
rankings are consistent. Scores in the value-function column are the products of
quality measurements, with each raised to a power equal to its weight. Another
dimensionally correct way to rank the airlines is to use the weighted average of
logged quality measures.
13

14
Precisely the same problem occurs in the AQR when all quality
measurements are stated in any other common rate. What if the differences in
magnitude are reduced by changing on-time arrivals to late arrivals, again with all
measurements at the same rate? This idea is of no help because the rate of late
arrivals becomes the only relevant measurement. Other examples could be
presented but it should be obvious that many alternative AQR rankings can be
generated by rescaling selected individual measurements to overwhelm the
others.
As demonstrated in Table 2, these scaling problems do not exist in the
value function derived from dimensional analysis. Using original DOT data with
equal absolute weights, the value function gives overall quality scores of 0.716 for
America West and 0.652 for Southwest. The scores have no particular numeric
interpretation except to say that America West provides better quality than
Southwest (under the given assumptions and weights). When we rescale the
data to rates per hundred, overall scores grow dramatically but the important point
is that the ratio of scores does not change. For any pair of airlines, the ratio of
overall quality scores cannot change no matter how quality measurements are
scaled, a result guaranteed by the condition of absolute significance of relative
magnitude placed on the value function. It follows that overall quality rankings of
any number of airlines cannot depend on the size of units of measure.
15
The value function can produce rather unwieldy numbers as it did in the
second comparison in Table 2. It may be more convenient to base rankings on
the weighted averages of logarithms of quality measurements. The same
conclusions hold except that in log-scale the difference between scores, rather
than the ratio of scores, is unaffected by the size of units of measure.
Airline quality rankings from 1998 - 2002 are shown in Table 1. Anyone
who wishes to reproduce the calculations should note that AQR weighted
averages are computed monthly. At year end, for unstated reasons Bowen and
Headley compute an unweighted average of monthly averages to obtain final
rankings. For all data in Table 1, there is no significant difference in final AQR
rankings regardless of whether an average of monthly averages or an
average of final data for the year are used. The same comment is true for
dimensional analysis.
16
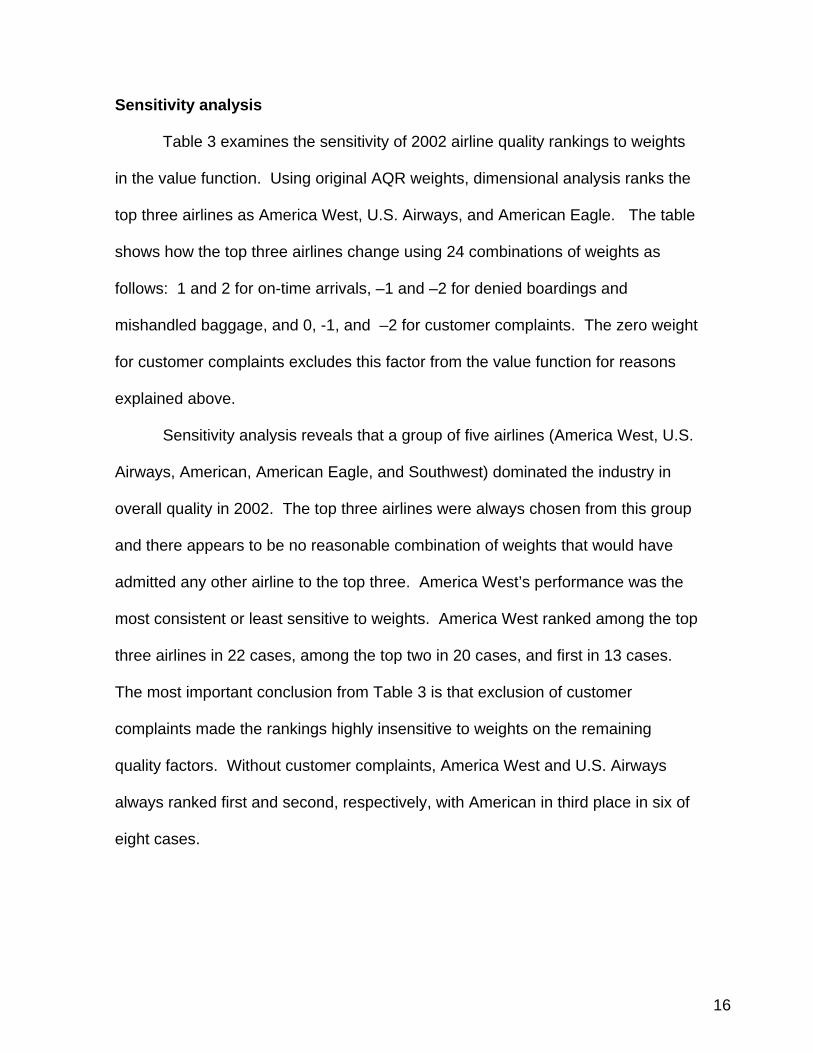
Sensitivity analysis
Table 3 examines the sensitivity of 2002 airline quality rankings to weights
in the value function. Using original AQR weights, dimensional analysis ranks the
top three airlines as America West, U.S. Airways, and American Eagle. The table
shows how the top three airlines change using 24 combinations of weights as
follows: 1 and 2 for on-time arrivals, –1 and –2 for denied boardings and
mishandled baggage, and 0, -1, and –2 for customer complaints. The zero weight
for customer complaints excludes this factor from the value function for reasons
explained above.
Sensitivity analysis reveals that a group of five airlines (America West, U.S.
Airways, American, American Eagle, and Southwest) dominated the industry in
overall quality in 2002. The top three airlines were always chosen from this group
and there appears to be no reasonable combination of weights that would have
admitted any other airline to the top three. America West’s performance was the
most consistent or least sensitive to weights. America West ranked among the top
three airlines in 22 cases, among the top two in 20 cases, and first in 13 cases.
The most important conclusion from Table 3 is that exclusion of customer
complaints made the rankings highly insensitive to weights on the remaining
quality factors. Without customer complaints, America West and U.S. Airways
always ranked first and second, respectively, with American in third place in six of
eight cases.

On-Time Denied Mishandled CustomerArrival % Boardings Baggage Complaints 1 2 3
8.63 -8.03 -7.92 -7.17 America West US Airways American Eagle
1 -1 -1 0 America West US Airways Ameri1 -1 -1 -1 America West US Airways American Eagle2 -1 -1 0 America West US Airways Ameri2 -1 -1 -1 US Airways America West American Eagle
1 -2 -1 0 America West US Airways American Eagle1 -2 -1 -1 American Eagle America West US Airways2 -2 -1 0 America West US Airways American Eagle2 -2 -1 -1 America West American Eagle US Airways
1 -1 -2 0 America West US Airways Ameri1 -1 -2 -1 US Airways America West Southwest2 -1 -2 0 America West US Airways Ameri2 -1 -2 -1 US Airways America West Southwest
1 -2 -1 -2 American Eagle America West Southwest2 -2 -1 -2 American Eagle America West US Airways1 -2 -2 -2 American Eagle America West US Airways2 -2 -2 -2 America West US Airways American Eagle
1 -1 -1 -2 Southwest American Eagle US Airways2 -1 -1 -2 Southwest American Eagle US Airways1 -2 -2 0 America West US Airways Ameri1 -2 -2 -1 America West US Airways American Eagle
2 -2 -2 0 America West US Airways Ameri2 -2 -2 -1 America West US Airways American1 -1 -2 -2 Southwest US Airways America West2 -1 -2 -2 Southwest US Airways America West
Dimensional analysis weights Top 3 Airlines
can
can
can
can
can
can
Table 3. This table shows the sensitivity of airline quality rankings based on
dimensional analysis. If weights are restricted to 1 and 2 for on-time arrivals, –1
and –2 for denied boardings and mishandled baggage, and 0, -1, and –2 for
customer complaints, there are 24 combinations. America West’s performance
was less sensitive to weights than its competitors.
17

18
Other quality rating systems
One of the referees for this paper asked this question: Are the dimensional
mistakes in the AQR unique or a general phenomenon? This is a difficult question
to answer. I examined a non-random sample of 100 web sites containing quality
ratings. Most were simple consumer opinion surveys but there were numerous
multiple-criteria ratings that gave no details on how the ratings were computed.
Rather than follow up on all of these, I decided to focus on the two best-
known quality critics, Consumers Union (publisher of Consumer Reports) and J. D.
Power and Associates. Even though Consumers Union is a not-for-profit
organization, a contact refused to answer questions about how any of their quality
ratings are computed, stating that they wished to avoid arguments. In an attempt
to get answers, I became a member of Consumers Union, which did nothing to
improve the quality of its responses. In contrast, J. D. Power was extremely
helpful and provided detailed explanations of the methodology for several of its
famous automotive quality studies. The studies were designed to avoid
dimensional problems and I could see no reason to take issue with the results.
19
Conclusions
Dimensional analysis is always based on one elementary principle, that of
dimensional homogeneity. Quantities may be added or subtracted only when they
have the same dimensions. The AQR has violated this principle since 1991,
producing indefensible airline rankings.
DOT airline quality data are limited in scope and open to criticism for a
variety of reasons. However, the DOT publishes the only industry-wide data on
airline quality and I expect that reports of quality rankings will continue to receive a
great deal of attention. The point of this paper is that dimensional analysis
provides the correct value function for quality rankings using criteria with different
dimensions and varying relative importance. Anyone who disagrees with the
rankings is free to make his or her own decisions about relevant data and weights
to be used in the value function.
Dimensional analysis is simple, robust, and flexible, both in defining
performance measures and in determining the numerical standards for evaluation.
Furthermore, dimensional analysis can deal with both tangible and intangible
decision criteria, so long as the numbers are ratio-scaled. In the context of
physics, Langhaar (1951) went so far as to argue that dimensional analysis can
produce at least a partial solution to nearly any problem. This may seem
improbable in operations research, but certainly there are many opportunities for
dimensional reasoning. For additional examples, see Naddor (1966).

20
Appendix
The purpose of this appendix is to identify a quality value function that does
not depend on units of measure. To simplify the analysis, only systems with four
quality metrics are considered, but the results are easily generalized.
Let α1, β1, γ1, δ1 represent a set of quality metrics for an airline. Let α2, β2,
γ2, δ2 represent the same metrics for an alternative airline. The relative value of
the first airline’s quality is described by the unknown function f (α1, β1, γ1, δ1).
Relative value for the second airline is described by f (α2, β2, γ2, δ2). The choice of
the value function f is made on the basis of the following proposed axiom: The
ratio f (α1, β1, γ1, δ1) / f (α2, β2, γ2, δ2) shall not depend on the units in which any
metric is stated.
To determine the form of the value function that satisfies this axiom, we
follow Bridgman (1922). The basic approach is to analyze the effects of changing
the size of the units of measure. First, make the units in which α is measured
1/wth as large. Then the number measuring α will be w times as large or wα. In
the same way, make the number measuring β 1/xth as large, so the measuring
number becomes xβ. This process produces the following relation:
f (α1, β1, γ1, δ1) f (wα1, xβ1, yγ1, zδ1)
——————— = ————————— [1] f (α2, β2, γ2, δ2) f (wα2, xβ2, yγ2, zδ2)
It is important to note that our axiom requires this relation to hold for all values of
α1, β1, γ1, δ1, for all α2, β2, γ2, δ2, and for all w, x, y, z.

21
To solve for the unknown function f, rewrite as follows:
f (α1, β1, γ1, δ1) f (wα1, xβ1, yγ1, zδ1) = f (wα2, xβ2, yγ2, zδ2) x ——————- [2] f (α2, β2, γ2, δ2)
Next, differentiate partially with respect to w. Let f1 represent the partial
derivative of the function with respect to the first argument. This yields the
following:
f (α1, β1, γ1, δ1) α1 f1 (wα1, xβ1, yγ1, zδ1) = α2 f1 (wα2, xβ2, yγ2, zδ2) x ——————- [3] f (α2, β2, γ2, δ2)
Now put w, x, y, z all equal to 1. This produces:
f1 (α1, β1, γ1, δ1) f1 (α1, β1, γ1, δ1) α1 ——————— = α2 ——————— [4] f (α1, β1, γ1, δ1) f (α2, β2, γ2, δ2)
Equation [4] is to hold for all values of α1, β1, γ1, δ1 and α2, β2, γ2, δ2.
Hence, keeping α2, β2, γ2, δ2 constant and allowing α1, β1, γ1, δ1 to vary, we have
α ∂ f — — = Const [5] f ∂ α
or
1 ∂ f Const — — = ——— [6] f ∂ α α
which integrates to f = C1 αConst. The factor C1 is a function of the other
parameters β, γ, δ.

22
Next, repeat the process above, differentiating partially with respect to x, y,
z in turn, and integrating. The final result reveals the required value function:
f = C αa βb γc δd [7]
In [7], the exponents a, b, c, d are weights. The coefficient C is almost always
chosen to be unity.

23
References
Bowen, Brent and Dean Headley. 2003. The Airline Quality Rating 2003.
April, 2003, retrieved on May 1, 2003 from (www.wichita.edu/aqr2003).
Braglia, Marcello and Roberto Gabbrielli. 2000. Dimensional analysis for
investment selection in industrial robots. International Journal of Production
Research 38(18) 4843-4848.
Bridgman, P. W. 1922. Dimensional Analysis. Yale University Press, New
Haven, CT.
Continental Airlines. 2003. Company Awards. Retrieved on May 1, 2003
from (www.continental.com/company/profile/)
Daganzo, C. F. 1987. The break-bulk role of terminals in many-to-many
logistics networks. Operations Research 35(4) 543-555.
Ehrhardt, E. 1979. The power approximation for computing (s,S) inventory
policies. Management Science 25(8) 777-786.
Ehrhardt, E., C. Mosier. 1984. A revision of the power approximation for
computing (s,S) inventory policies. Management Science 30(5) 618-622.

24
Epstein, L. Ivan. 1957. A proposed measure for determining the value of a
system. Operations Research 5(2) 297-299.
Evans, James R. and William L. Lindsay. 2002. The Management and
Control of Quality. Southwestern, Cincinnati, OH.
Huntley, H. E. 1951. Dimensional Analysis. Rinehart and Company, New
York, NY.
Langhaar, Henry L. 1951. Dimensional Analysis and Theory of Models.
Wiley, New York, NY.
Li, C.C., Y.P. Fun, J.S. Hung. 1997. A new measure for supplier
performance evaluation. IIE Transactions 29(2), 753-758.
Mahoney, J. F., J.A. Ventura. 1985. Dimensional analysis in an industrial
engineering setting. IIE Transactions 17(2) 198-203.
Naddor, Eliezer. 1966. Dimensions in Operations Research. Operations
Research 14(1) 508-514.
Silver, E.A. 1983. An example of indifference curves in inventory control.
IIE Transactions 15(1) 79-80.

25
Sivazlian, B.D. 1971. Dimensional and computational analysis in stationary
(s,S) inventory problems with gamma-distributed demand. Management Science
17(6) 307-311.
Starr, Martin K. 1996. Operations Management: a Systems Approach.
Boyd & Fraser Publishing Company, Danvers, MA.
U.S. Department of Transportation. 2002. Reporting the Causes of Airline
Delays and Cancellations (Docket No. OST 2000-8164, November 25, 2002),
67(227), 70535-70545,
U.S. Department of Transportation. 2003, Air Travel Consumer Reports,
1998–2002, retrieved on May 1, 2003, from
(www.airconsumer.ost.dot.gov/reports/atcr02.htm)
Vignaux, G.A., Sudha Jain. 1988. An approximate inventory model based
on dimensional analysis. Asia-Pacific Journal of Operational Research 5(2) 117-
123.
Willis, T. Hillman, C. Richard Huston, Frank Pohlkamp. 1993. Evaluation
measures of just-in-time supplier performance. Production and Inventory
Management Journal, 32(3) 1-6.