differential evolution versus genetic algorithms in ...dicators. this suggests that in numerical...
TRANSCRIPT
Differential Evolution Versus GeneticAlgorithms in Multiobjective Optimization
Tea Tusar and Bogdan Filipic
Department of Intelligent Systems, Jozef Stefan InstituteJamova 39, SI-1000 Ljubljana, Slovenia
[email protected], [email protected]
Abstract. This paper presents a comprehensive comparison betweenthe performance of state-of-the-art genetic algorithms NSGA-II, SPEA2and IBEA and their differential evolution based variants DEMONS-II,DEMOSP2 and DEMOIB. Experimental results on 16 numerical multi-objective test problems show that on the majority of problems, the algo-rithms based on differential evolution perform significantly better thanthe corresponding genetic algorithms with regard to applied quality in-dicators. This suggests that in numerical multiobjective optimization,differential evolution explores the decision space more efficiently thangenetic algorithms.
1 Introduction
Differential Evolution (DE) [1] is a simple yet powerful algorithm that outper-forms Genetic Algorithms (GAs) on many numerical singleobjective optimiza-tion problems [2]. In this paper we show that DE can achieve better results thanGAs also on numerical multiobjective optimization problems (MOPs). To thisend, we compare three state-of-the-art Multiobjective Evolutionary Algorithms(MOEAs), namely NSGA-II [3], SPEA2 [4] and IBEA [5], to their counterparts– algorithms that use the same environmental selection, but DE instead of GAsfor exploring the decision space. While DE-based algorithms for multiobjectiveoptimization have already been proposed in the past (see Related Work in Sec-tion 3), comparisons between these approaches and GA-based algorithms lack:(a) a wide choice of difficult test problems with more than two objectives, (b)performance assessment with Pareto compliant indicators, and (c) inferencesabout algorithm performance based on statistical tests. The comparison in thispaper includes all these usually omitted features.
The paper is further organized as follows. Section 2 introduces the basic GAas the underlying algorithm for NSGA-II, SPEA2 and IBEA, while the proposedalgorithm DEMO is explained in detail in Section 3. Section 4 outlines the ex-periments, whose results are presented and discussed in Section 5. Section 6concludes the paper with a summary of the results.
2 Multiobjective Optimization with the Basic GA
Most of the efforts spent on adapting GAs to multiobjective optimization havebeen focusing on finding new approaches for environmental selection. These
S. Obayashi et al. (Eds.): EMO 2007, LNCS 4403, pp. 257–271, 2007.c© Springer-Verlag Berlin Heidelberg 2007
258 T. Tusar and B. Filipic
approaches try to produce good approximations of the Pareto optimal frontby incorporating different preferences. For example, the environmental selectionin NSGA-II [3] first ranks the individuals using nondominated sorting. To distin-guish between individuals with the same rank, the crowding distance metric isused, which prefers individuals from less crowded regions of the objective space.SPEA2 [4] works similarly, calculating the raw fitness of the individuals accord-ing to Pareto dominance relations between them and using a density measure tobreak the ties. The individuals that reside close together in the objective spaceare discouraged from entering the archive of best solutions. IBEA [5], on theother hand, uses a different approach. The fitness of individuals is determinedonly according to the value of a predefined indicator. This indicator has to bedominance preserving and no other explicit diversity preserving mechanism (suchas crowding in NSGA-II or density in SPEA2) is applied.
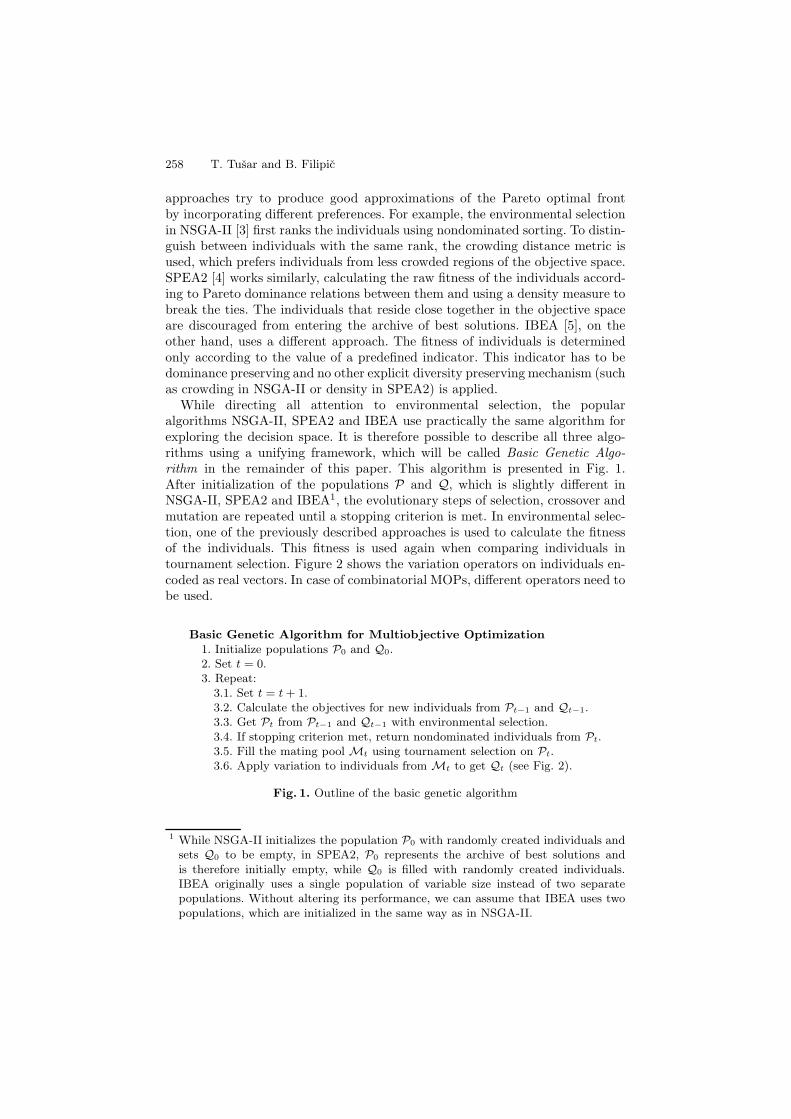
While directing all attention to environmental selection, the popularalgorithms NSGA-II, SPEA2 and IBEA use practically the same algorithm forexploring the decision space. It is therefore possible to describe all three algo-rithms using a unifying framework, which will be called Basic Genetic Algo-rithm in the remainder of this paper. This algorithm is presented in Fig. 1.After initialization of the populations P and Q, which is slightly different inNSGA-II, SPEA2 and IBEA1, the evolutionary steps of selection, crossover andmutation are repeated until a stopping criterion is met. In environmental selec-tion, one of the previously described approaches is used to calculate the fitnessof the individuals. This fitness is used again when comparing individuals intournament selection. Figure 2 shows the variation operators on individuals en-coded as real vectors. In case of combinatorial MOPs, different operators need tobe used.
Basic Genetic Algorithm for Multiobjective Optimization1. Initialize populations P0 and Q0.2. Set t = 0.3. Repeat:
3.1. Set t = t + 1.3.2. Calculate the objectives for new individuals from Pt−1 and Qt−1.3.3. Get Pt from Pt−1 and Qt−1 with environmental selection.3.4. If stopping criterion met, return nondominated individuals from Pt.3.5. Fill the mating pool Mt using tournament selection on Pt.3.6. Apply variation to individuals from Mt to get Qt (see Fig. 2).
Fig. 1. Outline of the basic genetic algorithm
1 While NSGA-II initializes the population P0 with randomly created individuals andsets Q0 to be empty, in SPEA2, P0 represents the archive of best solutions andis therefore initially empty, while Q0 is filled with randomly created individuals.IBEA originally uses a single population of variable size instead of two separatepopulations. Without altering its performance, we can assume that IBEA uses twopopulations, which are initialized in the same way as in NSGA-II.

Differential Evolution Versus GAs in Multiobjective Optimization 259
VariationInput: Mating pool Mt
1. Create empty population Qt.2. For each pair of individuals Ii, Ii+1 (i = 1, 3, . . . ) from Mt do:
2.1. Modify the individuals Ii, Ii+1 with uniform crossover.2.2. Modify the individuals Ii, Ii+1 with simulated binary crossover.2.3. Modify the individual Ii with polynomial mutation.2.4. Modify the individual Ii+1 with polynomial mutation.2.5. Add individuals Ii and Ii+1 to Qt.
Output: Population Qt
Fig. 2. Variation of real-coded individuals
3 Multiobjective Optimization with DE
DE [1] is a simple evolutionary algorithm that encodes solutions as vectors anduses operations such as vector addition, scalar multiplication and exchange ofcomponents (crossover) to construct new solutions from the existing ones. Whena new solution, also called candidate, is constructed, it is compared to its parent.If the candidate is better than its parent, it replaces the parent in the population.Otherwise, the candidate is discarded. As a steady-state algorithm, DE implicitlyincorporates elitism, i.e. no solution can be deleted from the population unlessa better solution is found. While being a very successful optimization method,DE’s greatest limitation originates in its encoding. As no vector representation ofsolution exists for combinatorial problems, DE can only be applied in numericaloptimization.
3.1 Related Work
DE has been adapted to solve MOPs in several ways. In the early approaches(PDE [6] and GDE [7]), only the concept of Pareto dominance was used tocompare the individuals. The candidate replaced its parent only if it (weakly)dominated it. Otherwise, it was discarded. This is a rather strict demand, es-pecially when the number of objectives is high. Many subsequent approaches(PDEA [8], MODE [9], NSDE [10], GDE2 [11], DEMO [12], GDE3 [13] andNSDE-DCS [14]) used nondominated sorting and/or the crowding distance met-ric to calculate the fitness of individuals. Only recently, new algorithms that donot follow the environmental selection of NSGA-II were proposed (ε-MyDE [15]and DEMORS [16]). To our best knowledge, no algorithms that combine DEwith the environmental selection of SPEA2 or IBEA have been presented so far.
3.2 DEMONS-II, DEMOSP2 and DEMOIB
The idea presented here is to use DE for exploring the decision space and en-vironmental selection from either NSGA-II, SPEA2 or IBEA to select the best

260 T. Tusar and B. Filipic
individuals for the next population. This idea is implemented in the algorithmcalled DEMO (Differential Evolution for Multiobjective Optimization)2.
The outline of DEMO is presented in Figs. 3 and 4. In the main loop, thecandidate replaces the parent if it dominates it. If the parent dominates thecandidate, the candidate is discarded. Otherwise (when the candidate and parentare nondominated with regard to each other), the candidate is added to thepopulation. This step is repeated until popSize number of candidates are created.After that, we get a population of size between popSize and 2 × popSize . If thepopulation has enlarged, it is truncated to popSize using environmental selection.
Differential Evolution for Multiobjective Optimization1. Evaluate the initial population P of random individuals.2. While stopping criterion not met, do:
2.1. For each individual Pi (i = 1, . . . , popSize) from P repeat:(a) Create candidate C from parent Pi (see Fig. 4).(b) Calculate the objectives of the candidate.(c) If the candidate dominates the parent, the candidate replaces the parent.
If the parent dominates the candidate, the candidate is discarded.Otherwise, the candidate is added in the population.
2.2. If the population has more than popSize individuals, apply environmentalselection to get the best popSize individuals.
2.3. Randomly enumerate the individuals in P .3. Return nondominated individuals from P .
Fig. 3. Outline of DEMO
Candidate creationInput: Parent Pi
1. Randomly select three individuals Pi1 , Pi2 , Pi3 from P , wherei, i1, i2 and i3 are pairwise different.
2. Calculate candidate C as C = Pi1 + F (Pi2 − Pi3), where Fis a scaling factor.
3. Modify the candidate with binary crossover with the parent Pi.4. Repair the candidate if it falls out of bounds of the decision space.Output: Candidate C
Fig. 4. Candidate creation using scheme DE/rand/1/bin
Note that the newly created candidates that enter the population (either byreplacement or by addition) instantly take part in the creation of subsequent can-didates. This helps achieving fast convergence to the Pareto optimal front. More-over, it resembles very closely the steady-state mechanism of DE. This is why weprefer the described approach to a somewhat more straightforward way to use DE
2 DEMO is a generalization of the DEMO/parent variant presented in [12], which usedthe DE/rand/1/bin scheme [2] and environmental selection from NSGA-II.

Differential Evolution Versus GAs in Multiobjective Optimization 261
in the basic GA, which consists of replacing the variation phase (see Fig. 2) withcandidate creation (as in Fig. 4) for each individual from the mating pool.
In candidate creation, the use of vector addition can result in candidates thatfall out of bounds of the decision space. In such cases, many repair methods arepossible. We address this problem by replacing the candidate value violating theboundary constraints with the closest boundary value. In this way, the candidatebecomes feasible with as few alterations to it as possible and there is no needfor making a new candidate. It is important to note, however, that this repairmethod may yield more boundary individuals and is biased for problems wherethe Pareto optimal set lies on one of the bounds of the decision space.
DEMO, as described in Fig. 3, can incorporate arbitrary environmental se-lection. In the remainder of the paper we will use DEMONS-II, DEMOSP2 andDEMOIB to denote the variants of DEMO that use environmental selection fromNSGA-II, SPEA2 and IBEA, respectively.
4 Experimental Setup
To compare the presented algorithms, extensive experiments on 16 test problemswere performed. The focus of the experiments was on comparing DEMONS-II toNSGA-II, DEMOSP2 to SPEA2, and DEMOIB to IBEA, and not on compar-ing algorithms with different environmental selection among themselves. Such acomparison can be found, for example, in [5].
4.1 Test Problems
Two test problem suits were used in the experiments. The first consists of thefirst seven DTLZ test problems from [17] and the second of the nine WFG testproblems presented in [18]. Both suits comprise difficult problems that presentmany challenges for multiobjective optimizers, such as the existence of manylocal Pareto optimal fronts, uneven distribution of points on the Pareto optimalfront, nonseparable variables etc.
Let n and m denote the dimensionality of the decision space and variablespace, respectively. Each of the 16 problems was used three times – each timewith a different number of objectives (m = 2, 3 and 4). The other parameterswere set as follows:
– The parameters of DTLZ problems were set as recommended in [17], i.e.n = m + k − 1, where k = 5 for DTLZ1, k = 10 for problems DTLZ2 toDTLZ6 and k = 20 for DTLZ7.
– Parameters of the WFG test suite are: the number of position related param-eters k, number of distance related parameters l and number of objectives m.The number of decision variables is calculated as n = k + l. Because of someadditional requirements (l must be an even number for WFG2 and WFG3,and k must be divisible by m − 1), we used the following setting: k = 6 andl = 4 (consecutively n = 10), which satisfies all the requirements for m = 2,3 and 4.
All test problems suppose minimization of all objectives.

262 T. Tusar and B. Filipic
4.2 Parameters of the Algorithms
The experiments with NSGA-II, SPEA2 and IBEA were performed using thePISA environment [19]. The parameter settings for the basic GA, used by allthree algorithms, are the same as the ones used in the comparison betweenNSGA-II and SPEA2 on the DTLZ1 problem in [17]:
– population size = 100,– number of generations = 300,– tournament size = 2,– size of the mating pool = 100,– individual crossover probability = 1,– variable probability for SBX crossover = 1,– distribution index for crossover ηc = 15,– variable uniform crossover probability = 0.5,– individual mutation probability = 1,– variable polynomial mutation probability = 1/n,– distribution index for mutation ηm = 20.
The parameters of all three variants of DEMO were set as in [12] (except forthe number of generations, which equals the number of generations used by thebasic GA):
– population size = 100,– number of generations = 300,– DE selection scheme = DE/rand/1/bin,– scaling factor F = 0.5,– probability used in binary crossover = 0.3.
DEMOIB and IBEA used additional parameters: indicator = IHD3, scaling factor
κ = 0.05 and reference point for the hypervolume calculation ρ = (2, . . . , 2) ∈IRm. Each algorithm was run on each problem 30 times.
4.3 Performance Assessment
The performance assessment was carried out using PISA and the guidelinesfrom [20] and [21]. Consider for example the comparison between DEMONS-II
and NSGA-II on one problem. Firstly, the bounds of approximation sets of bothalgorithms were calculated so that the approximation sets could be normalizedto the interval [1, 2]. After that, a dominance rank was calculated for each ofthe 60 approximation sets by simply counting the number of approximation setsthat are better than the observed one. The Mann-Whitney rank sum test wasused to discover if there are significant differences between the dominance ranksof the two algorithms.3 The same set of experiments was performed also with the Iε+ indicator. Be-
cause of space limitations, we report only the results obtained using IHD as theyare less favorable for DEMOIB. The interested reader can access all results fromhttp://dis.ijs.si/tea/EMO2007/demo.htm .

Differential Evolution Versus GAs in Multiobjective Optimization 263
Additional assessment was carried out using unary quality indicators. Fromthe approximation sets of both algorithms, the set containing only nondominatedsolutions was computed and used as the reference set for the unary indicatorsI1ε+ and I1
R2. Other parameters of the I1R2 indicator were: ρ = 0.01, (0.9, . . . , 0.9)
and (2.1, . . . , 2.1) ∈ IRm served as the ideal and Nadir points, and 501, 496 and455 uniformly spread parameter vectors were used for the problems with two,three and four objectives, respectively. The hypervolume indicator IH used thepoint (2.1, . . . , 2.1) ∈ IRm as the reference point. All three indicators were cal-culated for each approximation set of both algorithms. The significance of theseoutcomes was tested independently with the Fisher’s independent permutationtest. Because we used dominance ranking and three indicators on the same data,the significance level α for all significance tests was reduced from 0.05 to 0.0125using the Bonferroni correction.
The same procedure was repeated in comparing DEMOSP2 to SPEA2 andDEMOIB to IBEA. The outcomes of these comparisons are presented in thenext section.
5 Results and Discussion
Looking at the outcomes of dominance ranking (Tables 1, 3 and 5) we can observethat on many problems, approximation sets of DEMO achieve significantly betterdomination ranks than the approximation sets of the basic GA. Only rarely (seeSubsection 5.3), the basic GA outperforms DEMO. On the majority of problems,however, there are no significant differences between the two algorithms withregard to dominance ranking.
As expected, when dominance ranking shows a significant difference betweentwo algorithms, so do the three applied indicators (an exception is again ex-plained in Subsection 5.3). On the majority of problems, DEMO achieves sig-nificantly better results with regard to the chosen indicator (see Tables 2, 4 and6). Note that on a few problems (see for example DTLZ5 for m = 4 in Table 2),DEMO is significantly better than the basic GA with regard to one indicator(I1
r2) and significantly worse with regard to another indicator (IH). This sug-gests that the outcomes of DEMO and the basic GA are incomparable on suchproblems.
Besides these results, we also investigated the plots of approximation sets (form = 2 and 3) and plots of attainment surfaces (for m = 2) [22] to gain furtherinsight into the comparison between DEMO and the basic GA. Despite statisticaltests show that there is almost always a significant difference in indicator valuesof the two algorithms, in general no noticeable distinction was visible betweenthe approximation sets (and attainment surfaces) of DEMO and the basic GA onproblems DTLZ2, DTLZ4, DTLZ5, DTLZ7, WFG3, WFG4, WFG5, WFG8 andWFG9. On problems DTLZ1, DTLZ3 and DTLZ6, where it is very difficult toconverge to the Pareto optimal front, and on the non-separable WFG6 problem,DEMO generally attained the Pareto optimal front more efficiently than thebasic GA. On problems DTLZ3, WFG1, WFG2 and WFG7, DEMO achievedbetter spread of solutions along the Pareto optimal front than the basic GA.

264 T. Tusar and B. Filipic
Table 1. Outcomes of the Mann-Whitney rank sum test (α = 0.0125) on dominanceranking for DEMONS-II and NSGA-II. The ‘� p-value’ (‘� p-value’) denotes the prob-lems, on which DEMONS-II is significantly better (worse) than NSGA-II, while ‘-’ in-dicates there are no significant differences between the two algorithms.
m = 2 m = 3 m = 4DTLZ1 - � 3.9×10⁻¹³ � 7.9×10⁻¹⁵
DTLZ2 - - -DTLZ3 � 2.0×10⁻¹¹ � 3.9×10⁻¹³ � 3.5×10⁻¹²
DTLZ4 � 0.0052 - -DTLZ5 - - -DTLZ6 � 4.1×10⁻¹⁴ � 7.9×10⁻¹⁵ � 3.9×10⁻¹³
DTLZ7 - - � 1.5×10⁻⁴
WFG1 - � 1.6×10⁻⁷ -WFG2 - - -WFG3 - - -WFG4 - - -WFG5 - - -WFG6 � 1.5×10⁻⁴ - -WFG7 - - -WFG8 - - -WFG9 - - -
Table 2. Outcomes of the Fisher-independent test (α = 0.0125) on indicator values forDEMONS-II and NSGA-II. A ‘�’ (‘�’) under the indicator I means that DEMONS-II
is significantly better (worse) than NSGA-II regarding indicator I , while ‘-’ indicatesthere are no significant differences between the two algorithms regarding indicator I
m = 2 m = 3 m = 4I1
ε+ IH I1R2 I1
ε+ IH I1R2 I1
ε+ IH I1R2
DTLZ1 � � � � � � � � �DTLZ2 � � � � � � � � �DTLZ3 � � � � � � � � �DTLZ4 � � � � � � � � �DTLZ5 � � � � � � - � �DTLZ6 � � � � � � � � �DTLZ7 � � � � � � � � �WFG1 � � � � � � � � �WFG2 � � � � � � � � �WFG3 - � � � � � - � �WFG4 - � - - � � � � �WFG5 � - � - - - - - �WFG6 � � � � � � - � �WFG7 � � � � � � - � -WFG8 � - � - - - - - �WFG9 - � - - � � - - -
Differential Evolution Versus GAs in Multiobjective Optimization 265
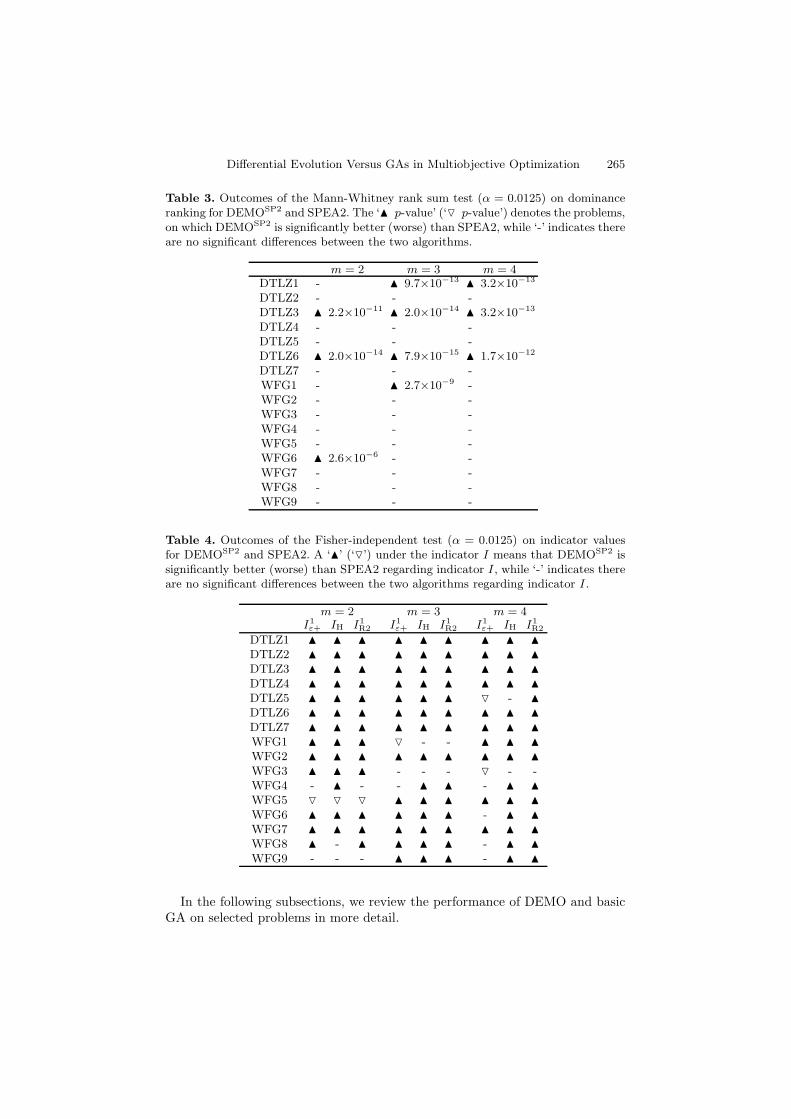
Table 3. Outcomes of the Mann-Whitney rank sum test (α = 0.0125) on dominanceranking for DEMOSP2 and SPEA2. The ‘� p-value’ (‘� p-value’) denotes the problems,on which DEMOSP2 is significantly better (worse) than SPEA2, while ‘-’ indicates thereare no significant differences between the two algorithms.
m = 2 m = 3 m = 4DTLZ1 - � 9.7×10⁻¹³ � 3.2×10⁻¹³
DTLZ2 - - -DTLZ3 � 2.2×10⁻¹¹ � 2.0×10⁻¹⁴ � 3.2×10⁻¹³
DTLZ4 - - -DTLZ5 - - -DTLZ6 � 2.0×10⁻¹⁴ � 7.9×10⁻¹⁵ � 1.7×10⁻¹²
DTLZ7 - - -WFG1 - � 2.7×10⁻⁹ -WFG2 - - -WFG3 - - -WFG4 - - -WFG5 - - -WFG6 � 2.6×10⁻⁶ - -WFG7 - - -WFG8 - - -WFG9 - - -
Table 4. Outcomes of the Fisher-independent test (α = 0.0125) on indicator valuesfor DEMOSP2 and SPEA2. A ‘�’ (‘�’) under the indicator I means that DEMOSP2 issignificantly better (worse) than SPEA2 regarding indicator I , while ‘-’ indicates thereare no significant differences between the two algorithms regarding indicator I .
m = 2 m = 3 m = 4I1
ε+ IH I1R2 I1
ε+ IH I1R2 I1
ε+ IH I1R2
DTLZ1 � � � � � � � � �DTLZ2 � � � � � � � � �DTLZ3 � � � � � � � � �DTLZ4 � � � � � � � � �DTLZ5 � � � � � � � - �DTLZ6 � � � � � � � � �DTLZ7 � � � � � � � � �WFG1 � � � � - - � � �WFG2 � � � � � � � � �WFG3 � � � - - - � - -WFG4 - � - - � � - � �WFG5 � � � � � � � � �WFG6 � � � � � � - � �WFG7 � � � � � � � � �WFG8 � - � � � � - � �WFG9 - - - � � � - � �
In the following subsections, we review the performance of DEMO and basicGA on selected problems in more detail.

266 T. Tusar and B. Filipic
Table 5. Outcomes of the Mann-Whitney rank sum test (α = 0.0125) on dominanceranking for DEMOIB and IBEA. The ‘� p-value’ (‘� p-value’) denotes the problems,on which DEMOIB is significantly better (worse) than IBEA, while ‘-’ indicates thereare no significant differences between the two algorithms.
m = 2 m = 3 m = 4DTLZ1 - - -DTLZ2 - - -DTLZ3 - � 3.0×10⁻¹² � 9.7×10⁻¹²
DTLZ4 � 0.0013 � 0.0104 -DTLZ5 - - -DTLZ6 � 1.2×10⁻¹³ � 2.4×10⁻¹¹ -DTLZ7 � 0.0023 � 1.3×10⁻⁷ � 1.8×10⁻⁷
WFG1 - � 0.0058 -WFG2 - - -WFG3 - - -WFG4 - - -WFG5 - - -WFG6 � 6.1×10⁻⁶ - -WFG7 - - -WFG8 - - -WFG9 - - -
Table 6. Outcomes of the Fisher-independent test (α = 0.0125) on indicator valuesfor DEMOIB and IBEA. A ‘�’ (‘�’) under the indicator I means that DEMOIB issignificantly better (worse) than IBEA regarding indicator I , while ‘-’ indicates thereare no significant differences between the two algorithms regarding indicator I .
m = 2 m = 3 m = 4I1
ε+ IH I1R2 I1
ε+ IH I1R2 I1
ε+ IH I1R2
DTLZ1 � � � � � � � � -DTLZ2 - - � - � � - - �DTLZ3 - � � � � � � � �DTLZ4 � � � � � � � � �DTLZ5 - - � � � � � � �DTLZ6 � � � � � � � � �DTLZ7 � � � � � � � � -WFG1 � � � � � � � � �WFG2 � � � � � � - � �WFG3 - � � - � � � � �WFG4 - � � - � � - � �WFG5 � � � - - � - � �WFG6 � � � � � � � � �WFG7 � � � - � � - � �WFG8 - - - - - � - - �WFG9 � � - - � � - - �

Differential Evolution Versus GAs in Multiobjective Optimization 267
1
1.2
1.4
1.6
1.8
2
1 1.2 1.4 1.6 1.8 2
DTLZ6
NSGA-IIDEMO NS-II
1 1.2
1.4 1.6
1.8 2 1 1.2 1.4 1.6 1.8 2
1 1.2 1.4 1.6 1.8
2
DTLZ6
NSGA-IIDEMO NS-II
(a) (b)
Fig. 5. Plots of normalized attainment surfaces and approximation sets of DEMONS-II
and NSGA-II on the DTLZ6 problem: (a) the best, worst and 50%-attainment surfacesfor each algorithm on the problem with two objectives; (b) 30 approximation sets foreach algorithm on the problem with three objectives
5.1 DEMONS-II vs. NSGA-II
The comparison between DEMO and the basic GA is very favorable to DEMO,when nondominated sorting is used for environmental selection. Let us explorein more detail the outcomes of both algorithms on the DTLZ6 problem. Thedifficulty of this problem reflects in poor convergence of certain algorithms to thePareto optimal front. Figure 5 shows that DEMONS-II reaches the Pareto optimalfront for m = 2 and m = 3, while NSGA-II does not. The most probable causefor such behavior is the repair method used by DEMO, since in this problem,the Pareto optimal set lies at the bounds of the decision space and boundarypoints are likely to be found after applying DEMO’s repair method.
It is interesting to note, however, that on the only other problem (DTLZ7),where the Pareto optimal set lies on the bounds of the decision space, no big dif-ferences between approximation sets could be noticed. This is probably becauseon this problem, none of the algorithms has difficulties in reaching the Paretooptimal front.
5.2 DEMOSP2 vs. SPEA2
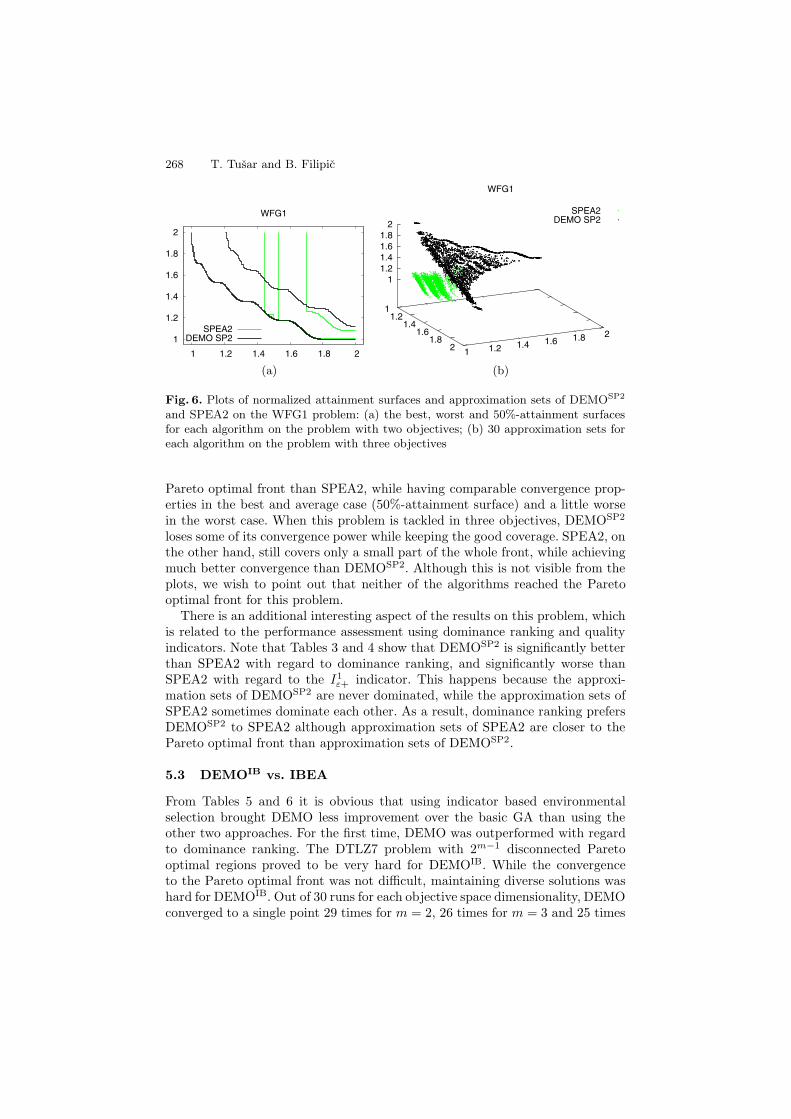
Using the strength Pareto approach for environmental selection yields very sim-ilar results in the comparison between DEMO and the basic GA as the use ofnondominated sorting. The findings from the previous subsection (on problemsDTLZ6 and DTLZ7) hold also for DEMOSP2 and SPEA2. Similarly, some ofthe characteristics of the comparison between DEMOSP2 and SPEA2 on theWFG1 problem, which will be discussed shortly, are true also when comparingDEMONS-II and NSGA-II.
Consider now the WFG1 problem for m = 2. From the plot of attainmentsurfaces (see Fig. 6) we can see that DEMOSP2 reaches a wider portion of the
268 T. Tusar and B. Filipic
1
1.2
1.4
1.6
1.8
2
1 1.2 1.4 1.6 1.8 2
WFG1
SPEA2DEMO SP2
1 1.2
1.4 1.6
1.8 2 1 1.2 1.4 1.6 1.8 2
1 1.2 1.4 1.6 1.8
2
WFG1
SPEA2DEMO SP2
(a) (b)
Fig. 6. Plots of normalized attainment surfaces and approximation sets of DEMOSP2
and SPEA2 on the WFG1 problem: (a) the best, worst and 50%-attainment surfacesfor each algorithm on the problem with two objectives; (b) 30 approximation sets foreach algorithm on the problem with three objectives
Pareto optimal front than SPEA2, while having comparable convergence prop-erties in the best and average case (50%-attainment surface) and a little worsein the worst case. When this problem is tackled in three objectives, DEMOSP2
loses some of its convergence power while keeping the good coverage. SPEA2, onthe other hand, still covers only a small part of the whole front, while achievingmuch better convergence than DEMOSP2. Although this is not visible from theplots, we wish to point out that neither of the algorithms reached the Paretooptimal front for this problem.
There is an additional interesting aspect of the results on this problem, whichis related to the performance assessment using dominance ranking and qualityindicators. Note that Tables 3 and 4 show that DEMOSP2 is significantly betterthan SPEA2 with regard to dominance ranking, and significantly worse thanSPEA2 with regard to the I1
ε+ indicator. This happens because the approxi-mation sets of DEMOSP2 are never dominated, while the approximation sets ofSPEA2 sometimes dominate each other. As a result, dominance ranking prefersDEMOSP2 to SPEA2 although approximation sets of SPEA2 are closer to thePareto optimal front than approximation sets of DEMOSP2.
5.3 DEMOIB vs. IBEA
From Tables 5 and 6 it is obvious that using indicator based environmentalselection brought DEMO less improvement over the basic GA than using theother two approaches. For the first time, DEMO was outperformed with regardto dominance ranking. The DTLZ7 problem with 2m−1 disconnected Paretooptimal regions proved to be very hard for DEMOIB. While the convergenceto the Pareto optimal front was not difficult, maintaining diverse solutions washard for DEMOIB. Out of 30 runs for each objective space dimensionality, DEMOconverged to a single point 29 times for m = 2, 26 times for m = 3 and 25 times

Differential Evolution Versus GAs in Multiobjective Optimization 269
1
1.2
1.4
1.6
1.8
2
1 1.2 1.4 1.6 1.8 2
DTLZ3
IBEADEMO IB
1 1.2
1.4 1.6
1.8 2
1 1.2 1.4 1.6 1.8 2
1 1.2 1.4 1.6 1.8
2
DTLZ3
IBEADEMO IB
(a) (b)
Fig. 7. Plots of normalized approximation sets of DEMOIB and IBEA on the DTLZ3problem: (a) 30 approximation sets for each algorithm on the problem with two ob-jectives; (b) 30 approximation sets for each algorithm on the problem with threeobjectives
for m = 4. Note, however, that in combination with all other approaches toenvironmental selection (including using I1
ε+ instead of IHD in indicator basedselection), DEMO could always maintain diverse solutions.
Let us analyze in more detail also the DTLZ3 problem, where the main dif-ficulty rises from its 310 − 1 local Pareto optimal fronts. As shown in the plotsin Fig. 7, IBEA has more difficulties in reaching the Pareto optimal front thanDEMOIB. In the case of two objectives, DEMOIB performs worse than IBEAin the worst case while achieving a much better spread in the best case. Onthe three-objective problem, DEMOIB achieves good results in all 30 runs, whileIBEA still gets stuck in local optima and has a poor spread of solutions.
6 Conclusion
This paper compared the well-known multiobjective evolutionary algorithmsNSGA-II, SPEA2 and IBEA to their DE-based variants DEMONS-II, DEMOSP2
and DEMOIB on 16 state-of-the-art benchmark problems (each with 2, 3 and4 objectives). The results have shown that on 20% of the problems, DEMOachieved significantly better dominance ranks than the basic GA, while signifi-cantly worse dominance ranks were obtained on only 3% of the problems. Fur-thermore, DEMO outperformed the basic GA with regard to the used qualityindicator on the majority (almost 83%) of the problems.
On the basis of these results we conclude that DE explores the decision spacemore efficiently than GAs also when multiple objectives need to be optimized.It is important to note, however, that DE and, consequently, DEMO are limitedto vector representation of solutions and can therefore only be used in numericaloptimization.

270 T. Tusar and B. Filipic
Acknowledgment
The work presented in the paper was supported by the Slovenian ResearchAgency under Research Program P2-0209 Artificial Intelligence and IntelligentSystems. The authors wish to thank Eckart Zitzler for useful comments on algo-rithm performance assessment.
References
1. Price, K.V., Storn, R.: Differential evolution – A simple evolution strategy for fastoptimization. Dr. Dobb’s Journal 22(4) (1997) 18–24
2. Price, K., Storn, R.M., Lampinen, J.A.: Differential Evolution: A Practical Ap-proach to Global Optimization. Springer-Verlag New York, Inc. (2005)
3. Deb, K., Pratap, A., Agrawal, S., Meyarivan, T.: A fast and elitist multiobjectivegenetic algorithm: NSGA–II. IEEE Transactions on Evolutionary Computation6(2) (2002) 182–197
4. Zitzler, E., Laumanns, M., Thiele, L.: SPEA2: Improving the strength Paretoevolutionary algorithm. In: Proceedings of Evolutionary Methods for Design, Op-timization and Control with Applications to Industrial Problems – EUROGEN2001. (2001) 95–100
5. Zitzler, E., Kunzli, S.: Indicator-based selection in multiobjective search. In: Pro-ceedings of the Eighth International Conference on Parallel Problem Solving fromNature – PPSN VIII. (2004) 832–842
6. Abbass, H.A., Sarker, R., Newton, C.: PDE: A Pareto-frontier differential evolutionapproach for multi-objective optimization problems. In: Proceedings of the 2001Congress on Evolutionary Computation – CEC 2001. Volume 2. (2001) 971–978
7. Lampinen, J.: DE’s selection rule for multiobjective optimization. Technical report,Lappeenranta University of Technology (2001)
8. Madavan, N.K.: Multiobjective optimization using a Pareto differential evolutionapproach. In: Proceedings of the 2002 Congress on Evolutionary Computation –CEC 2002. Volume 2. (2002) 1145–1150
9. Xue, F., Sanderson, A.C., Graves, R.J.: Pareto-based multi-objective differentialevolution. In: Proceedings of the 2003 Congress on Evolutionary Computation –CEC 2003. Volume 2. (2003) 862–869
10. Iorio, A.W., Li, X.: Solving rotated multi-objective optimization problems usingdifferential evolution. In: Proceedings of the 17th Australian Joint Conference onArtificial Intelligence – AI 2004. (2004) 861–872
11. Kukkonen, S., Lampinen, J.: An extension of generalized differential evolution formulti-objective optimization with constraints. In: Proceedings of Parallel ProblemSolving from Nature – PPSN VIII. (2004) 752–761
12. Robic, T., Filipic, B.: DEMO: Differential evolution for multiobjective optimiza-tion. In: Proceedings of the Third International Conference on Evolutionary Multi-Criterion Optimization – EMO 2005. (2005) 520–533
13. Kukkonen, S., Lampinen, J.: GDE3: The third evolution step of generalized dif-ferential evolution. In: Proceedings of the 2005 Congress on Evolutionary Compu-tation – CEC 2005. Volume 1. (2005) 443–450
14. Iorio, A.W., Li, X.: Incorporating directional information within a differentialevolution algorithm for multi-objective optimization. In: Proceedings of the 2006Genetic and Evolutionary Computation Conference – GECCO 2006. Volume 1.(2006) 675–682

Differential Evolution Versus GAs in Multiobjective Optimization 271
15. Santana-Quintero, L.V., Coello Coello, C.A.: An algorithm based on differentialevolution for multiobjective problems. In: Smart Engineering System Design: Neu-ral Networks, Evolutionary Programming and Artificial Life. (2005) 211–220
16. Hernandez-Dıaz, A.G., Santana-Quintero, L.V., Coello Coello, C., Caballero, R.,Molina, J.: A new proposal for multi-objective optimization using differential evo-lution and rough sets theory. In: Proceedings of the 2006 Genetic and EvolutionaryComputation Conference – GECCO 2006. Volume 1. (2006) 675–682
17. Deb, K., Thiele, L., Laumanns, M., Zitzler, E.: Scalable test problems for evo-lutionary multi-objective optimization. In Abraham, A., Jain, R., Goldberg, R.,eds.: Evolutionary Multiobjective Optimization: Theoretical Advances and Appli-cations. Springer (2005) 105–145
18. Huband, S., Barone, L., White, L., Hingston, P.: A scalable multi-objective testproblem toolkit. In: Proceedings of the Third International Conference on Evolu-tionary Multi-Criterion Optimization – EMO 2005. (2005) 280–295
19. Bleuler, S., Laumanns, M., Thiele, L., Zitzler, E.: PISA – A platform and program-ming language independent interface for search algorithms. In: Proceedings of theSecond International Conference on Evolutionary Multi-Criterion Optimization –EMO 2003. (2003) 494–508
20. Knowles, J.D., Thiele, L., Zitzler, E.: A tutorial on the performance assessment ofstochastic multiobjective optimizers. TIK-Report No. 214, Computer Engineeringand Networks Laboratory, ETH Zurich, Switzerland (2006)
21. Zitzler, E., Thiele, L., Laumanns, M., Fonseca, C.M., da Fonseca, V.D.: Perfor-mance assessment of multiobjective optimizers: An analysis and review. IEEETransactions on Evolutionary Computation 7(2) (2003) 117–132
22. Fonseca, C.M., Fleming, P.J.: On the performance assessment and comparison ofmultiobjective optimizers. In: Proceedings of Parallel Problem Solving from Nature– PPSN IV. (1996) 584–593