digital industrial company - general electric & life sciences strong + aviation execution on...
TRANSCRIPT

Imagination at work
J. R. Immelt
May 24, 2017
Digital Industrial Company
Caution Concerning Forward-Looking Statements: This document contains "forward-looking statements" – that is, statements related to future events that by their nature address matters that are, to different degrees, uncertain. For details on the uncertainties that may cause our actual future results to be materially different than those expressed in our forward-looking statements, see http://www.ge.com/investor-relations/disclaimer-caution-concerning-forward-looking-statements as well as our annual reports on Form 10-K and quarterly reports on Form 10-Q. We do not undertake to update our forward-looking statements. This document also includes certain forward-looking projected financial information that is based on current estimates and forecasts. Actual results could differ materially.
Non-GAAP Financial Measures:In this document, we sometimes use information derived from consolidated financial data but not presented in our financial statements prepared in accordance with U.S. generally accepted accounting principles (GAAP). Certain of these data are considered “non-GAAP financial measures” under the U.S. Securities and Exchange Commission rules. These non-GAAP financial measures supplement our GAAP disclosures and should not be considered an alternative to the GAAP measure. The reasons we use these non-GAAP financial measures and the reconciliations to their most directly comparable GAAP financial measures are posted to the investor relations section of our website at www.ge.com.
General Electric Capital Corporation (GECC) has been merged into GE and our financial services business is now operated by GE Capital Global Holdings LLC (GECGH). In this document, we refer to GECC and GECGH as “GE Capital”. We refer to the industrial businesses of the Company including GE Capital on an equity basis as “GE”. “GE (ex-GE Capital)” and /or “Industrial” refer to GE excluding GE Capital. Our financial services segment previously referred to as GE Capital is now referred to as Capital. GE’s Investor Relations website at www.ge.com/investor and our corporate blog at www.gereports.com, as well as GE’s Facebook page and Twitter accounts, contain a significant amount of information about GE, including financial and other information for investors. GE encourages investors to visit these websites from time to time, as information is updated and new information is posted.

2
• GE is committed to delivering in 2017 and the future … high-quality earnings and strong cash flow
• We are gaining share in our markets and have strong productivity programs underway
• Our balance sheet is strong … we are committed to capital allocation goals for dividend and buyback
• Markets are tougher … we have taken incremental cost actions
• All leadership metrics and compensation are aligned to the 2018 Bridge
• Our initiatives position GE to win in digital technologies & additive manufacturing

3
Environment
Slow growth & volatility
+ U.S. is ok … Europe is improving … Asia
strong … emerging markets are
improving
+ Deflation still possible … able to capture
supply chain value
+ Financing solutions … a valuable asset
+ Active cost-out program … restructuring
and ongoing efficiency
+ Customers value productivity
– Resource markets remain tough
impacting Oil & Gas, Power,
Transportation
– Equipment pricing tough
– Political volatility … Healthcare
Stronger dynamics Still challenging

4
2017 Industrial
Power Mixed
Renewable Energy Stable
Oil & Gas Challenging
Aviation Strong
Healthcare Improving
Transportation Challenging
EC & Lighting Mixed
Corporate
Industrial
Op profit outlook
Market December Today
++
++
-
+
+
- -
++
++
+/++
++
++
-
+
+
- -
++
++
+/++
= Power market tougher
+ Renewables repower strength, NPI launches
+ Healthcare U.S. uncertainty; rest of world & Life Sciences strong
+ Aviation execution on LEAP-a)
+ Opportunity for global growth
+ Digital & additive investments
- Oil-related markets remain challenging
Dynamics
Executing on organic growth, margin expansion, cost out, and FCF conversion
=/-
(a- LEAP is a trademark of CFM International. CFM is a 50/50 JV between GE and Snecma.

5
Operating EPS-a) $1.60-1.70
FCF + dispositions $16-20B
Cash returned to investors $19-21B
(a- Industrial operating and Vertical EPS(b- Deal taxes are excluded from CFOA and included in dispositions; GE Pension Plan funding excluded from CFOA but included in FCF + dispositions(c- FCF conversion estimate of 80-90% based on revised calculation methodology (see page 18)
• Industrial op profit $17.2B (ex. gains/restructuring)
• Organic growth of 3-5%• Margin expansion ~100 bps.• Structural cost out $1B• Corporate $1.8-2.0B• Alstom EPS ~$.09-.10• Restructuring = gains• Tax rate headwind (mid-teens)
• CFOA $18-21B-b); Capital dividend $6-7B• Pension funding ~$1.8B-b)
• Dispositions-b) of ~$4B; Net P&E of $3-4B
• Dividend of ~$8B• Buyback of ~$11-13B
2017 operating framework
1
2
3
Simpler portfolio … lots of action period of execution … GE Store foundation
Financial model on track: 3-5% organic growth, 100 bps. margin, 80-90% FCF conversion-c)
Investing to drive long-term growth + productivity … digital, additive
Items for today

6
Simpler & stronger portfolio
Aligned to big markets GE Store works
Distributed/central
Renewables
Gas/steam
Grid
+ $324B backlog
+ Significant installed base
+ ~1MM digital twins
+ Global footprint
+ Technical superiority … NPI
share gain
+ Financing capabilities/projects
+ Strong brand
+ Lead in digital & additive
Power
Aviation:
Commercial
Military
Systems
Locomotives
Transport
Imaging
Life Sciences
Devices
Healthcare
1
“Fullstream”
Resource
GE Digital
Lead Lead Lead Lead
GE Additive
GE Capital
Performance: 2012-2017E
Ind’l. EPS-a) Verticals EPS-a) CFOA-b)
~11-13% ~5% ~$117-120B ~$124-126B
Revenue-d) Industrial profit-a) Margins
~3-4% ~8% ~340 bps.
(a- 2012-2017 CAGR; Industrial profit excludes gains and restructuring & other items
(b- Excludes deal taxes and GE Pension Plan funding
(c- Includes Synchrony share exchange
(d- Industrial segment organic revenue average annual growth rate
Cash investors-c)
7
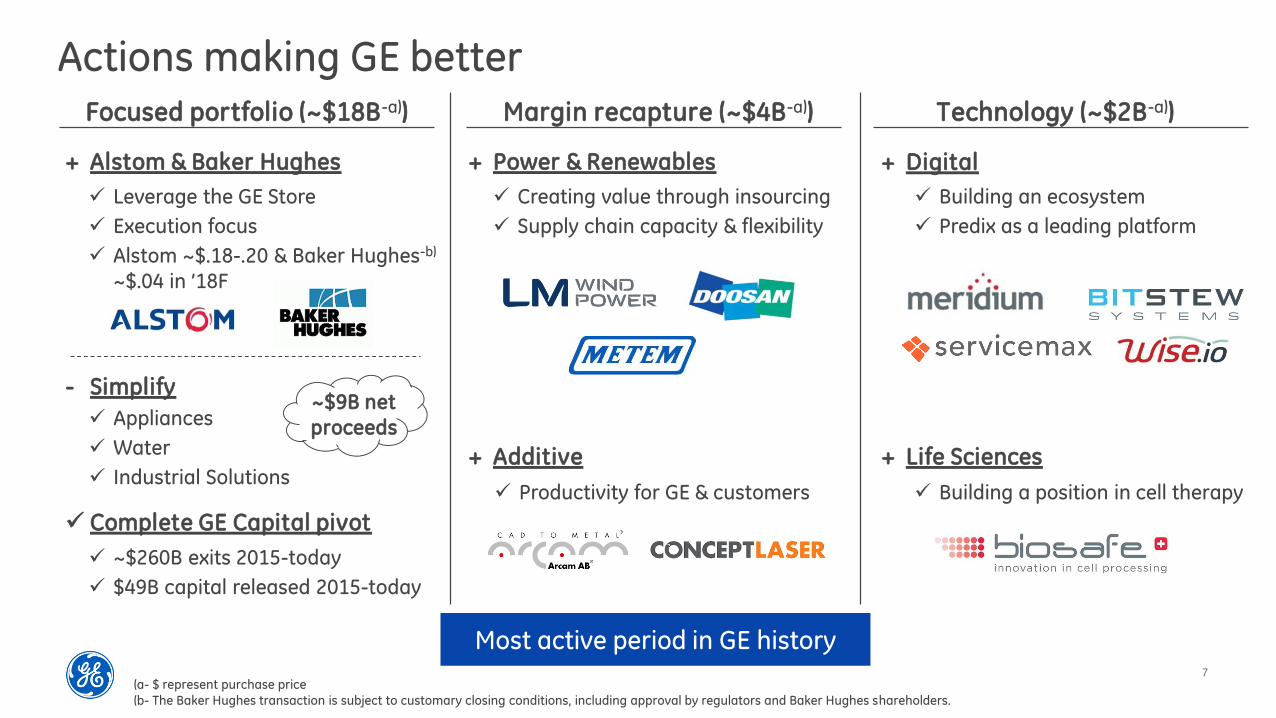
Actions making GE betterFocused portfolio (~$18B-a))
+ Alstom & Baker Hughes
Leverage the GE Store
Execution focus
Alstom ~$.18-.20 & Baker Hughes-b)
~$.04 in ’18F
Margin recapture (~$4B-a)) Technology (~$2B-a))
+ Power & Renewables + Digital
~$260B exits 2015-today
$49B capital released 2015-today
Complete GE Capital pivot
+ Additive + Life Sciences
Appliances
Water
Industrial Solutions
- Simplify~$9B net
proceeds
Creating value through insourcing
Supply chain capacity & flexibility
Building an ecosystem
Predix as a leading platform
Productivity for GE & customers Building a position in cell therapy
Most active period in GE history
(a- $ represent purchase price
(b- The Baker Hughes transaction is subject to customary closing conditions, including approval by regulators and Baker Hughes shareholders.

8
Oil & Gas outlookDeal pro-forma
2020F GE
EPS impact
~$0.08
Industry
+ Supply and demand currently tightening
- Recovery difficult to forecast … high inventory
= OPEC/Russia agreement holding, U.S.
Focused on lower cost per barrel … critical to win
Deal update
Great deal for both GE & BHI investors … on track to deliver commitments
• Integration planning going well … making decisions
on core processes, systems, & structure
• On track to deliver fullstream capability by
combining strengths … technology, services,
capability
• Significant synergy ideas … over 350 unique ideas
generated … targeting ~$1.6B by 2020
• Continuous customer engagement … very positive
feedback received
• Regulatory process progressing … S-4 filed with SEC
2020F
synergies
~$1.6B Substantially
higher pipeline

9
Physical & Digital technologies
GE Store: Technology & GRC
Aero Thermal
Biosciences
Characterization
CombustionAdditive
Composites
Imaging
Functional Matls
Manufacturing
Mechanical
Electronics
Electric Power
Metals
AI & Machine Learning
Industrial Outcomes
Optimization
Physical + Digital Analytics
AI Image Analytics
Digital Patterns & Systems
Interdisciplinary
Frontier Lab
Breakout Moves
Variable Cost Productivity
Product Management as a Science
Physical Core
Digital Core
Technology as enabler to outperform competition

10
Original estimate
Rest of turbine
Hot Gas Path
2016 2017E
10% in 2nd year
Growth: Winning with technology2
H turbine: share & contentLEAP: winning platform
Why we are winning
Cost
Outstanding performance … +15% better fuel burn than
current aircraft
Flying 9 hrs./day … +10% better utilization vs. competitor
Technology … ceramic matrix composites & 3D printing
LEAP is a trademark of CFM International
CFM is a 50/50 JV between GE and Snecma
Competitive position
Why we are winning
• Sole source on Boeing 737 MAX
• Sole source on COMAC C919
• 55% on Airbus A320neo … win rate
accelerating
63% efficiency
Full power in 23 minutes
18 months PO to power
80 MW/acre power density
Lowers $/KW
Predix & digital twin
Backlog
30
Win rate
~50%
Content
Cost
2015 2017E
~30%
~70%
% extended scope
1st Unit 2016 2017E
20%in 1st year
15%in 2nd year
LEAP costreduction 7HA.02 cost
reduction
30% in 1st year
Competitive position

11
Healthcare product leadership
New products Expanding margins
2015 2016
16.3% 17.3%
2017E
+ VCP 4X since 2014
SG&A as % of sales
Shared services
LS accelerating
Design
Footprint
Factory
Services
Simplified design & platforms … margins to GE
300+ dedicated cost-out engineers … focus
Local / LCC sourcing … leveraging “should cost”
Consolidated sites … reduced logistics, overhead
80% lean-certified production lines … 200 450
Brilliant factories … 5 60, additive, robotics
Reconfiguring product installs to cycle time
Remote fix & digital, unplanned downtimes
MR
3.0T Architect Cutting-edge
platform driven by Total Digital Imaging
Ultrasound
Venue POC Intuitive user
experience in a simple & fast tablet
Mammo
Senographe Pristina Improved design for
patient & tech Superior diagnostic
accuracy
Affordable care
Revolution ACT Improved image
quality with reduced dose
Cell therapy Contrast imaging
BioSafe Expanding into new
cell & therapy types
Clariscan range of MRI
contrast media
Focus on assets + GE domain Less emphasis on enterprise
HCIT

12
Organic growth: Global & Services
$75B orders target
Targeting expansion in
10/12 regions
Robust model in
protectionist world
Saudi $15B announced
($7B GE content)
Strong services positionStrong global position
~5%
+5-10%
5 year 2017E
$237B
$52B
2016 backlog
2016 revenue
5%+
Growth
GE Store
+ Regional strength … Europe, China, India
+ Strong financing capability … project development and risk management
+ Demand creation … healthcare, gas-to-power, wind
GE Store
+ Enhanced digital content … software & tools
+ New growth platforms … used material, upgrades
+ New analytical content … customer value
+ Expanded global footprint … shops and capability
(Orders growth)
+ Strong orders and backlog
+ Good NPI … gaining share
+ “Programmatic excellence” … services, global, digital
+ O&G backlog & orders improving for 2018 … price pressure
Foundation for 3-5% organic
growth
1Q orders growth+20%
1Q orders growth
+8%

13
Aggressive cost & margins plan
Industrial margins
Today’s cost out plan: $2B 2017-2018
2017 dynamics-a)
2016
$24.9
2017E
$23.9
2018F
$22.9
(a- Excludes non-operating pension, gains and restructuring & other; excludes impact from BD
actions including Appliances, Water, Industrial Solutions, and Baker Hughes
+ Base cost inflation
+ Digital investment
− Restructuring benefits
− Spend rate
2017E structural cost out
~$0.6
~0.7
~(1.5)
~(0.8)
$(1.0)
Structural cost-a)
2016
14%
2017E
~15%
2018F
16%+
Consistent with outlook
Imperatives
+ Lower product cost … manage through launches & drive VCP
+ Reduce structure & spend rate … restructuring yield & integration
+ Manage digital spend … review new funding models

14
Cost-out actionsEquipment margins
Improves with lower NPI launch
headwind
Run rate
~5%
2016
~1%
Drivers for improvement
1
2
3
4
Keep LEAP, H-turbine, and onshore wind NPIs on learning curve Capture more supply chain value … backward integration and sourcingBrilliant factory … plant productivity programsProduct management execution … drives improved pricing and qualityStrong focus/metrics on product cost5
Structure & simplification
2017E 2018F
1
2
3
Restructuring impact … integration, rooftop
reduction, fewer layers
Horizontal COEs … including IT … global operations
Commercial productivity … digital tools
Leaner Corporate and segment HQ structures
Industrial structural cost out
+ Lower cost headwind on product launches
+ Incremental $1B of structural cost reduction
+ “Programmatic” execution on simplification & margins … building a bigger pipeline
Foundation for100 bps.+ margin
expansion
4
Drivers for improvement
$1B $1B

15
Cash business model
DriversIndustrial CFOA-a)
$11.6$12-14
2016 2017E
NI & depreciation
Working capital
Contract assets
Other
Industrial CFOA-a)
+
=/+
=/-
=/+
$12-14
2017E
$13.0
3.2
(3.9)
(0.7)
$11.6
2016
(a- Industrial CFOA ex. deal taxes and GE Pension Plan funding
Business model
$6-7B opportunity
primarily from
inventory, receivables,
and payables
Negative working capital
Reinvestment ~1x
Product launches,
multi-modal sites
Big launches
behind us
Leverage investment
Customer value
Strong competitive
dynamics
Productivity
programs
Maximize value of services assets1 2 3
1Q’17
$(1.2)B
Target P&E
<$3B
Backlog
$240B
LTSA asset
$14B
($ in billions)
(1Q17 balances)

16
… adjusting to a different global footprint
Improve working capital
Working capital flows
Projectpipeline
$5B+ Integrated sales, inventory &
operations planning
Lean manufacturing
Cycle time reduction
Slow moving inventory
Drivers Lean @ EC … from 213 days to a “30 day generator”
86% cycle time + 65% inventory at 1 site … scaling approach across GE
Streamlined & reduced 6 operations to 1 via the lean toolkit (ex. VSM, 3P)
KPI
LT reduction (days)
Inventory balance ($MM)
Inventory turns
’16 baseline
213
$4.4
2.7
’17 target
30
$1.6
12
V%
(86)%
(65)%
4x
Inventory 7 turns
1
2
3
Progress in line with industry, ahead of peers
… =/+ going forward in line with orders
Improve purchasing spread
Payables (terms ) … 81 90+ days
Receivables (past dues ) … 85 75 days
Integrate acquisitions … get back to better
inventory turns
Suite 6
2014 2015 2016 2017E
$(1.0) $(0.4)
$3.2 $3+
~130 dedicated resources
($ in billions)

17
Long-term service agreements portfolio
Services backlog
2013
$185
2014 2015
$195$226
2016
$237
LTSA asset $7.8 $9.0 $10.3 $12.8
% of backlog 4.2% 4.6% 4.6% 5.4%
LTSA collections $7.8 $8.3 $9.7 $11.5
Technology impact LTSA asset Returns
Benefits
Customer
GE
• Predictable maintenance cost
• Comprehensive services, risk transfer
• Reliability goals aligned to OEM
• More productive asset
• ~1MM digital twins• Fleet vs. asset performance
• Represents expected future cash
• Productivity, upgrades, and modifications impact timing
• <$100MM credit losses since 2000 … rigorous audits & reviews
LTSA asset (1Q’17)
$14B
Services margins
~32% 30%+
LTSA IRR
Productivity
Upgrades
Price
Extensions
• Alignment with customer … exclusive relationship
• Predictable spare parts usage
• Higher margins, returns, cash
• Increases competitiveness on new campaigns
• ~400 AGPs sold to-date• 2%+ efficiency, extended life
($ in billions)
Purposeful investment in customer value and GE position Excellent risk management protection Asset growth slower over time … NPI cycle, upgrades, performance investment
LTSAs higher

18
Industrial FCF conversion
FCF conversion
$8.3
3.9
(1.0)
2.5
-
(4.1)
$9.6
(1.6)
$8.1
$9.1
91%
96%
2015
99%91%
2014 2016
Continuing income
Depreciation + amortization
Working capital
Other operating (ex. deal taxes)
GE Pension Plan funding
Net P&E + cap. software
FCF ex. contract assets
Contract assets
FCF
FCF ex. gains/restructuring
FCF conversion “old basis” -a)
$9.6
4.0
(0.4)
0.9
-
(3.6)
$10.6
(1.9)
$8.6
$9.6
82%
$10.4
4.3
3.2
(2.4)
(0.3)
(3.4)
$11.8
(3.9)
$7.8
$9.6
76%
Foundation for FCF goals
80-90%
2017E
116% 109% 113%
97% 90% 76%
96% 99% 91%
Blue = FCF conversion
Longer cycle company with more
global footprint + NPI cycle
Market cycles impact progress
collections timing & dynamics
($ in billions)
(a- FCF conversion “old basis” calculated as a percentage of Industrial operating net income; FCF included gains & restructuring
but excluded GE Pension Plan funding & software capitalization
Expectations post-2017 …
• Working capital improvement continues but not at
2016-2017 levels
• Contract asset growth slows
• GE Pension Plan funding continues
• Plant & equipment investment ~flat
• Software spend slows
• Gains & restructuring headwind abates
ex. gains and restructuring & other ex. gains and restructuring & other
19
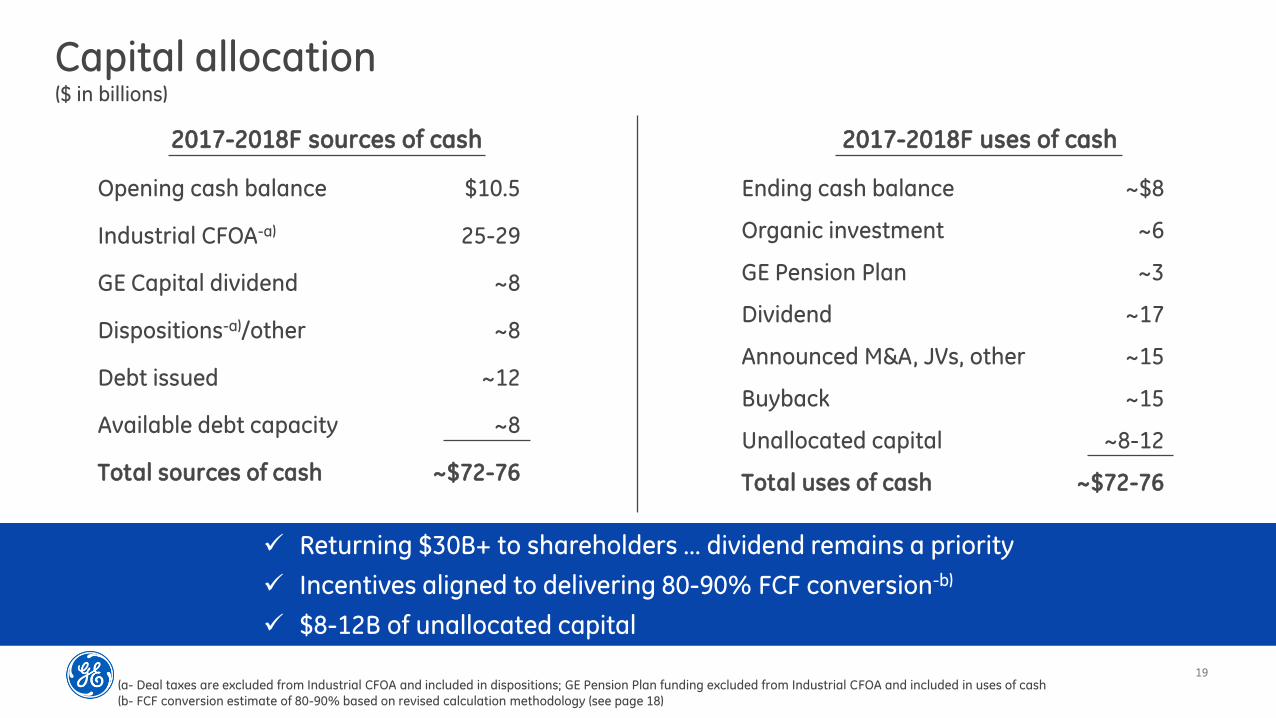
Capital allocation
$10.5
25-29
~8
~8
~12
~8
~$72-76
2017-2018F sources of cash
Returning $30B+ to shareholders … dividend remains a priority
Incentives aligned to delivering 80-90% FCF conversion-b)
$8-12B of unallocated capital
Opening cash balance
Industrial CFOA-a)
GE Capital dividend
Dispositions-a)/other
Debt issued
Available debt capacity
Total sources of cash
2017-2018F uses of cash
~$8
~6
~3
~17
~15
~15
~8-12
~$72-76
Ending cash balance
Organic investment
GE Pension Plan
Dividend
Announced M&A, JVs, other
Buyback
Unallocated capital
Total uses of cash
($ in billions)
(a- Deal taxes are excluded from Industrial CFOA and included in dispositions; GE Pension Plan funding excluded from Industrial CFOA and included in uses of cash
(b- FCF conversion estimate of 80-90% based on revised calculation methodology (see page 18)

20
Invest in Digital3
Asset Modeling
BrilliantManufacturing
Edge Connectivity
CommonApplication
Services
Catalogs & Marketplace
Predix System
Data Security
Digital Twin
Applications
+
Predix Machine Edge Manager Edge Security
AnalyticsOrchestration
Data Ingestion& Integration
APM Services
400 partners
35K developers
50+ EVP customers
5 non-GE industries
1MM+ digital twins
Incremental services growth, more productivity, better products
Valuable platform created … assets and services
Return on investment
2017E metrics Value creation
1
2
3
$5B++20-30%
SW & Predix
orders
Make Predix an essential analytical platform
Use Twins and Edge technology to increase asset entitlement
Lead in three key apps: APM, services, manufacturing
Fully integrate throughout GE
“Digital stack”

21
Oil & Gas extensions and products
Pipeline
$1B+
Insights
Reliability & Life
Compliance & Integrity
Maintenance & Utilization Resources Production Process
Design& Planning
Product Categories
APM Machine & Equipment Health
APM Reliability Management
APM Compliance & Integrity Mgmt.
APM Asset Strategy
Optimization
Enterprise ImpactInsights
Enterprise ImpactAnalytics
Predictive Corrosion
Management
Digital Twin Modeling & Analytics Framework
Asset Services Data Services Event Services Orchestration Operations
Data Connectivity & Ingestion
Relevant to all Product
Lines
Onshore Product Line
Specific
Onshore InsightsOnshore Lift Diagnostics
Onshore Lift Optimization
IntelliStream Portfolio: SaaS for Oil & Gas fullstream
+50%
Digital orders
~$400MM
2017 targets Key Digital Transformation engagements
GE & partners developing full suite of apps for the industry

22
Digital service platformGE Digital productivity: ServiceGE Digital service platform
Manage Execute Forecast
ServiceMax Field Vision Smart Contract
Workflow optimization Mobile field execution Value maximization
Asset passport Smart shop Service cycle
IB management Scheduling & planning Analytical tools
Improve Predix + APM + Digital Twin + Analytics
Field engineer efficiency(ServiceMax, Field Vision)
$150+
$MM
Repair/material(APM, Smart Shop)
$150+
IB upgrades(Asset Passport, Smart Contract, Service Cycle)
++
ServiceMax a gateway CRM for services
Large category being created around industrial service & field management
CRM platforms a useful comparisonPipeline
~$400MM $40B market identified 75% growth since acquisition Pipeline +20% … new and core customers Product roadmap with content & analytics Focus … OEM-led service & operations-led
serviceSales
+++
Service
Margin created
Digital tools

23
Additive leadership
External markets
Aviation Healthcare Automotive
Accelerating deployment …internally & across the industry
Resetting supply chain cost entitlement
No structural casting in Advanced Turbo Prop
Heat exchanger: 242 parts1 part, 50% weight reduction
Weight reduction & better aerodynamics
Improved thermal management
Building momentum in the medical implant market
High performance implants (hip, knee, dental)
On-demand, patient-specific production … reduced cycle time
2017 goals Establishing product line
Growing capacity
Building capabilities
Materials
Predix enablement
Financing platforms in place
Establish breakout moves (size, speed)
Multiple modalities/hybrid machine
Improve cycle times … design, production
Lower cost of ownership
Understand “Moore’s law” for additive
New product investment
~400
$300MM
$500MM
200 prototypes
Units
Revenue
Revenue pipeline
GE parts

24
Additive driving internal productivity
Savings
identified
$3.5B
2,000+ 55 person tiger
team
33 material experts
+ Consolidate GRC and all business efforts
+ 13 materials in development
+ NPI pipeline … accelerating product
roadmap to capture opportunity
Hydro design/tech validation
50% faster to market and lower cost
Oil & Gas compressor seal
20% cheaper plus win in aftermarket
Transportation heat exchangers
30% cheaper and more reliable ; Additional system opportunities
Power Turbine stator components
35% cheaper and performance improvement
Healthcare CT collimator
Impacting value chain across GE
1000+ application ideas identified
110 prototypes made
$500MM+ new savings identified
Acceleration in the last 90 days
GE engineers
engaged

25
Incentives are aligned
+ Company EPS, op profit, margins & FCF aligned to this plan
+ Business metrics tie to 3-5% organic growth, 100 bps. margin expansion, and working capital improvements
+ Strategic goals align with long-term value creation: share, integration, NPI, global development, digital
AEIP: 2017 Long-term incentive plan (2016-2018)
Cumulative EPS $5.05-$5.55
Industrial profit margins 15-17%
Industrial ROTC 16-18%
Total cash generated $70-97B
Cash returned to investors $55-67B

26
Original goal View of 2017
2015
$1.31
– Markets tougher … oil & gas related– Revenue recognition accounting change+ Better cost performance+ Capital allocation … buyback & M&A are on plan
3-5% organic growth with 100 bps. margin expansion … cost out supports tougher markets
Baker Hughes, Alstom, & buyback on track
Confirm 2017 framework of $1.60-1.70 EPS
Expect high-quality earnings … EBIT & FCF conversion
+ Operations
+ Buyback
+ Capital allocation
2018F
$2+
2017E
$1.60-$1.70
+ Leadership goals aligned to the Bridge
+ Capital allocation and acquisition impact in line with expectations
+ Revenue recognition accounting change impact estimated to be ~$(0.05) EPS
+ We expect 2018 to be in line with our goals of 3-5% organic growth and 100 bps. of margin improvement
+ $2 EPS is at high end of expectations where markets are today … hitting goals will require additional cost contingencies
Investor view: 2018
The Bridge
