digital drag: ranking 125 nations by taxes and tariffs … drag: ranking 125 nations by taxes and...
TRANSCRIPT
Digital Drag: Ranking 125 Nations by Taxes and Tariffs on ICT Goods and Services BY BEN MILLER AND ROBERT D. ATKINSON | OCTOBER 2014
THE INFORMATION TECHNOLOGY & INNOVATION FOUNDATION | OCTOBER 2014
Information and communications technology (ICT) has driven productivity growth over the past two decades in the developed world, and has been a major facilitator of growth in developing countries as well. Yet despite clear economic benefits from ICT, a number of countries persist in discouraging its use by adding extra costs in the form of tariffs and specific taxes. These added costs limit ICT adoption and the productivity increases associated with it. If countries resist the temptation to impose excess taxes on ICT goods and services and eliminate ICT tariffs, they will reap the benefits in broader digital adoption by businesses and consumers, leading to faster economic growth and increased quality of life. Governments raise ICT costs through two main channels: discriminatory taxes and tariffs. Many nations, particularly lower- and lower-middle-income countries, have imposed additional and discriminatory taxes on ICT goods and services. Many countries also maintain high tariffs on imported ICT goods. Of the 125 countries examined in this report, over 10 percent have raised ICT taxes and tariffs to very high levels. (Figure 1) Bangladesh has drastically inflated the price of ICT goods and services, adding close to 60 percent to their cost above the basic price. Turkey and the Congo add around 25 percent to the price. Turkey’s high ranking is especially notable because its costs are due almost entirely to taxes, not tariffs. This fact is thanks to Turkey’s membership in the successful Information Technology Agreement (ITA), a treaty limiting tariffs on ICT goods.
After these three countries comes a wide assortment of developing countries, from Brazil to Iran to Gabon. At least 14 countries have ICT-specific tax and tariff rates
Economic evidence is clear that government policies that raise the costs of ICT goods and services reduce adoption by consumers and businesses. Reduced adoption rates in turn reduce economic growth.

PAGE 2 THE INFORMATION TECHNOLOGY & INNOVATION FOUNDATION | OCTOBER 2014
above 10 percent, while 36 countries have rates above 5 percent. The one member of the Organization for Economic Cooperation and Development (OECD) to rank in the top 20 countries is Greece, at number 15 with 9.6 percent added ICT costs. Chile is the only other OECD country in the top 50, at 39th place with 4 percent added costs. These costs are in addition to the other sales or value-added taxes virtually all nations impose.
Figure 1: Map of countries by total taxes and tariffs for consumer ICT products and services1
The scholarly economic evidence is clear that higher taxes and tariffs on ICT goods and services reduce adoption. This is because the adoption of ICT depends on its price, particularly in low-income countries. We use existing estimates of elasticity of ICT demand by continent ranging between -0.2 (North America) to -1.4 (South Asia) to determine how ICT taxes and tariffs impact consumer adoption. These estimates result in substantial decreases in adoption: over 20 percent for Bangladesh, Brazil, and the Congo; between 10 percent and 20 percent for 11 more countries, including Argentina, Pakistan, Ecuador, and Turkey; and between 5 percent and 10 percent for another 18 countries.
Reduced adoption rates by consumers in turn reduce economic growth. Rough estimates point to yearly growth reductions on the order of 0.7 percentage points to 2.3 percentage points of gross domestic product per capita for countries with the highest tax and tariff rates. This is a significant drag on economic growth and the losses accrue quickly over time. Moreover, this drag on growth reduces overall government tax revenues, and simulations show that these lost revenues due to lower growth typically surpass the government revenue gains from ICT taxes and tariffs within several years.
Although this report does not attempt to quantify the impact of adoption on economic growth, a number of studies have found that higher ICT prices reduce their adoption by business and that this in turn reduces productivity and sales. Many of the same countries with high added costs on consumer ICT products have also enacted high taxes and tariffs on business-use ICT products. (Figure 2) Forty-six nations impose a total cost on business purchases of ICT goods and services of more than 5 percent. Among top countries, tariffs comprise a much larger percentage of total business ICT cost addition than taxes. Fully one

PAGE 3 THE INFORMATION TECHNOLOGY & INNOVATION FOUNDATION | OCTOBER 2014
half of the top 50 countries for ICT tax and tariff rates are from Sub-Saharan Africa, with 11 countries from Latin America and the Caribbean and the rest from other regions. These tariffs and taxes, along with other barriers, have not led to the growth of nations’ “infant” ICT industries; but as the scholarly evidence shows, they do limit the adoption of ICT by businesses, including small businesses, limiting productivity growth and competitiveness.
Figure 2: Map of countries by total taxes and tariffs for business-use ICT products and services2
Policy recommendations for reducing this fiscal drag on ICT adoption and increasing growth are simple: remove ICT-specific taxes; eliminate tariffs, including by expanding the ITA scope and number of members; and ensure that trade barriers to purchasing best-in-class ICT goods and services are eliminated.
Rather than a policy or even political issue, the barriers to removing ICT taxes and tariffs are primarily an issue of perspective. Countries need to stop seeing ICT products simply as luxury goods or reliable sources of revenue and stop viewing the ICT industry as a key “infant industry.” Rather, they need to see ICT for what it really is: a powerful tool to help businesses and consumers boost productivity and improve quality of life. But they can only do that if ICT is affordable, and the simplest way for governments to achieve that goal is to stop raising prices by adding special taxes, tariffs, and trade barriers on ICT goods and services.
ICT DRIVES PROSPERITY, INNOVATION, AND QUALITY OF LIFE Over the past 20 years, ICT has proven to be a powerful force for economic change, bringing benefits to hundreds of millions of people. ICT has both raised incomes around the world and improved quality of life. ICT increases wealth by driving productivity gains in industries across the economy, from the technology industry itself to banking to retail, and also by reducing costs for consumer activities like mailing a letter or making a phone call. ICT also raises the rate of technological change by increasing innovation, making collaboration easier and providing more resources for innovators.

PAGE 4 THE INFORMATION TECHNOLOGY & INNOVATION FOUNDATION | OCTOBER 2014
ICT is a key driver of productivity because it is what economists call a “general purpose technology” (GPT), like electricity, steel, or factory systems. GPTs have historically appeared at a rate of once every half century, and they represent systems of fundamentally new technologies that change virtually everything, including: what economies produce; how they produce it; how production is organized and managed; the location of productive activity; the skills required for productive activity; the infrastructure needed to enable and support it; and the laws and regulations needed to maintain or even allow it.3 GPTs share a variety of similar characteristics. They typically start in relatively crude form for a single purpose or very few purposes; they increase in sophistication as they diffuse throughout the economy; they engender extensive spillovers in the forms of externalities and technological complementarities; and their evolution and diffusion span decades.4 Moreover, GPTs undergo rapid price declines and performance improvements; become pervasive and an integral part of most industries, products, and functions; and enable downstream innovations in products, processes, business models, and business organization. By any of these measures, ICT ranks well against the most transformative technological breakthroughs in human history.5
This is why ICT is such an important enabler of better tools to drive productivity. The United States was among the first to invest in and adopt these tools and was also the first to see large productivity gains from ICT. Studies have shown that ICT was responsible for as much as two thirds of U.S. productivity growth between 1995 and 2002, and approximately one third of growth since then.6 And it’s not just the United States. In a conclusive review of over 50 scholarly studies on ICT and productivity published between 1987 and 2002, Dedrick, Gurbaxani, and Kraemer found that “at both the firm and the country level, greater investment in ICT is associated with greater productivity growth.”7 In fact, nearly all scholarly studies since the mid-1990s through to 2014 have found positive and significant effects of ICT on productivity.8
Industry Use and Investment in ICT The beneficial effects of ICT on productivity have been found across different levels and sectors of economies, from firms to industries to entire economies, and in both goods- and services-producing industries.9 Firm-level studies have also shown that “firms with high levels of ICT are more likely to grow (in terms of employment) and less likely to [go out of business].”10 And the effect is fairly straightforward: cross-country studies through the 1990s and 2000s found that a 10 percent increase in (wired and wireless) broadband penetration increased economic growth by more than 1 percent in developed countries.11
Investment in ICT is significantly more productive than investment in other areas. Studies in the early 2000s found that investment in ICT capital increased productivity by three to eight times more than investment in non-ICT capital.12 Likewise, Wilson finds that of all types of capital, only computers, communications equipment, and software are positively associated with multi-factor productivity.13 Hitt and Tambe find that the spillovers from IT nearly double the impact of IT investments.14 Rincon, Vecchi, and Venturini confirm the GPT nature of ICTs through an exhaustive industry-level study of both productivity benefits and spillovers.15
Nearly all scholarly studies since the mid-1990s have found positive and significant effects of ICT on productivity.

PAGE 5 THE INFORMATION TECHNOLOGY & INNOVATION FOUNDATION | OCTOBER 2014
In recent years, as mobile and other ICTs have gained ground in developing countries, the universal impact of ICTs has become clear. In fact, ICT is now having a larger effect on growth in developing countries than in developed ones.16 Recent country-level and international reports have examined the impact of ICTs in developing countries, from India and Malaysia to Africa and Latin America, finding productivity gains for individual businesses and industries.17 And the effect continues as technologies improve: a 2012 report using data from 96 developed and developing countries found that transitioning from mobile voice to mobile broadband services increased economic growth significantly.18
There are at least three reasons why ICT has stronger effects on productivity than other capital. First, ICT allows firms to pick off the “low hanging fruit” of relatively easy-to-improve efficiencies. This is particularly true in developing countries, which, for example, may not have even had a working postal service prior to widespread mobile availability. Second, ICT doesn’t just automate tasks, it also has widespread complementary effects, including allowing companies to fundamentally reengineer processes. Third, IT has what economists call “network externalities,” which are the “spillovers” from adding additional users to a network.19 Simply put, increasing the user size of a network makes all current users better off. When these three factors are combined, ICT can have a big impact.
Adoption by Consumers ICT doesn’t just raise business productivity, though. A number of studies, primarily focusing on broadband, have examined the effect of ICT on the consumer side and have shown that ICT can increase individual and aggregate income as well.20 It is not hard to imagine why: for example, ICT brings reductions in information costs to users, which can give them better access to job market information and can make their information more available to employers. ICT use also contributes to human capital, as ICT skills themselves are in demand in many jobs. Computer and Internet access has been shown to increase entrepreneurship as well.21
The interaction between consumer and business adoption of ICT is another key piece of the puzzle. To a large extent, ICT is an important technology precisely because of the economies of scale and network effects it enables. These benefits can only be fully realized when both the supply and the demand sides engage with the technology. Mobile and Internet technology can provide important services cheaply and efficiently, and they offer a particular advantage in developing countries without existing infrastructure. And it’s not just online ordering: ICT holds enormous potential for financial services, health services, educational opportunities, and many other sectors.
WHY ICT PRICES MATTER In order for either consumers or businesses to invest in productive ICT, the price must be right. That is, the economic benefits of ICT products and services must outweigh the costs of provision in order for customers to buy and use them. More formally, we can say that the market brings the cost of providing ICT together with customer demand for it, and this market interaction determines the price and the quantity demanded. The cost of providing ICT goods and services can also be influenced by government policies, however,

PAGE 6 THE INFORMATION TECHNOLOGY & INNOVATION FOUNDATION | OCTOBER 2014
and when governments enact taxes and tariffs that raise the price of ICT they reduce demand for ICT.
It is worth mentioning a number of other factors aside from taxes and tariffs that contribute to the cost and demand for ICT products and services. Costs depend on existing infrastructure and exchange rates, among other factors. Government subsidies or firm cross-subsidies can also affect price. Consumer demand for ICT, on the other hand, can be constrained by literacy rates (standard or digital), or a lack of content or usefulness for potential users.22 All of these factors vary significantly between countries and even between regions or localities within a country.
In their recent study on fixed and mobile broadband, Katz and Berry organize these disparate factors into a conceptual framework that can be applied to ICT goods and services more generally. In their framework, countries move through three stages of mobile and fixed broadband barriers: from supply barriers, to affordability barriers, to digital literacy and cultural relevance barriers.23 Affordability is the primary concern in the middle stage because while early and late adopters are less sensitive to price, middle-stage adopters—typically the largest group—are more dependent on affordability.
Another important caveat is that ICT consumption and adoption is not a simple binary outcome. ICT covers a broad range of categories, from basic voice-only mobile phones to tablets to powerful desktop computers. If one product is not affordable, consumers may opt for a more affordable alternative, such as a voice-only plan instead of a data plan, a less powerful computer, or one cell phone per household instead of two. When cheaper alternatives lack the features, usefulness, or power of more expensive choices, this can slow the benefits of ICT just as much as forgoing digital consumption altogether.
Elasticity Basics If affordability is not always a key factor in ICT adoption, then we need to examine when and why affordability is important. This can be done using a basic concept called price elasticity of demand, which measures the change in demand caused by a given change in price. However, the same percentage change may not always have the same percentage effect. For this reason, it is important to be careful when estimating how much price changes demand.
The price elasticity of demand measures how strongly taxes and tariffs affect ICT adoption, because it shows how consumers will change their spending on ICT when prices change. Estimates for the price elasticity of demand for ICT goods and services range from -0.2 to -3.8. In other words, a price increase (or decrease) of 1 percent leads to a decrease (or increase) in consumption by consumers of ICT goods and services of anywhere from 0.2 percent to 3.8 percent.
This range of estimates is extremely broad, but not so broad as to be meaningless. First, as expected, elasticity is negative, meaning that as price declines consumption will increase. Second, many estimates of elasticity are relatively high (i.e., higher than -2).24 This is significant, because in theory the demand for many ICT goods and services could be relatively inelastic, or unresponsive to price, because ICT plays such an important role in
A price increase of 1 percent leads to a decrease in consumption by consumers of ICT goods and services of anywhere from 0.2 percent to 3.8 percent.

PAGE 7 THE INFORMATION TECHNOLOGY & INNOVATION FOUNDATION | OCTOBER 2014
people’s lives. Many people in developed countries would feel lost without their smartphone. ICT goods have become very important in many people’s lives, as shown by a recent poll in the UK, in which people ranked the Internet and Facebook as more vital to their life than flush toilets and indoor plumbing.25 In such a world, where people view ICT products as absolutely essential and price elasticity is therefore low, taxation or tariffs would have a smaller effect on consumption because people would buy ICT goods and services regardless of their price.
Given that most estimates of elasticity are large, however, it appears that consumers do adjust their consumption of most types of ICT based on the price. This does not mean that ICT goods and services are not important, of course. It merely means that they are competing with many other important things in people’s budgets—things such as food, housing, medical expenses. Moreover, ICT goods and services are not monolithic, especially now with the proliferation of varied services and goods (e.g., data plans for second devices, tablets and e-readers, second or third devices, etc.). Thus, even if in developed nations many people and businesses have a high level of adoption of some ICT product or service, taxes and tariffs can negatively affect consumption of other ICT products and services.
Price elasticity of demand measures whether consumers buy goods and services, but there is a related concept that is also useful when thinking about ICT taxes and tariffs. The cross-price elasticity of demand measures at what price consumers will switch between two goods. This is particularly relevant in terms of ICT goods, where relatively close substitutes are available, because it means that countries need to worry about the possibility of diverting the purchase of ICT goods from legitimate, taxed vendors to either the black market or other countries with lower taxes. If everyone in Turkey who wants a smartphone can simply buy it in say, Bulgaria, then Turkey could not only miss out on the tax revenue from smartphone sales but it could also hurt its retail industry.
Cross-price elasticity is also important because of the way consumers and businesses substitute between types or quality levels of ICT goods and services. These tradeoffs come at a cost, however: when a consumer or business substitutes a cheaper smartphone instead of a better smartphone rendered unaffordable by tax, they are compromising quality. These compromises apply up the entire chain of ICT goods, from basic voice phones to powerful workstation laptops. And they imply that ICT taxes and tariffs can keep countries in a permanent state of catch-up, as adoption of each new product lags behind countries with lower ICT prices.
Cross-price elasticity of demand should be an important concern for policymakers. For our purposes, however, the standard price elasticity of demand will suffice. For the remainder of the paper “elasticity” should be assumed to refer to price elasticity of demand. The large range for the price elasticity of demand, -0.2 to -3.8, is a clue to start looking for reasons why elasticity might vary. Several reasons for the changing importance of affordability have already been mentioned, and the following section will explore those reasons more fully in order to arrive at usable estimates.

PAGE 8 THE INFORMATION TECHNOLOGY & INNOVATION FOUNDATION | OCTOBER 2014
Estimating Specific Elasticities By diving deeper into estimates of the determinants of elasticity we can get a better idea of how taxes and tariffs affect ICT adoption, and how adoption in turn may affect economic growth. The data on ICT price elasticity is not comprehensive but it is sufficient to provide estimates so long as we account for several types of variation. ICT elasticity has been found to vary significantly with ICT penetration and use rates, which change over time and between countries. Elasticity also varies by types of ICT products and services, in particular between fixed broadband, mobile broadband, mobile voice and consumer products. Finally, we can expect ICT-using businesses to have different elasticities from consumers.26
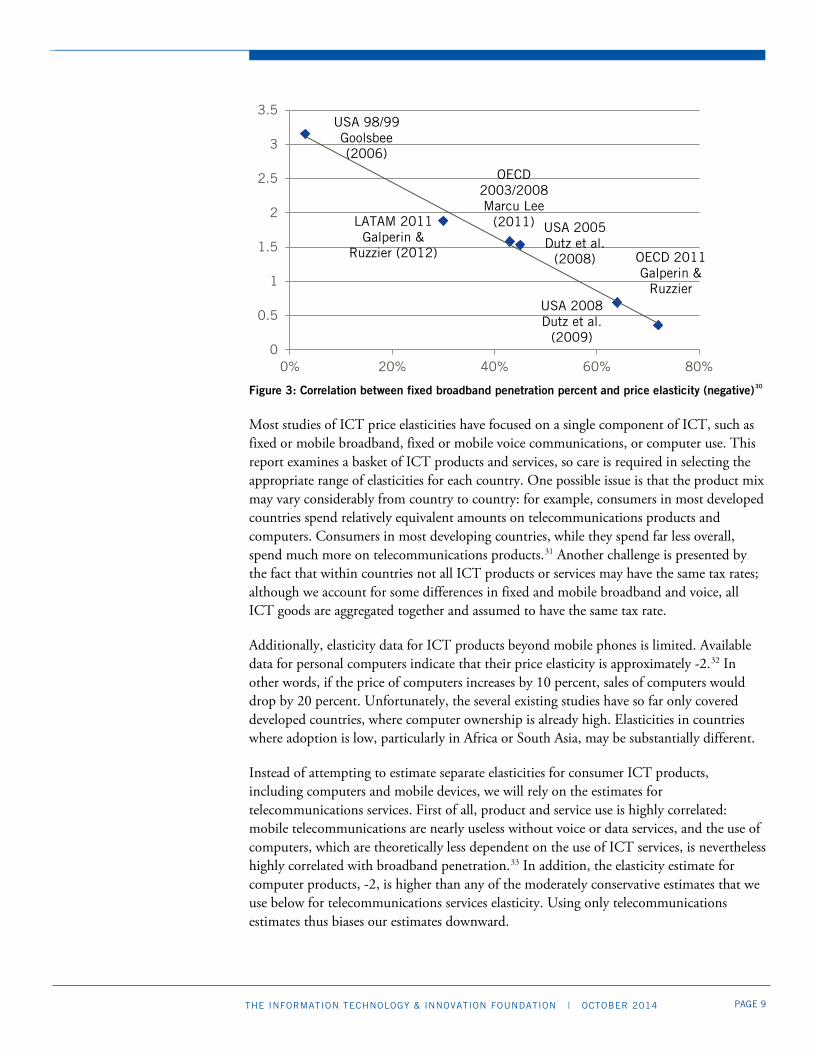
To date, most of the studies examining the elasticity of ICT goods have been in developed countries, with only a few recent studies examining developing countries. (Table 1) The most detailed developing-country work has been done in Latin America, with cross-country studies completed by Galperin and Ruzzier, Alleman and Rappoport, and Katz.27 Despite the lack of robust worldwide data, we can approximate elasticities using penetration rates, as existing rates of ICT penetration strongly influence price elasticity. This technique is used by Galperin and Ruzzier and also Katz and Berry in their recent review of recent studies.28 (Figure 3)
Study Country/Country Group
Timeframe Sector Elasticity
Goolsbee 2006 USA state level
1998-9 Fixed BB -2.8 to -3.5
Rappoport et al 2002 USA 2000 Fixed BB -1.49
Dutz et al 2009 USA 2005 Fixed BB -1.53
Lee et al 2011 OECD 2003/2008
Fixed BB -1.58
Hakim & Neaime 2011 MENA 1995-2007 Mobile -1.00
Cadman & Dineen 2008 OECD 2007 Fixed BB -0.43
Dutz et al USA 2008 Fixed BB -0.69
Srinuan et al 2011 Sweden 2009 Fixed BB -0.15 (Cable)
-1.27 (DSL)
Srinuan et al 2011 Sweden 2009 Mobile BB -0.88
Galperin & Ruzzier OECD 2011 Fixed BB -0.36
Galperin & Ruzzier LATAM 2011 Fixed BB -1.88
Alleman & Rappoport 2014 LATAM 2007-11 Mobile -0.41
Table 1: Studies on broadband service price elasticity29
Countries need to worry about the possibility of diverting the purchase of ICT goods from legitimate, taxed vendors to either the black market or other countries with lower taxes.
PAGE 9 THE INFORMATION TECHNOLOGY & INNOVATION FOUNDATION | OCTOBER 2014
Figure 3: Correlation between fixed broadband penetration percent and price elasticity (negative)30 Most studies of ICT price elasticities have focused on a single component of ICT, such as fixed or mobile broadband, fixed or mobile voice communications, or computer use. This report examines a basket of ICT products and services, so care is required in selecting the appropriate range of elasticities for each country. One possible issue is that the product mix may vary considerably from country to country: for example, consumers in most developed countries spend relatively equivalent amounts on telecommunications products and computers. Consumers in most developing countries, while they spend far less overall, spend much more on telecommunications products.31 Another challenge is presented by the fact that within countries not all ICT products or services may have the same tax rates; although we account for some differences in fixed and mobile broadband and voice, all ICT goods are aggregated together and assumed to have the same tax rate.
Additionally, elasticity data for ICT products beyond mobile phones is limited. Available data for personal computers indicate that their price elasticity is approximately -2.32 In other words, if the price of computers increases by 10 percent, sales of computers would drop by 20 percent. Unfortunately, the several existing studies have so far only covered developed countries, where computer ownership is already high. Elasticities in countries where adoption is low, particularly in Africa or South Asia, may be substantially different.
Instead of attempting to estimate separate elasticities for consumer ICT products, including computers and mobile devices, we will rely on the estimates for telecommunications services. First of all, product and service use is highly correlated: mobile telecommunications are nearly useless without voice or data services, and the use of computers, which are theoretically less dependent on the use of ICT services, is nevertheless highly correlated with broadband penetration.33 In addition, the elasticity estimate for computer products, -2, is higher than any of the moderately conservative estimates that we use below for telecommunications services elasticity. Using only telecommunications estimates thus biases our estimates downward.
0
0.5
1
1.5
2
2.5
3
3.5
0% 20% 40% 60% 80%
USA 98/99 Goolsbee (2006)
LATAM 2011 Galperin &
Ruzzier (2012)
OECD 2003/2008 Marcu Lee
(2011) USA 2005 Dutz et al.
(2008)
USA 2008 Dutz et al.
(2009)
OECD 2011 Galperin &
Ruzzier

PAGE 10 THE INFORMATION TECHNOLOGY & INNOVATION FOUNDATION | OCTOBER 2014
ICT services themselves appear to fall within a very wide range of elasticities, although they generally vary in consistent ways. In the past 10 years in developing countries, the use of traditional phone and text message services, and even mobile broadband, has greatly surpassed fixed phone or broadband use. For example, in Africa, where the rates of mobile ownership in many countries are among the lowest in the world, the rate of Internet use on smartphones is nearly double that of computer use (with or without Internet).34 It is therefore likely that elasticity estimates for fixed broadband are much higher than for mobile broadband and standard mobile service. We can see this in Table 1: Alleman and Rappoport’s estimate for standard mobile voice service in Latin America, which is only -0.41, and Hakim and Neaime’s estimate for the Middle East and North Africa (MENA), which is only -1.0, are far lower than Katz and Berry’s fixed broadband elasticity estimates for MENA, which are -1.97 and -2.55, respectively.
In order to get a better picture of overall ICT elasticity, therefore, we combine Katz and Berry’s fixed broadband estimates with mobile estimates from a recent report from Deloitte and the GSM Association (GSMA). (Table 2) While using regional estimates is not ideal, it should suffice for the purposes of a rough estimate. The estimates we use are in Table 3. In order to arrive at the conservative elasticity estimate, we use a weighted average of the highest and lowest elasticity estimates for each region originally found in Table 2, weighting the lowest rate at three times the high rate.35
Region Fixed Broadband Penetration by Household
Fixed Broadband Elasticity
Mobile Penetration by Individual
Mobile Elasticity
Africa 16.7% (MENA) 1.1% (SSF)
-2.55 (MENA) -3.82 (SSF) 72% -0.2 to -2.0
Asia 39.0% (EAS) 4.8% (SAS)
-1.43 (EAS) -3.48 (SAS) 115% -0.9 to -2.3
Europe and Central Asia
55.0% -0.94 91% -0.3 to -0.7
Latin America and the Caribbean
28.7% -1.87 140% -1.0 to -2.6
North America 76.4% -0.54
Table 2: Fixed broadband penetration and elasticity, and mobile penetration and elasticity estimates (MENA = Middle East and North Africa; SSF = Sub-Saharan Africa; EAS = East Asia; SAS = South Asia)36 Combining these average elasticity rates with the price changes caused by ICT taxes and tariffs discussed in the next section, we find a broad range of possible changes in ICT adoption: when using the most conservative estimates for elasticity, the change in quantity demanded due to taxation is as high as -52 percent (Bangladesh), although it quickly drops off to -17 percent (Brazil) and gradually declines from there. (Table 4) With a slightly more moderate estimate of elasticity for the top 20 taxers, the same change due to taxation is between -82 percent and -7 percent. The highest estimates, meanwhile, yield between -167
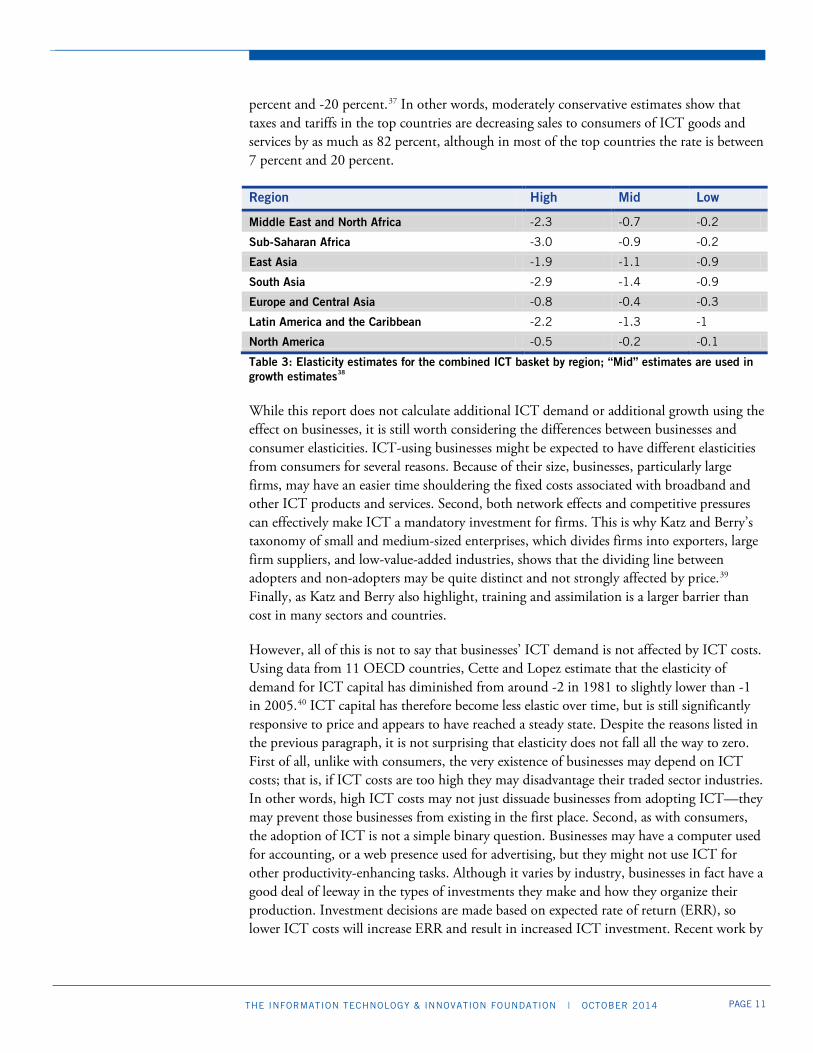
Moderately conservative estimates show that taxes and tariffs in the top countries are decreasing sales to consumers of ICT goods and services by as much as 82 percent, although in most of the top countries the rate is between 7 percent and 20 percent.
PAGE 11 THE INFORMATION TECHNOLOGY & INNOVATION FOUNDATION | OCTOBER 2014
percent and -20 percent.37 In other words, moderately conservative estimates show that taxes and tariffs in the top countries are decreasing sales to consumers of ICT goods and services by as much as 82 percent, although in most of the top countries the rate is between 7 percent and 20 percent.
Region High Mid Low
Middle East and North Africa -2.3 -0.7 -0.2
Sub-Saharan Africa -3.0 -0.9 -0.2
East Asia -1.9 -1.1 -0.9
South Asia -2.9 -1.4 -0.9
Europe and Central Asia -0.8 -0.4 -0.3
Latin America and the Caribbean -2.2 -1.3 -1
North America -0.5 -0.2 -0.1
Table 3: Elasticity estimates for the combined ICT basket by region; “Mid” estimates are used in growth estimates38 While this report does not calculate additional ICT demand or additional growth using the effect on businesses, it is still worth considering the differences between businesses and consumer elasticities. ICT-using businesses might be expected to have different elasticities from consumers for several reasons. Because of their size, businesses, particularly large firms, may have an easier time shouldering the fixed costs associated with broadband and other ICT products and services. Second, both network effects and competitive pressures can effectively make ICT a mandatory investment for firms. This is why Katz and Berry’s taxonomy of small and medium-sized enterprises, which divides firms into exporters, large firm suppliers, and low-value-added industries, shows that the dividing line between adopters and non-adopters may be quite distinct and not strongly affected by price.39 Finally, as Katz and Berry also highlight, training and assimilation is a larger barrier than cost in many sectors and countries.
However, all of this is not to say that businesses’ ICT demand is not affected by ICT costs. Using data from 11 OECD countries, Cette and Lopez estimate that the elasticity of demand for ICT capital has diminished from around -2 in 1981 to slightly lower than -1 in 2005.40 ICT capital has therefore become less elastic over time, but is still significantly responsive to price and appears to have reached a steady state. Despite the reasons listed in the previous paragraph, it is not surprising that elasticity does not fall all the way to zero. First of all, unlike with consumers, the very existence of businesses may depend on ICT costs; that is, if ICT costs are too high they may disadvantage their traded sector industries. In other words, high ICT costs may not just dissuade businesses from adopting ICT—they may prevent those businesses from existing in the first place. Second, as with consumers, the adoption of ICT is not a simple binary question. Businesses may have a computer used for accounting, or a web presence used for advertising, but they might not use ICT for other productivity-enhancing tasks. Although it varies by industry, businesses in fact have a good deal of leeway in the types of investments they make and how they organize their production. Investment decisions are made based on expected rate of return (ERR), so lower ICT costs will increase ERR and result in increased ICT investment. Recent work by

PAGE 12 THE INFORMATION TECHNOLOGY & INNOVATION FOUNDATION | OCTOBER 2014
ITIF has confirmed the importance of capital investments in ICT and argued for tax incentives; reducing ICT taxes and tariffs is the flip side of this argument.41
Change in Quantity of ICT Demanded Economic Growth Estimate
Country Low Mid High Low Mid High
Bangladesh 52% 81% 167% 3.6% 5.7% 11.7%
Brazil 17% 22% 37% 1.2% 1.5% 2.6%
Congo, Rep. 5% 21% 70% 0.3% 1.5% 4.9%
Sri Lanka 12% 19% 40% 0.9% 1.3% 2.8%
Argentina 13% 17% 29% 0.9% 1.2% 2.0% Dominican Republic
13% 17% 29% 0.9% 1.2% 2.0%
Pakistan 10% 16% 32% 0.7% 1.1% 2.3%
Gabon 3% 15% 50% 0.2% 1.1% 3.5%
Ecuador 11% 15% 25% 0.8% 1.0% 1.7%
Tanzania 3% 12% 39% 0.2% 0.8% 2.8%
Jamaica 9% 12% 20% 0.6% 0.8% 1.4%
Turkey 8% 11% 21% 0.5% 0.8% 1.5%
Zambia 3% 11% 37% 0.2% 0.8% 2.6%
Iran, Islamic Rep. 3% 11% 34% 0.2% 0.7% 2.3%
Senegal 2% 9% 30% 0.1% 0.6% 2.1%
Nigeria 2% 8% 28% 0.1% 0.6% 2.0%
Congo, Dem. Rep. 2% 8% 27% 0.1% 0.6% 1.9%
Madagascar 2% 8% 27% 0.1% 0.6% 1.9%
Uganda 2% 8% 25% 0.1% 0.5% 1.8%
Venezuela, RB 5% 7% 12% 0.4% 0.5% 0.8%
Kenya 1% 6% 21% 0.1% 0.4% 1.5%
Colombia 5% 6% 10% 0.3% 0.4% 0.7%
Gambia, The 1% 6% 18% 0.1% 0.4% 1.3%
Chad 1% 6% 18% 0.1% 0.4% 1.3%
Ghana 1% 5% 18% 0.1% 0.4% 1.2%
Burkina Faso 1% 5% 18% 0.1% 0.4% 1.2%
Rwanda 1% 5% 17% 0.1% 0.4% 1.2%
Chile 4% 5% 9% 0.3% 0.4% 0.6%
Suriname 4% 5% 9% 0.3% 0.4% 0.6%
Jordan 1% 5% 15% 0.1% 0.3% 1.0%
Table 4: Change in annual ICT adoption and economic growth rates due to added taxes and tariffs for ICT for the top 30 countries42 Businesses also require a critical mass of consumer ICT adoption before customer-facing ICT investment begins to make sense. It is of little use for a cab driver to adopt a mobile payments system if none of his customers have mobile phones. Moreover, even backend business ICT can be vastly improved by customer ICT use—for example, using a retail website that is interoperable with a backend inventory system.

PAGE 13 THE INFORMATION TECHNOLOGY & INNOVATION FOUNDATION | OCTOBER 2014
Elasticity, Adoption, and Growth The range of elasticities presented in Table 1, 2 and 3 may seem broad, but in many ways the exact size is immaterial. As taxes and tariffs increase the costs of ICT goods and services, they slow down adoption, and they slow it down most in developing countries where affordability is paramount. This means that the countries that are behind in ICT adoption stay there, as countries with lower ICT costs maintain the lead in the adoption of each new wave of ICT products.
Within individual countries as well, the lagging adopters are those people with less resources and education, and they therefore suffer the most from extra costs. While Katz and Berry’s framework focuses on a number of barriers to entry for these non-adopters, costs remain an important determinant of adoption.43
Still, the growth effects of ICT can nevertheless be estimated on an aggregate level. Previous studies have estimated the effect of ICT penetration on growth. (Table 5 and 6) Using the above estimates of elasticity combined with these estimates of penetration on growth, we can get an idea of how taxes and tariffs affect growth.
Authors Countries Effect on growth of 10% additional broadband penetration
Czernich et al. 28 OECD, 1996-2007 0.9-1.5%
Katz & Avila 24 Latin American and Caribbean countries 0.2%
Koutroumpis EU15, 2003-2006 0.26-0.38%
OECD EU countries, 1980-2009 1.1%
Table 5: Evidence of the effect on growth of 10 percent additional broadband penetration44 Middle-of-the-road estimates for the growth effects of ICT taxes and tariffs for the 20 countries with the highest added costs show that these costs may be holding growth back by a full 1 percentage point or more per year. (Table 4) In Bangladesh, a significant outlier for tax rates, moderate assumptions put the growth drag at 8.5 percentage points of GDP per capita per year. Given that the overall rate of per capita GDP growth in Bangladesh has ranged between 5.7 and 6.7, this estimate is almost certainly overstated. Still, it should nevertheless stand as a warning, since it is based on reasonable assumptions of elasticity and correlation between ICT penetration and economic growth. Excluding Bangladesh, the top 20 countries range from 2.3 percentage points (Brazil) to 0.7 percentage points. The rest of the top 50 countries range from 0.7 percentage points to 0.3 percentage points. Low-end estimates for growth for the top 20 countries excluding Bangladesh range from 0.1 to 1.2 percentage points per year, while high-end estimates average around 5 percentage points.
As taxes and tariffs increase the costs of ICT goods and services, they slow down adoption, and they slow it down most in developing countries where affordability is paramount.

PAGE 14 THE INFORMATION TECHNOLOGY & INNOVATION FOUNDATION | OCTOBER 2014
Percentage increase in economic growth per 10 percent increase in penetration, in:
Fixed Mobile Internet Broadband
High-income countries 0.4 0.6 0.8 1.2
Low-income countries 0.7 0.8 1.1 1.4
Table 6: Estimates of the effect on growth of increased telecommunication services penetration45 These estimates are in line with some of the only work done on the subject, a 2012 report by GSMA and Deloitte that examines the effect of mobile broadband on developed and developing country growth. The report finds that a doubling of the mobile data use increases the per capita GDP growth rate by 0.5 percentage points, and that a 10 percent increase in mobile penetration in developed countries leads to a long-run increase in productivity on the order of 4.2 percentage points.46 Unfortunately, these figures are not directly comparable since they use a more limited definition of ICT that only includes mobile use.
Growth and ICT-Using Businesses Although there is insufficient data to attempt to quantify the growth impact of ICT through business channels, these channels are nevertheless a crucial way that ICT influences growth. Business adoption of ICT is important because ICT goods and services are core inputs for many industries. ICT taxes and trade barriers can contribute significantly to their costs, and these costs in turn can hold back international competitiveness and the participation of countries in international value chains. For example, the OECD found that countries not participating in the ITA, which therefore tend to have higher trade barriers on ICT goods, saw their participation in global ICT value chains decline by over 60 percent from 1995 to 2009.47 Any policy that raises costs in order to protect local producers hurts the users of those products, whether they are other businesses or consumers. These intermediate costs can be a substantial drain on productivity and cause a substantial misallocation of resources.48
COUNTRY RANKINGS Governments around the world impose costs on ICT products and services in a variety of ways and to a range of degrees. Overall, tax and tariff data show that many countries are pursuing a smart, hands-off approach to ICT goods and services. However, other countries have tried to use taxes and tariffs to protect domestic ICT industries and/or extract revenue from ICT users, believing incorrectly that these are luxury goods akin to yachts and Rolex watches. By doing so they are holding back ICT adoption.
The primary basket of ICT goods used in this report consists of taxes and tariffs on ICT goods and services, including: wired broadband; wireless phone services of all types, including broadband and standard voice service; and core ICT products, including basic mobile phones, smartphones, computers, and other digital products such as digital cameras and digital audio devices. See methodology appendix for additional information.
In the 20 countries with the highest added costs from ICT taxes and tariffs, those costs may be holding economic growth back by a full 1 percentage point or more per year.

PAGE 15 THE INFORMATION TECHNOLOGY & INNOVATION FOUNDATION | OCTOBER 2014
Figure 4: ICT-specific taxes and tariffs as a percentage of cost (top 50 nations)49 Tax and Tariff Rates on Consumers The extra costs that governments impose can be expressed most clearly as a percentage increase in the cost of a good or service. Figure 4 shows the cost increase as a proportion of total ICT cost for 125 countries. The worst offender by a large margin is Bangladesh, which adds an astounding 57.8 percent to the cost of ICT goods and services over and above the country’s universal 15 percent value-added tax (VAT). In second and third place are Turkey and the Congo, which add 26.1 percent and 23.8 percent, respectively, to the price of their ICT goods and services in addition to their 18 percent standard VATs.
0% 10% 20% 30% 40% 50% 60% 70%
BoliviaChina
Antigua and BarbudaMozambique
BeninGuinea-Bissau
SudanFiji
MaliGuinea
SurinameChile
TunisiaAlgeria
Cote d'IvoireCroatia
ColombiaAzerbaijan
UkraineCabo VerdeCameroon
Venezuela, RBRwanda
Burkina FasoGhanaChad
Gambia, TheJordanKenya
UgandaJamaica
MadagascarCongo, Dem. Rep.
UzbekistanNigeriaGreece
SenegalEcuadorPakistanZambia
Dominican RepublicArgentinaTanzaniaSri Lanka
Iran, Islamic Rep.BrazilGabon
Congo, Rep.Turkey
Bangladesh
Extra ICT Taxes ICT Tariffs

PAGE 16 THE INFORMATION TECHNOLOGY & INNOVATION FOUNDATION | OCTOBER 2014
Gabon and Brazil, in fourth and fifth place, add just under 17 percent to the price of their ICT goods, Gabon primarily through taxes and Brazil primarily through tariffs.
Bangladesh’s high level of ICT taxes and tariffs essentially puts the country in a league of its own, with Turkey, Congo, and other high taxers following some distance behind. But there are many more countries that also impose significant costs. Twenty-eight countries have combined ICT tax and tariff rates between 5 percent and 20 percent, including Brazil, Argentina, Iran, Sri Lanka, Greece, and a large number of African nations. Another 40 countries have smaller tax and tariff rates between 1 percent and 5 percent.
Not all countries add costs in the same way, as can be seen in the different contributions of taxes and tariffs to the total cost in Figure 4. There are some patterns of note. For the countries with combined ICT tax and tariff rates above 5 percent, ICT taxes make up 63 percent of the aggregate added costs to ICT (the other 37 percent consisting of ICT tariffs). But for countries with aggregate rates between 1 percent and 5 percent, ICT taxes make up just 18 percent of the total. ICT tariffs thus appear to be a more widespread tool, in use in more countries, while ICT taxes are in fewer countries but make a much larger contribution. Also of note: countries that are members of the ITA, an international treaty establishing free trade in ICT goods, have significantly lower ICT tariff rates, averaging only 0.6 percent, compared to 3.3 percent for non-ITA countries.50
Figure 5: Specific ICT taxes and tariff averages by region51 The size and type of ICT costs exhibit a number of interesting patterns across regions and income levels as well. Figure 5 shows specific ICT tax and tariff rates by region using unweighted averages. Most notably, Southeast Asia stands out as having by far the highest average rate. This is due both to Bangladesh’s high rates and the relatively small number of countries in the region, although Pakistan and Sri Lanka have high rates as well. Taxes make up a substantial majority of the added costs, although the region’s tariff rate is still higher than any other region. Sub-Saharan Africa is the region with the second-highest rates, with a more even split between taxes and tariffs, followed by Latin America and the
0%2%4%6%8%
10%12%14%16%18%20%
East Asia Europe andCentral Asia
Latin Americaand the
Caribbean
Middle Eastand North
Africa
North America SoutheastAsia
Sub-SaharanAfrica
Extra Taxes Tariffs
Countries that are members of the Information Technology Agreement have significantly lower ICT tariffs.

PAGE 17 THE INFORMATION TECHNOLOGY & INNOVATION FOUNDATION | OCTOBER 2014
Caribbean, and the Middle East and North Africa, both of which have slightly larger tariff costs than taxes. East Asia has very low tax costs but moderate tariff costs, while Europe and Central Asia have a more even mix. North America has some taxes, primarily due to an assortment of wireless taxes at the state level in the United States, but the lowest tariffs of any region.52
Figure 6: Specific ICT taxes and tariff averages by country income level53 Figure 6 shows that ICT tax and tariff rates vary significantly by country income level, generally decreasing as country income increases. While lower-income countries have more than double the tax rates on ICT as compared to the middle-income countries, tariffs remain between 2 percent and 3 percent for all non-high-income countries.54 The fact that tariffs do not rise proportionately with taxes in the lowest-income group may be the result of more international pressure on lowering tariffs than on lowering specific taxes; countries risk retaliatory action for raising tariffs and may therefore have more to lose from high-tariff policies than from raising taxes. It may also be the case that most of these nations have bought into the myth that high tariffs on ICT goods create a strong domestic ICT goods production sector.55 At any rate, both OECD and non-OECD high-income countries have substantially lower taxes and tariffs than the lower-income groups, in part because of their generally stronger commitment to free trade.
0%
1%
2%
3%
4%
5%
6%
7%
8%
9%
Lower Income Lower MiddleIncome
Upper MiddleIncome
Non-OECDHigh Income
OECD HighIncome
Extra Taxes Tariffs

PAGE 18 THE INFORMATION TECHNOLOGY & INNOVATION FOUNDATION | OCTOBER 2014
Figure 7: Total taxes and tariffs that apply to ICT products (including VAT and other universal sales taxes)56
0% 50%
Bulgaria
France
United Kingdom
Colombia
Austria
Morocco
Ghana
Gambia, The
Benin
Algeria
Belarus
Spain
Latvia
Netherlands
Czech Republic
Moldova
Lithuania
Guinea
Belgium
Italy
Slovenia
Tunisia
Azerbaijan
Poland
Chile
Cote d'Ivoire
Kenya
Ecuador
Ireland
Portugal
Rwanda
Uruguay
Cameroon
Finland
Romania
Ukraine
Norway
Hungary
Congo, Dem. Rep.
Burkina Faso
Sweden
Sri Lanka
Denmark
Chad
Jamaica
Iceland
Uganda
Croatia
Senegal
Madagascar
Zambia
Uzbekistan
Dominican Republic
Tanzania
Greece
Gabon
Argentina
Brazil
Turkey
Congo, Rep.
Bangladesh
0% 50%
United Arab Emirates
Qatar
Swaziland
Japan
Malaysia
Singapore
Yemen, Rep.
Switzerland
Panama
Thailand
Australia
Canada
Lesotho
Korea, Rep.
United States
Indonesia
China
Vietnam
Paraguay
Suriname
Angola
India
Honduras
Philippines
Costa Rica
Lebanon
Kazakhstan
South Africa
Nigeria
Botswana
Mauritius
Namibia
New Zealand
Nicaragua
Bolivia
Luxembourg
Iran, Islamic Rep.
El Salvador
Pakistan
Trinidad and Tobago
Venezuela, RB
Mexico
Antigua and Barbuda
Georgia
Israel
Guinea-Bissau
Peru
Cyprus
Russian Federation
Bosnia and Herzegovina
Jordan
Germany
Cabo Verde
Macedonia, FYR
Mozambique
Albania
Malta
Estonia
Sudan
Slovak Republic

PAGE 19 THE INFORMATION TECHNOLOGY & INNOVATION FOUNDATION | OCTOBER 2014
It is also worth examining the total tax and tariff burden inclusive of standard VAT and other sales tax rates. While a high standard VAT or sales tax rate can discourage consumption, it is of less concern here than the ICT-specific taxes and tariffs. This is because VAT rates are (nearly) universal and therefore do not bias consumption expenditures one way or another. VAT revenues also fit into a larger fiscal policy framework: a country may have a small VAT but a large income tax, but consumers there might have exactly the same amount to spend on consumption as they do in a country with a large VAT and a small income tax, although the after-tax income distribution can be different. For the sake of completion, however, Figure 7 shows the total rate of taxation on ICT goods and services, including VAT and other universal sales taxes, special excise taxes on ICT goods and services, and tariffs on ICT goods. While the outliers on the top end look similar to Figure 4, the most notable difference is the large group of countries with cost additions between 20 percent and 25 percent. This is primarily due to the large number of European countries with high VAT rates. Another notable difference is the very short taper at the bottom of the graph, with only a few countries taxing below 0 percent and 10 percent. Universal sales and VAT taxes are of course much more common than special excise taxes, and thus there are fewer countries with negligible overall tax rates.
Tax and Tariff Rates on Business Purchases of ICT Goods and Services Businesses face a different set of government-imposed ICT costs from those consumers face. This is because businesses do not face standard VAT taxes and consume a different basket of ICT goods. ICT-specific consumption taxes may still apply, and tariffs do as well. For our average tax rate we use the consumer rates found in Figure 4, though reweighted slightly to reflect our assumption that businesses spend a higher percentage on products relative to services than consumers do. To construct the average tariff rates we use a business-specific basket of ICT goods, including ICT components such as circuit boards, office- and production-specific ICT products such as photocopiers, and dual consumer/business use ICT products like mobile phones and computers.
Figure 8 shows the average ICT tax and tariff rates for businesses. Forty-six nations impose an added cost on business purchases of ICT goods and services of higher than 5 percent.57 While many of the top countries with the highest consumer taxes and tariffs make a return here, there are several differences. The most notable difference of this figure relative to Figure 4 is the larger role of tariffs: among top countries, tariffs comprise a much larger percentage of total business ICT costs than taxes do. Four countries make it into the top 20 by virtue of their tariffs alone, and only 12 countries in the top 50 have higher tax rates than tariff rates.
As could be expected from the regional analysis of consumer taxes and tariffs, there are distinct regional patterns on taxes and tariffs for business-use ICT as well. Fully one half of the top 50 countries for ICT tax and tariff rates are from Sub-Saharan Africa, with 11 countries from Latin America and the Caribbean and the rest from other regions. The only country with a top business tax rate that has signed on to the ITA is Turkey, where additional business costs are composed almost entirely of taxes. The only other ITA
Both OECD and non-OECD high-income countries have substantially lower taxes and tariffs than lower-income countries, in part because of their generally stronger commitment to free trade.

PAGE 20 THE INFORMATION TECHNOLOGY & INNOVATION FOUNDATION | OCTOBER 2014
country near the top is the Dominican Republic, in 15th place with 9 percent tariffs and 13 percent total costs. The Dominican Republic recently acceded to the agreement, however, so presumably its tariff rates should fall in the near future.
Figure 8: Extra ICT tax and tariff rates on businesses by country (top 50 countries)58
0% 10% 20% 30% 40% 50% 60%
MyanmarGreeceJordanAngola
MozambiqueRwanda
KenyaYemen, Rep.
ColombiaPanamaUgandaSudanBolivia
EcuadorVenezuela, RB
JamaicaSuriname
Guinea-BissauFiji
BeninSri Lanka
GuineaAzerbaijan
Antigua and BarbudaMali
GhanaPakistanTanzania
Congo, Dem. Rep.Cote d'IvoireCabo Verde
Gambia, TheMadagascar
TunisiaBrazil
Dominican RepublicCameroon
AlgeriaNigeria
Burkina FasoSenegal
ChadZambia
UzbekistanArgentina
GabonIran, Islamic Rep.
TurkeyCongo, Rep.Bangladesh
Tax Rate Tariff Rate
Forty-six nations impose an added cost on business purchases of ICT goods and services of higher than 5 percent.

PAGE 21 THE INFORMATION TECHNOLOGY & INNOVATION FOUNDATION | OCTOBER 2014
There are also substantial business taxes that are beyond the scope of this report. Aside from standard corporate taxes, many governments have enacted taxes targeted directly at telecommunications companies or other heavy users of technology. For example, Thailand has levied a 30 percent “revenue share” tax specifically on telecommunications companies, leading to higher telecom services costs.59
Price Increases for Consumers Basic tax and tariff rates as a percentage of cost are useful to see what policies exist in different countries, but there are several other ways of comparing taxation and tariff regimes between countries. Different countries have different prices for ICT goods and services. It is therefore useful to examine the added costs to the price as a percent of gross national income (GNI) per capita.
By comparing the costs added to ICT as a percent of GNI per capita, we can get a better idea of the costs that different countries are adding to the price of ICT goods relative to the average income in a country. This shows how much the government is raising prices as a percentage of a consumer’s income. For example, in a developing country the cost of a cell phone may comprise a larger percentage of an individual’s income than it might in a developed country, and therefore a tax on that income may also represent a much larger impact on the individual’s budget.
The rankings in Figure 9, then, differ from Figure 4 in that they are adjusted by the amount of their income that consumers actually pay on ICT goods. (Note also that data was available for fewer countries for Figure 9, and many of the worst offenders from Figure 4 would likely be near the top here as well.) Nigeria, Ecuador, Turkey, Brazil, and Argentina have the highest price increases due to ICT taxes and tariffs. These countries are adding very large amounts to the price of ICT goods and services; in Nigeria’s case they are raising the cost of the phone by nearly 1.5 percent of GNI per capita above the base value. In the United States this would be the equivalent of adding $704 to the cost of the typical basket of ICT goods and services.60
These added costs appear to have a real impact on adoption. Basic regression analysis reveals that the price of ICT-specific taxes and tariffs as a percentage of income is significantly correlated with both standard voice cell phone service usage and computer usage per capita, even after controlling for GNI per capita.61 There does not appear to be a correlation between these costs and wired or wireless broadband usage, however, perhaps because other factors such as GNI per capita play a much larger role.

PAGE 22 THE INFORMATION TECHNOLOGY & INNOVATION FOUNDATION | OCTOBER 2014
Figure 9: Addition to ICT prices as percent of GNI per capita by type (based on limited number of nations)62 Expenditure Increases for Consumers The basic tax and tariff rates can also be adjusted by the total expenditure on ICT per capita. This reveals the amount that the average person spends on ICT taxes and tariffs, or from another perspective, the total effective tax burden on individuals due to ICT taxes and tariffs. This differs from the average price increase per capita because not everyone consumes the same amount of ICT goods; if everyone did, then expenditure and price baskets would in theory be the same.
Turkey has the highest rates of tax burden due to ICT of all the countries for which data exists by a significant margin. (Figure 10) Turkey’s per capita expenditure rate for taxes and tariffs is similar to its price per capita, due to its particular mix of use rates and expenditure patterns, while other countries spend significantly less per capita due to their lower use rates. A number of South American countries also rank highly here, including Ecuador, Argentina, Brazil, Venezuela, Columbia and Chile. There are no African countries near the top here for two reasons. First, because African countries are generally quite poor, their actual expenditures on ICT goods and services, and thus the ITC taxes and tariffs they collect on those goods and services, are quite low on a per capita basis. This is why Nigeria moves quite far down from first place. Second, there are far fewer African countries for which data is available.
0.0% 0.5% 1.0% 1.5% 2.0%
BulgariaRussian Federation
KazakhstanBelarusBoliviaTunisia
IndonesiaAzerbaijan
MexicoChile
Venezuela, RBGreece
ColombiaUkraineJordanBrazil
ArgentinaTurkey
EcuadorNigeria
Extra taxes Tariffs
Nigeria, Ecuador, Turkey, Brazil, and Argentina have the highest price increases due to ICT taxes and tariffs. These countries are adding very large amounts to the price of ICT goods and services.

PAGE 23 THE INFORMATION TECHNOLOGY & INNOVATION FOUNDATION | OCTOBER 2014
Figure 10: Average payment per capita for ICT taxes and tariffs as percent GNI per capita (based on limited number of nations)63 WHY ICT TAXES AND TARIFFS ARE TEMPTING POLICY Why have so many countries established discriminatory taxes and tariffs on ICT goods and services when such policies so clearly hurt growth? The different types of taxation and tariff policies listed above have different rationales that spring from a variety of different goals or ways of thinking about taxation and ICT.
Revenue gains from ICT taxes and tariffs are often cancelled out over time because increased ICT costs directly reduce the amount of ICT goods and services sold, which in turn decreases economic growth and thereby total tax revenue. To begin with, many ICT goods and services are relatively easy to tax. Particularly in developing countries, taxation can be less a question of “what to tax” or “how much to tax it” and more a question of where the government can reliably collect tax revenue. Telecom companies keep extensive real-time, digital records of their services. This means that ICT services such as fixed and mobile broadband, as well as voice, are at the very least available targets for governments in search of funds.
0.0% 0.2% 0.4% 0.6% 0.8% 1.0%
Belarus
Algeria
Bolivia
China
Tunisia
Mexico
Pakistan
Azerbaijan
Nigeria
Colombia
Ukraine
Chile
Croatia
Venezuela, RB
Greece
Brazil
Argentina
Jordan
Ecuador
Turkey
Extra taxes Tariffs

PAGE 24 THE INFORMATION TECHNOLOGY & INNOVATION FOUNDATION | OCTOBER 2014
Another reason that taxing ICT goods and services can be tempting is the apparent luxury nature of the goods. ICT goods and services typically start out expensive, and early adopters are usually those who can most easily afford them. Thus it may initially appear that taxing smartphones, for example, is a progressive luxury tax, paid by the urban rich who can easily afford it. However, as prices quickly drop and smartphones or other ICT goods are adopted by a larger share of consumers, these taxes become more and more regressive. And more importantly, such taxes and tariffs slow adoption.
ICT goods and services are also high-growth areas, and the high rates of growth may hide the effects of taxes and tariffs on consumption. For goods in relatively saturated markets, for example alcohol, the reduction in consumption due to taxation may be quite easy to measure. In contrast, a tax that slows down the growth rate of smartphone sales by 1 percent per year when sales are growing at 8 percent per year may simply go unnoticed. Slowing down adoption in this way, however, does add up in growth effects on the macroeconomic level over time. And of course the marginal consumers or businesses—those that miss out on new goods because of the added tax—are the most likely to be poor or small.
On a related note, ICT taxes and tariffs are also relatively easy to implement because they do little to upset the status quo. That is, when ICT goods and services are newly introduced into a country, without large customer bases or industry backing, there are fewer people who will notice the taxes. People are less likely to notice the future costs that taxes and tariffs will bring. After an industry is established in a country and has an established customer base, such interests may work hard to oppose new taxes. As a relatively new industry, ICT goods and services can be easy targets.
Since ICT use is such a robust driver of economic growth, however, the net revenue benefits from taxing ICT goods and services are usually short lived. Recent studies have indicated that gains from such taxes are often cancelled out over time because increased ICT costs directly reduce the amount of ICT goods and services sold, which in turn decreases economic growth and thereby total tax revenue. Indeed, after several years the initial tax gains can be entirely offset by these losses.64 Simulations of countries that reduce mobile taxes estimate that overall tax revenue returns to original levels within two to six years depending on factors such as elasticity.65
Governments also enact high tariffs on business-use ICT goods in the mostly vain pursuit of protecting domestic industries. As described above, however, high tariffs raise costs for ICT users. For example, Kaushik and Singh found that for every $1 of tariffs India imposed on imported ICT products, India suffered an economic loss of $1.30 because of lower productivity.66 These issues are compounded as world trade in intermediate goods grows: intermediate goods are now estimated to make up 60 percent of total international trade.67 Thus, when businesses face extra costs for importing goods, this gets reflected in their subsequent export price—hurting their competitive position. In other words, the entire idea behind tariffs is based on an outdated model for growing an economy. Countries with high tariffs are simply getting left out of the global ICT production system.68
Countries with high ICT tariffs are simply getting left out of the global production system.
PAGE 25 THE INFORMATION TECHNOLOGY & INNOVATION FOUNDATION | OCTOBER 2014
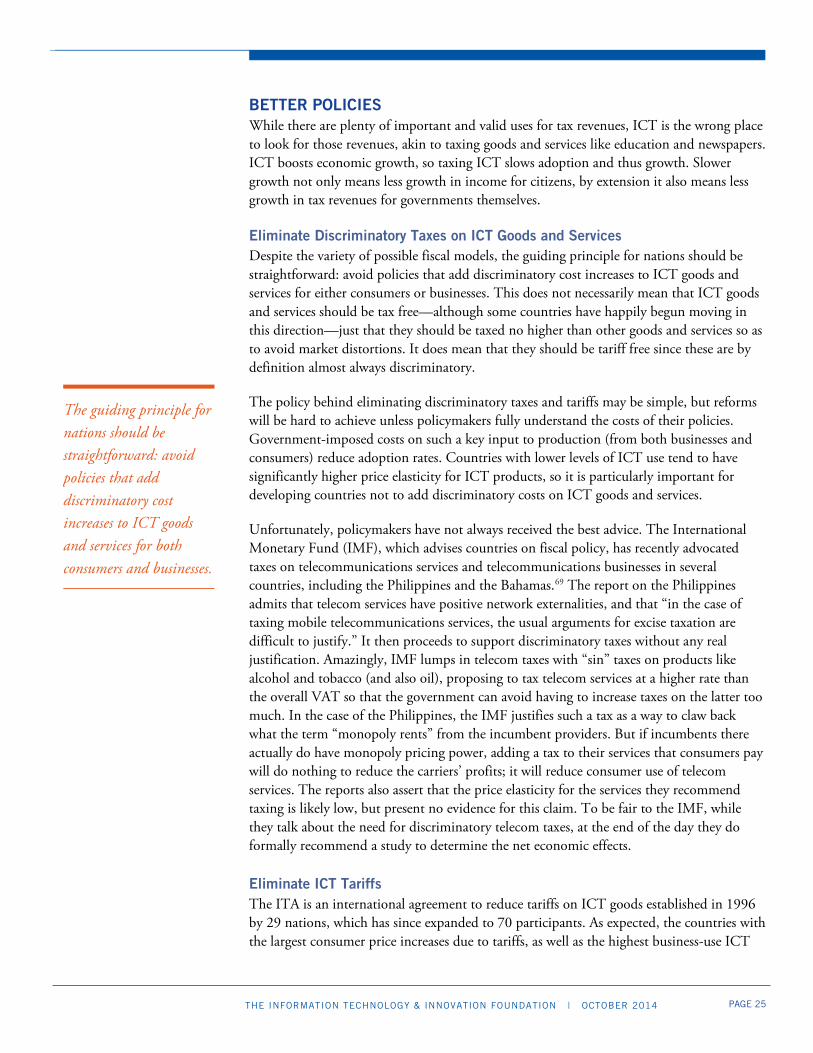
BETTER POLICIES While there are plenty of important and valid uses for tax revenues, ICT is the wrong place to look for those revenues, akin to taxing goods and services like education and newspapers. ICT boosts economic growth, so taxing ICT slows adoption and thus growth. Slower growth not only means less growth in income for citizens, by extension it also means less growth in tax revenues for governments themselves.
Eliminate Discriminatory Taxes on ICT Goods and Services Despite the variety of possible fiscal models, the guiding principle for nations should be straightforward: avoid policies that add discriminatory cost increases to ICT goods and services for either consumers or businesses. This does not necessarily mean that ICT goods and services should be tax free—although some countries have happily begun moving in this direction—just that they should be taxed no higher than other goods and services so as to avoid market distortions. It does mean that they should be tariff free since these are by definition almost always discriminatory.
The policy behind eliminating discriminatory taxes and tariffs may be simple, but reforms will be hard to achieve unless policymakers fully understand the costs of their policies. Government-imposed costs on such a key input to production (from both businesses and consumers) reduce adoption rates. Countries with lower levels of ICT use tend to have significantly higher price elasticity for ICT products, so it is particularly important for developing countries not to add discriminatory costs on ICT goods and services.
Unfortunately, policymakers have not always received the best advice. The International Monetary Fund (IMF), which advises countries on fiscal policy, has recently advocated taxes on telecommunications services and telecommunications businesses in several countries, including the Philippines and the Bahamas.69 The report on the Philippines admits that telecom services have positive network externalities, and that “in the case of taxing mobile telecommunications services, the usual arguments for excise taxation are difficult to justify.” It then proceeds to support discriminatory taxes without any real justification. Amazingly, IMF lumps in telecom taxes with “sin” taxes on products like alcohol and tobacco (and also oil), proposing to tax telecom services at a higher rate than the overall VAT so that the government can avoid having to increase taxes on the latter too much. In the case of the Philippines, the IMF justifies such a tax as a way to claw back what the term “monopoly rents” from the incumbent providers. But if incumbents there actually do have monopoly pricing power, adding a tax to their services that consumers pay will do nothing to reduce the carriers’ profits; it will reduce consumer use of telecom services. The reports also assert that the price elasticity for the services they recommend taxing is likely low, but present no evidence for this claim. To be fair to the IMF, while they talk about the need for discriminatory telecom taxes, at the end of the day they do formally recommend a study to determine the net economic effects. Eliminate ICT Tariffs The ITA is an international agreement to reduce tariffs on ICT goods established in 1996 by 29 nations, which has since expanded to 70 participants. As expected, the countries with the largest consumer price increases due to tariffs, as well as the highest business-use ICT
The guiding principle for nations should be straightforward: avoid policies that add discriminatory cost increases to ICT goods and services for both consumers and businesses.

PAGE 26 THE INFORMATION TECHNOLOGY & INNOVATION FOUNDATION | OCTOBER 2014
tariffs, are not signatories to the ITA. The ITA has succeeded in keeping tariffs low for many ICT products. Kiriyama estimates that in 2006 the weighted average of tariffs on ITA goods among ITA members was 10 percentage points to 11 percentage points lower than for trade in non-ITA ICT goods among non-ITA members.70
Despite its continued role as a cornerstone of ICT trade policy, the ITA is in need of an update for two reasons. First, while the ITA is still gradually gaining members, its reach could be significantly improved by adding more signatory countries. As the world map in Figure 11 makes clear, there are large gaps in coverage, particularly in South America, Africa, and Central Asia. The ITA could reduce tariffs in these regions and spur growth.
Figure 11: Signatories of the ITA as of 2014 Second, as ICT evolves into new categories of products, these new products are not covered by the ITA. Thus, ITA coverage naturally erodes over time, and must be renewed by adding those new products. As of 2007 these non-ITA ICT goods were estimated to increase the value of world trade covered by the ITA by 19 percent, from $1.5 to $1.8 trillion.71 Talks for an expansion round, ITA II, were started several years after the initial agreement. There has recently been another push by a large number of nations to increase product coverage. The initiative has run up against resistance, however, particularly from China, which mistakenly sees tariffs on newer, more advanced technology goods as important for its own industry development.72 Moreover, some countries have been taking steps backward despite previous commitments. India, for example, announced new 10 percent tariffs on ICT and other goods in its July 2014 budget, even though it is currently a member of the ITA.73
Eliminate Other Policies That Raise ICT Prices While they have not been the focus of this report, policymakers looking to decrease unnecessary additions to ICT prices should be aware of a number of other policies aside

PAGE 27 THE INFORMATION TECHNOLOGY & INNOVATION FOUNDATION | OCTOBER 2014
from taxes and tariffs. Many of these policies fall under the category of “non-tariff barriers” (NTBs) to trade because they reduce trade flows using indirect means.
NTBs discourage trade by biasing markets toward local products in a number of ways.74 Government local procurement rules unfairly advantage local producers and allow them to charge higher prices than international competition might otherwise require. Forced offsets similarly mandate local production, in this case from foreign firms fulfilling government contracts. Governments may also withhold local market access unless companies produce locally. These policies raise costs because if it were cheaper to manufacture locally, companies would already be doing so.
There are also NTBs targeted specifically at the ICT sector. Local data storage requirements have recently been gaining momentum. Such requirements raise ICT costs not only by forcing companies to locate servers in locations that may not be the most cost effective—they also force companies to operate at sub-optimal economies of scale.
Countries may also raise ICT prices or block ICT access altogether with policies that have less to do with opportunism and more to do with simple over-regulation. In new technology sectors, regulatory barriers to ICT sales or use, such as wireless compliance standards or restrictions on refurbished ICT products, are not uncommon and can slow or prevent ICT adoption by making the import or distribution process too onerous. Countries should therefore strive to streamline or eliminate onerous regulatory or certification processes for new ICT products, particularly when these diverge from international norms.
While countries should recognize that dismantling NTBs is in their own self-interest, international coordination is also needed to tackle NTBs. International trade agreements like the ITA are necessary to establish and maintain commitments, as well as provide adjudication procedures and real incentives for reducing NTBs.
CONCLUSION At least 31 nations have implemented combined tax and tariff rates on ICT goods and services over 5 percent. These higher costs slow ICT adoption and, by extension, economic growth. While ICT may provide an easy short-term revenue boost for some governments, slowing ICT adoption hurts the most vulnerable—marginal consumers or businesses that can’t afford the new technology—and reduces overall growth rates and therefore tax revenue. Governments that have targeted ICT goods and services for extra tax income need to see these myopic policies for what they are, and make a concerted effort to eliminate these specific taxes to enable their countries to reap the benefits of information and communications technology.
PAGE 28 THE INFORMATION TECHNOLOGY & INNOVATION FOUNDATION | OCTOBER 2014
APPENDIX A: METHODOLOGY Consumer tax and tariff index formula:
The main index is an expenditure-weighted average of (consumer services taxes) and ((1+ consumer products taxes) * (1+ consumer products tariffs))
o Consumer services taxes is a weighted average (by use rates) of:
base consumption taxes (VAT or sales tax) plus extra consumer taxes on fixed broadband services.
base plus extra consumer taxes on wireless broadband and wireless voice/text services.
o Consumer products taxes is simply the base plus extra tax rates for consumer products.
Note: since extra taxes in this sector are applied primarily to the telecommunications sector, the extra tax rate is adjusted downward by the percentage expenditure on telecommunications equipment out of total consumer spending on telecom equipment, computers, and audio and photographic equipment. Where expenditure ratios were unavailable, telecom expenditure was assumed to account for one half of total expenditure.
o Consumer product tariffs are based on a weighted average of tariffs on consumer-oriented ICT categories selected from the UNCTAD ICT definition.75
For the two additional consumer cost rankings, the main index is also weighted by:
o The total ICT expenditure of individual countries in order to compare the amount that each person in that country spends on ICT taxes and tariffs.
o The average prices for ICT in individual countries in order to compare the average price increase as a percentage of consumer income.
The business-use ICT tariff index is constructed similarly, however taxes on goods and services are weighted 2:1 towards goods, and the tariff rates are a weighted average of all tariffs on business-use ICT products.
The high and low elasticity estimates are simply taken from the highest and lowest elasticity estimates from Katz and Berry, and Deloitte and GSMA.76 Mid-range estimates are the weighted average of the high and low estimates, weighting the low estimate at three times the high rate.
Economic growth estimates are from Cave and Mfuh 2011 and Qiang, Rossotto, and Kimura 2009. A mid-range estimate of 0.07 percent change in GDP growth rate per 1 percent change in penetration rate was chosen based on a range of estimates for ICT technologies, principally telecommunications.

PAGE 29 THE INFORMATION TECHNOLOGY & INNOVATION FOUNDATION | OCTOBER 2014
Assumptions and additional method notes:
As a breakdown of tax rate data and expenditure/use was not reliably available for every possible type of good or service, specific tax rates were sometimes assumed to cover the entire sector expenditure (e.g., Tanzania’s “airtime tax” is assumed to include data services as well as voice).
Expenditure data is taken from the Euromonitor 2013 Report.77 Consumer services expenditure is taken from the telecom services category, while consumer products expenditure is the sum of the “telecommunications products” and “audio-visual, photographic, and information processing equipment” categories.
All ICT goods are assumed to be imports.

PAGE 30 THE INFORMATION TECHNOLOGY & INNOVATION FOUNDATION | OCTOBER 2014
APPENDIX B: DATA APPENDIX
Broadband Tax Wireless Tax Consumer Product Tax
Consumer Product Tariff
Business-Use
Product Tariff
Country Base Extra Total Base Extra Total Base Extra Total Total Total
Albania 20 0.2 20.2 20 0.1 20.1 20 20 0.2 0.1
Algeria 17 17 17 17 17 17 12.7 13.2
Angola 5 5 10 10 10 10 5.4 4.7
Antigua and Barbuda 15 15 15 15 15 15 9.1 8.6
Argentina 21 4 25 21 4 25 21 25 46 16.8 8.1
Australia 10 10 10 10 10 10 0.3 0.3
Azerbaijan 18 18 18 18 18 18 9.0 8.5
Bahamas, The 0 0 0 0 0 0 11.1 20.5
Bangladesh 15 45.5 60.5 15 114.1 129.1 15 15 17.7 14.1
Belarus 20 20 20 20 20 20 3.7 2.7
Benin 18 18 18 18 18 18 8.6 8.1
Bolivia 13 13 13 13 13 13 7.5 6.7
Bosnia and Herzegovina 17 17 17 17 17 17 5.9 2.7
Botswana 12 12 12 12 12 7 19 1.0 0.5
Brazil 25 3 28 25 3 28 25 9 34 17.6 6.9
Burkina Faso 18 18 18 18 15 15 30 8.7 9.3
Burundi 18 18 10 10 18 18 1.3 3.3
Cabo Verde 9 9 15 15 15 15 13.1 11.8
Cameroon 19 19 19.25 19.25 19.25 19.25 12.9 12.9
Canada 10 10 10 10 10 10 0.3 0.0
Chad 18 18 18 18 18 10 28 11.4 11.6
Chile 19 19 19 19 19 19 6.0 1.7

PAGE 31 THE INFORMATION TECHNOLOGY & INNOVATION FOUNDATION | OCTOBER 2014
Broadband Tax Wireless Tax Consumer Product Tax
Consumer Product Tariff
Business-Use
Product Tariff
Country Base Extra Total Base Extra Total Base Extra Total Total Total
China 3 3 3 3 17 17 5.8 0.5
Colombia 16 16 16 4 20 16 1 17 5.0 4.1
Congo, Dem. Rep. 16 16 16 10 26 16 16 6.6 7.1
Congo, Rep. 18 5 23 18 4 22 18 42 60 30.0 30.0
Costa Rica 13 13 13 13 13 13 0.3 0.0
Cote d'Ivoire 18 18 18 18 18 3 21 9.9 10.4
Croatia 25 25 23 6 29 25 25 0.0 0.0
Dominican Republic 16 12 28 16 12 28 18 18 12.4 8.9
Ecuador 12 12 12 15 27 12 12 5.6 2.5
El Salvador 13 13 13 13 22 22 0.4 0.2
Gabon 18 18 18 18 36 18 18 12.5 12.3
Gambia, The 20 20 15 5 20 15 15 7.6 10.5
Georgia 18 18 18 18 18 18 0.0 0.0
Ghana 13 3 16 15 6 21 12.5 6 18.5 2.5 5.8
Guatemala 12 12 12 12 12 12 0.5 0.1
Guinea 18 18 18 18 18 18 9.8 8.5
Guinea-Bissau 15 15 15 15 15 15 9.2 7.6
Honduras 12 12 12 12 12 12 0.7 0.8
Iceland 26 26 26 26 26 26 0.4 0.3
India 12 12 10.3 10.3 13 13 1.0 1.5
Indonesia 10 10 10 10 10 10 1.9 0.1
Iran, Islamic Rep. 6 6.1 12.1 1.5 3.7 5.2 0 0 36.5 19.8
Israel 18 18 18 18 18 18 0.8 0.3

PAGE 32 THE INFORMATION TECHNOLOGY & INNOVATION FOUNDATION | OCTOBER 2014
Broadband Tax Wireless Tax Consumer Product Tax
Consumer Product Tariff
Business-Use
Product Tariff
Country Base Extra Total Base Extra Total Base Extra Total Total Total
Jamaica 25 25 17 8 25 17 17 9.6 4.8
Japan 5 5 5 5 5 5 0.0 0.0
Jordan 16 4 20 12 8 20 16 16 2.0 1.3
Kazakhstan 12 12 12 12 12 12 4.7 3.2
Kenya 16 10 26 16 10 26 16 16 0.9 1.9
Korea, Rep. 10 10 10 10 10 10 2.5 0.6
Kyrgyz Republic 15 15 15 15 15 15 0.1 0.2
Lebanon 10 10 10 10 20 20 0.0 0.0
Lesotho 5 5 14 -9 5 14 7 21 0.1 2.7
Macedonia, FYR 18 18 18 18 18 5 23 0.6 0.4
Madagascar 18 8 26 20 7 27 18 3 21 10.2 8.8
Malaysia 6 6 6 6 12 10 10 0.1 0.1
Mauritius 15 15 15 15 15 15 0.0 0.0
Mexico 16 16 16 2 18 16 16 1.0 0.3
Moldova 20 20 20 2.5 22.5 20 20 0.4 0.3
Morocco 20 20 20 20 20 20 3.3 1.7
Mozambique 17 17 17 17 17 17 8.3 5.1
Namibia 15 15 15 15 15 15 0.1 0.0
Nepal 13 20.5 33.5 13 53.5 66.5 13 2 15 0.2 0.8
New Zealand 15 15 15 15 15 15 0.7 0.4
Nicaragua 15 15 15 15 15 15 1.0 0.7
Nigeria 5 5 5 8 13 5 8 13 6.4 6.0
Norway 25 25 25 25 25 25 0.0 0.0
Pakistan 20 2.4 22.4 16 4 20 0 0 15.1 8.7

PAGE 33 THE INFORMATION TECHNOLOGY & INNOVATION FOUNDATION | OCTOBER 2014
Broadband Tax Wireless Tax Consumer Product Tax
Consumer Product Tariff
Business-Use
Product Tariff
Country Base Extra Total Base Extra Total Base Extra Total Total Total
Panama 0 0.5 0.5 7 7 7 7 6.1 5.7
Papua New Guinea 10 10 10 10 10 10 0.0 0.0
Paraguay 10 10 10 10 10 10 3.5 1.4
Peru 12 12 19 19 18 18 0.2 0.2
Philippines 12 12 12 12 12 12 2.3 1.4
Qatar 0 0 0 0 0 0 0.6 0.6
Russian Federation 18 18 18 18 18 18 3.4 3.3
Rwanda 18 18 18 8 26 18 18 1.3 2.6
Samoa 15 15 15 15 15 15 20.0 20.0
Senegal 18 5 23 18 8.1 26.1 18 2 20 11.3 11.0
Sierra Leone 15 15 15 10 25 15 15 7.2 7.9
Singapore 7 7 7 7 7 7 0.0 0.0
South Africa 8 8 14 14 14 14 0.1 0.2
Sri Lanka 15 3 18 12 20 32 12 12 2.0 1.9
Sudan 17 17 17 17 17 17 8.9 6.4
Suriname 8 8 8 8 8 8 10.9 7.5
Swaziland 0 0 0 0 8 8 0.0 0.0
Sweden 25 25 25 25 25 25 1.8 0.2
Switzerland 8 8 8 8 8 8 0.0 0.0
Tanzania 18 7 25 18 19 37 18 18 1.4 3.8
Thailand 7 7 7 7 7 7 4.0 0.8
Togo 18 18 18 18 18 18 9.5 10.3
Trinidad and Tobago 15 15 15 15 15 15 6.0 3.3

PAGE 34 THE INFORMATION TECHNOLOGY & INNOVATION FOUNDATION | OCTOBER 2014
Broadband Tax Wireless Tax Consumer Product Tax
Consumer Product Tariff
Business-Use
Product Tariff
Country Base Extra Total Base Extra Total Base Extra Total Total Total
Tunisia 18 5 23 18 18 18 5 23 6.5 10.0
Turkey 23 15 38 18 31.4 49.4 18 20 38 1.0 0.2
Uganda 18 12 30 18 12 30 18 18 1.0 1.9
Ukraine 20 8 28 20 7.5 27.5 20 20 0.7 0.5
United Arab Emirates 0 0 0 0 0 0 0.6 0.6
United States* 1 1 9.4 7.65 16.3 9.4 9.4 0.1 0.1
Uruguay 22 22 22 22 22 22 6.4 2.6
Uzbekistan 20 20 20 20 20 20 23.4 17.2
Vanuatu 12 12 12 12 12 12 18.0 17.7
Venezuela, RB 12 4 16 12 4 16 12 12 7.4 6.0
Vietnam 10 10 10 10 10 10 4.1 1.1
Yemen, Rep. 10 10 5 5 5 3 8 3.9 4.3
Zambia 18 18 16 10 26 15 5 20 12.9 10.5
All numbers expressed as a percent of cost. For taxes, the base rate is the standard or average VAT or sales tax rate for the country. Extra rates are ICT-specific rates.
* US wireless taxes total 17.05 percent at the combined local, state, and federal levels. Unlike most other countries, the United States does not have a sales tax for services, so the “extra” rate was only counted on the percentage over and above the rate for the average state sales tax rate (9.4 percent).
PAGE 35 THE INFORMATION TECHNOLOGY & INNOVATION FOUNDATION | OCTOBER 2014
APPENDIX C: DATA SOURCES Tariff data: GSMA and Deloitte, Mobile Tax Review 2011 (Deloitte, 2011), http://www.gsma.com/publicpolicy/wp-content/uploads/2012/03/gsmaglobaltaxreviewnovember2011.pdf.
World Bank, World Integrated Trade Solution (tariffs for consumer or producer ICT goods, using the weighted mean for each product category, then weighted again by their total trade amount in each product; accessed August 8, 2014), http://wits.worldbank.org.
Tax data: Ernst & Young, 2014 Worldwide Corporate Tax Guide (Worldwide VAT GST and Sale Tax 2014), http://www.ey.com/GL/en/Services/Tax/Worldwide-Corporate-Tax-Guide---Country-list.
GSMA and Deloitte, Mobile Tax Review 2011 (Deloitte, 2011), http://www.gsma.com/publicpolicy/wp-content/uploads/2012/03/gsmaglobaltaxreviewnovember2011.pdf.
International Telecommunications Union, ICTEye Database (other taxes and sector taxes for fixed and mobile services and fixed and mobile devices; accessed July, 25, 2014), https://www.itu.int/net4/itu-d/icteye/.
Raul L. Katz, Ernesto Flores-Roux, and Judith Mariscal, The Impact of Taxation on the Development of the Mobile Broadband Sector (GSMA, 2011), http://www.gsma.com/latinamerica/wp-content/uploads/2012/06/tasreport.pdf.

PAGE 36 THE INFORMATION TECHNOLOGY & INNOVATION FOUNDATION | OCTOBER 2014
ENDNOTES
1. See Appendix B: Data Appendix. 2. See Appendix B: Data Appendix. 3. Robert D. Atkinson, The Past and Future of America’s Economy: Long Waves of Innovation that Power
Cycles of Growth (Northampton, Massachusetts: Edward Elgar, 2004). 4. Richard G. Lipsey, “Transformative Technologies in the Past Present and Future: Implications for the
U.S. Economy and U.S Economic Policy” (presentation at ITIF Breakfast Forum, July 15, 2008), http://www.itif.org/files/2008-07-15-lipsey.pdf.
5. See Kenneth I. Carlaw, Richard G. Lipsey, and Ryan Webb, “Has the ICT Revolution Run its Course?” (discussion paper no. 07-18, Simon Fraser University Department of Economics, September 2007), http://www.sfu.ca/econ-research/RePEc/sfu/sfudps/dp07-18.pdf.
6. For example, the OECD report The Economic Impact of ICT found that ICT (production and use) was responsible for 109 percent of the growth in labor productivity from 1996 to 2002. OECD, The Economic Impact of ICT: Measurement, Evidence and Implications (OECD Publishing, 2004), 96. See also: Robert D. Atkinson and Andrew McKay, “Digital Prosperity: Understanding the Economic Benefits of the Information Technology Revolution” (ITIF, March 2007), http://archive.itif.org/index.php?id=34; David M. Byrne, Stephen D. Oliner, and Daniel E. Sichel, “Is the Information Technology Revolution Over?” (working paper, SSRN, March 27, 2013), 22, http://papers.ssrn.com/abstract=2240961; Chad Syverson, “Will History Repeat Itself? Comments on ‘Is the Information Technology Revolution Over?,’” International Productivity Monitor 25 (2013): 37–40.
7. Jason Dedrick, ViJay Gurbaxani, and Kenneth L. Kraemer, “Information Technology and Economic Performance: A Critical Review of the Empirical Evidence,” ACM Computing Surveys 35, no. 1 (March 2003): 1.
8. For several of numerous literature surveys, see: Dedrick et al., “Information Technology and Economic Performance,” 12; Mirko Draca, Raffaella Sadun, and John Van Reenen, “Productivity and ICT: A Review of the Evidence” (discussion paper no. 749, Centre for Economic Performance, August 2006), http://eprints.lse.ac.uk/4561/; Tobias Kretschmer, “Information and Communication Technologies and Productivity Growth: A Survey of the Literature,” OECD Digital Economy Papers, no. 195 (2012), http://dx.doi.org/10.1787/5k9bh3jllgs7-en; M. Cardona, T. Kretschmer, and T. Strobel, “ICT and Productivity: Conclusions from the Empirical Literature,” Information Economics and Policy 25, no. 3 (September 2013): 109–125, doi:10.1016/j.infoecopol.2012.12.002; Paul Budde, Janet Burgess, Jaroslaw Ponder, and Youlia Lozanova, Broadband: A Platform for Progress (Broadband Commission for Digital Development, ITU/UNESCO, 2011), http://www.broadbandcommission.org/Documents/publications/Report_2.pdf.
9. Jack E. Triplett and Barry P. Bosworth, “Productivity Measurement Issues in Services Industries: ‘Baumol’s Disease’ has Been Cured,” FRBNY Economic Policy Review 9, no. 3 (2003): 23–33; see also Carol A. Corrado et al., “Sectoral Productivity in the United States: Recent Development and the Role of IT,” in Productivity Measurement and Analysis (OECD Publishing, 2008), https://www1.oecd.org/std/productivity-stats/44516351.pdf#page=437; Sophia P. Dimelis and Sotiris K. Papaioannou, “Technical Efficiency and the Role of ICT: A Comparison of Developed and Developing Countries,” Emerging Markets Finance & Trade 47 (July 2, 2011): 40–53, doi:10.2753/REE1540-496X4704S303; Jason Dedrick, Kenneth L. Kraemer, and Eric Shih, “Information Technology and Productivity in Developed and Developing Countries,” Journal of Management Information Systems 30, no. 1 (July 1, 2013): 97–122, doi:10.2753/MIS0742-1222300103.
10. John Van Reenen et al., “The Economic Impact of ICT, SMART” (Centre for Economic Performance, 2010), http://www.ukn.inet-tr.org.tr/eu/DCR/cStudyTheEconomicImpactofICTLondonSchoolofEconomics.pdf.
11. Martin Cave and Windfred Mfuh, “Taxing telecommunications/ICT Services: An Overview” (discussion paper, Global Industry Leader’s Forum, International Telecommunication Union, 2011), http://www.itu.int/ITU-D/treg/Events/Seminars/GSR/GSR11/documents/BBreports_Taxation_E.pdf.
12. S. Gilchrist, V. Gurbaxani, and R. Town, “Productivity and the PC Revolution” (working paper, Center for Research on Information Technology and Organizations, 2001); Robert K. Plice and Kenneth L. Kraemer, “Measuring Payoffs from Information-Technology Investments: New Evidence from Sector-

PAGE 37 THE INFORMATION TECHNOLOGY & INNOVATION FOUNDATION | OCTOBER 2014
Level Data on Developed and Developing Countries” (working paper, Center for Research on Information Technology and Organizations, 2001); Mika Maliranta and Petri Rouvinen, “Productivity effects of ICT in Finnish business” (discussion paper no. 852, Research Institute of the Finnish Economy, 2003).
13. Daniel J. Wilson, “IT and Beyond: The Contribution of Heterogeneous Capital to Productivity” (working paper no. 13, Federal Reserve Bank of San Francisco, 2004), 13.
14. Lorin M. Hitt and Prasanna Tambe, “Measuring Spillovers from Information Technology Investments” (proceedings of the 27th International Conference on Information Systems, Milwaukee, WI, 2006), 1793.
15. Ana Rincon, Michela Vecchi, and Francesco Venturini, “ICT Spillovers, Absorptive Capacity and Productivity Performance” (discussion paper, National Institute of Economic and Social Research, November 25, 2013), http://eprints.mdx.ac.uk/9992/.
16. Christine Zhen-Wei Qiang, Carlo M. Rossotto, and Kaoru Kimura, “Economic Impacts of Broadband,” in Information and Communications for Development 2009: Extending Reach and Increasing Impact (The International Bank for Reconstruction and Development / The World Bank, 2009), 35–50.
17. For developing country literature, see: Dedrick et al., “Information Technology and Productivity in Developed and Developing Countries” for a cross-country study, or for specific examples, see: Geoff Walsham, “ICTs for the Broader Development of India: An Analysis of the Literature,” The Electronic Journal of Information Systems in Developing Countries 41 (2010), http://www.ejisdc.org/Ojs2/index.php/ejisdc/article/view/665; Jyoti Vig, “Information Technology and the Indian Economy” (PhD diss., University of Minnesota, March 2011), http://conservancy.umn.edu/bitstream/104630/1/Vig_umn_0130E_11796.pdf.
18. Deloitte, “What Is the Impact of Mobile Telephony on Economic Growth?” (GSMA, November 2012), http://www.gsma.com/publicpolicy/wp-content/uploads/2012/11/gsma-deloitte-impact-mobile-telephony-economic-growth.pdf.
19. See for example, Yi-Chia Wang, “How ICT Penetration Influences Productivity Growth: Evidence From 17 OECD Countries,” Economic Development Quarterly (March 5, 2013), doi:10.1177/0891242413478650.
20. For an overview of the literature, focusing specifically on broadband, see: Raul Katz and Fernando Callorda, “Economic Impact of Broadband Deployment in Ecuador,” (working paper, Columbia Institute for Tele-Information / Center of Technology and Society, 2013), http://www.teleadvs.com/wp-content/uploads/Broadband_Impact_in_Ecuador_study.pdf.
21. Robert W. Fairlie, “The Personal Computer and Entrepreneurship,” Management Science 52, no. 2 (February 2006): 187–203, doi:10.1287/mnsc.1050.0479.
22. For a summary, see Section 2.2 of Raul L. Katz and Taylor A. Berry, Driving Demand for Broadband Networks and Services (Springer International Publishing, 2014), http://link.springer.com/10.1007/978-3-319-07197-8.
23. Katz and Berry, Driving Demand for Broadband Networks and Services, 33. 24. “High” or “large” values of elasticity indicate larger absolute values, while “low” or “small” values indicate
values close to zero. 25. “Feeling Flush,” Science Museum website, last modified August 18, 2011, accessed September 23, 2014,
http://www.sciencemuseum.org.uk/about_us/press_and_media/press_releases/2011/09/feeling%20flush.aspx.
26. Ralf Dewenter and Justus Haucap, “Demand Elasticities for Mobile Telecommunications in Austria,” Ruhr Economic Papers, no. 17 (June 1, 2007), http://papers.ssrn.com/abstract=1012100.
27. James Alleman and Paul Rappoport, “Regulation of Latin American’s Information and Communications Technology (ICT) Sector: Success or Failure?” (working paper, CPR LATAM - Communication Policy Research Conference, July 4, 2014), http://papers.ssrn.com/abstract=2462548; Hernán Galperin and Christian A. Ruzzier, “Broadband Tariffs in Latin America: Benchmarking and Analysis” (Proceedings of the Fifth Acorn-Redecom Conference, 2011), http://www.researchgate.net/publication/228149544_Broadband_Tariffs_in_Latin_America_Benchmarking_and_Analysis/file/79e4150d1d962affe0.pdf; Katz and Callorda, “Economic Impact of Broadband Deployment in Ecuador.”

PAGE 38 THE INFORMATION TECHNOLOGY & INNOVATION FOUNDATION | OCTOBER 2014
28. Galperin and Ruzzier, “Broadband Tariffs in Latin America”; Katz and Barry, Driving Demand for Broadband Networks and Services.
29. Building on Katz and Berry, Driving Demand for Broadband Networks and Services, with several additional (non-broadband) studies.
30. Katz and Berry, Driving Demand for Broadband Networks and Services. 31. Author analysis using Euromonitor expenditure data: Euromonitor International, World Consumer
Income and Expenditure Patterns (London: Euromonitor International, 2013). 32. See the estimates for own-price elasticity of computer goods in the United States in Jeffrey T. Prince,
“Repeat Purchase Amid Rapid Quality Improvement: Structural Estimation of Demand for Personal Computers,” Journal of Economics & Management Strategy 17, no. 1 (March 2008): 1–33, doi:10.1111/j.1530-9134.2008.00169.x; and Jeremy Greenwood and Karen A. Kopecky, “Measuring the Welfare Gain from Personal Computers,” Economic Inquiry 51, no. 1 (January 2013): 336–47, doi:10.1111/j.1465-7295.2011.00447.x.
33. Author calculations using Percentage of households with computers and Fixed (wired) broadband subscriptions per 100 inhabitants: Measuring the Information Society 2013, International Telecommunications Union (Geneva: International Telecommunications Union), http://www.itu.int/en/ITU-D/Statistics/Documents/publications/mis2013/MIS2013_without_Annex_4.pdf.
34. “Internet Going Mobile” (policy brief, Research ICT Africa, September 2012), http://www.researchictafrica.net/publications/Country_Specific_Policy_Briefs/Internet_going_mobile_-_Internet_access_and_usage_in_11_African_countries.pdf.
35. For example, if the high elasticity estimate was -2, and the low elasticity estimate was -1, our weighted average would be -1.25. (3 * -1 + 1 * -2) / 4
36. Note: penetration numbers are not directly comparable because fixed broadband numbers are by household while mobile penetration rates are by individual. Deloitte, “Mobile Taxes and Fees: a Toolkit of Principles and Evidence” (GSMA, February 2014), http://www.gsma.com/publicpolicy/wp-content/uploads/2014/02/Mobile-taxes-and-fees-A-toolkit-of-principles-and-evidence_fullreport-FINAL1.pdf; Katz and Berry, Driving Demand for Broadband Networks and Services.
37. Author calculations; see Methodology Appendix. 38. See Methodology Appendix for more information. 39. Katz and Barry, Driving Demand for Broadband Networks and Services, 33-39. 40. Gilbert Cette and Jimmy Lopez, “ICT Demand Behavior: An International Comparison,” (working
paper, Banque de France, September 2009), http://www.banque-france.fr/uploads/tx_bdfdocumentstravail/DT252.pdf.
41. Luke A. Stewart and Robert D. Atkinson, “Restoring America’s Lagging Investment in Capital Goods” (ITIF, October 2013), http://www2.itif.org/2013-restoring-americas-lagging-investment.pdf.
42. See Methodology Appendix for more information. 43. Katz and Barry, Driving Demand for Broadband Networks and Services, 20. 44. Cave and Mfuh, “Taxing telecommunications/ICT Services.” 45. Zhen-Wei Qiang, Rossotto, and Kimura, “Economic Impacts of Broadband,” 35–50. 46. Deloitte, “What Is the Impact of Mobile Telephony on Economic Growth?” 47. OECD, “Implications of Global Value Chains for Trade, Investment, Development, and Jobs” (OECD,
August 6, 2013), 20, http://www.oecd.org/sti/ind/G20-Global-Value-Chains-2013.pdf; Stephen Ezell and Robert D. Atkinson, “How ITA Expansion Benefits the Chinese and Global Economies” (ITIF, April 11, 2014), http://www.itif.org/publications/how-ita-expansion-benefits-chinese-and-global-economies.
48. Charles I. Jones, “Intermediate Goods and Weak Links in the Theory of Economic Development,” American Economic Journal: Macroeconomics 3, no. 2 (April 2011): 1–28, doi:10.1257/mac.3.2.1.
49. See Appendix B: Data Appendix for more information. 50. Author calculations using TRAINS data from WITS. See Appendix B: Data Appendix for more
information. 51. See Appendix B: Data Appendix.

PAGE 39 THE INFORMATION TECHNOLOGY & INNOVATION FOUNDATION | OCTOBER 2014
52. A number of U.S. states have enacted broadband and mobile taxes. For more information, see: Scott Mackey and Joseph Henchman, “Wireless Taxation in the United States 2014” (The Tax Foundation, October 2014), http://taxfoundation.org/article/wireless-taxation-united-states-2014.
53. See preceding footnote for country income definitions. Groups use an unweighted average for countries with available data.
54. Exact definitions for country are defined using the current World Bank country income classification: “For the current 2015 fiscal year, low-income economies are defined as those with a GNI per capita, calculated using the World Bank Atlas method, of $1,045 or less in 2013; middle-income economies are those with a GNI per capita of more than $1,045 but less than $12,746; high-income economies are those with a GNI per capita of $12,746 or more. Lower-middle-income and upper-middle-income economies are separated at a GNI per capita of $4,125.” World Bank Open Data, “Country and Lending Groups,” accessed October 22, 2013, http://data.worldbank.org/about/country-and-lending-groups.
55. Ezell and Atkinson, “How ITA Expansion Benefits the Chinese and Global Economies.” 56. See Appendix B: Data Appendix. 57. See Appendix B: Data Appendix. 58. See Appendix B: Data Appendix. 59. Deloitte, “Mobile Taxes and Fees A Toolkit of Principles and Evidence,” 38. 60. Based on a 2012 per capita United States GNI of $46,960. 61. Author calculations based on 50 countries with available data. Price as a percentage of GNI per capita
was significant at the 5 percent level with a coefficient of -30. 62. See Methodology and Data Appendixes. 63. See Appendix A: Methodology and Appendix B: Data Appendix. 64. Raul L. Katz, Ernesto Flores-Roux, and Judith Mariscal, The Impact of Taxation on the Development of the
Mobile Broadband Sector (GSMA, 2011), 25-29, http://www.gsma.com/latinamerica/wp-content/uploads/2012/06/tasreport.pdf.
65. Deloitte, “Mobile Taxes and Fees A Toolkit of Principles and Evidence.” 66. P.D. Kaushik and Nirvikar Singh, “Information Technology and Broad-Based Development: Preliminary
Lessons from North India” (working paper no. 522, UC Santa Cruz Economics, July 2002), http://papers.ssrn.com/sol3/papers.cfm?abstract_id=344830.
67. Timothy J. Sturgeon and Olga Memedovic, “Mapping Global Value Chains: Intermediate Goods Trade and Structural Change in the World Economy” (United Nations Industrial Development Organization, 2011), Figure 1.
68. Ezell and Atkinson, “How ITA Expansion Benefits the Chinese and Global Economies.” 69. Selcuk Caner, Martin Grote, and Russell Krelove, “The Bahamas: Tax Reforms for Increased Buoyancy”
(IMF Country Report no. 14/17, January 2014), http://www.imf.org/external/pubs/ft/scr/2014/cr1417.pdf; Kiyoshi Nakayama, Selcuk Caner, and Peter Mullins, “Philippines: Road Map for a Pro-Growth and Equitable Tax System” (IMF Country Report no. 12/60, March 2012), http://www.imf.org/external/pubs/ft/scr/2012/cr1260.pdf.
70. Nobuo Kiriyama, “Trade in Information and Communications Technology and Its Contribution to Trade and Innovation” (OECD, June 2011), 26, http://www.oecd-ilibrary.org/trade/trade-in-information-and-communications-technology-and-its-contribution-to-trade-and-innovation_5kg9m8cqg4wj-en.
71. Martin H. Thelle, Eva R. Sunesen and Holger N. Jensen, Expanding the Information Technology Agreement (ITA) (Copenhagen Economics, October 2010), http://trade.ec.europa.eu/doclib/docs/2011/april/tradoc_147791.pdf. See page 52. Calculations based on a 0.7172 USD/EUR exchange rate from October 2010; http://www.exchangerates.org.uk/USD-EUR-13_10_2010-exchange-rate-history.html.
72. Ezell and Atkinson, “How ITA Expansion Benefits the Chinese and Global Economies;” John Neuffler, “Global Industry Says Finish the Information Technology Agreement (ITA) Expansion – Now,” ITI Website (blog), ITI, September 28, 2014, http://blog.itic.org/blog/global-industry-says-finish-the-information-technology-agreement-ita-expansion-now; James Bacchus, “The WTO Needs China to Lead” The Wall Street Journal, May 29, 2014, http://online.wsj.com/articles/bacchus-the-wto-needs-china-to-lead-1401381136.

PAGE 40 THE INFORMATION TECHNOLOGY & INNOVATION FOUNDATION | OCTOBER 2014
73. Stephen Ezell, “A Modi Administration Report Card on the Eve of His Visit to the United States,” Innovation Files (blog), ITIF, September 25, 2014, http://www.innovationfiles.org/a-modi-administration-report-card-on-the-eve-of-his-visit-to-the-united-states/.
74. For more information, see Stephen J. Ezell, Robert D. Atkinson, and Michelle A. Wein, “Localization Barriers to Trade: Threat to the Global Innovation Economy” (ITIF, September 2013), http://www2.itif.org/2013-localization-barriers-to-trade.pdf.
75. UNCTAD Division on Technology and Logistics, “Updating the Partnership Definition of ICT Goods From HS 2007 to HS 2012” (Technical Note, no. 2, Unedited, January 2014) http://new.unctad.org/Documents/ICT%20sector/Technical%20note%202%20HS2012%20update%20ICT%20goods.PDF.
76. Deloitte, “Mobile Taxes and Fees A Toolkit of Principles and Evidence;” Katz and Berry, Driving Demand for Broadband Networks and Services.
77. Euromonitor International, World Consumer Income and Expenditure Patterns.
PAGE 41 THE INFORMATION TECHNOLOGY & INNOVATION FOUNDATION | OCTOBER 2014
ACKNOWLEDGEMENTS The authors wish to thank the following individuals for providing input to this report: Michelle Wein, Stephen Ezell, Tim Kelly and Raul Katz. Any errors or omissions are the authors’ alone. ABOUT THE AUTHORS Ben Miller is an economic growth policy analyst at the Information Technology and Innovation Foundation. He has a Master’s degree in International Development and Economics from Johns Hopkins School of Advanced International Studies. Robert Atkinson is the President of the Information Technology and Innovation Foundation. He is also author of the books Innovation Economics: The Race for Global Advantage (Yale, 2012) and The Past And Future Of America’s Economy: Long Waves Of Innovation That Power Cycles Of Growth (Edward Elgar, 2005). Dr. Atkinson received his Ph.D. in City and Regional Planning from the University of North Carolina at Chapel Hill in 1989. ABOUT ITIF The Information Technology and Innovation Foundation (ITIF) is a Washington, D.C.-based think tank at the cutting edge of designing innovation strategies and technology policies to create economic opportunities and improve quality of life in the United States and around the world. Founded in 2006, ITIF is a 501(c) 3 nonprofit, non-partisan organization that documents the beneficial role technology plays in our lives and provides pragmatic ideas for improving technology-driven productivity, boosting competitiveness, and meeting today’s global challenges through innovation. FOR MORE INFORMATION, CONTACT ITIF BY PHONE AT 202.449.1351, BY EMAIL AT [email protected], ONLINE AT WWW.ITIF.ORG, JOIN ITIF ON LINKEDIN OR FOLLOW ITIF ON TWITTER @ITIFDC AND ON FACEBOOK.COM/INNOVATIONPOLICY.