digital day 2016 - home - ofcom · digital day 2016 slide pack 2: children’s 3 day media and...
TRANSCRIPT

11
Date
Digital Day 2016Slide pack 2: Children’s 3 day media and communications diary findings
Fieldwork: Feb-April 2016

22
Methodology

33
What is Digital Day?
A quantitative diary study examining the media consumption and
communications behaviour of both adults (16+) and children (6-15)
across a typical week, on a minute-by-minute basis, covering:
What? 28 media and comms activities + nets/groups
How? 14 device types + nets/groups
Who? Age, gender, nation and other demographics/classifications
Where? Home, Work/study, Travelling, other
When? Across a week, day of week, time of day

44
Stage 3: Follow-up-survey
Additional c20 min questionnaire served during final day of diary
(to link back to diary respondents and activity records)
Stage 2: Seven day diary (3 days for under 16s*)
Paper diary aide booklet sent to all respondents to fill out and help with completion.
Mix of online self-completion and telephone administered completion options, using a consistent online interface.
Stage 1: Recruitment survey
c15 min telephone recruitment survey using Kantar face-to-face Omnibus re-contacts.
Covered demographics, task description and devices in household.
Survey flow
Completed diaries (respondents)1512 Adults aged 16+ in the UK
238 Primary school 6-11 year olds
238 Secondary school 11-15 year olds

55
10. A Tablet e.g. iPad, Samsung Galaxy, Kindle Fire
11. A Desktop computer
12. A Laptop
15. A Printed copy (Newspaper/book/magazine)
Devices – 15 individual and 8 groups
1. A TV set (including TV set top
box, DVD/Blu-ray player or
streaming media players, but
exc. games console)
3. A Traditional analogue
(FM/MW/AM) radio set (portable or
fixed)
4. A Digital (DAB or WiFi) radio set
5. A Landline phone
6. A Stereo system / HiFi / Receiver
/ Home cinema system
13. An e-Reader e.g. Kindle (not
Fire), Kobo
14. Another electronic device e.g.
mp3 player, handheld games
console, digital camera, smartwatch
2. A Games Console attached to TV
set e.g. Xbox, Playstation, Nintendo
Wii
7. A Smartphone e.g. iPhone,
Blackberry, Android, etc
8. A Standard mobile phone (not a Smartphone)
TV set(Exc. Games consoles)
Radio set Games Console
Tablet Other devices
Mobile
Computer Print

66
Grouped activities
Types Grouped activities Activities Device used for activity
Watching
TV or films on a TV set Live TV, Recorded TV, Free On-Demand, Paid On-Demand, DVD/Bluray TV set
TV or films on another device Live TV, Recorded TV, Free On-Demand, Paid On-Demand, DVD/Bluray Any capable device except for TV set
Other video (short clips) Short online video clips Any capable device
Listening
Radio on radio set Live Radio, On-Demand Radio Radio set
Radio on another device Live Radio, On-Demand Radio Any capable device except for radio set types
Other audio Personal digital music, Streamed music, CD/Vinyl, Music videos Any capable device
Communicating
Voice communications By phone call, By video calls Any capable device
Text communicationsSocial Networking, Instant Messaging, emailing, Texting,
Photo or video messagesAny capable device
Playing Games Video Games Any capable device
Read/
browsed/
used
Print media Newspapers (print or digital), Magazines (print or digital), Books (print or digital) Print
Other Internet media Newspapers (print or digital), Magazines (print or digital), Other online news,
Sports news /updates, Online shopping/ticketing, Other websites or appsAny capable device (excluding print)
Other non-internet media Books (printed or eBook), Other activities Any capable device

77
Activities Overview

88
77%
77%
54%
50%
39%
37%
37%
30%
28%
27%
26%
26%
24%
23%
23%
15%
14%
14%
13%
13%
12%
7%
5%
5%
5%
4%
3%
3%
Live TV
Video games
Books (print or digital)
Online video clips
Recorded TV
Live Radio
Other websites or apps
Other activities
Free On-Demand
Texting
Paid On-Demand
DVD/Bluray
Social networking
Personal digital audio
Instant messaging
Phone calls
Streamed music
Music videos
CD/Vinyl
Photo or video messaging
Video calls
Emailing
Newspapers (print or digital)
Sports news/updates
Online shopping/ticketing
On-Demand Radio
Magazines (print or digital)
Other online news
Base: Children aged 6-15 (476)
Chart shows the proportion of children who recorded each activity (D) at any point across their diary week.
Source: Ofcom Digital Day 2016, Data book 1: A1
Weekly reach of media and comms activities
Among children aged 6-15
52%
66%
97%
77%
80%
WATCHED
LISTENED
COMMUNICATED
READ/BROWSED/USED
PLAYED
Online video clips (+18pp) and
Paid on-demand (+11pp) have
increased substantially since 2014.
Conversely DVD/Bluray (-9pp) and
Live TV (-8pp) have fallen.

99
81%
80%
62%
45%
39%
39%
31%
30%
29%
27%
26%
14%
13%
11%
10%
10%
9%
7%
6%
5%
5%
3%
3%
3%
2%
2%
1%
1%
Video games
Live TV
Books (print or digital)
Online video clips
Recorded TV
Live Radio
DVD/Bluray
Other websites or apps
Free On-Demand
Paid On-Demand
Other activities
CD/Vinyl
Personal digital audio
Music videos
Instant messaging
Phone calls
Texting
Video calls
Social networking
Streamed music
Photo or video messaging
Magazines (print or digital)
Sports news/updates
Online shopping/ticketing
On-Demand Radio
Other online news
Emailing
Newspapers (print or digital)
Base: Primary 6-11s (238)
Chart shows the proportion of children who recorded each activity (D) at any point across their diary week.
Source: Ofcom Digital Day 2016, Data book 1: A1
Weekly reach of media and comms activities
Among Primary 6-11s
30%
59%
98%
91%
80%
WATCHED
LISTENED
COMMUNICATED
READ/BROWSED/USED
PLAYED
Online video clips (+22pp) ,
Paid on-demand (+13pp) and
Free on-demand (+10pp) have
all increased substantially.
Conversely Live TV (-10pp) and
DVD/Bluray (-9pp) have both
fallen since 2013.

1010
73%
70%
58%
55%
53%
50%
43%
40%
39%
39%
36%
33%
29%
26%
26%
24%
23%
20%
19%
18%
15%
11%
10%
9%
8%
7%
4%
3%
Live TV
Video games
Online video clips
Texting
Social networking
Other websites or apps
Instant messaging
Books (print or digital)
Recorded TV
Personal digital audio
Other activities
Live Radio
Streamed music
Free On-Demand
Paid On-Demand
Photo or video messaging
Phone calls
Video calls
DVD/Bluray
Music videos
Emailing
CD/Vinyl
Newspapers (print or digital)
Sports news/updates
Online shopping/ticketing
On-Demand Radio
Magazines (print or digital)
Other online news
Base: Secondary 11-15s (238)
Chart shows the proportion of children who recorded each activity (D) at any point across their diary week.
Source: Ofcom Digital Day 2016, Data book 1: A1
Weekly reach of media and comms activities
Among Secondary 11-15s
88%
77%
95%
70%
80%
WATCHED
LISTENED
COMMUNICATED
READ/BROWSED/USED
PLAYED
Online video clips (+13pp) and
Paid on-demand (+9pp) have
increase since 2014
Streamed music (+10pp)
has increased since 2014,
with Live radio (-9pp)
moving the other way

1111
Base: Children aged 6-15 - 2016 (476), 2014 (359)
Source: Ofcom Digital Day 2016, Data book 1: B4(2)
Weekly reach of grouped activities, 2016 vs. 2014
Among children aged 6-15
Data is taken from a combination of activities (D) and devices (E) recorded. The calculations are made by netting all grouped activities together and averaging the
time spent. Zeros are included so as to reflect the whole UK population..
Arrows indicate
significant changes since
2014 (99% level)
92%
29%
50%
32%
11%
48%
24%
45%
77%
51%
44%
34%
TV Or Films On A TV Set
TV Or Films On Another Device
Other Video
Radio On Radio Set
Radio On Another Device
Other Audio
Voice Comms
Text Comms
Games
Print Media
Other Internet Media
Other Non-internet Media
18pp

1212
95%
26%
45%
35%
8%
36%
16%
20%
81%
58%
34%
30%
87%
35%
58%
28%
15%
66%
37%
86%
70%
38%
60%
40%
TV Or Films On A TV Set
TV Or Films On Another Device
Other Video
Radio On Radio Set
Radio On Another Device
Other Audio
Voice Comms
Text Comms
Games
Print Media
Other Internet Media
Other Non-internet Media
Primary 6-11s
Secondary 11-15s
Base: Primary 6-11s (238), Secondary 11-15s (238)
Source: Ofcom Digital Day 2016, Data book 1: B4(2)
Weekly reach of grouped activities, Primary 6-11s vs. Secondary 11-15s
Data is taken from a combination of activities (D) and devices (E) recorded. The calculations are made by netting all grouped activities together and averaging the
time spent. Zeros are included so as to reflect the whole UK population..

1313
92%
29%
50%
32%
11%
48%
24%
45%
77%
51%
44%
34%
96%
31%
25%
69%
32%
56%
85%
87%
40%
56%
75%
53%
TV Or Films On A TV Set
TV Or Films On Another Device
Other Video
Radio On Radio Set
Radio On Another Device
Other Audio
Voice Comms
Text Comms
Games
Print Media
Other Internet Media
Other Non-internet Media
Children (6-15)
Adults (16+)
Base: Children aged 6-15 (476), Adults aged 16+ (1512)
Source: Ofcom Digital Day 2016, Data book 1: B4(2)
Weekly reach of grouped activities, Children (6-15) vs. Adults (16+)
Data is taken from a combination of activities (D) and devices (E) recorded. The calculations are made by netting all grouped activities together and averaging the
time spent. Zeros are included so as to reflect the whole UK population..

1414
Base: Children aged 6-15 (476)
Source: Ofcom Digital Day 2016, Data book 6: A2
Weekly reach of grouped activities, by time of day
Among children aged 6-15
0%
10%
20%
30%
40%
50%
60%
70%
80%
90%
100% Any media and comms
TV Or Films On A TV Set
TV Or Films On Another Device
Other Video
Radio On Radio Set
Radio On Another Device
Other Audio
Voice Comms
Text Comms
Games
Print Media
Other Internet Media
Other Non-internet Media
6am 12pm
Midday
9am 3pm 6pm 9pm 12am
Midnight
3am
Chart shows the proportion of adults who recorded each grouped activity (D) at each time slot across a week.

1515
1h 39m
1h 36m
1h 20m
1h 13m
1h 5m
1h 4m
1h 3m
1h 3m
0h 50m
0h 48m
0h 43m
0h 39m
0h 39m
0h 39m
0h 38m
0h 38m
0h 37m
0h 36m
0h 34m
0h 25m
0h 19m
0h 16m
0h 15m
0h 15m
0h 14m
0h 14m
0h 13m
0h 7m
Video games
Live TV
Social networking
Instant messaging
Online video clips
Photo or video messaging
Paid On-Demand
Video calls
Recorded TV
Streamed music
DVD/Bluray
Personal digital audio
Other activities
Other websites or apps
Books (print or digital)
Music videos
Free On-Demand
Live Radio
Texting
CD/Vinyl
On-Demand Radio
Emailing
Other online news
Sports news/updates
Newspapers (print or digital)
Magazines (print or digital)
Online shopping/ticketing
Phone calls
Base: Children aged 6-15 (476)
Source: Ofcom Digital Day 2016, Data book 1: B4
Average time spent on activities per day
Among children aged 6-15 who did activity at all over a week (excluding zeros)
Chart shows the mean number of minutes recorded per day for each activity (D) among those who did each one at any point across their diary week i.e. excludes
zeros.

1616
Base: Children aged 6-15 - 2016 (476), 2014 (359)
Source: Ofcom Digital Day 2016, Data book 1: B4(2)
Average time spent on grouped activities per day, 2016 vs. 2014
Among children aged 6-15
Data is taken from a combination of activities (D) and devices (E) recorded. The calculations are made by netting all grouped activities together and averaging the
time spent. Zeros are included so as to reflect the whole UK population..
1h 54m
0h 17m
0h 32m
0h 11m
0h 2m
0h 24m
0h 8m
0h 42m
1h 16m
0h 19m
0h 16m
0h 13m
TV Or Films On A TV Set
TV Or Films On Another Device
Other Video
Radio On Radio Set
Radio On Another Device
Other Audio
Voice Comms
Text Comms
Games
Print Media
Other Internet Media
Other Non-internet Media2014 differences shown when
+/- 10 mins or higher
12 mins
23 mins

1717
2h 5m
0h 12m
0h 26m
0h 12m
0h 1m
0h 12m
0h 4m
0h 7m
1h 10m
0h 21m
0h 10m
0h 10m
1h 37m
0h 25m
0h 42m
0h 9m
0h 4m
0h 44m
0h 15m
1h 37m
1h 26m
0h 15m
0h 27m
0h 19m
TV Or Films On A TV Set
TV Or Films On Another Device
Other Video
Radio On Radio Set
Radio On Another Device
Other Audio
Voice Comms
Text Comms
Games
Print Media
Other Internet Media
Other Non-internet Media
Primary 6-11
Secondary 11-15
Base: Primary 6-11s (238), Secondary 11-15s (238)
Source: Ofcom Digital Day 2016, Data book 1: B4(2)
Average time spent on grouped activities per day, Primary 6-11s vs. Secondary 11-15s
Data is taken from a combination of activities (D) and devices (E) recorded. The calculations are made by netting all grouped activities together and averaging the
time spent. Zeros are included so as to reflect the whole UK population..

1818
1h 54m
0h 17m
0h 32m
0h 11m
0h 2m
0h 24m
0h 8m
0h 42m
1h 16m
0h 19m
0h 16m
0h 13m
3h 47m
0h 18m
0h 7m
1h 14m
0h 14m
0h 31m
0h 25m
1h 30m
0h 28m
0h 27m
0h 49m
0h 41m
TV Or Films On A TV Set
TV Or Films On Another Device
Other Video
Radio On Radio Set
Radio On Another Device
Other Audio
Voice Comms
Text Comms
Games
Print Media
Other Internet Media
Other Non-internet Media
Children 6-15
Adults 16+
Base: Children aged 6-15 (476), Adults aged 16+ (1512)
Source: Ofcom Digital Day 2016, Data book 1: B4(2)
Average time spent on grouped activities per day, Children (6-15) vs. Adults (16+)
Data is taken from a combination of activities (D) and devices (E) recorded. The calculations are made by netting all grouped activities together and averaging the
time spent. Zeros are included so as to reflect the whole UK population..

1919
Average daily media and comms time, by age group
Adults 16+ Children 6-15 Primary 6-11 Secondary 11-15
8h 45m
5h 24m
9h 8m
4h 49m
6h 20m
10h 52m
Simultaneous
activity
Actual time
spent 6h 34m
5h 20m
8h 32m
Base: Adults aged 16+ (1512), Children aged 6-15 (476), Primary 6-11 (238), Secondary 11-15 (238)
Source: Ofcom Digital Day 2016, Data book 1: B4(2)
*The total average (inc. simultaneous activity) is calculated by summing together the duration (B2) for each activity, dividing by the weighted base of respondents, and then by 7 days.
The actual average net time spent (equivalent to solus) is then deducted in order to gauge simultaneous activity time. i.e. time spent doing more than one activity at the same time.
- 14m - 33m - 16m - 1h 1m
Actual time spent
Total time spent
Difference vs. 2014
+ 5m - 28m - 17m - 15m

2020
Base: Children aged 6-15 (476)
Source: Ofcom Digital Day 2016, Data book 1: B4(2)
Average daily media and comms time (inc. simultaneous activity*), by activity type
Among children 6-15
*The total average (inc. simultaneous activity) is calculated by summing together the duration (B2) for each activity, dividing by the weighted base of respondents, and then by 7 days.
The actual average net time spent (equivalent to solus) is then deducted in order to gauge simultaneous activity time. i.e. time spent doing more than one activity at the same time.
6h 34m 2h 45m
39m
1h 3m
1h 17m
50m

2121
Base: Children aged 6-15 (476)
Source: Ofcom Digital Day 2016, Data book 6: D2 for main chart data, , and Data book 1: B4 for average time spent per day
Media and comms versus non-media and comms activity, by time of day
Among children aged 6-15
Chart shows the proportion of activity attributed to media & comms activity (D), sleep (C) and non-media & comms for each time slot across a week.
Any media and comms activity
Average time spent per day
8h 40m
6am 12pm
Midday
9am 3pm 6pm 9pm 12am
Midnight
3am
No media/comms (awake)
Average time spent per day
8h 18m
Sleep
Average time spent per day
10h 16m
Any media and comms activity
Average time spent per day
5h 24m

2222
39%
42%
52%
32%
19%
10%
8%
11%
19%
16%
5%
27%
4%
19%
22%
17%
19%
13%
13%
12%
Adults 16+
Children 6-15
Primary 6-11
Secondary 11-15
Chart shows the proportion of all media and comms time (B2) attributed to each activity type by age group.
*The average weekly minutes figure is among those who did any media and comms activity across their diary week and also includes simultaneous activity
2665
2029
2274
3677
Base: Adults aged 16+ (1512), Children aged 6-15 (476), Primary 6-11 (238), Secondary 11-15 (238)
Source: Ofcom Digital Day 2016, Data book 1: C1 for main chart data and B1 for average weekly minutes
Proportion of media and comms time attributed to activity types, by age group
Watched Listened Communicated Played Read/Browsed/Used
Average weekly mins.
of media & comms
activity*

2323
Watched
Listened to
Communicated
Played
Read/Browsed/Used
Base: Children aged 6-15 (476)
Chart shows the proportion of all media and comms activity attributed to each broad type for each time slot across a week.
Note: the base of media and comms activity varies by time, and so relatively low activity during late night time periods should be treated with caution
Source: Ofcom Digital Day 2016, Data book 6: B2
Proportion of media and comms attributed to activity types, by time of day
Among children aged 6-15
6am 12pm
Midday
9am 3pm 6pm 9pm 12am
Midnight

2424
24Base: Children aged 6-15 (476)
Adult diary: Chart shows the proportion of all time spent on activity types (B2) attributed to each device
*The average weekly minutes figure is among those who did each type of activity at all across their diary week, and also includes simultaneous activity
Source: Ofcom Digital Day 2016 , Data book 3: C11 for main chart data and Data book 1: B1 for average weekly minutes
Proportion of time spent on activity types attributed to devices.
Among children aged 6-15
30%
71%
4%
0%
1%
1%
3%
30%
13%
4%
1%
2%
51%
3%
20%
5%
30%
77%
6%
13%
15%
13%
12%
13%
23%
14%
11%
6%
15%
26%
3%
1%
17%
1%
3%
3%
5%
0%
0%
0%
0%
38%
All Media and comms
Watching
Listening
Communicating
Playing
Reading/browsing/using 441
695
843
416
1191
2759
Average weekly
minutes*
Radio set Games
Console
TabletMobile Computer PrintTV set (inc. connected devices)
Other
device

2525
Chart shows the proportion of all media and comms time (B2) attributed to each grouped activity by age group.
*The average weekly minutes figure is among those who did any media and comms activity across their diary week and also includes simultaneous activity
35%
29%
45%
23%
3%
4%
4%
4%
8%
4%
6%
12%
3%
4%
2%
2% 5%
6%
4%
10%
4%
2%
2%
16%
14%
4%
19%
4%
19%
20%
20%
4%
5%
8%
4%
10%
10%
6%
4%
2%
3%
Adults 16+
Children 6-15
Primary 6-11
Secondary 11-15
TV Or Films On A TV Set TV Or Films On Another Device Short video clips
Radio On Radio Set Radio On Another Device Other Audio
Voice Comms Text Comms Games
Print Media Other Internet Media Other Non-internet Media
Base: Adults aged 16+ (x)
Source: Ofcom Digital Day 2016, Data book 1: C1 for main chart data and B1 for average weekly minutes
Proportion of media and comms time attributed to grouped activities, by age group
2665
2029
2274
3677
Average weekly mins.
of media & comms
activity*

2626
Proportion of media and comms attributed to grouped activities, by time of day
Among children aged 6-15
Base: Children aged 6-15 (476)
Source: Ofcom Digital Day 2016, Data book 6: B1
OTHER NON-INTERNET MEDIA
OTHER INTERNET MEDIA
PRINT MEDIA
GAMES
TEXT COMMS
VOICE COMMS
OTHER AUDIO
RADIO ON ANOTHER DEVICE
RADIO ON RADIO SET
OTHER VIDEO
TV OR FILMS ON ANOTHER DEVICE
TV OR FILMS ON A TV SET
6am 12pm
Midday
9am 3pm 6pm 9pm 12am
Midnight
Chart shows the proportion of all media and comms activity attributed to each grouped activity for each time slot across a week.
Note: the base of media and comms activity varies by time, and so relatively low activity during late night time periods should be treated with caution

2727
Watching

2828
77%
39%
28%
26%
26%
50%
45%
94%
85%
32%
22%
15%
35%
32%
33%
94%
Live TV
Recorded TV
Free On-Demand
Paid On-Demand
DVD/Bluray
Online video clips
Any video on-demand (VoD)
Any TV (Live/recorded/VoD)
2016
2014
Base: Children aged 6-15 - 2016 (476), 2014 (359)
Chart shows the proportion of children who recorded each activity (D) at any point across their diary week.
Arrows denote that changes are significant at the 99% level
Source: Ofcom Digital Day 2016, Data book 1: A1
Weekly reach of watching activities, 2016 vs. 2014
Among children aged 6-15

2929
80%
39%
29%
27%
31%
45%
45%
94%
73%
39%
26%
26%
19%
58%
45%
86%
Live TV
Recorded TV
Free On-Demand
Paid On-Demand
DVD/Bluray
Online video clips
Any video on-demand (VoD)
Any TV (Live/recorded/VoD)
Primary 6-11s
Secondary 11-15s
Base: Primary 6-11s (238), Secondary 11-15s (238)
Chart shows the proportion of children who recorded each activity (D) at any point across their diary week.
Stars denote that particular age group is significantly higher than the other
Source: Ofcom Digital Day 2016, Data book 1: A1
Weekly reach of watching activities, Primary 6-11s vs Secondary 11-15s

3030
77%
39%
28%
26%
26%
50%
45%
94%
91%
61%
42%
26%
28%
25%
53%
98%
Live TV
Recorded TV
Free On-Demand
Paid On-Demand
DVD/Bluray
Online video clips
Any video on-demand (VoD)
Any TV (Live/recorded/VoD)
Children 6-15
Adults 16+
Base: Children aged 6-15 (476), Adults aged 16+ (1512)
Chart shows the proportion of children and adults who recorded each activity (D) at any point across their diary week.
Source: Ofcom Digital Day 2016, Data book 1: A1
Weekly reach of watching activities, Children 6-15 vs. Adults 16+

3131
Base: Children aged 6-15 (476)
Weekly reach of watching activities, by time of day
Among children aged 6-15
Source: Ofcom Digital Day 2016, Data book 6: A2
Chart shows the proportion of children who recorded each watching activity (D) at each time slot across a week.
On-Demand is taken from a net figure of ‘paid’ and ‘free’ On-Demand.
0%
10%
20%
30%
40%
50%
60%
70%
80%
90%
100%
Peak reach
Live TV (35%)
Recorded TV (13%)
Online video clips (15%)
DVD/Blu-ray (8%)
On-Demand (16%)
6am 12pm
Midday
9am 3pm 6pm 9pm 12am
Midnight
3am

3232
63%
45%51%
36%
17%
12%
11%
14%
6%
6%
6%
6%
6%
10%8%
13%
4%
7%8%
5%
3%
20%16%
26%
Adults 16+ Children 6-15 Primary 6-11 Secondary 11-15
Base: Adults aged 16+ (1512), Children aged 6-15 (476), Primary 6-11 (238), Secondary 11-15 (238)
Chart shows the proportion of all watching time (B2) attributed to each activity (D) by age group.
*The average weekly minutes figure is among those who did any watching activity across their diary week and also includes simultaneous activity
Source: Ofcom Digital Day 2016, Data book 1: C2 for main chart data and B1 for average weekly minutes
Proportion of time spent watching attributed to activities, by age group
Among those who watched anything during their diary week
Live TV
Recorded TV
DVD/Blu-ray
Paid On-Demand
1795 1191 1176 1215Average weekly
minutes watching*
Free On-Demand
Online video clips

3333
Base: Children aged 6-15 (476)
Source: Ofcom Digital Day 2016, Data book 3: C34 for main chart data, A2 for weekly reach and B2 for average weekly minutes
Proportion of time spent watching attributed to activities, by screen
Among children who watched anything on specific device during their diary week
59%
6% 4%
5%
12%11%
8%
17%
12%
18%
9%
9%
3%
70%
81%
58%
TV set** Tablet Smartphone Computer
932 472 380 424
93% 33% 16% 15%
Average weekly minutes
watching on device*
Weekly reach of
watching on device
Live TV
Recorded TV
Free On-Demand
Online video clips
Paid On-Demand
Live TV
Paid On-DemandFree On-Demand
Online video clips
DVD/Blu-ray
Free On-Demand
Chart shows the proportion of all watching time (B2) on each device (E1) attributed to each activity (D) by age group.
*The average weekly minutes figure is among those who watched anything on each type of device across their diary week i.e. excludes zeros.
** TV set includes set-top boxes, DVD/Blu-ray player, streaming media players and games consoles
Online video clips
Paid On-Demand
Paid On-Demand
DVD/Blu-ray
Live TV
Online video clips

3434
Proportion of watching attributed to activities, by time of day
Among children aged 6-15
Base: Children aged 6-15 (476)
Source: Ofcom Digital Day 2016, Data book 6: C2
Chart shows the proportion of all watching attributed to each activity for each time slot across a week.
Note: the base of watching activity varies by time, and so relatively low activity during late night time periods should be treated with caution
Live
Other video*
6am 12pm
Midday
9am 3pm 6pm 9pm 12am
Midnight

3535
Listening

3636
37%
4%
23%
14%
13%
14%
39%
32%
42%
3%
26%
12%
18%
15%
43%
32%
Live Radio
On-Demand Radio
Personal digital audio
Streamed music
CD/Vinyl
Music videos
Any radio (live/on-demand)
Any digital music (personal/streamed)
2016
2014
Base: Children aged 6-15 - 2016 (476), 2014 (359)
Chart shows the proportion of adults who recorded each activity (D) at any point across their diary week.
Source: Ofcom Digital Day 2016, Data book 1: A1
Weekly reach of listening activities, 2016 vs. 2014
Among children aged 6-15

3737
42%
3%
26%
12%
18%
15%
43%
32%
77%
11%
33%
13%
30%
11%
78%
39%
Live Radio
On-Demand Radio
Personal digital audio
Streamed music
CD/Vinyl
Music videos
Any radio (live/on-demand)
Any digital music (personal/streamed)
Children 6-15
Adults 16+
Base: Children aged 6-15 (476), Adults aged 16+ (1512)
Chart shows the proportion of adults who recorded each activity (D) at any point across their diary week.
Source: Ofcom Digital Day 2016, Data book 1: A1
Weekly reach of listening activities, Children 6-15 vs. Adults 16+

3838
53%
1%
13%
4%
14%
16%
54%
46%
21%
3%
31%
28%
5%
12%
24%
76%
Live Radio
On-Demand Radio
Personal digital audio
Streamed music
CD/Vinyl
Music videos
Any radio (live/on-demand)
Any digital music (personal/streamed)
Primary 6-11
Secondary 11-15
Base: Primary 6-11s (238), Secondary 11-15s (238)
Chart shows the proportion of adults who recorded each activity (D) at any point across their diary week.
Source: Ofcom Digital Day 2016, Data book 1: A1
Weekly reach of listening activities, Primary 6-11s vs. Secondary 11-15s

3939
Base: Children aged 6-15 (476)
Chart shows the proportion of adults who recorded each listening activity (D) at each time slot across a week.
Weekly reach of listening activities, by time of day
Among children aged 6-15
Source: Ofcom Digital Day 2016, Data book 6: A2
0%
10%
20%
30%
40%
50%
60%
70%
80%
90%
100%
Peak reach
Live or on-demand
radio (11%)
Streamed or personal
digital audio (10%)
6am 12pm
Midday
9am 3pm 6pm 9pm 12am
Midnight
3am

4040
Base: Adults aged 16+ (1512), Children aged 6-15 (476), Primary 6-11 (238), Secondary 11-15 (238)
Chart shows the proportion of all listening time (B2) attributed to each activity (D) by age group.
*The average weekly minutes figure is among those who did any listening activity across their diary week and also includes simultaneous activity
Source: Ofcom Digital Day 2016, Data book 1: C2 for main chart data and B1 for average weekly minutes
Proportion of time spent listening attributed to activities, by age group
Among those who listened to anything during their diary week
71%
35%
53%
21%
3%
2%
1%
3%
10%
23%
13%
31%
7%
18% 4% 28%
6%
8%
14%
5%
3%
14% 16%12%
Adults 16+ Children 6-15 Primary 6-11 Secondary 11-15
Live Radio
Personal digital
Streamed audio
CD/Vinyl
Music videos
On-Demand radio
861 416 320 533Average weekly
minutes listening*

4141
100%
3%
25%32%
5%
17%
44% 10%
22%
35%
23%
65%
13%7%
Radio set Smartphone Stereo system Tablet
Base: Adults aged 16+ who listened to anything on each type of device
Chart shows the proportion of all listening time (B2) on each device (E1) attributed to each activity (D) by age group.
* The average weekly minutes figure is among those who listened to anything on each type of device across their diary week i.e. excludes zeros.
Source: Ofcom Digital Day 2016, Data book 3: C34 for main chart data, A2 for weekly reach and B2 for average weekly minutes
Proportion of time spent listening attributed to activities, by device
Among children who listened to anything on specific device during their diary week
32% 23% 15% 12%
CD/Vinyl
On-demand radio
Live Radio
Live Radio
Live RadioLive Radio
Personal digital
On-demand radio
Personal digital
Music videosMusic videos
Streamed audio
Streamed audio
Weekly reach of
listening on device
Average weekly minutes
listening on device*
Personal digital
32% 23% 15% 12%
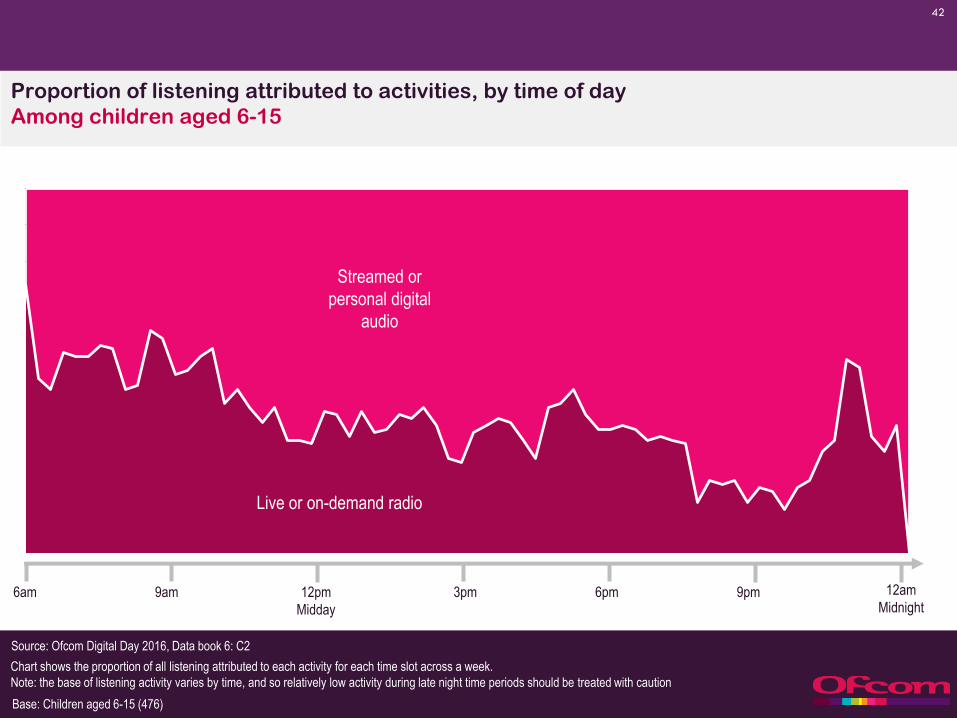
4242
Proportion of listening attributed to activities, by time of day
Among children aged 6-15
Base: Children aged 6-15 (476)
Source: Ofcom Digital Day 2016, Data book 6: C2
Chart shows the proportion of all listening attributed to each activity for each time slot across a week.
Note: the base of listening activity varies by time, and so relatively low activity during late night time periods should be treated with caution
6am 12pm
Midday
9am 3pm 6pm 9pm 12am
Midnight
Live or on-demand radio
Streamed or
personal digital
audio

4343
Communicating

4444
24%
23%
7%
27%
13%
15%
12%
24%
45%
23%
19%
4%
26%
10%
18%
9%
23%
43%
Social networking
Instant messaging
Emailing
Texting
Photo or video messaging
Phone calls
Video calls
Any voice comms
Any text comms
2016
2014
Base: Children aged 6-15 - 2016 (476), 2014 (359)
Chart shows the proportion of adults who recorded each activity (D) at any point across their diary week.
Source: Ofcom Digital Day 2016, Data book 1: A1
Weekly reach of communication activities, 2016 vs. 2014
Among children aged 6-15

4545
24%
23%
7%
27%
13%
15%
12%
24%
45%
49%
43%
70%
63%
21%
83%
15%
85%
87%
Social networking
Instant messaging
Emailing
Texting
Photo or video messaging
Phone calls
Video calls
Any voice comms
Any text comms
Children 6-15
Adults 16+
Base: Children aged 6-15 (476), Adults aged 16+ (1512)
Chart shows the proportion of adults who recorded each activity (D) at any point across their diary week.
Source: Ofcom Digital Day 2016, Data book 1: A1
Weekly reach of communication activities, Children 6-15 vs. Adults 16+

4646
6%
10%
1%
9%
5%
10%
7%
16%
20%
53%
43%
15%
55%
24%
23%
20%
37%
86%
Social networking
Instant messaging
Emailing
Texting
Photo or video messaging
Phone calls
Video calls
Any voice comms
Any text comms
Primary 6-11
Secondary 11-15
Base: Primary 6-11s (238), Secondary 11-15s (238)
Chart shows the proportion of adults who recorded each activity (D) at any point across their diary week.
Source: Ofcom Digital Day 2016, Data book 1: A1
Weekly reach of communication activities, Primary 6-11s vs. Secondary 11-15s
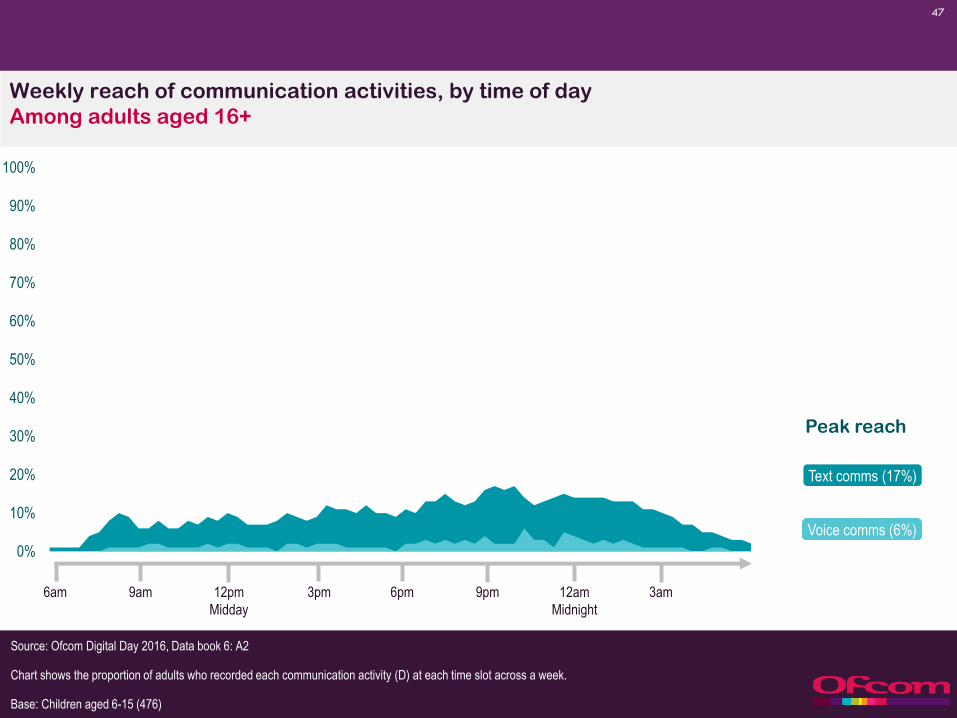
4747
Base: Children aged 6-15 (476)
Chart shows the proportion of adults who recorded each communication activity (D) at each time slot across a week.
Source: Ofcom Digital Day 2016, Data book 6: A2
Weekly reach of communication activities, by time of day
Among adults aged 16+
0%
10%
20%
30%
40%
50%
60%
70%
80%
90%
100%
Text comms (17%)
Peak reach
Voice comms (6%)
6am 12pm
Midday
9am 3pm 6pm 9pm 12am
Midnight
3am

4848
Base: Adults aged 16+ (1512), Children aged 6-15 (476), Primary 6-11 (238), Secondary 11-15 (238)
Chart shows the proportion of all communication time (B2) attributed to each activity (D) by age group.
*The average weekly minutes figure is among those who did any communication activity across their diary week and also includes simultaneous activity
Source: Ofcom Digital Day 2016, Data book 1: C2 for main chart data and B1 for average weekly minutes
Proportion of time spent communicating attributed to activities, by age group
Among those who communicated during their diary week
18%
31%27%
31%
17%
26%
24%
27%
34%
2%
0%
2%
11%
14%
11%
15%
2% 13%
9%
14%
18%2%
4%
1%
2%12%
25%
10%
Adults 16+ Children 6-15 Primary 6-11 Secondary 11-15
Social networking
Instant Messaging
Texting
Phone calls
Video calls
Video messaging
933 843 366 1102Average weekly
minutes communicating*

4949
Base: Children aged 6-15 (476)
Source: Ofcom Digital Day 2016, Data book 3: C34 for main chart data, A2 for weekly reach and B2 for average weekly minutes
Proportion of time spent communicating attributed to activities, by device
Among adults who communicated using specific device during their diary week
32% 29%
12%
28%
25%
13%
2%
4%
18%
2%
14%
14%
2%3%
30%
70%
Smartphone Tablet Computer
39% 15% 6%
Social networking
Instant Messaging
Video calls
Photo messaging
Emailing
Phone calls
Weekly reach of
communicating on device
863 382 450Average weekly minutes
communicating on device*
Chart shows the proportion of all communication time (B2) on each device (E1) attributed to each activity (D) by age group.
* The average weekly minutes figure is among those who communicated on each type of device across their diary week i.e. excludes zeros.
Texting
Social networking
Instant Messaging
Video calls
Photo messaging
Texting
Video calls
Emailing
Instant Messaging
Social networking

5050
Proportion of communicating attributed to activities, by time of day
Among children aged 6-15
Base: Children aged 6-15 (476)
Source: Ofcom Digital Day 2016, Data book 6: C2A
Chart shows the proportion of all communicating attributed to each activity for each time slot across a week.
Note: the base of communicating activity varies by time, and so relatively low activity during late night time periods should be treated with caution
Text comms
Voice comms
6am 12pm
Midday
9am 3pm 6pm 9pm 12am
Midnight

5151
Reading/browsing/using

5252
5%
3%
3%
5%
54%
5%
37%
30%
5%
7%
2%
3%
48%
6%
35%
24%
Newspapers (print or digital)
Magazines (print or digital)
Other online news
Sports news/updates
Books (print or digital)
Online shopping/ticketing
Other websites or apps
Other activities
2016
2014
Base: Children aged 6-15 - 2016 (476), 2014 (359)
Chart shows the proportion of children who recorded each activity (D) at any point across their diary week.
Source: Ofcom Digital Day 2016, Data book 1: A1
Weekly reach of reading/browsing/using activities, 2016 vs. 2014
Among children aged 6-15

5353
5%
3%
3%
5%
54%
5%
37%
30%
50%
27%
28%
16%
46%
38%
61%
46%
Newspapers (print or digital)
Magazines (print or digital)
Other online news
Sports news/updates
Books (print or digital)
Online shopping/ticketing
Other websites or apps
Other activities
Children 6-15
Adults 16+
Base: Children aged 6-15 (476), Adults aged 16+ (1512)
Chart shows the proportion of adults and children who recorded each activity (D) at any point across their diary week.
Source: Ofcom Digital Day 2016, Data book 1: A1
Weekly reach of reading/browsing/using activities, Children 6-15 vs. Adults 16+

5454
1%
3%
2%
3%
62%
3%
30%
26%
10%
4%
3%
9%
40%
8%
50%
36%
Newspapers (print or digital)
Magazines (print or digital)
Other online news
Sports news/updates
Books (print or digital)
Online shopping/ticketing
Other websites or apps
Other activities
Primary 6-11
Secondary 11-15
Base: Primary 6-11s (238), Secondary 11-15s (238)
Chart shows the proportion of children who recorded each activity (D) at any point across their diary week.
Source: Ofcom Digital Day 2016, Data book 1: A1
Weekly reach of reading/browsing/using activities, Primary 6-11s vs. Secondary
11-15s

5555
Base: Children aged 6-15 (476)
Chart shows the proportion of children who recorded any reading/browsing/using activity (Net) (D) at each time slot across a week.
Source: Ofcom Digital Day 2016, Data book 6: A2
Weekly reach of any reading/browsing/using, by time of day
Among children aged 6-15
0%
10%
20%
30%
40%
50%
60%
70%
80%
90%
100%
Peak reach
6am 12pm
Midday
9am 3pm 6pm 9pm 12am
Midnight
3am
Internet media (21%)
Other non-Internet media (6%)
Print media (1%)

5656
13%
1% 1% 2%
3%
1% 1% 1%
6%
3% 3% 2%
17%
42%
54%
28%
4%
1%
1%
2%
28%
29%
21%
38%
29%23% 20%
27%
Adults 16+ Children 6-15 Primary 6-11 Secondary 11-15
Base: Adults aged 16+ (1512), Children aged 6-15 (476), Primary 6-11 (238), Secondary 11-15 (238)
Chart shows the proportion of all reading/browsing/using time (B2) attributed to each activity (D) by age group.
*The average weekly minutes figure is among those who did any reading… activity across their diary week and also includes simultaneous activity
Source: Ofcom Digital Day 2016, Data book 1: C2
Proportion of time spent reading/browsing/using attributed to activities, by age group
Among adults who read… during their diary week
Newspaper
Other news & sport
Magazine
Books
Other sites or apps
Other activities
Shopping/ ticketing
Average weekly
minutes reading…*780 441 370 554

5757
Base: Adults aged 16+ who red/browsed/used at all on each type of device
Chart shows the proportion of all reading/browsing/using time (B2) on each device (E1) attributed to each activity (D) by age group.
* The average weekly minutes figure is among those who read…. on each type of device across their diary week i.e. excludes zeros.
Source: Ofcom Digital Day 2016, Data book 3: C34 for main chart data, A2 for weekly reach and B2 for average weekly minutes
Proportion of time spent reading/browsing/using attributed to activities, by device
Among adults who read… on specific device during their diary week
10% 7%
3%5%
97%
17%
4%
3%
4%
35%
56% 75%
58%
20%
9%
Print Computer Tablet Smartphone
51% 34% 24% 16%
Books
Other activities
Shopping/ ticketing
Other activities
Other activities
Other sites or apps
Other sites or apps Other sites or apps
Shopping/ ticketing
Newspapers Newspapers
Other news & sportOther news & sport
Books
Weekly reach of
reading… on device
Books
Average weekly minutes
reading… on device 268 269 207 286

5858
Proportion of reading/browsing/using attributed to activities, by time of day
Among children aged 6-15
Base: Children aged 6-15 (476)
Source: Ofcom Digital Day 2016, Data book 6: C2A
Chart shows the proportion of all reading/browsing/using attributed to each activity for each time slot across a week.
Note: the base of reading… activity varies by time, and so relatively low activity during late night time periods should be treated with caution
Internet media
Other non-Internet media
Print media
6am 12pm
Midday
9am 3pm 6pm 9pm 12am
Midnight

5959
Devices

6060
Base: Children aged 6-15 (476)
Chart shows the proportion of children who recorded using each device (E1) at any point across their diary week.
* TV set includes all connected devices (games consoles, set top boxes, DVD/Blu-ray player and streaming media players)
Source: Ofcom Digital Day 2016, Data book 3: A1
Weekly reach of devices
Among children aged 6-15
93%
45%
15%
19%
15%
51%
3%
4%
66%
30%
31%
2%
19%
51%
32%
52%
53%
TV set*
Games console
Analogue radio
Digital radio
Stereo system
Smartphone
Standard mobile
Landline
Tablet
Desktop
Laptop
e-reader
Other device
Any radio set (Analogue/Digital)
Any mobile phone (Smartphone/standard)
Any Computer (Desktop/Laptop)

6161
Base: Primary 6-11s (238), Secondary 11-15s (238)
Chart shows the proportion of 6-11s and 11-15s who recorded using each device (E1) at any point across their diary week.
Source: Ofcom Digital Day 2016, Data book 3: A5 and A10
Weekly reach of devices, 6-11s vs. 11-15s
96%
44%
16%20%
17%
29%
2% 4%
72%
30%26%
2%
20%
58%
87%
45%
14%17%
13%
87%
5% 3%
56%
31%
38%
2%
17%
38%
Primary 6-11 Secondary 11-15

6262
Base: Children aged 6-15 (476), Adults aged 16+ (1512)
Chart shows the proportion of 6-11s and adults who recorded using each device (E1) at any point across their diary week.
Source: Ofcom Digital Day 2016, Data book 3: A5 and A10
Weekly reach of devices, Children 6-15 vs. Adults 16+
93%
45%
15%19%
15%
51%
3% 4%
66%
30% 31%
2%
19%
51%
96%
18%
47%44%
32%
70%
26%
60%
42%47%
52%
8%
17%
56%
Children 6-15 Adults 16+

6363
Base: Children aged 6-15 (476)
Chart shows the proportion of children who recorded using each device (E) at each time slot across a week.
Figures for radio set, computer and mobile are net figures.
Source: Ofcom Digital Day 2016, Data book 7: A1
Weekly reach of devices, by time of day
Among children aged 6-15
0%
10%
20%
30%
40%
50%
60%
70%
80%
90%
100%
TV set (53%)
Computer (15%)
Mobile (22%)
Radio set (9%)
Games Console (22%)
Print (13%)
Tablet (25%)
6am 9am 3pm 6pm 9pm 3am12pm
Midday
12am
Midnight

6464
02:36
02:09
01:51
01:31
01:12
01:00
00:43
00:39
00:38
00:27
00:27
00:26
00:16
00:03
Smartphone
TV set (inc set top box)
Games console
Tablet
Laptop
Desktop
Other device
Digital radio
Analogue radio
e-reader
Stereo system
Standard mobile
Landline
Base: Children aged 6-15 (476)
Chart shows the mean number of minutes recorded per day for each device (E) among those who did each one at any point across their diary week i.e. excludes
zeros.
Source: Ofcom Digital Day 2016, Data book 1: B4hm
Average time spent on devices per day
Among all children who used device during diary week (exc. Zeros)

6565
Chart shows the mean number of minutes recorded per day for each device among all adults, regardless of whether they did it at all
i.e. includes zeros
01:59
01:20
00:59
00:49
00:22
00:19
00:18
00:08
00:07
00:04
00:04
00:00
00:00
00:00
TV set (inc set top box)
Smartphone
Tablet
Games console
Laptop
Desktop
Other device
Digital radio
Analogue radio
Stereo system
e-reader
Standard mobile
Landline
Base: Children aged 6-15 (476)
Source: Ofcom Digital Day 2016, Data book 3: B11(2)hm
Average time spent on devices per day
Among all children aged 6-15 (inc. Zeros)

6666
hart shows the proportion of total device (including print) time (B2) attributed to each specific device (E) by age group.
*The average weekly minutes figure is among those who used any device or print across their diary week and also includes simultaneous activity
36%
30%
41%
20%
12%
3%
4%
2%
2%
13%
11%
14%
15%
20%
6%
35%
4%
15%
18%
13%
22%
10%
10%
10%
3%
2%
3%
3%
4%
5%
7%
3%
Adults 16+
Children 6-15
Primary 6-11
Secondary 11-15
Base: Adults aged 16+ (1512), Children aged 6-15 (476), Primary 6-11 (238), Secondary 11-15 (238)
Proportion of total device time attributed to specific devices, by age group
3585
2242
2759
4567
Average weekly minutes
of device activity*
Source: Ofcom Digital Day 2016, Data book 2: C1 for main chart data and B1 for weekly minutes of device activity
Radio set Games
Console
TabletMobile Computer PrintTV set (inc. connected devices)
Other
device

6767
Base: Children aged 6-15 (476)
Chart shows the proportion of all media and comms activity attributed to each device for each time slot across a week.
Note: the base of media and comms activity varies by time, and so relatively low activity during late night time periods should be treated with caution
Source: Ofcom Digital Day 2016, Data book 7: B2
Proportion of total device time attributed to specific devices, by time of day
Among children aged 6-15
6am 12pm
Midday
9am 3pm 6pm 9pm 12am
Midnight

6868
Base: Children aged 6-15 (476), Adults aged 16+ (1512)
Chart shows the proportion of all time using a TV set (E1) attributed to each activity (D)
* Includes games console (as connected to a TV)
Source: Ofcom Digital Day 2016, Data book 3: C1
Proportion of time on a TV set (inc. all connected devices) attributed to activities,
, Children 6-15 vs. Adults 16+
43%
24%
12%
6%
6%
4%
2%
64%
3%
18%
4%
4%
5%
Live TV
Video games
Recorded TV
Paid On-Demand
DVD/Bluray
Free On-Demand
Online video clips
Children 6-15
Adults 16+

6969
Base: Primary 6-11s (238), Secondary 11-15s (238)
Chart shows the proportion of all time using a TV set (E1) attributed to each activity (D)
* Excludes playing video games on a games console (which is more than likely plugged into a TV)
Source: Ofcom Digital Day 2016, Data book 3: C1
Proportion of time on a TV set (inc. all connected devices) attributed to activities,
Primary 6-11 vs. Secondary 11-15
49%
17%
11%
8%
5%
4%
3%
34%
33%
13%
4%
7%
4%
2%
Live TV
Video games
Recorded TV
DVD/Bluray
Paid On-Demand
Free On-Demand
Online video clips
Primary 6-11
Secondary 11-15

7070
Base: Children aged 6-15 (476), Adults aged 16+ (1512)
Chart shows the proportion of all time using a smartphone E1) attributed to each activity (D)
Source: Ofcom Digital Day 2016, Data book 3: C1
Proportion of time on a smartphone attributed to activities, Children 6-15 vs. Adults 16+
19%
17%
11%
9%
9%
6%
6%
5%
5%
2%
2%
15%
19%
13%
2%
2%
6%
11%
4%
5%
1%
Social networking
Instant messaging
Texting
Online video clips
Photo or video messaging
Personal digital audio
Other websites or apps
Streamed music
Video games
Music videos
Video calls
Children 6-15
Adults 16+

7171
Base: Primary 6-11s (238), Secondary 11-15s (238)
Chart shows the proportion of all time using a smartphone E1) attributed to each activity (D)
Source: Ofcom Digital Day 2016, Data book 3: C1
Proportion of time on a smartphone attributed to activities,
Primary 6-11 vs. Secondary 11-15
20%
16%
14%
9%
9%
7%
5%
4%
3%
3%
3%
2%
19%
17%
4%
9%
11%
6%
9%
7%
1%
2%
2%
Social networking
Instant messaging
Video games
Online video clips
Texting
Personal digital audio
Photo or video messaging
Other websites or apps
Live TV
Phone calls
Video calls
Music videos
Primary 6-11
Secondary 11-15

7272
Base: Children aged 6-15 (476), Adults aged 16+ (1512)
Chart shows the proportion of all time using a tablet (E1) attributed to each activity (D)
Source: Ofcom Digital Day 2016, Data book 3: C1
Proportion of time spent on a tablet attributed to activities, Children 6-15 vs. Adults 16+
30%
26%
7%
6%
4%
4%
4%
3%
3%
3%
2%
2%
2%
20%
4%
14%
5%
5%
9%
1%
3%
3%
8%
3%
Video games
Online video clips
Other websites or apps
Paid On-Demand
Free On-Demand
Social networking
Video calls
Streamed music
Music videos
Instant messaging
Photo or video messaging
Books (print or digital)
Other activities
Children 6-15
Adults 16+

7373
Base: Primary 6-11s (238), Secondary 11-15s (238)
Chart shows the proportion of all time using a tablet (E1) attributed to each activity (D)
Source: Ofcom Digital Day 2016, Data book 3: C1
Proportion of time spent on a tablet attributed to activities,
Primary 6-11 vs. Secondary 11-15
41%
27%
7%
6%
4%
3%
3%
2%
14%
23%
7%
7%
5%
1%
2%
4%
Video games
Online video clips
Other websites or apps
Paid On-Demand
Free On-Demand
Books (print or digital)
Other activities
Music videos
Primary 6-11
Secondary 11-15

7474
Base: Children aged 6-15 (476), Adults aged 16+ (1512)
Chart shows the proportion of all time using a computer (E1) attributed to each activity (D)
Source: Ofcom Digital Day 2016, Data book 3: C1
Proportion of time spent on a computer attributed to activities
29%
19%
13%
11%
7%
4%
3%
3%
2%
2%
7%
23%
2%
14%
1%
3%
2%
2%
1%
2%
Video games
Other activities
Online video clips
Other websites or apps
Video calls
Paid On-Demand
Free On-Demand
Music videos
DVD/Bluray
Personal digital audio
Children 6-15
Adults 16+

7575
Base: Primary 6-11s (238), Secondary 11-15s (238)
Chart shows the proportion of all time using a computer (E1) attributed to each activity (D)
Source: Ofcom Digital Day 2016, Data book 3: C1
Proportion of time spent on a computer attributed to activities
39%
13%
13%
11%
7%
4%
4%
3%
3%
1%
19%
14%
25%
12%
6%
5%
2%
2%
1%
2%
2%
2%
2%
Video games
Online video clips
Other activities
Other websites or apps
Video calls
Paid On-Demand
Music videos
Free On-Demand
DVD/Bluray
Personal digital audio
Streamed music
Social networking
Instant messaging
Primary 6-11s
Secondary 11-15s

7676
Social Media
…through a Social
Networking site e.g.
Facebook, Twitter
(excluding checking
updates)
• Short online video clips on e.g. YouTube, News sites
• Streamed online music
• Music videos
• Games
• Other online news
• Sports news /updates
• Other websites or apps
• Other activities
Through either:YouTube
Linked-in
Other social media site
COMMUNICATION MEDIA CONSUMPTION

7777
Base: Adults aged 16+ (1512), Children aged 6-15 (476), Primary 6-11 (238), Secondary 11-15 (238)
Chart shows the proportion of adults and children who recorded communicating through a social networking site (D) or using a social media site for certain types of
media activity (E2) across their diary week. Proportion of media and comms time is calculated from the durations of these activities (B2).
Source: Ofcom Digital Day 2016, Data book 1: A1 for weekly reach, B4(2) for average time spent per day and C1 for proportion of all media and comms time
Social media use, by age group
64% 65%
51%
88%
8%
16%10%
21%
Adults 16+ Children 6-15 Primary 6-11 Secondary 11-15
Weekly reach Proportion of all media and comms time
An average of 58 mins a day was spent on social media across all children
This rose to 88 mins among those who used it at all over their diary week
Average daily minutes
on social media*1h 16m 1h 35m 1h 5m 2h 3m

7878
50%
45%
17%
59%
34%
11%
15%
9%
13%
32%
51%
22%
3%
9%
16%
6%
3%
2%
4%
Adults 16+
Children 6-15
Primary 6-11
Secondary 11-15
Mobile phone Computer Tablet TV set (inc. connected devices) Other device
Base: Adults aged 16+ (1512), Children aged 6-15 (476), Primary 6-11 (238), Secondary 11-15 (238)
Chart shows the proportion of all social media time (B2) attributed to each activity by age group.
*The average weekly minutes figure is among those who used social media at all across their diary week (net figure)
Source: Ofcom Digital Day 2016, Data book 1: C1 for the main chart data, and B1 for average weekly minutes
Proportion of social media time attributed to devices, by age group
2h 3m
1h 5m
1h 35m
1h 16m
Average daily minutes
on social media*
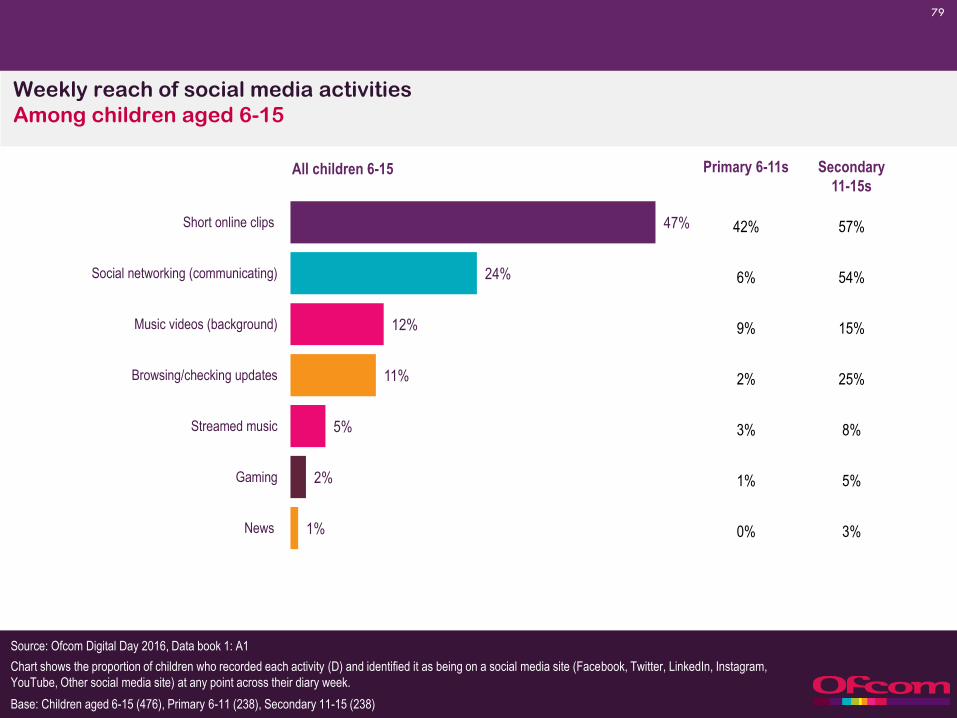
7979
47%
24%
12%
11%
5%
2%
1%
Short online clips
Social networking (communicating)
Music videos (background)
Browsing/checking updates
Streamed music
Gaming
News
Base: Children aged 6-15 (476), Primary 6-11 (238), Secondary 11-15 (238)
Chart shows the proportion of children who recorded each activity (D) and identified it as being on a social media site (Facebook, Twitter, LinkedIn, Instagram,
YouTube, Other social media site) at any point across their diary week.
Source: Ofcom Digital Day 2016, Data book 1: A1
Weekly reach of social media activities
Among children aged 6-15
Primary 6-11s
42%
6%
9%
2%
3%
1%
0%
Secondary
11-15s
57%
54%
15%
25%
8%
5%
3%
All children 6-15

8080
Base: Adults aged 16+ (1512), Children aged 6-15 (476), Primary 6-11 (238), Secondary 11-15 (238)
Source: Ofcom Digital Day 2016, Data book 1: C2 for the main chart data, and B1 for average weekly minutes
Proportion of social media time attributed to activities, by age
Among children who used social media at all during diary week
Chart shows the proportion of all social media time (B2) attributed to each activity by age group.
*The average weekly minutes figure is among those who used social media at all across their diary week (net figure)
**’Other’ includes streamed music, sports news/updates and other online news
46%
31%
13%
40%
27%
7%
1%
10%
13%
49%
73%
37%
6%
7%
11%
6%
5%
1%
4%
4%
2%
2%
2%
Adults 16+
Children 6-15
Primary 6-11
Secondary 11-15
Communicating Browsing/checking updates Short online clips Music videos Gaming Other**
2h 3m
1h 5m
1h 35m
1h 16m
Average daily minutes
on social media*