digest of south african energy statistics … · digest of south african energy statistics 2006 ......
TRANSCRIPT

DDIIGGEESSTT OOFF SSOOUUTTHH AAFFRRIICCAANN EENNEERRGGYY SSTTAATTIISSTTIICCSS
2006
Directorate: Energy Planning and Development

DEPARTMENT: MINERALS AND ENERGY REPUBLIC OF SOUTH AFRICA
Directorate: Energy Planning and Development
DIGEST OF
SOUTH AFRICAN
ENERGY STATISTICS
2006
Issued free and obtainable form the Director: Energy Planning and Development Mineralia Centre,
234 Visagie Street, Pretoria, Private Bag X59, Pretoria, 0001 Telephone: (012) 317 8662, Telefax: (012) 322 3417

Editing:
Johan Van Wyk, Janneke Weidema, Ntuthuzelo Fikela (Internal)
Published by: Department of Minerals and Energy Private Bag X59 Pretoria 0001 Tel: (012) 317-8000 Fax: (012) 322-8570 Website: www.dme.gov.za E-mail: [email protected] (Mr. Ntuthuzelo Fikela) E-mail: [email protected] (Mr. Johan van Wyk ) Copyright © 2002, Department of Minerals and Energy ISBN: 0-9584376-4-5

FOREWORD Basic energy information is vital to provide a reliable picture of the energy
situation in South Africa especially with the liberalisation and transformation of
our minerals and energy sectors in South Africa.
As far back as 1992 the DME initiated the collection of energy statistics in
order to develop an Energy Balance for South Africa. The Energy Balance
presents an overview of the energy flows for a specific time period. It
shows, inter alia, the production, transformation and final consumption
of all forms of energy for a given geographical area and a given period
of time, with quantities expressed in terms of a single accounting unit for
purposes of comparison and aggregation.
It gives me pleasure to introduce the fourth issue of the Digest of South
African Energy Statistics, 2006.
The digest is published by the Directorate: Energy Planning and
Development, formerly known as Database and Administration. The
Directorate is responsible for the collection, analysis of energy statistics and
the compilation of Energy Balances.
However a number of challenges face the Department of Minerals and Energy
in terms of the collection, verification and publication of energy statistics.
These relate to the fact that the supply of energy data is voluntary, capacity
constraints, different formats for collecting data etc. To address some of these
issues the DME will be making the provision of energy data mandatory
through the Energy Bill, developing a methodology manual for the collection of
energy data and establishing an Energy Advisory Statistics Committee to
review and verify the data.
The Digest is now published bi-annually instead of tri-annually, as was the
case in the past. This is to ensure that readers get updated information in

time. This age, our age is referred to as the information age. This means that
without reliable and updated information we are unable to make informed and
accurate decisions. It is for this reason that the Department of Minerals and
Energy has deemed it necessary to increase the frequency of publication.
Energy is often referred to as one of the drivers of development. Therefore
investors and policy makers need information on various aspects of energy in
order to plan. This publication carries such information. We have tried and I
hope managed to compile statistics of our various energy resources, energy
supply as well as demand. It is my belief that, this will contribute towards
lowering the cost of doing business in the country, hence making South Africa
an attractive destination for investment.
As a Department we seek to continually improve energy governance and
provide the necessary infrastructure for the integrated energy planning. This
Digest forms part of this effort and I hope it will become a standard work of
reference among energy professionals in South Africa and abroad.
Finally, I would like to thank and congratulate all the staff in the Directorate:
Energy Planning and Development for the hard and successful work that went
into the compilation of this publication.
Advocate Sandile Nogxina
Director-General

Contents Section Page Introduction 1 1. Overview 1 2. Energy Balances 7 3. National Energy Consumption 13 4. Coal 21 5. Oil 30 6. Electricity 38 7. Gas 46 8. Renewables 50 9. Prices 52 10. Economic Data 56 11. Useful Addresses 53 12. Carolific Values and Conversion Factors 59

Digest of South African Energy Statistics - 2006
1
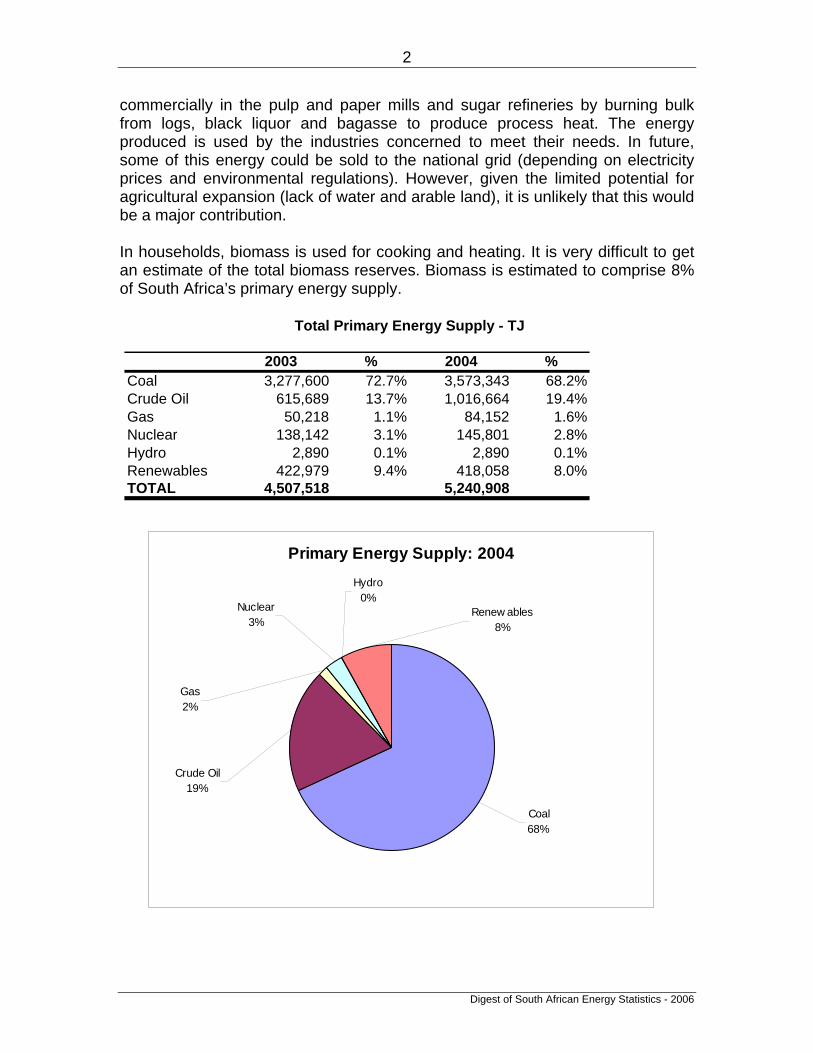
Introduction The challenges presented by data collection are legend among statisticians. This publication has faced its own challenges in this regard. It has been necessary to meld together data collected by two different organizations and by the Department of Minerals and Energy itself during the period 1992 to 2002. Although all organisations used supply side figures (i.e. sales data) to measure energy consumption, they used slightly different data collection methodologies. They also used different assumptions when deciding how to allocate energy consumption to different sectors. This last is a problem particularly associated with using supply side data to measure energy consumption. The result is that for example certain of the time series might not be as smooth as expected. In particular, estimates for the use of biomass as a source of primary energy, can vary greatly, depending on assumptions made. These factors should be taken into account when interpreting the data in this publication. Section 1 Overview South Africa has a well-developed energy supply and production system. The country is well endowed with large resources of coal. Natural gas and crude oil production is very limited and consequently the bulk of our crude oil is imported. Uranium reserves are large. Renewable energy plays a limited but plays a significant role, particularly large hydroelectric power generation. However the country generally has a low rainfall, which limits the exploitation of this form of energy. South Africa’s abundant sunshine is only beginning to be tapped in more remote areas for electricity generation for domestic and institutional application. Wind energy is a potential source of commercial energy in some parts, but like other renewable energy technologies it struggles to match the lower costs basis of conventional energy, in particular our cheap coal. With the setting of renewable energy targets and with carbon trading under the Kyoto protocol, the role of renewable energy is expected to expand. Primary Energy Supply The South African energy sector is dominated by coal (see the graph below), which is abundant and relatively cheap by international standards. Most of South Africa’s liquid fuel requirements are imported in the form of crude oil. Approximately 35% is sourced from coal through Sasol and 100% of the natural gas production from PetroSA is converted into liquid fuels, supplying about 7% of liquid fuel requirements. Renewable energy comprises biomass and natural processes that are replenished and can be used as an energy source. Biomass is used
Digest of South African Energy Statistics - 2006
2
commercially in the pulp and paper mills and sugar refineries by burning bulk from logs, black liquor and bagasse to produce process heat. The energy produced is used by the industries concerned to meet their needs. In future, some of this energy could be sold to the national grid (depending on electricity prices and environmental regulations). However, given the limited potential for agricultural expansion (lack of water and arable land), it is unlikely that this would be a major contribution. In households, biomass is used for cooking and heating. It is very difficult to get an estimate of the total biomass reserves. Biomass is estimated to comprise 8% of South Africa’s primary energy supply.
Primary Energy Supply: 2004
Coal 68%
Hydro0%
Nuclear3%
Crude Oil19%
Gas2%
Renew ables8%
2003 % 2004 %Coal 3,277,600 72.7% 3,573,343 68.2%Crude Oil 615,689 13.7% 1,016,664 19.4%Gas 50,218 1.1% 84,152 1.6%Nuclear 138,142 3.1% 145,801 2.8%Hydro 2,890 0.1% 2,890 0.1%Renewables 422,979 9.4% 418,058 8.0%TOTAL 4,507,518 5,240,908
Total Primary Energy Supply - TJ

Digest of South African Energy Statistics - 2006
3
Primary Energy Supply: 2003
Renew ables9%
Crude Oil14%
Nuclear3%
Hydro0%
Gas1%
Coal 73%
1992 1993 1994 1995 1996 1997 1998 1999 2000 2001 2002 2003 2004Coal 2,990,691 3,028,745 3,117,230 3,243,737 3,299,787 3,370,254 3,268,198 3,413,499 3,425,725 3,065,619 2,961,026 3,277,600 3,573,343Crude Oil 414,946 334,047 428,321 459,980 376,059 450,863 933,682 764,067 420,746 452,895 1,018,769 615,689 1,016,664Gas 11,969 71,814 71,814 71,814 71,814 71,814 53,983 70,628 65,024 84,478 83,764 50,218 84,152Nuclear 101,324 79,145 105,785 123,284 128,455 137,967 148,375 140,040 141,927 116,935 130,811 138,142 145,801Hydro 2,707 526 3,866 1,904 4,748 7,531 5,742 2,614 4,835 7,420 8,485 2,890 2,890Renewables 414,000 419,000 433,432 408,739 408,739 408,739 237,400 237,400 237,400 237,400 426,467 422,979 418,058
TOTAL 3,935,637 3,933,277 4,160,448 4,309,458 4,289,602 4,447,168 4,647,379 4,628,248 4,295,657 3,964,746 4,629,322 4,507,518 5,240,908
Total Primary Energy Supply - TJ

Digest of South African Energy Statistics - 2006
4
Final Sectoral Consumption The three major energy-consuming sectors are industry, residential and transport. In 2002 they accounted together for 80,4% whilst in 2003 and 2004 they accounted for 79,4% and 79,6% respectively of final energy demand. This shows a decrease of energy consumption from these three major energy –consuming sectors combined together of 1% in 2003 and 0.6% in 2004. The value for residential is boosted by the inclusion of estimated biomass consumption figures. The category “non-energy use” is for energy carriers such as petroleum product solvents, lubricants and bitumen, which are not utilised for their energy properties.
Sector 2003 % 2004 %Industry 854,793 34.5% 983,167 36.2%Commerce 162,272 6.5% 183,359 6.7%Residential 455,733 18.4% 485,692 17.9%Mining 180,699 7.3% 190,274 7.0%Transport 656,520 26.5% 698,552 25.7%Agriculture 74,998 3.0% 77,988 2.9%Non-specified(other) 64,574 2.6% 78,830 2.9%Non-energy use 31,000 1.2% 20,000 0.7%Total 2,480,589 2,717,860Source: National Energy Balances
Final Sectoral Consumption of Energy-TJ
Final Sectoral Consumption of Energy-2004
Agriculture2.9%
Non-specif ied(other)2.9% Non-energy use
0.7%
Mining7.0%
Residential17.9%
Commerce6.7%
Industry36.2%
Transport25.7%

Digest of South African Energy Statistics - 2006
5
Final Sectoral Consumption-1992-2004
0
500,000
1,000,000
1,500,000
2,000,000
2,500,000
3,000,000
1992
1993
1994
1995
1996
1997
1998
1999
2000
2001
2002
2003
2004
TJ
Non-energy use
Non-specified(other)
Agriculture
Transport
Mining
Residential
Commerce
Industry
1992 1993 1994 1995 1996 1997 1998 1999 2000 2001 2002 2003 2004Industry 745,401 749,869 745,633 867,356 848,516 886,831 951,810 900,717 906,785 837,675 839,654 854,793 983,167Commerce 111,089 102,935 97,082 124,281 107,321 118,429 76,022 85,140 82,975 134,447 143,556 162,272 183,359Residential 530,249 553,865 584,484 593,359 596,938 603,557 376,504 369,078 360,467 419,903 425,379 455,733 485,692Mining 153,207 144,908 145,981 154,043 159,369 164,098 166,934 145,386 130,759 183,744 183,795 180,699 190,274Transport 475,345 484,636 502,798 563,367 564,195 583,569 599,766 605,790 603,985 620,916 636,332 656,520 698,552Agriculture 77,708 74,892 83,446 85,380 87,661 84,456 79,387 74,832 64,109 70,003 72,904 74,998 77,988Non-specified(other) 0 0 0 0 0 0 11,979 11,111 21,911 32,033 34,583 64,574 78,830Non-energy use 28,938 26,983 29,109 28,357 31,600 29,828 26,100 24,740 22,352 29,721 31,687 31,000 20,000Total 2,121,937 2,138,087 2,188,534 2,416,142 2,395,599 2,470,770 2,288,502 2,216,793 2,193,342 2,328,443 2,367,889 2,480,589 2,717,860Source: National Energy balances
Final Sectoral Consumption of Energy-TJ
Total Final Consumption by Energy Carrier - 2004
Gas2%
Renew ables and Waste7%
Electricity30%
Petroleum Products32%
Coal29%

Digest of South African Energy Statistics - 2006
6
Energy Intensity South Africa’s economic growth as measured by the growth in Gross Domestic Product (GDP) was 39,9% for the period 1993 to 2004. The Total Primary Energy Supply for these years increased from 3 933PJ in 1993 to 5 241PJ in 2004, an increase of 33,6%. This resulted in the energy intensity for the individual years depicted in the following table and graph.
YearGDP at market
pricesPrimary Energy
Supply TJIntensity
MJ/R1993 755,009 3,924,315 5.201994 779,424 4,150,999 5.331995 803,710 4,299,195 5.351996 838,326 4,269,622 5.091997 860,516 4,423,365 5.141998 864,968 4,639,614 5.361999 885,365 4,636,914 5.242000 922,151 4,298,220 4.662001 947,373 3,972,681 4.192002 982,327 4,637,437 4.722003 1,011,556 4,507,518 4.462004 1,056,771 5,240,908 4.96
Sources: National Energy BalancesStats SA Quartely GDP by industry at constant 2000 prices (R million)
0.00
1.00
2.00
3.00
4.00
5.00
6.00
MJ/R
1993 1994 1995 1996 1997 1998 1999 2000 2001 2002 2003 2004
Energy Intensity

Digest of South African Energy Statistics - 2006
7
Section 2 Energy Balances The energy balance is a useful way to present an overview of the energy flows for a specific time period. A balance shows, in a consistent accounting framework, the production, transformation and final consumption of all forms of energy for a given geographical area and a given period of time, with quantities expressed in terms of a single accounting unit for purposes of comparison and aggregation. The format enjoying international recognition is that developed by the International Energy Agency (IEA). Energy balances in this format for 2003 and 2004 for South Africa using the terajoule (TJ) as accounting unit are presented on the following pages. Interested readers are referred to the IEA for details on the methodologies and conventions used in balance format (Internet site at: http://www.iea.org).

Digest of South African Energy Statistics - 2006
8
RSA 2003 (Version 2)(TJ) Coal Crude Oil Petroleum Gas Nuclear
Products Indigenous Production 5,282,380.82 191,521.20 - 50,217.88 138,141.82 Import 49,170.90 732,329.61 41,398.03 - - Export -2,004,605.75 -18.72 -237,987.34 - - Intl. Marine Bunkers - - -111,553.57 - - Stock Changes -49,345.55 - - - - Total Primary Energy Supply 3,277,600.42 923,832.10 -308,142.87 50,217.88 138,141.82
Transfers - - - - - Statistical Differences 514,436.97 -186,377.16 31,000.40 -0.00 -
Public Electricity Plant -2,132,681.65 - - - -138,141.82 Autoproducer Electricity Plant -82,036.05 - - - - Public CHP Plant - - - - - Autoproducer CHP Plant - - - - - Public Heat Plant - - - - - Autoproducer Heat Plant - - - - - Heat pumps - - - - - Electric boilers - - - - - Gas Works - - - 48,844.39 - Oil Refineries - -737,454.93 1,127,950.32 - - Coal Transformation -11,524.03 - - - - Liquefaction -862,100.47 - - -50,217.88 - Non-specified (Transformation) - - - - - Own Use - - - - -
Distribution Losses - - - - -
Total Final Consumption 703,695.19 - 850,807.85 48,844.39 -
Industry Sector 545,087.53 - 47,133.60 48,749.09 - Iron and Steel 185,466.05 - - 26,146.99 - Chemical and Petrochemical 136,842.56 - - 7,701.16 - Memo: Feedst.Use In Petchem.Ind. 136,058.51 - - - - Non-Ferrous Metals - - - - - Non-Metallic Minerals 46,072.96 - - 4,740.41 - Transport Equipment - - - - - Machinery - - - 2,184.17 - Mining and Quarrying 36,834.87 - 30,673.42 2,333.91 - Food and Tobacco - - - 1,115.94 - Paper Pulp and Print - - - 2,511.11 - Wood and Wood Products - - - - - Construction - - 16,460.18 - - Textile and Leather - - - - - Non-specified (Industry) 139,871.09 - - 2,015.39 -
Transport Sector - - 636,485.90 - - International Civil Aviation - - 36,883.85 - - Domestic Air Transport - - 35,400.04 - - Road - - 555,291.75 - - Rail - - 8,910.26 - - Pipeline Transport - - - - - Internal Navigation - - - - - Non-specified (Transport) - - -
Other Sectors 158,607.66 - 136,187.95 95.30 - Agriculture 3,321.83 - 53,161.58 - - Commerce and Public Services 52,258.60 - 34,061.57 95.30 - Residential 103,027.23 - 39,637.20 - - Non-specified (Other) - - 9,327.60 - -
Non-Energy Use - - 31,000.40 - - Memo:Non-Energy Use Ind/Transf/Ener - - 31,000.40 - - Memo:Non-Energy Use in Transport - - - - - Memo:Non-Energy Use in Oth. Sect - - - - -
Elect.Output in GWh 202,464 - - 4 12,663 Elect.Output-public elec. plant 194,046 - - 0 12,663 Elect.Output-autoprod. elec. plant 8,418 - - 4 - Elect.Output-public CHP plant - - - - - Elect.Output-autoprod. CHP plant - - - - -
Heat Output-public CHP plant - - - - - Heat Output-autoproducer CHP plant - - - - - Heat Output-public heat plant - - - - - Heat Output-autoprod. heat plant - - - - - Heat Output in TJ - - - - -

Digest of South African Energy Statistics - 2006
9
RSA 2003 (Version 2)(TJ) Hydro Geothermal Renewables Electricity Heat Total
Solar etc & Waste Indigenous Production 2,889.67 2,031.22 428,396.00 - - 6,095,578.62 Import - - - 29,498.40 - 852,396.94 Export - - - -36,946.80 - -2,279,558.60 Intl. Marine Bunkers - - - - - -111,553.57 Stock Changes - - - - - -49,345.55 Total Primary Energy Supply 2,889.67 2,031.22 428,396.00 -7,448.40 - 4,507,517.84
Transfers - - - - - - Statistical Differences - - - 4,551.95 - 363,612.14
Public Electricity Plant -1,813.10 -2,031.22 - 747,999.71 - -1,526,668.08 Autoproducer Electricity Plant -1,076.58 - - 31,394.10 - -51,718.52 Public CHP Plant - - - - - - Autoproducer CHP Plant - - -237,996.00 933.54 - -237,062.46 Public Heat Plant - - - - - - Autoproducer Heat Plant - - - - - - Heat pumps - - - - - - Electric boilers - - - - - - Gas Works - - - - - 48,844.39 Oil Refineries - - - -25,153.32 - 365,342.07 Coal Transformation - - - - - -11,524.03 Liquefaction - - - - - -912,318.35 Non-specified (Transformation) - - - - - - Own Use - - - -14,460.02 - -14,460.02
- Distribution Losses - - - -50,976.00 - -50,976.00
Total Final Consumption - - 190,400.00 686,841.56 - 2,480,588.98
Industry Sector - - - 394,521.36 - 1,035,491.58 Iron and Steel - - - 80,392.22 - 292,005.26 Chemical and Petrochemical - - - 33,980.12 - 178,523.85 Memo: Feedst.Use In Petchem.Ind. - - - - - 136,058.51 Non-Ferrous Metals - - - 58,529.78 - 58,529.78 Non-Metallic Minerals - - - 8,205.74 - 59,019.10 Transport Equipment - - - 342.91 - 342.91 Machinery - - - 152.54 - 2,336.71 Mining and Quarrying - - - 110,856.52 - 180,698.72 Food and Tobacco - - - 2,572.26 - 3,688.19 Paper Pulp and Print - - - 5,265.39 - 7,776.51 Wood and Wood Products - - - 974.49 - 974.49 Construction - - - 479.02 - 16,939.20 Textile and Leather - - - 1,879.62 - 1,879.62 Non-specified (Industry) - - - 90,890.74 - 232,777.22
Transport Sector - - - 20,034.04 - 656,519.94 International Civil Aviation - - - - - 36,883.85 Domestic Air Transport - - - 153.56 - 35,553.60 Road - - - 71.50 - 555,363.25 Rail - - - 11,756.88 - 20,667.14 Pipeline Transport - - - 277.87 - 277.87 Internal Navigation - - - 177.77 - 177.77 Non-specified (Transport) - 7,596.47 - 7,596.47
Other Sectors - - 190,400.00 272,286.16 - 757,577.07 Agriculture - - - 18,514.50 - 74,997.92 Commerce and Public Services - - - 75,856.24 - 162,271.71 Residential - - 190,400.00 122,668.53 - 455,732.96 Non-specified (Other) - - - 55,246.88 - 64,574.48
- Non-Energy Use - - - - - 31,000.40 Memo:Non-Energy Use Ind/Transf/Ener - - - - - 31,000.40 Memo:Non-Energy Use in Transport - - - - - - Memo:Non-Energy Use in Oth. Sect - - - - - -
Elect.Output in GWh 803 564 259 - - 216,758 Elect.Output-public elec. plant 504 564 - - - 207,778 Elect.Output-autoprod. elec. plant 299 - - - - 8,721 Elect.Output-public CHP plant - - - - - - Elect.Output-autoprod. CHP plant - - 259 - - 259
- Heat Output-public CHP plant - - - - - - Heat Output-autoproducer CHP plant - - - - - - Heat Output-public heat plant - - - - - - Heat Output-autoprod. heat plant - - - - - - Heat Output in TJ - 3,159.68 - - - -

Digest of South African Energy Statistics - 2006
10
RSA 2004 (Version 1)(TJ) Coal Crude Oil Petroleum Gas Nuclear
Products Indigenous Production 5,372,630.01 206,291.98 - 77,171.78 145,801.34 Import 52,105.61 1,006,340.73 82,674.73 6,980.54 - Export -1,905,254.08 -25.24 -178,000.87 - - Intl. Marine Bunkers - - -100,616.85 - - Stock Changes 53,861.05 - - - - Total Primary Energy Supply 3,573,342.58 1,212,607.47 -195,942.99 84,152.32 145,801.34
Transfers - - - - - Statistical Differences 467,623.74 -198,047.85 20,000.10 0.00 -
Public Electricity Plant -2,295,836.31 - - - -145,801.34 Autoproducer Electricity Plant -64,333.72 - - - - Public CHP Plant - - - - - Autoproducer CHP Plant - - - - - Public Heat Plant - - - - - Autoproducer Heat Plant - - - - - Heat pumps - - - - - Electric boilers - - - - - Gas Works - - - 43,690.10 - Oil Refineries - -1,014,559.62 1,058,263.49 - - Coal Transformation -8,462.76 - - - - Liquefaction -894,103.63 - - -77,171.78 - Non-specified (Transformation) - - - - - Own Use - - - - -
Distribution Losses - - - - -
Total Final Consumption 778,229.90 - 882,320.60 50,670.64 -
Industry Sector 592,703.14 - 46,590.71 50,360.78 - Iron and Steel 207,160.37 - - 22,835.94 - Chemical and Petrochemical 109,296.91 - - 9,108.99 - Memo: Feedst.Use In Petchem.Ind. 109,296.91 - - - - Non-Ferrous Metals - - - - - Non-Metallic Minerals 53,297.21 - - 6,151.16 - Transport Equipment - - - - - Machinery - - - 1,917.37 - Mining and Quarrying 38,986.75 - 30,795.21 2,312.14 - Food and Tobacco - - - 924.09 - Paper Pulp and Print - - - 2,251.43 - Wood and Wood Products - - - - - Construction - - 15,795.51 - - Textile and Leather - - - - - Non-specified (Industry) 183,961.90 - - 4,859.66 -
Transport Sector - - 675,862.58 - - International Civil Aviation - - 32,419.70 - - Domestic Air Transport - - 39,567.18 - - Road - - 596,002.80 - - Rail - - 7,872.90 - - Pipeline Transport - - - - - Internal Navigation - - - - - Non-specified (Transport) - - -
Other Sectors 185,526.76 - 139,867.21 309.86 - Agriculture 3,154.55 - 52,660.76 - - Commerce and Public Services 60,790.73 - 32,294.99 309.86 - Residential 121,581.47 - 43,278.05 - - Non-specified (Other) - - 11,633.40 - -
Non-Energy Use - - 20,000.10 - - Memo:Non-Energy Use Ind/Transf/Ener - - 20,000.10 - - Memo:Non-Energy Use in Transport - - - - - Memo:Non-Energy Use in Oth. Sect - - - - -
Elect.Output in GWh 212,406 - - 3 13,365 Elect.Output-public elec. plant 203,565 - - 0 13,365 Elect.Output-autoprod. elec. plant 8,841 - - 3 - Elect.Output-public CHP plant - - - - - Elect.Output-autoprod. CHP plant - - - - -
Heat Output-public CHP plant - - - - - Heat Output-autoproducer CHP plant - - - - - Heat Output-public heat plant - - - - - Heat Output-autoprod. heat plant - - - - - Heat Output in TJ - - - - -

Digest of South African Energy Statistics - 2006
11
RSA 2004 (Version 1)(TJ) Hydro Geothermal Renewables Electricity Heat Total
Solar etc & Waste Indigenous Production 2,889.67 2,031.22 428,396.00 - - 6,235,212.01 Import - - - 35,344.80 - 1,183,446.41 Export - - - -47,714.40 - -2,130,994.59 Intl. Marine Bunkers - - - - - -100,616.85 Stock Changes - - - - - 53,861.05 Total Primary Energy Supply 2,889.67 2,031.22 428,396.00 -12,369.60 - 5,240,908.02
Transfers - - - - - - Statistical Differences - - - 72,230.07 - 361,806.06
Public Electricity Plant -2,267.24 -2,031.22 - 785,246.70 - -1,660,689.42 Autoproducer Electricity Plant -622.43 - - 32,461.62 - -32,494.53 Public CHP Plant - - - - - - Autoproducer CHP Plant - - -237,996.00 692.41 - -237,303.59 Public Heat Plant - - - - - - Autoproducer Heat Plant - - - - - - Heat pumps - - - - - - Electric boilers - - - - - - Gas Works - - - - - 43,690.10 Oil Refineries - - - -27,267.77 - 16,436.10 Coal Transformation - - - - - -8,462.76 Liquefaction - - - - - -971,275.41 Non-specified (Transformation) - - - - - - Own Use - - - -15,789.97 - -15,789.97
- Distribution Losses - - - -18,964.80 - -18,964.80
Total Final Consumption - - 190,400.00 816,238.67 - 2,717,859.80
Industry Sector - - - 483,785.64 - 1,173,440.28 Iron and Steel - - - 83,774.92 - 313,771.22 Chemical and Petrochemical - - - 35,600.08 - 154,005.98 Memo: Feedst.Use In Petchem.Ind. - - - - - 109,296.91 Non-Ferrous Metals - - - 64,630.01 - 64,630.01 Non-Metallic Minerals - - - 7,900.81 - 67,349.18 Transport Equipment - - - 304.42 - 304.42 Machinery - - - 153.18 - 2,070.55 Mining and Quarrying - - - 118,179.61 - 190,273.71 Food and Tobacco - - - 2,591.71 - 3,515.80 Paper Pulp and Print - - - 5,445.11 - 7,696.54 Wood and Wood Products - - - 1,043.82 - 1,043.82 Construction - - - 186.52 - 15,982.02 Textile and Leather - - - 1,890.25 - 1,890.25 Non-specified (Industry) - - - 162,085.22 - 350,906.78
Transport Sector - - - 22,688.97 - 698,551.55 International Civil Aviation - - - - - 32,419.70 Domestic Air Transport - - - 155.16 - 39,722.34 Road - - - 72.86 - 596,075.67 Rail - - - 11,853.58 - 19,726.47 Pipeline Transport - - - 290.09 - 290.09 Internal Navigation - - - 181.37 - 181.37 Non-specified (Transport) - 10,135.92 - 10,135.92
Other Sectors - - 190,400.00 309,764.05 - 825,867.87 Agriculture - - - 22,172.21 - 77,987.52 Commerce and Public Services - - - 89,963.04 - 183,358.63 Residential - - 190,400.00 130,432.42 - 485,691.94 Non-specified (Other) - - - 67,196.38 - 78,829.78
- Non-Energy Use - - - - - 20,000.10 Memo:Non-Energy Use Ind/Transf/Ener - - - - - 20,000.10 Memo:Non-Energy Use in Transport - - - - - - Memo:Non-Energy Use in Oth. Sect - - - - - -
Elect.Output in GWh 803 564 192 - - 227,334 Elect.Output-public elec. plant 630 564 - - - 218,124 Elect.Output-autoprod. elec. plant 173 - - - - 9,017 Elect.Output-public CHP plant - - - - - - Elect.Output-autoprod. CHP plant - - 192 - - 192
- Heat Output-public CHP plant - - - - - - Heat Output-autoproducer CHP plant - - - - - - Heat Output-public heat plant - - - - - - Heat Output-autoprod. heat plant - - - - - - Heat Output in TJ - 3,159.68 - - - -

Digest of South African Energy Statistics - 2006
12
Notes

Digest of South African Energy Statistics - 2006
13
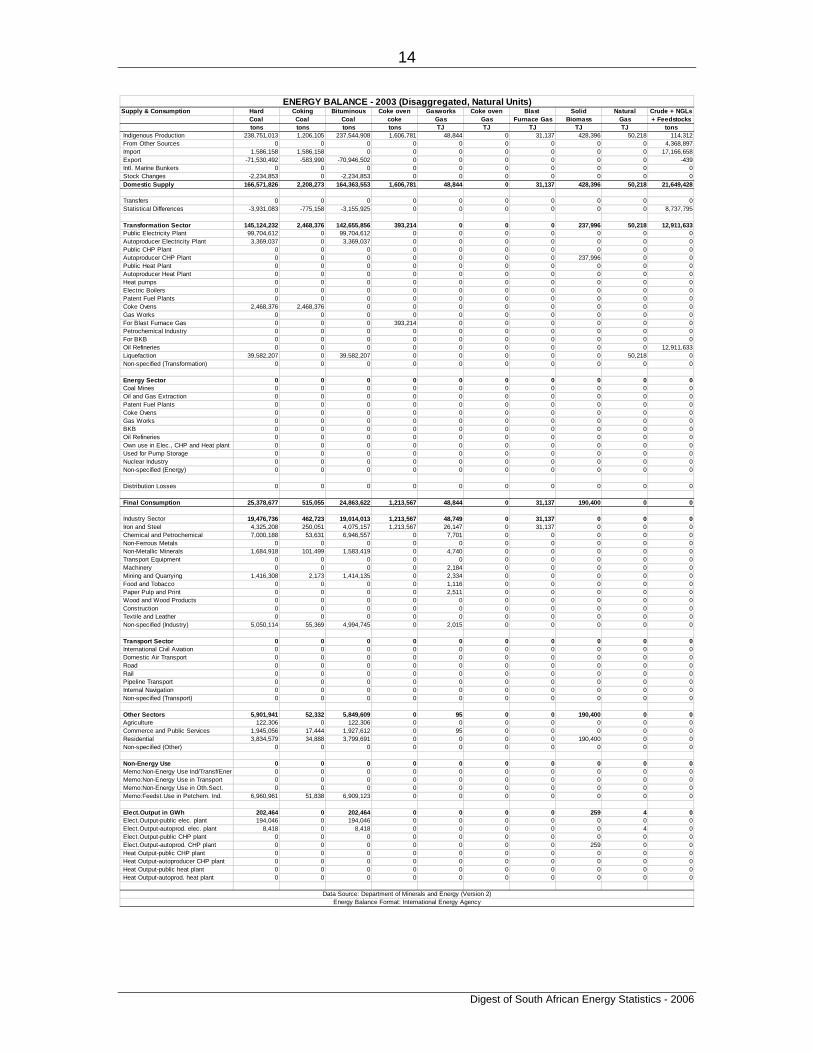
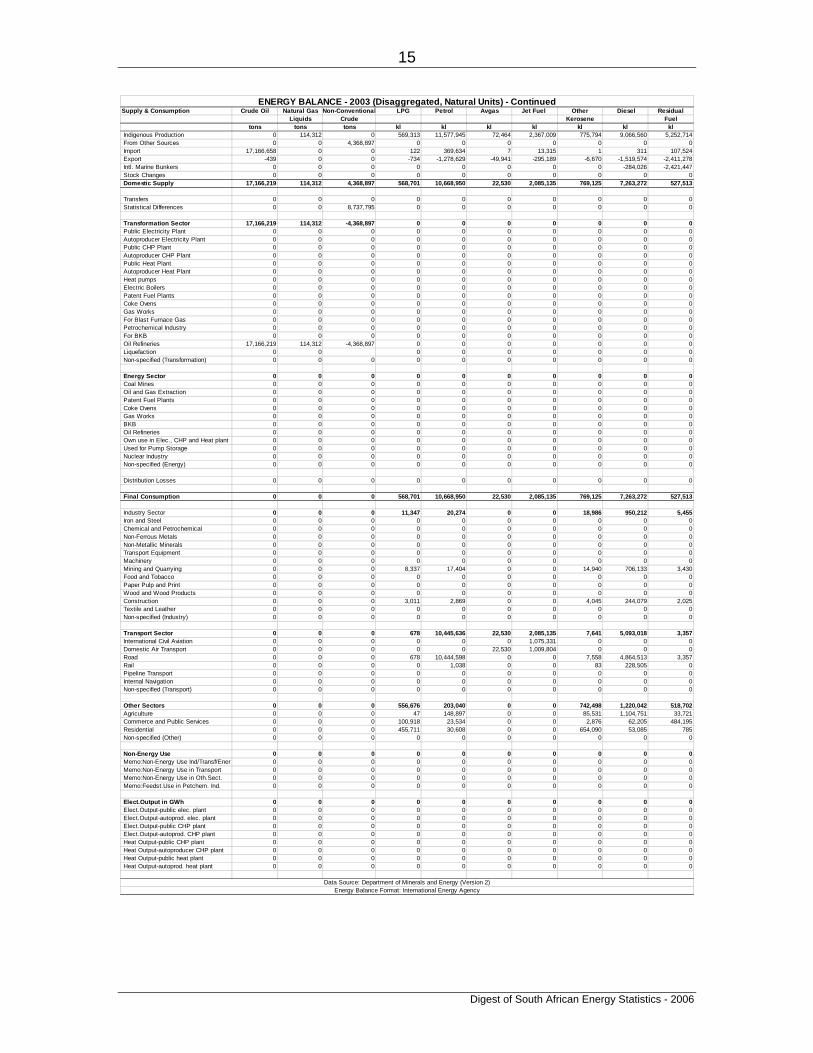
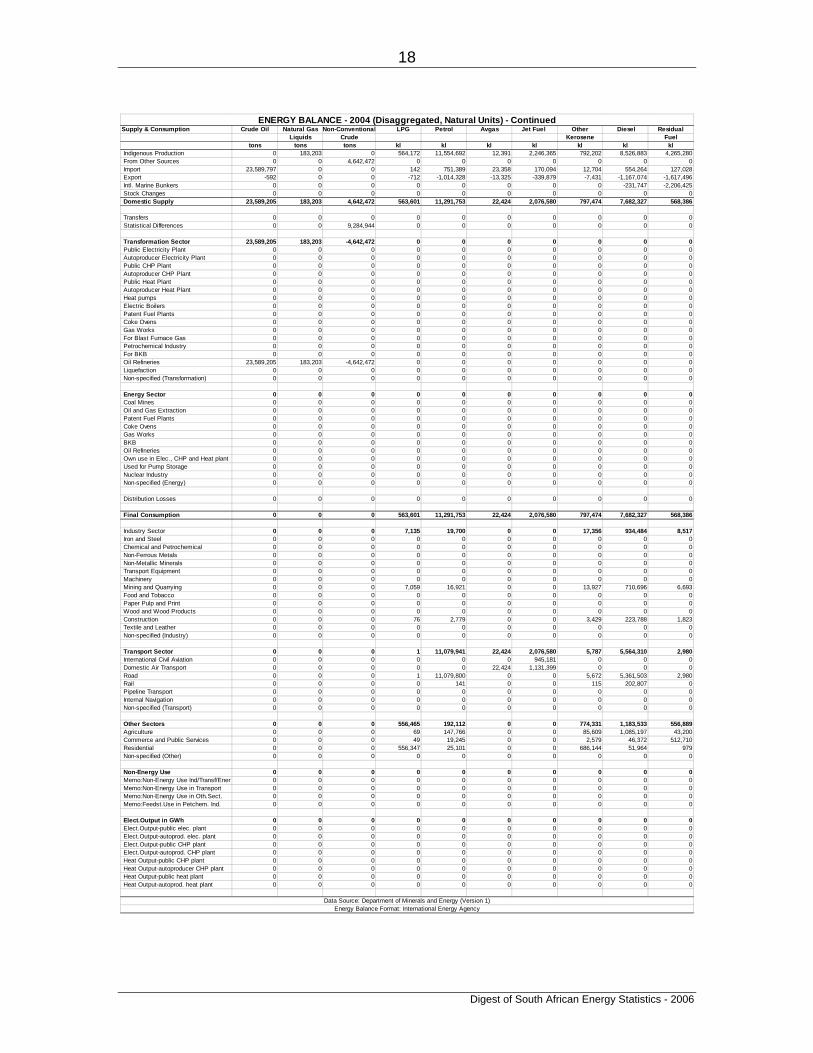
Section 3 National Energy Consumption The Energy Balances on the previous pages combine in one document all the various fuels as measured in energy units (terajoules). However, it is also of value to have these in the units that the various fuels are normally measured. The following tables provide this information for 2003 and 2004.
Digest of South African Energy Statistics - 2006
14
Supply & Consumption Hard Coking Bituminous Coke oven Gasworks Coke oven Blast Solid Natural Crude + NGLsCoal Coal Coal coke Gas Gas Furnace Gas Biomass Gas + Feedstockstons tons tons tons TJ TJ TJ TJ TJ tons
Indigenous Production 238,751,013 1,206,105 237,544,908 1,606,781 48,844 0 31,137 428,396 50,218 114,312 From Other Sources 0 0 0 0 0 0 0 0 0 4,368,897 Import 1,586,158 1,586,158 0 0 0 0 0 0 0 17,166,658 Export -71,530,492 -583,990 -70,946,502 0 0 0 0 0 0 -439 Intl. Marine Bunkers 0 0 0 0 0 0 0 0 0 0 Stock Changes -2,234,853 0 -2,234,853 0 0 0 0 0 0 0 Domestic Supply 166,571,826 2,208,273 164,363,553 1,606,781 48,844 0 31,137 428,396 50,218 21,649,428
Transfers 0 0 0 0 0 0 0 0 0 0 Statistical Differences -3,931,083 -775,158 -3,155,925 0 0 0 0 0 0 8,737,795
Transformation Sector 145,124,232 2,468,376 142,655,856 393,214 0 0 0 237,996 50,218 12,911,633 Public Electricity Plant 99,704,612 0 99,704,612 0 0 0 0 0 0 0 Autoproducer Electricity Plant 3,369,037 0 3,369,037 0 0 0 0 0 0 0 Public CHP Plant 0 0 0 0 0 0 0 0 0 0 Autoproducer CHP Plant 0 0 0 0 0 0 0 237,996 0 0 Public Heat Plant 0 0 0 0 0 0 0 0 0 0 Autoproducer Heat Plant 0 0 0 0 0 0 0 0 0 0 Heat pumps 0 0 0 0 0 0 0 0 0 0 Electric Boilers 0 0 0 0 0 0 0 0 0 0 Patent Fuel Plants 0 0 0 0 0 0 0 0 0 0 Coke Ovens 2,468,376 2,468,376 0 0 0 0 0 0 0 0 Gas Works 0 0 0 0 0 0 0 0 0 0 For Blast Furnace Gas 0 0 0 393,214 0 0 0 0 0 0 Petrochemical Industry 0 0 0 0 0 0 0 0 0 0 For BKB 0 0 0 0 0 0 0 0 0 0 Oil Refineries 0 0 0 0 0 0 0 0 0 12,911,633 Liquefaction 39,582,207 0 39,582,207 0 0 0 0 0 50,218 0 Non-specified (Transformation) 0 0 0 0 0 0 0 0 0 0
Energy Sector 0 0 0 0 0 0 0 0 0 0 Coal Mines 0 0 0 0 0 0 0 0 0 0 Oil and Gas Extraction 0 0 0 0 0 0 0 0 0 0 Patent Fuel Plants 0 0 0 0 0 0 0 0 0 0 Coke Ovens 0 0 0 0 0 0 0 0 0 0 Gas Works 0 0 0 0 0 0 0 0 0 0 BKB 0 0 0 0 0 0 0 0 0 0 Oil Refineries 0 0 0 0 0 0 0 0 0 0 Own use in Elec., CHP and Heat plant 0 0 0 0 0 0 0 0 0 0 Used for Pump Storage 0 0 0 0 0 0 0 0 0 0 Nuclear Industry 0 0 0 0 0 0 0 0 0 0 Non-specified (Energy) 0 0 0 0 0 0 0 0 0 0
Distribution Losses 0 0 0 0 0 0 0 0 0 0
Final Consumption 25,378,677 515,055 24,863,622 1,213,567 48,844 0 31,137 190,400 0 0
Industry Sector 19,476,736 462,723 19,014,013 1,213,567 48,749 0 31,137 0 0 0 Iron and Steel 4,325,208 250,051 4,075,157 1,213,567 26,147 0 31,137 0 0 0 Chemical and Petrochemical 7,000,188 53,631 6,946,557 0 7,701 0 0 0 0 0 Non-Ferrous Metals 0 0 0 0 0 0 0 0 0 0 Non-Metallic Minerals 1,684,918 101,499 1,583,419 0 4,740 0 0 0 0 0 Transport Equipment 0 0 0 0 0 0 0 0 0 0 Machinery 0 0 0 0 2,184 0 0 0 0 0 Mining and Quarrying 1,416,308 2,173 1,414,135 0 2,334 0 0 0 0 0 Food and Tobacco 0 0 0 0 1,116 0 0 0 0 0 Paper Pulp and Print 0 0 0 0 2,511 0 0 0 0 0 Wood and Wood Products 0 0 0 0 0 0 0 0 0 0 Construction 0 0 0 0 0 0 0 0 0 0 Textile and Leather 0 0 0 0 0 0 0 0 0 0 Non-specified (Industry) 5,050,114 55,369 4,994,745 0 2,015 0 0 0 0 0
Transport Sector 0 0 0 0 0 0 0 0 0 0 International Civil Aviation 0 0 0 0 0 0 0 0 0 0 Domestic Air Transport 0 0 0 0 0 0 0 0 0 0 Road 0 0 0 0 0 0 0 0 0 0 Rail 0 0 0 0 0 0 0 0 0 0 Pipeline Transport 0 0 0 0 0 0 0 0 0 0 Internal Navigation 0 0 0 0 0 0 0 0 0 0 Non-specified (Transport) 0 0 0 0 0 0 0 0 0 0
Other Sectors 5,901,941 52,332 5,849,609 0 95 0 0 190,400 0 0 Agriculture 122,306 0 122,306 0 0 0 0 0 0 0 Commerce and Public Services 1,945,056 17,444 1,927,612 0 95 0 0 0 0 0 Residential 3,834,579 34,888 3,799,691 0 0 0 0 190,400 0 0 Non-specified (Other) 0 0 0 0 0 0 0 0 0 0
Non-Energy Use 0 0 0 0 0 0 0 0 0 0 Memo:Non-Energy Use Ind/Transf/Ener 0 0 0 0 0 0 0 0 0 0 Memo:Non-Energy Use in Transport 0 0 0 0 0 0 0 0 0 0 Memo:Non-Energy Use in Oth.Sect. 0 0 0 0 0 0 0 0 0 0 Memo:Feedst.Use in Petchem. Ind. 6,960,961 51,838 6,909,123 0 0 0 0 0 0 0
Elect.Output in GWh 202,464 0 202,464 0 0 0 0 259 4 0 Elect.Output-public elec. plant 194,046 0 194,046 0 0 0 0 0 0 0 Elect.Output-autoprod. elec. plant 8,418 0 8,418 0 0 0 0 0 4 0 Elect.Output-public CHP plant 0 0 0 0 0 0 0 0 0 0 Elect.Output-autoprod. CHP plant 0 0 0 0 0 0 0 259 0 0 Heat Output-public CHP plant 0 0 0 0 0 0 0 0 0 0 Heat Output-autoproducer CHP plant 0 0 0 0 0 0 0 0 0 0 Heat Output-public heat plant 0 0 0 0 0 0 0 0 0 0 Heat Output-autoprod. heat plant 0 0 0 0 0 0 0 0 0 0
Energy Balance Format: International Energy Agency
ENERGY BALANCE - 2003 (Disaggregated, Natural Units)
Data Source: Department of Minerals and Energy (Version 2)
Digest of South African Energy Statistics - 2006
15
Supply & Consumption Crude Oil Natural Gas Non-Conventional LPG Petrol Avgas Jet Fuel Other Diesel ResidualLiquids Crude Kerosene Fuel
tons tons tons kl kl kl kl kl kl kl Indigenous Production 0 114,312 0 569,313 11,577,945 72,464 2,367,009 775,794 9,066,560 5,252,714 From Other Sources 0 0 4,368,897 0 0 0 0 0 0 0 Import 17,166,658 0 0 122 369,634 7 13,315 1 311 107,524 Export -439 0 0 -734 -1,278,629 -49,941 -295,189 -6,670 -1,519,574 -2,411,278 Intl. Marine Bunkers 0 0 0 0 0 0 0 0 -284,026 -2,421,447 Stock Changes 0 0 0 0 0 0 0 0 0 0 Domestic Supply 17,166,219 114,312 4,368,897 568,701 10,668,950 22,530 2,085,135 769,125 7,263,272 527,513
Transfers 0 0 0 0 0 0 0 0 0 0 Statistical Differences 0 0 8,737,795 0 0 0 0 0 0 0
Transformation Sector 17,166,219 114,312 -4,368,897 0 0 0 0 0 0 0 Public Electricity Plant 0 0 0 0 0 0 0 0 0 0 Autoproducer Electricity Plant 0 0 0 0 0 0 0 0 0 0 Public CHP Plant 0 0 0 0 0 0 0 0 0 0 Autoproducer CHP Plant 0 0 0 0 0 0 0 0 0 0 Public Heat Plant 0 0 0 0 0 0 0 0 0 0 Autoproducer Heat Plant 0 0 0 0 0 0 0 0 0 0 Heat pumps 0 0 0 0 0 0 0 0 0 0 Electric Boilers 0 0 0 0 0 0 0 0 0 0 Patent Fuel Plants 0 0 0 0 0 0 0 0 0 0 Coke Ovens 0 0 0 0 0 0 0 0 0 0 Gas Works 0 0 0 0 0 0 0 0 0 0 For Blast Furnace Gas 0 0 0 0 0 0 0 0 0 0 Petrochemical Industry 0 0 0 0 0 0 0 0 0 0 For BKB 0 0 0 0 0 0 0 0 0 0 Oil Refineries 17,166,219 114,312 -4,368,897 0 0 0 0 0 0 0 Liquefaction 0 0 0 0 0 0 0 0 0 Non-specified (Transformation) 0 0 0 0 0 0 0 0 0 0
Energy Sector 0 0 0 0 0 0 0 0 0 0 Coal Mines 0 0 0 0 0 0 0 0 0 0 Oil and Gas Extraction 0 0 0 0 0 0 0 0 0 0 Patent Fuel Plants 0 0 0 0 0 0 0 0 0 0 Coke Ovens 0 0 0 0 0 0 0 0 0 0 Gas Works 0 0 0 0 0 0 0 0 0 0 BKB 0 0 0 0 0 0 0 0 0 0 Oil Refineries 0 0 0 0 0 0 0 0 0 0 Own use in Elec., CHP and Heat plant 0 0 0 0 0 0 0 0 0 0 Used for Pump Storage 0 0 0 0 0 0 0 0 0 0 Nuclear Industry 0 0 0 0 0 0 0 0 0 0 Non-specified (Energy) 0 0 0 0 0 0 0 0 0 0
Distribution Losses 0 0 0 0 0 0 0 0 0 0
Final Consumption 0 0 0 568,701 10,668,950 22,530 2,085,135 769,125 7,263,272 527,513
Industry Sector 0 0 0 11,347 20,274 0 0 18,986 950,212 5,455 Iron and Steel 0 0 0 0 0 0 0 0 0 0 Chemical and Petrochemical 0 0 0 0 0 0 0 0 0 0 Non-Ferrous Metals 0 0 0 0 0 0 0 0 0 0 Non-Metallic Minerals 0 0 0 0 0 0 0 0 0 0 Transport Equipment 0 0 0 0 0 0 0 0 0 0 Machinery 0 0 0 0 0 0 0 0 0 0 Mining and Quarrying 0 0 0 8,337 17,404 0 0 14,940 706,133 3,430 Food and Tobacco 0 0 0 0 0 0 0 0 0 0 Paper Pulp and Print 0 0 0 0 0 0 0 0 0 0 Wood and Wood Products 0 0 0 0 0 0 0 0 0 0 Construction 0 0 0 3,011 2,869 0 0 4,045 244,079 2,025 Textile and Leather 0 0 0 0 0 0 0 0 0 0 Non-specified (Industry) 0 0 0 0 0 0 0 0 0 0
Transport Sector 0 0 0 678 10,445,636 22,530 2,085,135 7,641 5,093,018 3,357 International Civil Aviation 0 0 0 0 0 0 1,075,331 0 0 0 Domestic Air Transport 0 0 0 0 0 22,530 1,009,804 0 0 0 Road 0 0 0 678 10,444,598 0 0 7,558 4,864,513 3,357 Rail 0 0 0 0 1,038 0 0 83 228,505 0 Pipeline Transport 0 0 0 0 0 0 0 0 0 0 Internal Navigation 0 0 0 0 0 0 0 0 0 0 Non-specified (Transport) 0 0 0 0 0 0 0 0 0 0
Other Sectors 0 0 0 556,676 203,040 0 0 742,498 1,220,042 518,702 Agriculture 0 0 0 47 148,897 0 0 85,531 1,104,751 33,721 Commerce and Public Services 0 0 0 100,918 23,534 0 0 2,876 62,205 484,195 Residential 0 0 0 455,711 30,608 0 0 654,090 53,085 785 Non-specified (Other) 0 0 0 0 0 0 0 0 0 0
Non-Energy Use 0 0 0 0 0 0 0 0 0 0 Memo:Non-Energy Use Ind/Transf/Ener 0 0 0 0 0 0 0 0 0 0 Memo:Non-Energy Use in Transport 0 0 0 0 0 0 0 0 0 0 Memo:Non-Energy Use in Oth.Sect. 0 0 0 0 0 0 0 0 0 0 Memo:Feedst.Use in Petchem. Ind. 0 0 0 0 0 0 0 0 0 0
Elect.Output in GWh 0 0 0 0 0 0 0 0 0 0 Elect.Output-public elec. plant 0 0 0 0 0 0 0 0 0 0 Elect.Output-autoprod. elec. plant 0 0 0 0 0 0 0 0 0 0 Elect.Output-public CHP plant 0 0 0 0 0 0 0 0 0 0 Elect.Output-autoprod. CHP plant 0 0 0 0 0 0 0 0 0 0 Heat Output-public CHP plant 0 0 0 0 0 0 0 0 0 0 Heat Output-autoproducer CHP plant 0 0 0 0 0 0 0 0 0 0 Heat Output-public heat plant 0 0 0 0 0 0 0 0 0 0 Heat Output-autoprod. heat plant 0 0 0 0 0 0 0 0 0 0
Energy Balance Format: International Energy Agency
ENERGY BALANCE - 2003 (Disaggregated, Natural Units) - Continued
Data Source: Department of Minerals and Energy (Version 2)

Digest of South African Energy Statistics - 2006
16
Supply & Consumption White Lubricants Bitumen Parrafin Other Petroleum Nuclear Hydro Solar Wind ElectricitySpirit Wax products
kl tons tons tons tons GWh GWh GWh GWh MWh Indigenous Production 77,960 446,127 408,211 74,803 18,859 38,373 3,808 1,043,000 32 219,763,323 From Other Sources 0 0 0 0 0 0 0 0 0 0 Import 1,502 147,005 595 29,755 0 0 0 0 0 8,194,000 Export -1,767 -184,420 -137,018 -91,599 0 0 0 0 0 -10,263,000 Intl. Marine Bunkers 0 0 0 0 0 0 0 0 0 0 Stock Changes 0 0 0 0 0 0 0 0 0 0 Domestic Supply 77,695 408,712 271,788 12,959 18,859 38,373 3,808 1,043,000 32 217,694,323
Transfers 0 0 0 0 0 0 0 0 0 0 Statistical Differences 0 0 0 0 0 0 0 0 0 -2,660,733
Transformation Sector 0 0 0 0 0 38,373 3,808 0 32 4,399,023 Public Electricity Plant 0 0 0 0 0 38,373 3,509 0 5 0 Autoproducer Electricity Plant 0 0 0 0 0 0 299 0 27 4,399,023 Public CHP Plant 0 0 0 0 0 0 0 0 0 0 Autoproducer CHP Plant 0 0 0 0 0 0 0 0 0 0 Public Heat Plant 0 0 0 0 0 0 0 0 0 0 Autoproducer Heat Plant 0 0 0 0 0 0 0 0 0 0 Heat pumps 0 0 0 0 0 0 0 0 0 0 Electric Boilers 0 0 0 0 0 0 0 0 0 0 Patent Fuel Plants 0 0 0 0 0 0 0 0 0 0 Coke Ovens 0 0 0 0 0 0 0 0 0 0 Gas Works 0 0 0 0 0 0 0 0 0 0 For Blast Furnace Gas 0 0 0 0 0 0 0 0 0 0 Petrochemical Industry 0 0 0 0 0 0 0 0 0 0 For BKB 0 0 0 0 0 0 0 0 0 0 Oil Refineries 0 0 0 0 0 0 0 0 0 0 Liquefaction 0 0 0 0 0 0 0 0 0 0 Non-specified (Transformation) 0 0 0 0 0 0 0 0 0 0
Energy Sector 0 0 0 0 0 0 0 0 0 11,006,711 Coal Mines 0 0 0 0 0 0 0 0 0 0 Oil and Gas Extraction 0 0 0 0 0 0 0 0 0 0 Patent Fuel Plants 0 0 0 0 0 0 0 0 0 0 Coke Ovens 0 0 0 0 0 0 0 0 0 0 Gas Works 0 0 0 0 0 0 0 0 0 0 BKB 0 0 0 0 0 0 0 0 0 0 Oil Refineries 0 0 0 0 0 0 0 0 0 6,987,032 Own use in Elec., CHP and Heat plant 0 0 0 0 0 0 0 0 0 351 Used for Pump Storage 0 0 0 0 0 0 0 0 0 4,019,328 Nuclear Industry 0 0 0 0 0 0 0 0 0 0 Non-specified (Energy) 0 0 0 0 0 0 0 0 0 0
Distribution Losses 0 0 0 0 0 0 0 0 0 14,160,000
Final Consumption 77,695 408,712 271,788 12,959 18,859 0 0 1,043,000 0 190,789,322
Industry Sector 630 65,091 157,961 317 2 0 0 0 0 109,589,267 Iron and Steel 0 0 0 0 0 0 0 0 0 22,331,171 Chemical and Petrochemical 0 0 0 0 0 0 0 0 0 9,438,923 Non-Ferrous Metals 0 0 0 0 0 0 0 0 0 16,258,273 Non-Metallic Minerals 0 0 0 0 0 0 0 0 0 2,279,371 Transport Equipment 0 0 0 0 0 0 0 0 0 95,253 Machinery 0 0 0 0 0 0 0 0 0 42,373 Mining and Quarrying 569 55,329 1 232 1 0 0 0 0 30,793,477 Food and Tobacco 0 0 0 0 0 0 0 0 0 714,516 Paper Pulp and Print 0 0 0 0 0 0 0 0 0 1,462,609 Wood and Wood Products 0 0 0 0 0 0 0 0 0 270,693 Construction 61 9,762 157,960 85 1 0 0 0 0 133,061 Textile and Leather 0 0 0 0 0 0 0 0 0 522,118 Non-specified (Industry) 0 0 0 0 0 0 0 0 0 25,247,429
Transport Sector 136 310,231 2 0 1 0 0 0 0 5,565,011 International Civil Aviation 0 0 0 0 0 0 0 0 0 0 Domestic Air Transport 0 0 0 0 0 0 0 0 0 42,655 Road 100 306,146 2 0 0 0 0 0 0 19,860 Rail 36 4,085 0 0 0 0 0 0 0 3,265,800 Pipeline Transport 0 0 0 0 0 0 0 0 0 77,185 Internal Navigation 0 0 0 0 0 0 0 0 0 49,381 Non-specified (Transport) 0 0 0 0 0 0 0 0 0 2,110,130
Other Sectors 76,929 33,390 113,825 12,642 18,856 0 0 1,043,000 0 75,635,044 Agriculture 3,571 31,050 444 0 2 0 0 0 0 5,142,918 Commerce and Public Services 73,357 2,337 109,246 12,642 18,854 0 0 0 0 21,071,177 Residential 1 3 4,134 0 0 0 0 1,043,000 0 34,074,593 Non-specified (Other) 0 0 0 0 0 0 0 0 0 15,346,356
Non-Energy Use 77,695 408,712 271,788 12,959 18,859 0 0 0 0 0 Memo:Non-Energy Use Ind/Transf/Ener 77,695 408,712 271,788 12,959 18,859 0 0 0 0 0 Memo:Non-Energy Use in Transport 0 0 0 0 0 0 0 0 0 0 Memo:Non-Energy Use in Oth.Sect. 0 0 0 0 0 0 0 0 0 0 Memo:Feedst.Use in Petchem. Ind. 0 0 0 0 0 0 0 0 0 0
Elect.Output in GWh 0 0 0 0 0 12,663 3,808 532 32 219,763 Elect.Output-public elec. plant 0 0 0 0 0 12,663 3,509 532 32 210,783 Elect.Output-autoprod. elec. plant 0 0 0 0 0 0 299 0 0 8,721 Elect.Output-public CHP plant 0 0 0 0 0 0 0 0 0 0 Elect.Output-autoprod. CHP plant 0 0 0 0 0 0 0 0 0 259 Heat Output-public CHP plant 0 0 0 0 0 0 0 0 0 0 Heat Output-autoproducer CHP plant 0 0 0 0 0 0 0 0 0 0 Heat Output-public heat plant 0 0 0 0 0 0 0 0 0 0 Heat Output-autoprod. heat plant 0 0 0 0 0 0 0 0 0 0
Energy Balance Format: International Energy Agency
ENERGY BALANCE - 2003 (Disaggregated, Natural Units) - Concluded
Data Source: Department of Minerals and Energy (Version 2)

Digest of South African Energy Statistics - 2006
17
Supply & Consumption Hard Coking Bituminous Coke oven Gasworks Coke oven Blast Solid Natural Crude + NGLsCoal Coal Coal coke Gas Gas Furnace Gas Biomass Gas + Feedstockstons tons tons tons TJ TJ TJ TJ TJ tons
Indigenous Production 242,821,694 1,247,422 241,574,272 1,940,317 43,455 0 31,137 428,396 77,172 183,203 From Other Sources 0 0 0 0 235 0 0 0 0 4,642,472 Import 1,680,826 1,680,826 0 0 6,981 0 0 0 0 23,589,797 Export -67,946,518 -917,192 -67,029,326 0 0 0 0 0 0 -592 Intl. Marine Bunkers 0 0 0 0 0 0 0 0 0 0 Stock Changes 2,439,359 0 2,439,359 0 0 0 0 0 0 0 Domestic Supply 178,995,361 2,011,056 176,984,305 1,940,317 50,671 0 31,137 428,396 77,172 28,414,880
Transfers 0 0 0 0 0 0 0 0 0 0 Statistical Differences -2,043,109 -1,222,628 -820,481 0 0 0 0 0 0 9,284,944
Transformation Sector 153,658,620 2,632,762 151,025,858 434,376 0 0 0 237,996 77,172 19,129,936 Public Electricity Plant 107,332,226 0 107,332,226 0 0 0 0 0 0 0 Autoproducer Electricity Plant 2,642,042 0 2,642,042 0 0 0 0 0 0 0 Public CHP Plant 0 0 0 0 0 0 0 0 0 0 Autoproducer CHP Plant 0 0 0 0 0 0 0 237,996 0 0 Public Heat Plant 0 0 0 0 0 0 0 0 0 0 Autoproducer Heat Plant 0 0 0 0 0 0 0 0 0 0 Heat pumps 0 0 0 0 0 0 0 0 0 0 Electric Boilers 0 0 0 0 0 0 0 0 0 0 Patent Fuel Plants 0 0 0 0 0 0 0 0 0 0 Coke Ovens 2,632,762 2,632,762 0 0 0 0 0 0 0 0 Gas Works 0 0 0 0 0 0 0 0 0 0 For Blast Furnace Gas 0 0 0 434,376 0 0 0 0 0 0 Petrochemical Industry 0 0 0 0 0 0 0 0 0 0 For BKB 0 0 0 0 0 0 0 0 0 0 Oil Refineries 0 0 0 0 0 0 0 0 0 19,129,936 Liquefaction 41,051,590 0 41,051,590 0 0 0 0 0 77,172 0 Non-specified (Transformation) 0 0 0 0 0 0 0 0 0 0
Energy Sector 0 0 0 0 0 0 0 0 0 0 Coal Mines 0 0 0 0 0 0 0 0 0 0 Oil and Gas Extraction 0 0 0 0 0 0 0 0 0 0 Patent Fuel Plants 0 0 0 0 0 0 0 0 0 0 Coke Ovens 0 0 0 0 0 0 0 0 0 0 Gas Works 0 0 0 0 0 0 0 0 0 0 BKB 0 0 0 0 0 0 0 0 0 0 Oil Refineries 0 0 0 0 0 0 0 0 0 0 Own use in Elec., CHP and Heat plant 0 0 0 0 0 0 0 0 0 0 Used for Pump Storage 0 0 0 0 0 0 0 0 0 0 Nuclear Industry 0 0 0 0 0 0 0 0 0 0 Non-specified (Energy) 0 0 0 0 0 0 0 0 0 0
Distribution Losses 0 0 0 0 0 0 0 0 0 0
Final Consumption 27,379,850 600,922 26,778,928 1,505,941 50,671 0 31,137 190,400 0 0
Industry Sector 20,489,267 453,659 20,035,608 1,505,941 50,361 0 31,137 0 0 0 Iron and Steel 4,815,535 242,456 4,573,079 1,505,941 22,836 0 31,137 0 0 0 Chemical and Petrochemical 5,577,087 66,447 5,510,640 0 9,109 0 0 0 0 0 Non-Ferrous Metals 0 0 0 0 0 0 0 0 0 0 Non-Metallic Minerals 1,953,496 86,873 1,866,623 0 6,151 0 0 0 0 0 Transport Equipment 0 0 0 0 0 0 0 0 0 0 Machinery 0 0 0 0 1,917 0 0 0 0 0 Mining and Quarrying 1,499,007 2,514 1,496,493 0 2,312 0 0 0 0 0 Food and Tobacco 0 0 0 0 924 0 0 0 0 0 Paper Pulp and Print 0 0 0 0 2,251 0 0 0 0 0 Wood and Wood Products 0 0 0 0 0 0 0 0 0 0 Construction 0 0 0 0 0 0 0 0 0 0 Textile and Leather 0 0 0 0 0 0 0 0 0 0 Non-specified (Industry) 6,644,142 55,369 6,588,773 0 4,860 0 0 0 0 0
Transport Sector 0 0 0 0 0 0 0 0 0 0 International Civil Aviation 0 0 0 0 0 0 0 0 0 0 Domestic Air Transport 0 0 0 0 0 0 0 0 0 0 Road 0 0 0 0 0 0 0 0 0 0 Rail 0 0 0 0 0 0 0 0 0 0 Pipeline Transport 0 0 0 0 0 0 0 0 0 0 Internal Navigation 0 0 0 0 0 0 0 0 0 0 Non-specified (Transport) 0 0 0 0 0 0 0 0 0 0
Other Sectors 6,890,583 147,263 6,743,320 0 310 0 0 190,400 0 0 Agriculture 116,147 0 116,147 0 0 0 0 0 0 0 Commerce and Public Services 2,258,145 49,088 2,209,058 0 310 0 0 0 0 0 Residential 4,516,291 98,175 4,418,115 0 0 0 0 190,400 0 0 Non-specified (Other) 0 0 0 0 0 0 0 0 0 0
Non-Energy Use 0 0 0 0 0 0 0 0 0 0 Memo:Non-Energy Use Ind/Transf/Ener 0 0 0 0 0 0 0 0 0 0 Memo:Non-Energy Use in Transport 0 0 0 0 0 0 0 0 0 0 Memo:Non-Energy Use in Oth.Sect. 0 0 0 0 0 0 0 0 0 0 Memo:Feedst.Use in Petchem. Ind. 5,577,087 66,447 5,510,640 0 0 0 0 0 0 0
Elect.Output in GWh 212,406 0 212,406 0 0 0 0 192 3 0 Elect.Output-public elec. plant 203,565 0 203,565 0 0 0 0 0 0 0 Elect.Output-autoprod. elec. plant 8,841 0 8,841 0 0 0 0 0 3 0 Elect.Output-public CHP plant 0 0 0 0 0 0 0 0 0 0 Elect.Output-autoprod. CHP plant 0 0 0 0 0 0 0 192 0 0 Heat Output-public CHP plant 0 0 0 0 0 0 0 0 0 0 Heat Output-autoproducer CHP plant 0 0 0 0 0 0 0 0 0 0 Heat Output-public heat plant 0 0 0 0 0 0 0 0 0 0 Heat Output-autoprod. heat plant 0 0 0 0 0 0 0 0 0 0
Energy Balance Format: International Energy Agency
ENERGY BALANCE - 2004 (Disaggregated, Natural Units)
Data Source: Department of Minerals and Energy (Version 1)
Digest of South African Energy Statistics - 2006
18
Supply & Consumption Crude Oil Natural Gas Non-Conventional LPG Petrol Avgas Jet Fuel Other Diesel Residual
Liquids Crude Kerosene Fueltons tons tons kl kl kl kl kl kl kl
Indigenous Production 0 183,203 0 564,172 11,554,692 12,391 2,246,365 792,202 8,526,883 4,265,280 From Other Sources 0 0 4,642,472 0 0 0 0 0 0 0 Import 23,589,797 0 0 142 751,389 23,358 170,094 12,704 554,264 127,028 Export -592 0 0 -712 -1,014,328 -13,325 -339,879 -7,431 -1,167,074 -1,617,496 Intl. Marine Bunkers 0 0 0 0 0 0 0 0 -231,747 -2,206,425 Stock Changes 0 0 0 0 0 0 0 0 0 0 Domestic Supply 23,589,205 183,203 4,642,472 563,601 11,291,753 22,424 2,076,580 797,474 7,682,327 568,386
Transfers 0 0 0 0 0 0 0 0 0 0 Statistical Differences 0 0 9,284,944 0 0 0 0 0 0 0
Transformation Sector 23,589,205 183,203 -4,642,472 0 0 0 0 0 0 0 Public Electricity Plant 0 0 0 0 0 0 0 0 0 0 Autoproducer Electricity Plant 0 0 0 0 0 0 0 0 0 0 Public CHP Plant 0 0 0 0 0 0 0 0 0 0 Autoproducer CHP Plant 0 0 0 0 0 0 0 0 0 0 Public Heat Plant 0 0 0 0 0 0 0 0 0 0 Autoproducer Heat Plant 0 0 0 0 0 0 0 0 0 0 Heat pumps 0 0 0 0 0 0 0 0 0 0 Electric Boilers 0 0 0 0 0 0 0 0 0 0 Patent Fuel Plants 0 0 0 0 0 0 0 0 0 0 Coke Ovens 0 0 0 0 0 0 0 0 0 0 Gas Works 0 0 0 0 0 0 0 0 0 0 For Blast Furnace Gas 0 0 0 0 0 0 0 0 0 0 Petrochemical Industry 0 0 0 0 0 0 0 0 0 0 For BKB 0 0 0 0 0 0 0 0 0 0 Oil Refineries 23,589,205 183,203 -4,642,472 0 0 0 0 0 0 0 Liquefaction 0 0 0 0 0 0 0 0 0 0 Non-specified (Transformation) 0 0 0 0 0 0 0 0 0 0
Energy Sector 0 0 0 0 0 0 0 0 0 0 Coal Mines 0 0 0 0 0 0 0 0 0 0 Oil and Gas Extraction 0 0 0 0 0 0 0 0 0 0 Patent Fuel Plants 0 0 0 0 0 0 0 0 0 0 Coke Ovens 0 0 0 0 0 0 0 0 0 0 Gas Works 0 0 0 0 0 0 0 0 0 0 BKB 0 0 0 0 0 0 0 0 0 0 Oil Refineries 0 0 0 0 0 0 0 0 0 0 Own use in Elec., CHP and Heat plant 0 0 0 0 0 0 0 0 0 0 Used for Pump Storage 0 0 0 0 0 0 0 0 0 0 Nuclear Industry 0 0 0 0 0 0 0 0 0 0 Non-specified (Energy) 0 0 0 0 0 0 0 0 0 0
Distribution Losses 0 0 0 0 0 0 0 0 0 0
Final Consumption 0 0 0 563,601 11,291,753 22,424 2,076,580 797,474 7,682,327 568,386
Industry Sector 0 0 0 7,135 19,700 0 0 17,356 934,484 8,517 Iron and Steel 0 0 0 0 0 0 0 0 0 0 Chemical and Petrochemical 0 0 0 0 0 0 0 0 0 0 Non-Ferrous Metals 0 0 0 0 0 0 0 0 0 0 Non-Metallic Minerals 0 0 0 0 0 0 0 0 0 0 Transport Equipment 0 0 0 0 0 0 0 0 0 0 Machinery 0 0 0 0 0 0 0 0 0 0 Mining and Quarrying 0 0 0 7,059 16,921 0 0 13,927 710,696 6,693 Food and Tobacco 0 0 0 0 0 0 0 0 0 0 Paper Pulp and Print 0 0 0 0 0 0 0 0 0 0 Wood and Wood Products 0 0 0 0 0 0 0 0 0 0 Construction 0 0 0 76 2,779 0 0 3,429 223,788 1,823 Textile and Leather 0 0 0 0 0 0 0 0 0 0 Non-specified (Industry) 0 0 0 0 0 0 0 0 0 0
Transport Sector 0 0 0 1 11,079,941 22,424 2,076,580 5,787 5,564,310 2,980 International Civil Aviation 0 0 0 0 0 0 945,181 0 0 0 Domestic Air Transport 0 0 0 0 0 22,424 1,131,399 0 0 0 Road 0 0 0 1 11,079,800 0 0 5,672 5,361,503 2,980 Rail 0 0 0 0 141 0 0 115 202,807 0 Pipeline Transport 0 0 0 0 0 0 0 0 0 0 Internal Navigation 0 0 0 0 0 0 0 0 0 0 Non-specified (Transport) 0 0 0 0 0 0 0 0 0 0
Other Sectors 0 0 0 556,465 192,112 0 0 774,331 1,183,533 556,889 Agriculture 0 0 0 69 147,766 0 0 85,609 1,085,197 43,200 Commerce and Public Services 0 0 0 49 19,245 0 0 2,579 46,372 512,710 Residential 0 0 0 556,347 25,101 0 0 686,144 51,964 979 Non-specified (Other) 0 0 0 0 0 0 0 0 0 0
Non-Energy Use 0 0 0 0 0 0 0 0 0 0 Memo:Non-Energy Use Ind/Transf/Ener 0 0 0 0 0 0 0 0 0 0 Memo:Non-Energy Use in Transport 0 0 0 0 0 0 0 0 0 0 Memo:Non-Energy Use in Oth.Sect. 0 0 0 0 0 0 0 0 0 0 Memo:Feedst.Use in Petchem. Ind. 0 0 0 0 0 0 0 0 0 0
Elect.Output in GWh 0 0 0 0 0 0 0 0 0 0 Elect.Output-public elec. plant 0 0 0 0 0 0 0 0 0 0 Elect.Output-autoprod. elec. plant 0 0 0 0 0 0 0 0 0 0 Elect.Output-public CHP plant 0 0 0 0 0 0 0 0 0 0 Elect.Output-autoprod. CHP plant 0 0 0 0 0 0 0 0 0 0 Heat Output-public CHP plant 0 0 0 0 0 0 0 0 0 0 Heat Output-autoproducer CHP plant 0 0 0 0 0 0 0 0 0 0 Heat Output-public heat plant 0 0 0 0 0 0 0 0 0 0 Heat Output-autoprod. heat plant 0 0 0 0 0 0 0 0 0 0
Energy Balance Format: International Energy Agency
ENERGY BALANCE - 2004 (Disaggregated, Natural Units) - Continued
Data Source: Department of Minerals and Energy (Version 1)

Digest of South African Energy Statistics - 2006
19
Supply & Consumption White Lubricants Bitumen Parrafin Other Petroleum Nuclear Hydro Solar Wind Electricity
Spirit Wax productskl tons tons tons tons GWh GWh GWh GWh MWh
Indigenous Production 94,267 376,140 411,997 86,192 17,855 40,500 4,625 1,043,000 32 231,155,789 From Other Sources 0 0 0 0 0 0 0 0 0 0 Import 1,279 120,347 115 25,530 0 0 0 0 0 9,818,000 Export -3,372 -91,146 -135,131 -99,509 0 0 0 0 0 -13,254,000 Intl. Marine Bunkers 0 0 0 0 0 0 0 0 0 0 Stock Changes 0 0 0 0 0 0 0 0 0 0 Domestic Supply 92,174 405,341 276,981 12,213 17,855 40,500 4,625 1,043,000 32 227,719,789
Transfers 0 0 0 0 0 0 0 0 0 0 Statistical Differences 0 0 0 0 0 0 0 0 0 -20,960,492
Transformation Sector 0 0 0 0 0 40,500 4,625 0 32 4,715,014 Public Electricity Plant 0 0 0 0 0 40,500 4,452 0 0 0 Autoproducer Electricity Plant 0 0 0 0 0 0 173 0 32 4,715,014 Public CHP Plant 0 0 0 0 0 0 0 0 0 0 Autoproducer CHP Plant 0 0 0 0 0 0 0 0 0 0 Public Heat Plant 0 0 0 0 0 0 0 0 0 0 Autoproducer Heat Plant 0 0 0 0 0 0 0 0 0 0 Heat pumps 0 0 0 0 0 0 0 0 0 0 Electric Boilers 0 0 0 0 0 0 0 0 0 0 Patent Fuel Plants 0 0 0 0 0 0 0 0 0 0 Coke Ovens 0 0 0 0 0 0 0 0 0 0 Gas Works 0 0 0 0 0 0 0 0 0 0 For Blast Furnace Gas 0 0 0 0 0 0 0 0 0 0 Petrochemical Industry 0 0 0 0 0 0 0 0 0 0 For BKB 0 0 0 0 0 0 0 0 0 0 Oil Refineries 0 0 0 0 0 0 0 0 0 0 Liquefaction 0 0 0 0 0 0 0 0 0 0 Non-specified (Transformation) 0 0 0 0 0 0 0 0 0 0
Energy Sector 0 0 0 0 0 0 0 0 0 11,964,304 Coal Mines 0 0 0 0 0 0 0 0 0 0 Oil and Gas Extraction 0 0 0 0 0 0 0 0 0 0 Patent Fuel Plants 0 0 0 0 0 0 0 0 0 0 Coke Ovens 0 0 0 0 0 0 0 0 0 0 Gas Works 0 0 0 0 0 0 0 0 0 0 BKB 0 0 0 0 0 0 0 0 0 0 Oil Refineries 0 0 0 0 0 0 0 0 0 7,574,380 Own use in Elec., CHP and Heat plant 0 0 0 0 0 0 0 0 0 351 Used for Pump Storage 0 0 0 0 0 0 0 0 0 4,389,573 Nuclear Industry 0 0 0 0 0 0 0 0 0 0 Non-specified (Energy) 0 0 0 0 0 0 0 0 0 0
Distribution Losses 0 0 0 0 0 0 0 0 0 5,268,000
Final Consumption 92,174 405,341 276,981 12,213 17,855 0 0 1,043,000 0 226,732,963
Industry Sector 713 62,189 163,959 158 1 0 0 0 0 134,384,901 Iron and Steel 0 0 0 0 0 0 0 0 0 23,270,810 Chemical and Petrochemical 0 0 0 0 0 0 0 0 0 9,888,910 Non-Ferrous Metals 0 0 0 0 0 0 0 0 0 17,952,780 Non-Metallic Minerals 0 0 0 0 0 0 0 0 0 2,194,670 Transport Equipment 0 0 0 0 0 0 0 0 0 84,560 Machinery 0 0 0 0 0 0 0 0 0 42,550 Mining and Quarrying 665 52,986 0 0 1 0 0 0 0 32,827,670 Food and Tobacco 0 0 0 0 0 0 0 0 0 719,920 Paper Pulp and Print 0 0 0 0 0 0 0 0 0 1,512,530 Wood and Wood Products 0 0 0 0 0 0 0 0 0 289,950 Construction 48 9,203 163,959 158 0 0 0 0 0 51,810 Textile and Leather 0 0 0 0 0 0 0 0 0 525,070 Non-specified (Industry) 0 0 0 0 0 0 0 0 0 45,023,671
Transport Sector 101 313,415 0 0 0 0 0 0 0 6,302,493 International Civil Aviation 0 0 0 0 0 0 0 0 0 0 Domestic Air Transport 0 0 0 0 0 0 0 0 0 43,100 Road 92 310,020 0 0 0 0 0 0 0 20,240 Rail 9 3,395 0 0 0 0 0 0 0 3,292,660 Pipeline Transport 0 0 0 0 0 0 0 0 0 80,580 Internal Navigation 0 0 0 0 0 0 0 0 0 50,380 Non-specified (Transport) 0 0 0 0 0 0 0 0 0 2,815,533
Other Sectors 91,359 29,737 113,022 12,055 17,854 0 0 1,043,000 0 86,045,569 Agriculture 4,288 27,721 197 0 1 0 0 0 0 6,158,946 Commerce and Public Services 87,071 2,004 108,926 12,055 17,852 0 0 0 0 24,989,734 Residential 0 12 3,899 0 0 0 0 1,043,000 0 36,231,227 Non-specified (Other) 0 0 0 0 0 0 0 0 0 18,665,662
Non-Energy Use 92,174 405,341 0 0 17,855 0 0 0 0 0 Memo:Non-Energy Use Ind/Transf/Ener 92,174 405,341 0 0 17,855 0 0 0 0 0 Memo:Non-Energy Use in Transport 0 0 0 0 0 0 0 0 0 0 Memo:Non-Energy Use in Oth.Sect. 0 0 0 0 0 0 0 0 0 0 Memo:Feedst.Use in Petchem. Ind. 0 0 0 0 0 0 0 0 0 0
Elect.Output in GWh 0 0 0 0 0 13,365 4,625 532 32 231,156 Elect.Output-public elec. plant 0 0 0 0 0 13,365 4,452 532 32 221,946 Elect.Output-autoprod. elec. plant 0 0 0 0 0 0 173 0 0 9,017 Elect.Output-public CHP plant 0 0 0 0 0 0 0 0 0 0 Elect.Output-autoprod. CHP plant 0 0 0 0 0 0 0 0 0 192 Heat Output-public CHP plant 0 0 0 0 0 0 0 0 0 0 Heat Output-autoproducer CHP plant 0 0 0 0 0 0 0 0 0 0 Heat Output-public heat plant 0 0 0 0 0 0 0 0 0 0 Heat Output-autoprod. heat plant 0 0 0 0 0 0 0 0 0 0
Energy Balance Format: International Energy Agency
ENERGY BALANCE - 2004 (Disaggregated, Natural Units) - Concluded
Data Source: Department of Minerals and Energy (Version 1)

Digest of South African Energy Statistics - 2006
20
Notes

Digest of South African Energy Statistics - 2006
21
Section 4 Coal South Africa’s indigenous energy resource base is dominated by coal. Many of the deposits can be exploited at extremely favourable costs. As a result, a large coal-mining industry has developed. Coal for local electricity production is among the cheapest in the world. The country ranks as the world’s fifth largest coal producer. In addition to the extensive use of coal in the domestic economy, large amounts are exported, mainly through the Richards Bay Coal Terminal. South Africa is ranked the fourth-largest exporter of steam coal. South Africa’s coal comes from collieries ranging in output from 100 000 to more than 10 million tons per year. With mergers and purchases, the number of operating collieries was 64 in 2004. The coal-mining industry is highly concentrated, with three companies – Ingwe (BHP Billiton), Anglo Coal, Sasol, Eyeziswe and Kumba – accounting for 85% of local production. A relatively small number of large-scale producers supply coal, primarily to the electricity and synthetic fuel producers. About 51% of South African coal mining is underground and the rest is opencast. Of the coal mined underground, some 50% is produced by long walling, 5% by pillar recovery, and 35% by bord-and-pillar mining and the remainder by other methods. The beneficiation of coal, particularly for export, results in more than 65 Mt of coal discards being produced annually. Of the run-of-mine coal produced, 21% goes to the export market, and 21% is used for local demand (excluding power-station coal). The rest is not saleable and is therefore discarded. Total discards could reach 2 000 Mt by the year 2020. Ways to make use of these discards are therefore being investigated. The Minerals and Petroleum Resources Development Act will regulate mining rights in future, and all mineral rights will be vested in the state. According to the Bill, the principle of ‘use it and keep it’ will be applicable to all existing mineral rights holders.

Digest of South African Energy Statistics - 2006
22
2003 % 2004 %Export 71,530 29.6% 67,946 27.3%Electricity Generation 103,073 42.6% 109,974 44.2%Liquefaction 39,582 16.4% 41,051 16.5%Other transformation 2,468 1.0% 2,633 1.1%Final consumption 25,378 10.5% 27,379 11.0%Total 242,031 248,983Source: National Energy Balances
Coal Utilisation- Kt
Coal Utilisation 2004
Other transformation
1.1%
Final consumption
11.0%
Liquefaction16.5%
Electricity Generation
44.2%
Export27.3%

Digest of South African Energy Statistics - 2006
23
Year Production Exports Production Exports Production Exports1992 171.10 47.38 3.32 2.26 174.42 49.641993 179.03 50.10 3.25 2.09 182.28 52.191994 193.52 52.79 2.22 2.04 195.75 54.841995 204.07 57.66 2.14 2.02 206.21 59.681996 203.90 58.02 2.47 2.20 206.36 60.221997 217.87 63.15 2.00 1.65 219.87 64.801998 222.79 64.76 2.04 1.38 224.83 66.131999 220.40 63.80 1.87 1.11 222.27 64.912000 222.52 68.78 1.62 1.12 224.14 69.912001 222.11 68.24 1.46 0.97 223.56 69.212002 218.91 68.47 1.30 0.76 220.21 69.232003 237.54 70.95 1.21 0.58 238.75 71.532004 241.57 67.03 1.25 0.92 242.82 67.95
Sources: Mineral Bureau
Bituminous Anthracite TotalProduction and Exports of Coal-Mt
Coal Production and Exports
0.00
50.00
100.00
150.00
200.00
250.00
300.00
350.00
1992
1993
1994
1995
1996
1997
1998
1999
2000
2001
2002
2003
2004
Mt
Exports
Production
Digest of South African Energy Statistics - 2006
24
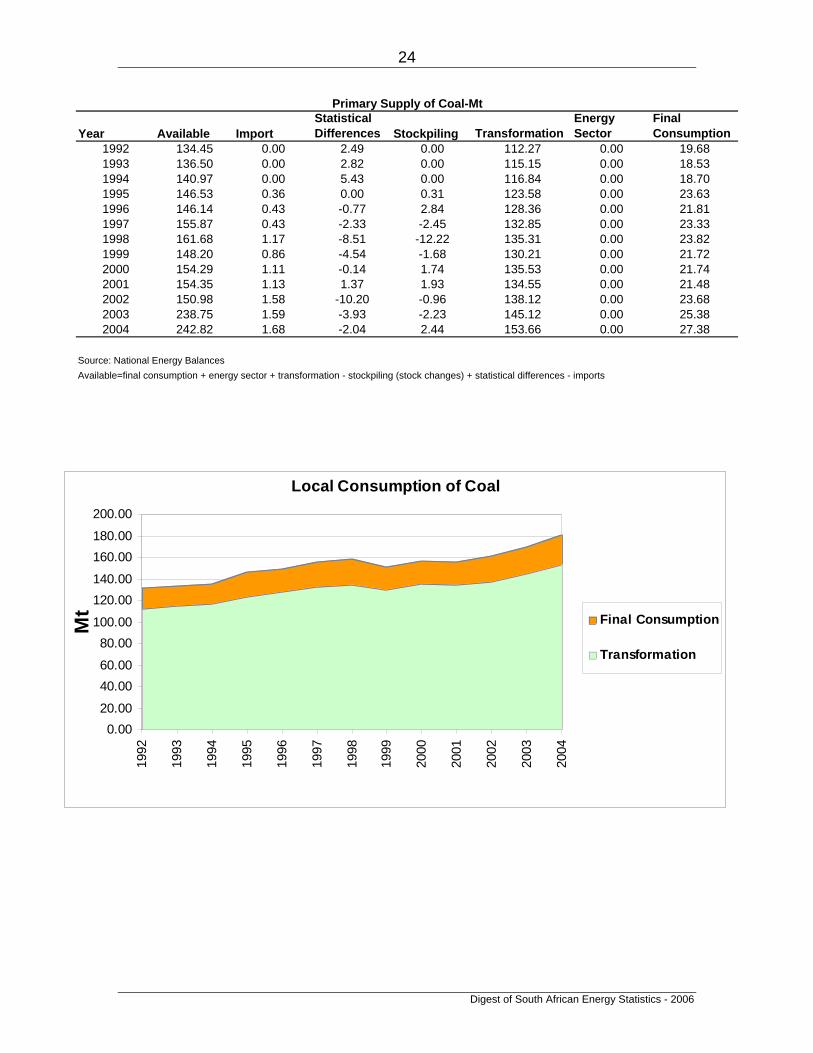
Year Available ImportStatistical Differences Stockpiling Transformation
Energy Sector
Final Consumption
1992 134.45 0.00 2.49 0.00 112.27 0.00 19.681993 136.50 0.00 2.82 0.00 115.15 0.00 18.531994 140.97 0.00 5.43 0.00 116.84 0.00 18.701995 146.53 0.36 0.00 0.31 123.58 0.00 23.631996 146.14 0.43 -0.77 2.84 128.36 0.00 21.811997 155.87 0.43 -2.33 -2.45 132.85 0.00 23.331998 161.68 1.17 -8.51 -12.22 135.31 0.00 23.821999 148.20 0.86 -4.54 -1.68 130.21 0.00 21.722000 154.29 1.11 -0.14 1.74 135.53 0.00 21.742001 154.35 1.13 1.37 1.93 134.55 0.00 21.482002 150.98 1.58 -10.20 -0.96 138.12 0.00 23.682003 238.75 1.59 -3.93 -2.23 145.12 0.00 25.382004 242.82 1.68 -2.04 2.44 153.66 0.00 27.38
Source: National Energy BalancesAvailable=final consumption + energy sector + transformation - stockpiling (stock changes) + statistical differences - imports
Primary Supply of Coal-Mt
Local Consumption of Coal
0.0020.00
40.0060.00
80.00100.00
120.00140.00
160.00180.00
200.00
1992
1993
1994
1995
1996
1997
1998
1999
2000
2001
2002
2003
2004
Mt Final Consumption
Transformation

Digest of South African Energy Statistics - 2006
25
Year EskomOther
electricity Electricity Total Liquefication Gas Coke Total1992 72,919 3,917 76,836 24,457 6,112 4,866 112,2711993 77,294 3,407 80,701 25,317 4,433 4,702 115,1541994 79,140 3,424 82,564 25,506 4,483 4,283 116,8361995 82,603 3,833 86,436 28,051 4,868 4,220 123,5761996 87,214 3,679 90,893 28,526 4,982 3,958 128,3591997 91,870 3,781 95,651 27,766 5,363 4,072 132,8531998 95,556 4,075 99,631 27,541 4,799 3,337 135,3091999 90,057 4,208 94,265 28,557 4,938 2,446 130,2072000 93,845 4,298 98,143 29,878 4,941 2,569 135,5322001 87,362 1,912 89,275 41,682 849 2,746 134,5512002 90,619 2,107 92,726 41,515 952 2,926 138,1192003 99,705 3,369 103,074 39,582 0 2,468 145,1242004 107,332 2,642 109,974 41,052 0 2,633 153,659
Source: National Energy Balances
Transformation Sector Coal Use-Kt
Transformation use of Coal
0
20,000
40,000
60,000
80,000
100,000
120,000
140,000
160,000
180,000
1992 1993 1994 1995 1996 1997 1998 1999 2000 2001 2002 2003 2004
Kt
CokeGasLiqueficationElectricity Total

Digest of South African Energy Statistics - 2006
26
Year Industry Transport Agriculture Commerce Domestic Total
1996 18,039 23 242 1,302 2,200 21,8071997 19,479 2 241 1,356 2,250 23,3271998 20,814 23 182 935 1,870 23,8241999 19,289 0 100 777 1,553 21,7182000 19,364 0 69 770 1,541 21,7442001 17,574 2 101 1,315 2,487 21,4792002 18,564 0 90 1,694 3,332 23,6812003 19,477 0 122 1,945 3,835 25,3792004 20,489 0 166 2,258 4,516 27,430
Source: National Energy Balances
Final Demand for Coal by Sector- Kt
Sectoral Consumption
0
5,000
10,000
15,000
20,000
25,000
30,000
1996
1997
1998
1999
2000
2001
2002
2003
2004
Kt Domestic
CommerceAgricultureTransportIndustry

Digest of South African Energy Statistics - 2006
27
YearIron and
Steel Chemicalof which
Feedstock
Non- Metallic Minerals Mining
Not Specified Total
1992 2,294 5,809 4,148 1,597 506 2,530 12,7361993 2,433 6,540 5,165 1,470 470 2,257 13,1711994 3,487 6,294 5,203 1,723 388 1430 13,3231995 3,507 8,929 7,349 1,607 603 1,708 16,3541996 2,709 9,290 7,625 1,206 555 4,280 18,0391997 1,758 8,973 7,617 1,072 1,248 6,428 19,4791998 3,747 9,702 7,555 1,259 1,517 4,589 20,8141999 4,332 8,974 7,834 1,298 751 3,934 19,2892000 4,277 9,376 8,196 1,248 145 4,318 19,3642001 4,373 7,213 7,213 1,073 1,528 3,387 17,5742002 4,728 6,961 6,961 1,079 1,508 4,287 18,5642003 4,325 7,000 7,000 1,685 1,416 5,050 19,4772004 4,816 5,577 5,577 1,953 1,499 6,644 20,489
Source: National Energy Balances
Industrial Sector Use of Coal-kt
Industrial Consumption
0
5,000
10,000
15,000
20,000
25,000
30,000
1992
1993
1994
1995
1996
1997
1998
1999
2000
2001
2002
2003
2004
Kt
Not SpecifiedMiningNon- Metallic Mineralsof which FeedstockChemicalIron and Steel

Digest of South African Energy Statistics - 2006
28
Year Eskom Other
Total Electricity Generation Town Gas
Iron and Steel
Merchants and Domestics Industry Mining Metallurgical Synthetic Transport
Total Inland Consumption
1990 69,075 2,176 71,251 116 6,953 6,963 6,174 452 2,533 40,287 69 134,7971991 69,248 2,039 71,287 49 6,826 7,095 6,075 422 1,696 39,120 36 132,6041992 67,389 1,882 69,271 45 5,791 6,451 6,177 506 1,370 39,960 9 129,5801993 72,206 1,389 73,595 45 4,937 4,823 5,457 470 2,142 40,249 94 131,8121994 76,998 2,249 79,247 62 5,767 4,415 517 388 2,003 41,734 42 134,1741995 80,629 2,193 82,821 60 5,822 6,674 5,172 603 1,509 43,356 54 146,0711996 81,274 2,100 83,374 10 4,877 5,269 5,557 506 1,313 45,640 17 146,5641997 91,272 2,264 93,535 4,725 6,787 7,325 1,257 1,719 44,329 2 159,6791998 91,049 2,213 93,262 37 4,350 4,749 6,272 1,517 1,620 45,544 23 157,3741999 91,768 1,719 93,487 0.4 3,678 4,268 5,076 764 1,406 46,559 155,2382000 91,811 1,556 93,367 0 4,465 3,920 5,175 145 1,272 46,335 154,6802001 87,362 1,912 89,274 0 4,373 3,802 3,387 1,528 1,073 41,682 2 145,1222002 90,619 2,107 92,726 0 4,728 5,026 4,287 1,508 1,079 41,515 150,8702003 99,705 3,369 103,074 0 4,325 5,780 5,050 1,416 1,685 39,582 160,9122004 107,332 2,642 109,974 0 4,816 6,774 6,644 1,499 1,953 41,051 172,712
Source: Minerals Bureau
Historical Consumption of Coal
Historical Consumption of Coal
0
20,000
40,000
60,000
80,000
100,000
120,000
140,000
160,000
180,000
200,000
1990 1991 1992 1993 1994 1995 1996 1997 1998 1999 2000 2001 2002 2003 2004
Kt
TransportSyntheticMetallurgicalMiningIndustryMerchants and DomesticsIron and SteelTown GasTotal Electricity Generation
Digest of South African Energy Statistics - 2006
29
Notes

Digest of South African Energy Statistics - 2006
30
Section 5 Oil South Africa has very limited oil reserves and about 95% of its crude oil requirements are met by imports from the Middle East and Africa (Saudi Arabia, Iran, Kuwait, the United Arab Emirates, Yemen, Qatar, Iraq, Nigeria, Egypt and Angola). Refined petroleum products such as petrol, diesel, residual fuel oil, paraffin, jet fuel, aviation gasoline, liquefied petroleum gas (LPG) and refinery gas are produced by the following methods:
• Crude oil refining (Oil refineries) • Coal to liquid fuels and gas to liquid fuels (Sasol) • Natural gas to liquid fuels (PetroSA)
The major players and capacities (measured in barrels per day) of South Africa’s oil refineries are indicated below. South African oil refineries and their capacities
Refinery Location Owners Capacity (1 000 barrels per day) 1992 1997 2000 2002 2004
Sapref Durban BP & Shell 120 165 180 180 180 Enref Durban Engen 70 105 105 125 135 Calref Cape Town Caltex 50 100 100 100 100 Natref Sasolburg Sasol &Total 78 86 86 103 108 Sasol Secunda Sasol *150 *150 *150 150 *150 PetroSA Mossel Bay State-owned *45 *45 *45 45 *45 *Crude equivalent Note: These figures reflect the expansion in capacity at conventional refineries. PetroSA came on stream in the fourth quarter of 1992.
Source: South African Petroleum Industry Association Another major role player in South Africa’s liquid fuels industry is the Central Energy Fund (Pty) Ltd (CEF). It is mandated by the state to engage in the acquisition, exploration, generation, manufacture, marketing and distribution of any energy form, especially oil and gas. It also engages in research relating to the energy sector. The CEF’s diversified portfolio of activities is housed in the following active subsidiaries:
• Strategic Fuel Fund Association (SFF) The SFF was established to procure and store crude oil and to manage strategic crude oil stocks for South Africa. It trades and leases spare storage ullage and is involved in oil pollution control.
Digest of South African Energy Statistics - 2006
31
• The Petroleum Oil and Gas Corporation of South Africa (Pty) Ltd (PetroSA)
PetroSA owns and operates the world’s largest gas-to-liquids plant at Mossel Bay (a harbour town 400 km east of Cape Town). PetroSA is also involved in oil and gas exploration and production and its offshore production platform supplies gas and condensate by pipeline to its onshore plant for conversion into a range of environmentally friendly transportation fuels and associated products for the domestic as well as international markets. • Petroleum Agency South Africa (Pasa) This agency promotes and markets exploration in South African territory – both offshore and onshore – for oil and gas, negotiates and monitors concessions and licenses on behalf of the government, and is the custodian of geological and geophysical data. • iGas iGas is a state owned entity for the development of gas infrastructure in South Africa. iGas has partnered Sasol and ENH of Mozambique in the natural gas pipeline from Mozambique to South Africa. The Mozambique/South Africa gas transmission pipeline was brought into official operation on 26 March 2004.
The wholesale and retail markets for petroleum products in South Africa are subject to a set of government controls. The government regulates wholesale margins and controls the retail price of petrol. The industry has entered into product exchange agreements to serve different markets. Together, these controls provide for access to fuel throughout the county and protect consumers, while providing a reasonable return on investment to the oil industry and enhancing opportunities for employment. The refiners and wholesale marketers move product from the refineries by coastal barge, rail, truck and pipeline to roughly 200 depots. From these, approximately 4 600 service stations and 100 000 direct consumers (mostly farmers) are served. Refineries and Sasol produce LPG and illuminating paraffin (kerosene). Most LPG is consumed in the country and the rest is used in refineries as fuel and/or exported to neighbouring countries. Kerosene and LPG are distributed via a very long chain, with many middlemen between the producer and the end-user. Kerosene is often purchased by end-users in self-owned used plastic or glass containers.
Digest of South African Energy Statistics - 2006
32
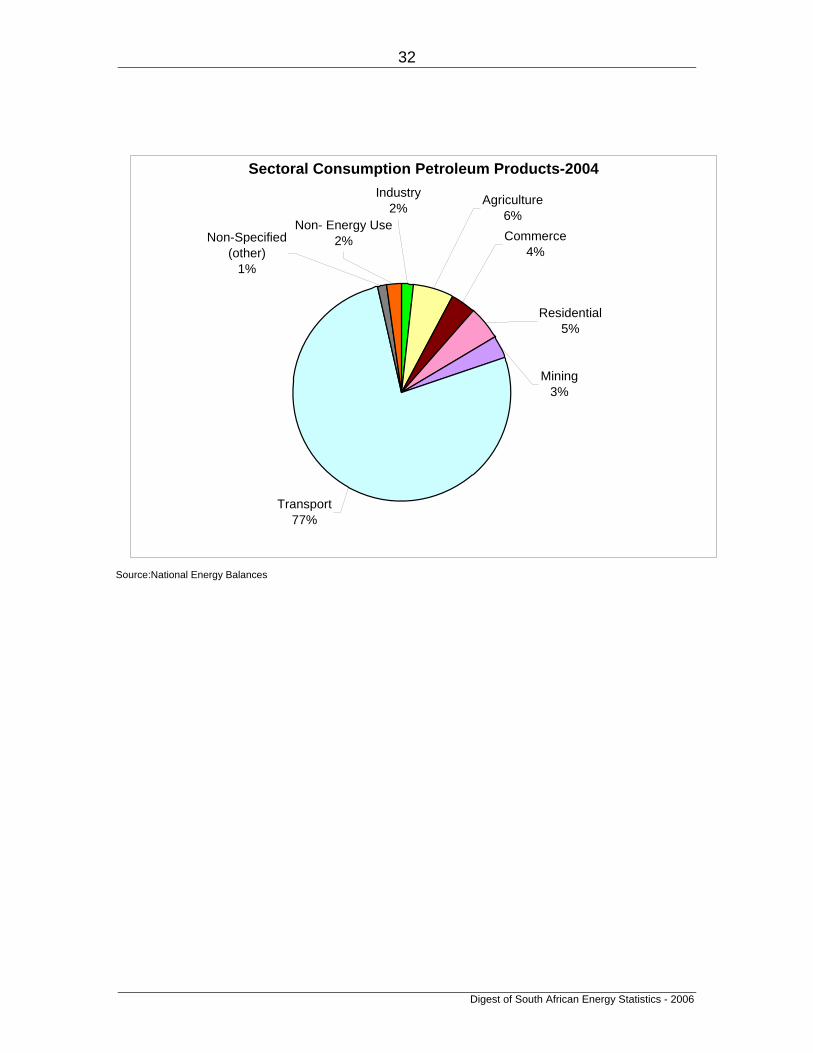
Source:National Energy Balances
Sectoral Consumption Petroleum Products-2004
Transport77%
Non- Energy Use2%
Agriculture6%
Non-Specified (other)
1%
Industry2%
Commerce4%
Residential 5%
Mining3%

Digest of South African Energy Statistics - 2006
33
YearNon-energy
use Agriculture Transport Mining Residential Commerce
Non-Specified
(other) Industry1992 28,938 57,421 458,436 16,812 28,832 132 150 41,0911993 26,983 58,770 467,640 16,446 29,470 142 0 42,9791994 29,109 57,811 485,877 17,477 30,800 503 0 46,2771995 28,357 58,301 546,417 17,862 33,625 182 0 44,9841996 31,600 62,750 548,162 18,677 30,682 148 0 55,1231997 29,828 57,655 567,087 20,453 31,820 1,226 0 52,1421998 26,100 54,215 582,419 20,342 27,033 369 3,403 55,6091999 24,740 51,413 589,823 20,822 30,506 206 4,231 48,3132000 22,352 48,009 584,476 21,927 25,214 151 2,477 26,8342001 29,721 52,229 600,792 27,068 37,779 32,852 0 14,9302002 31,687 53,730 613,816 28,231 35,909 32,162 0 15,4012003 31,000 53,162 636,486 30,673 39,637 34,062 9,328 16,4612004 20,000 52,661 675,863 30,795 43,278 32,295 11,633 15,796
Source: National Energy Balances
Sectoral Consumption of Petroleum Products-TJ
Sectoral Consumption of Petroleum products
0
100,000
200,000
300,000
400,000
500,000
600,000
700,000
800,000
900,000
1,000,000
1992
1993
1994
1995
1996
1997
1998
1999
2000
2001
2002
2003
2004
TJ
IndustryNon-Specified (other)CommerceResidentialMiningTransport AgricultureNon-energy use
Digest of South African Energy Statistics - 2006
34
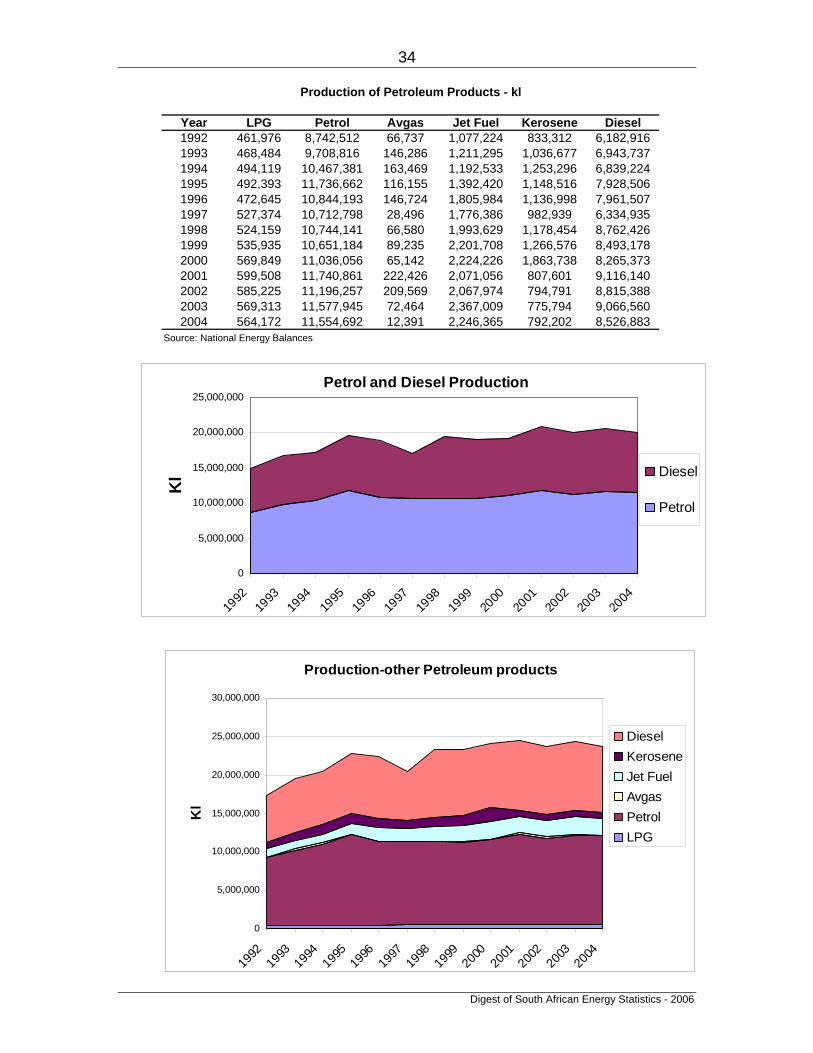
Year LPG Petrol Avgas Jet Fuel Kerosene Diesel1992 461,976 8,742,512 66,737 1,077,224 833,312 6,182,9161993 468,484 9,708,816 146,286 1,211,295 1,036,677 6,943,7371994 494,119 10,467,381 163,469 1,192,533 1,253,296 6,839,2241995 492,393 11,736,662 116,155 1,392,420 1,148,516 7,928,5061996 472,645 10,844,193 146,724 1,805,984 1,136,998 7,961,5071997 527,374 10,712,798 28,496 1,776,386 982,939 6,334,9351998 524,159 10,744,141 66,580 1,993,629 1,178,454 8,762,4261999 535,935 10,651,184 89,235 2,201,708 1,266,576 8,493,1782000 569,849 11,036,056 65,142 2,224,226 1,863,738 8,265,3732001 599,508 11,740,861 222,426 2,071,056 807,601 9,116,1402002 585,225 11,196,257 209,569 2,067,974 794,791 8,815,3882003 569,313 11,577,945 72,464 2,367,009 775,794 9,066,5602004 564,172 11,554,692 12,391 2,246,365 792,202 8,526,883
Source: National Energy Balances
Production of Petroleum Products - kl
Petrol and Diesel Production
0
5,000,000
10,000,000
15,000,000
20,000,000
25,000,000
1992
1993
1994
1995
1996
1997
1998
1999
2000
2001
2002
2003
2004
Kl Diesel
Petrol
Production-other Petroleum products
0
5,000,000
10,000,000
15,000,000
20,000,000
25,000,000
30,000,000
1992
1993
1994
1995
1996
1997
1998
1999
2000
2001
2002
2003
2004
Kl
DieselKeroseneJet FuelAvgasPetrolLPG

Digest of South African Energy Statistics - 2006
35
Year Petrol Avgas Kerosene Diesel HFO1992 688,804 2,024 50,717 390,711 83,2491993 328,878 4,251 25,366 168,419 61,0511994 191,442 18,976 31,602 51,319 40,4441995 134,752 21,127 0 75,568 120,3971996 630,213 18,591 37,375 267,283 93,0621998 786,598 4,788 37,132 70,217 90,0401999 962,332 2,833 48 12,302 315,7762000 179,442 119 40,043 159,847 15,5422001 354,669 0 0 781,413 18,0422002 283,843 3 16 567,643 83,6702003 369,634 7 1 311 107,5242004 751,389 23,358 12,704 554,264 127,028Source: National Energy Balances
Note: No import data available for 1997
Imports of Petroleum Products -kl
Imports of Petroleum Products
0
200,000
400,000
600,000
800,000
1,000,000
1,200,000
1,400,000
1,600,000
1992
1993
1994
1995
1996
1998
1999
2000
2001
2002
2003
2004
Kl
HFO
Diesel
Kerosene
Avgas
Petrol

Digest of South African Energy Statistics - 2006
36
Year Petrol Avgas Kerosene Diesel HFO1992 260,880 41,497 183,532 1,177,748 1,172,3331993 835,627 125,712 207,950 1,780,123 338,2761994 1,029,258 156,052 382,172 1,259,269 811,1511995 927,061 111,221 285,306 1,998,842 331,9621996 907,651 140,158 242,353 2,007,313 231,4701998 647,536 44,882 154,160 2,641,754 214,8531999 764,900 65,321 205,935 2,120,916 2,281,7422000 828,333 40,623 1,047,957 1,847,896 2,497,6992001 1,761,203 196,459 21,120 3,099,197 2,172,3712002 1,144,695 184,718 48,637 2,311,307 5,390,4762003 1,278,629 49,941 6,670 1,519,573 2,411,2782004 1,014,328 13,325 7,431 1,167,074 1,617,496
Source: National Energy BalancesNotes : No export data available for 1997
Exports of Petroleum Products - kl
Exports of Petroleum Products
0
1,000,000
2,000,000
3,000,000
4,000,000
5,000,000
6,000,000
7,000,000
8,000,000
9,000,000
10,000,000
1992 1993 1994 1995 1996 1998 1999 2000 2001 2002 2003 2004
Kl
HFO
Diesel
Kerosene
Avgas
Petrol

Digest of South African Energy Statistics - 2006
37
Year LPG Petrol Avgas Jet Fuel Kerosene Diesel HFO1992 461,976 9,170,436 27,264 999,950 764,887 4,985,184 560,1091993 468,484 9,202,067 24,825 1,211,295 854,093 4,976,806 591,8451994 494,119 9,629,565 26,393 1,192,533 902,726 5,139,875 644,5611995 492,393 10,944,353 26,062 1,392,420 863,210 5,482,687 615,9391996 472,645 10,566,755 25,157 1,601,006 932,020 5,809,638 719,7251997 527,374 10,712,798 28,496 1,776,386 982,939 5,912,661 634,3001998 524,159 10,883,203 26,486 1,876,601 1,061,426 5,959,204 615,5361999 535,935 10,848,616 26,747 1,995,820 1,060,688 5,984,367 561,7282000 569,849 10,387,164 24,638 1,975,064 855,824 6,230,110 24,5272001 599,508 10,334,327 25,967 1,922,397 786,481 6,486,015 563,7452002 585,562 10,355,404 24,854 1,967,292 746,169 6,830,544 535,6642003 568,701 10,668,950 22,530 2,085,135 769,125 7,263,272 527,5132004 563,601 11,291,753 22,424 2,076,580 797,474 7,682,327 568,386
Sources: National Energy Balances
Domestic Supply of Petroleum Products-kl
Domestic Supply of Petrol and Diesel
0
2,000,000
4,000,000
6,000,000
8,000,000
10,000,000
12,000,000
14,000,000
16,000,000
18,000,000
20,000,000
1992
1993
1994
1995
1996
1997
1998
1999
2000
2001
2002
2003
2004
Kl
Diesel
Petrol
Domestic Supply of Petroleum Products 2004
Jet Fuel9%
Diesel34%
Avgas0%
HFO2%
LPG2%
Petrol 50%
Kerosene3%
LPG
Petrol
Avgas
Jet Fuel
Kerosene
Diesel
HFO

Digest of South African Energy Statistics - 2006
38
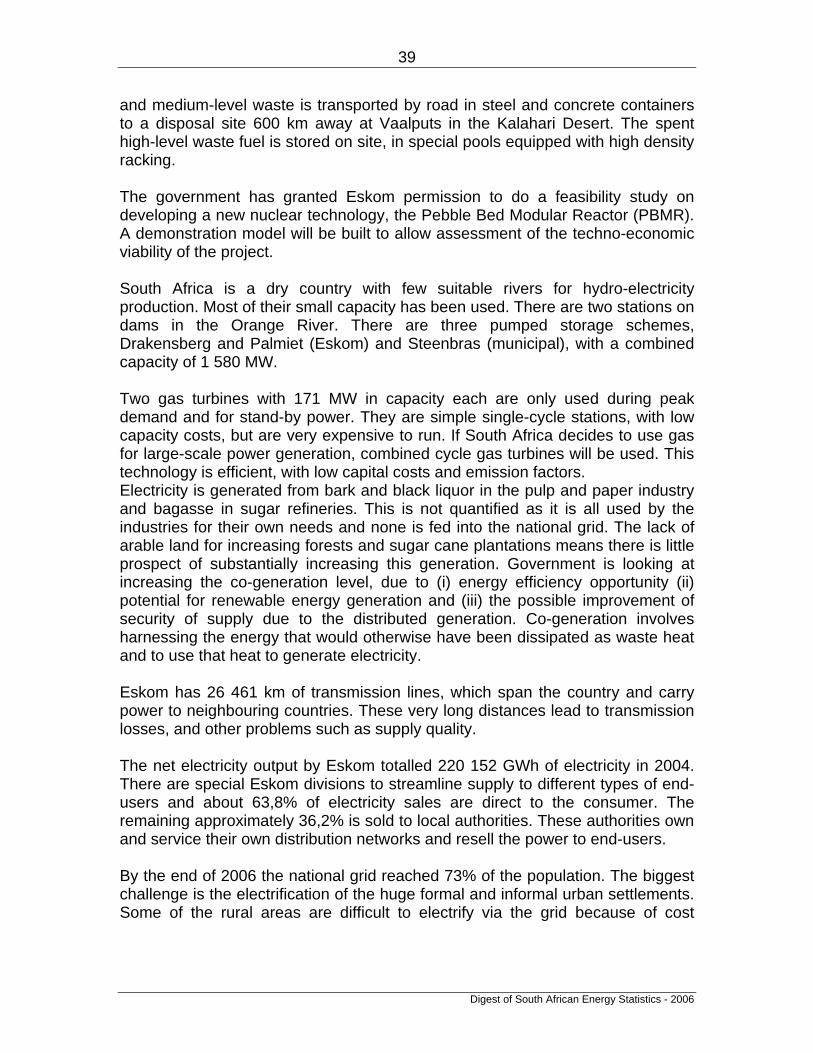
Section 6 Electricity Eskom is the public electricity utility and supplies more than 95% of the country’s electricity requirements. This amounts to more that half of the electricity generated in Africa. With 24 power stations at a capacity of 39 810 MW, Eskom is among the top seven utilities in the world in terms of generation capacity and among the top nine in terms of sales. It is also one of the four cheapest electricity producers worldwide and currently has surplus generation capacity. This surplus will no longer exist in 2007. Although Eskom is still a parastatal, the government has plans to restructure part of the company in line with the envisage Electricity Supply Industry model. The table below shows the current generation capacity by energy source. The nominal generation capacity of Eskom is not being met because some power stations have been mothballed and some are running below capacity because the capacity is not needed.
Analysis of South African licensed electricity capacity by fuel
Energy source Capacity (MW) Coal 38 209 Nuclear 1 800 Bagasse 105 Hydro 668 Gas turbines 660 Pumped storage 1 580 Total 43 022
Source: National Electricity Regulator, 2004
Eskom owns thirteen coal-fired power stations, 11 located in Mpumalanga and one each in the Free State and Limpopo. Three of the older stations in Mpumalanga have been mothballed owing to surplus capacity. Camdem (1 600 MW), Grootvlei (1 200 MW) and Komati (1 000 MW) are in working order and will be brought on stream as more capacity is needed. There are currently plans to build new coal-fired, gas and pumped storage power stations to meet electricity growth demand projected at 1 500MW per annum.
Most thermal stations are located in Mpumalanga, close to the coalfields, because their coal requirements are immense. This means that electricity has to be transmitted long distances to the rest of the country and throughout Africa. Eskom owns a nuclear power station, Koeberg, located approximately 25 km northwest of Cape Town. It uses a standard pressurised water reactor and supplies electricity to the Western Cape. The fuel used is enriched uranium. Low-
Digest of South African Energy Statistics - 2006
39
and medium-level waste is transported by road in steel and concrete containers to a disposal site 600 km away at Vaalputs in the Kalahari Desert. The spent high-level waste fuel is stored on site, in special pools equipped with high density racking. The government has granted Eskom permission to do a feasibility study on developing a new nuclear technology, the Pebble Bed Modular Reactor (PBMR). A demonstration model will be built to allow assessment of the techno-economic viability of the project. South Africa is a dry country with few suitable rivers for hydro-electricity production. Most of their small capacity has been used. There are two stations on dams in the Orange River. There are three pumped storage schemes, Drakensberg and Palmiet (Eskom) and Steenbras (municipal), with a combined capacity of 1 580 MW. Two gas turbines with 171 MW in capacity each are only used during peak demand and for stand-by power. They are simple single-cycle stations, with low capacity costs, but are very expensive to run. If South Africa decides to use gas for large-scale power generation, combined cycle gas turbines will be used. This technology is efficient, with low capital costs and emission factors. Electricity is generated from bark and black liquor in the pulp and paper industry and bagasse in sugar refineries. This is not quantified as it is all used by the industries for their own needs and none is fed into the national grid. The lack of arable land for increasing forests and sugar cane plantations means there is little prospect of substantially increasing this generation. Government is looking at increasing the co-generation level, due to (i) energy efficiency opportunity (ii) potential for renewable energy generation and (iii) the possible improvement of security of supply due to the distributed generation. Co-generation involves harnessing the energy that would otherwise have been dissipated as waste heat and to use that heat to generate electricity. Eskom has 26 461 km of transmission lines, which span the country and carry power to neighbouring countries. These very long distances lead to transmission losses, and other problems such as supply quality. The net electricity output by Eskom totalled 220 152 GWh of electricity in 2004. There are special Eskom divisions to streamline supply to different types of end-users and about 63,8% of electricity sales are direct to the consumer. The remaining approximately 36,2% is sold to local authorities. These authorities own and service their own distribution networks and resell the power to end-users. By the end of 2006 the national grid reached 73% of the population. The biggest challenge is the electrification of the huge formal and informal urban settlements. Some of the rural areas are difficult to electrify via the grid because of cost
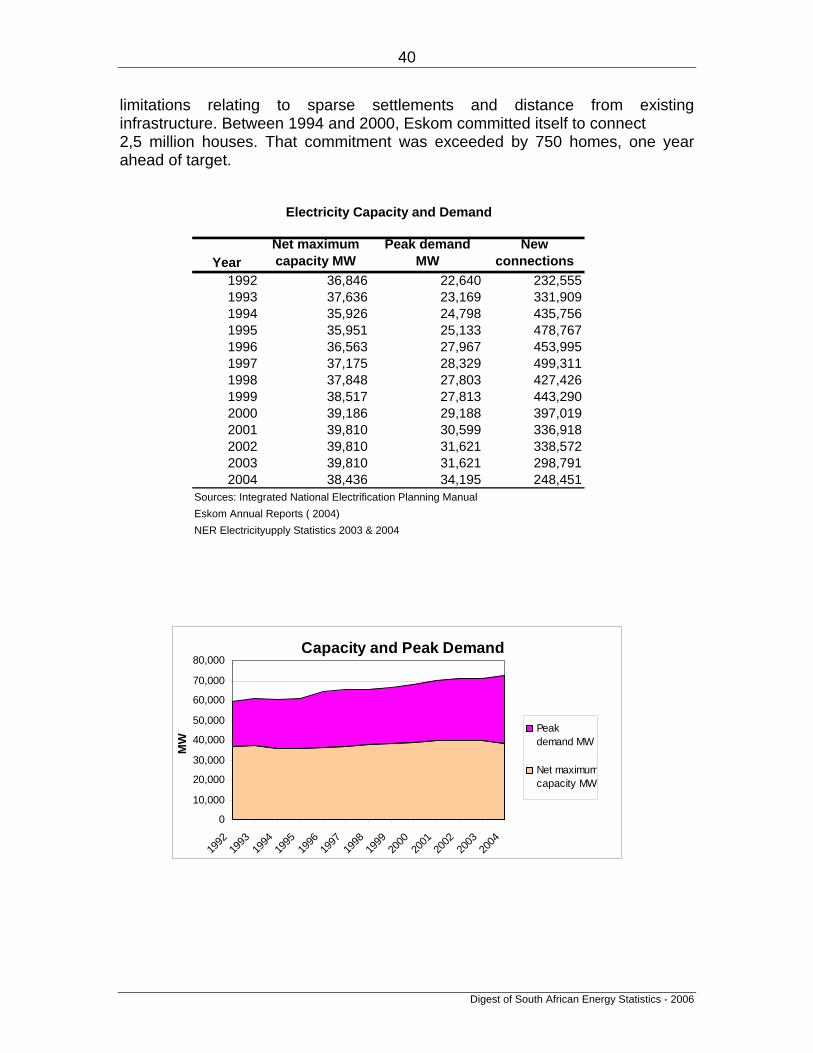
Digest of South African Energy Statistics - 2006
40
limitations relating to sparse settlements and distance from existing infrastructure. Between 1994 and 2000, Eskom committed itself to connect 2,5 million houses. That commitment was exceeded by 750 homes, one year ahead of target.
YearNet maximum capacity MW
Peak demand MW
New connections
1992 36,846 22,640 232,5551993 37,636 23,169 331,9091994 35,926 24,798 435,7561995 35,951 25,133 478,7671996 36,563 27,967 453,9951997 37,175 28,329 499,3111998 37,848 27,803 427,4261999 38,517 27,813 443,2902000 39,186 29,188 397,0192001 39,810 30,599 336,9182002 39,810 31,621 338,5722003 39,810 31,621 298,7912004 38,436 34,195 248,451
Sources: Integrated National Electrification Planning ManualEskom Annual Reports ( 2004)NER Electricityupply Statistics 2003 & 2004
Electricity Capacity and Demand
Capacity and Peak Demand
0
10,000
20,000
30,000
40,000
50,000
60,000
70,000
80,000
1992
1993
1994
1995
1996
1997
1998
1999
2000
2001
2002
2003
2004
MW
Peakdemand MW
Net maximumcapacity MW
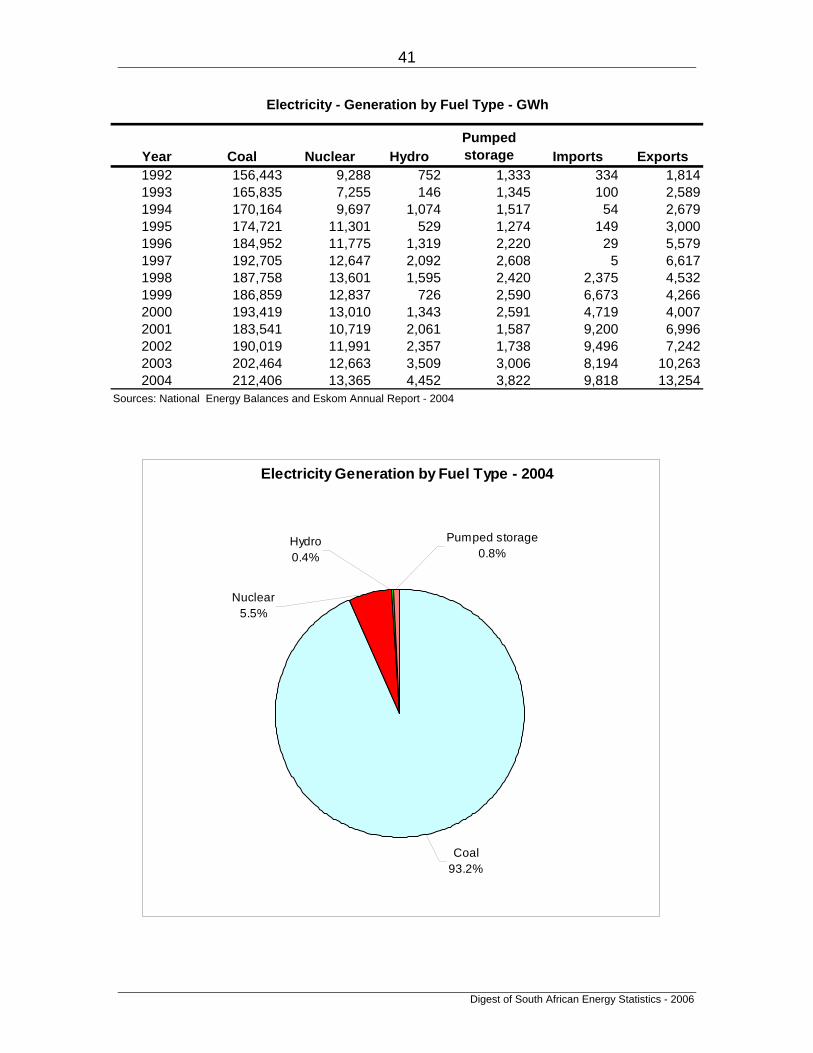
Digest of South African Energy Statistics - 2006
41
Year Coal Nuclear HydroPumped storage Imports Exports
1992 156,443 9,288 752 1,333 334 1,8141993 165,835 7,255 146 1,345 100 2,5891994 170,164 9,697 1,074 1,517 54 2,6791995 174,721 11,301 529 1,274 149 3,0001996 184,952 11,775 1,319 2,220 29 5,5791997 192,705 12,647 2,092 2,608 5 6,6171998 187,758 13,601 1,595 2,420 2,375 4,5321999 186,859 12,837 726 2,590 6,673 4,2662000 193,419 13,010 1,343 2,591 4,719 4,0072001 183,541 10,719 2,061 1,587 9,200 6,9962002 190,019 11,991 2,357 1,738 9,496 7,2422003 202,464 12,663 3,509 3,006 8,194 10,2632004 212,406 13,365 4,452 3,822 9,818 13,254
Sources: National Energy Balances and Eskom Annual Report - 2004
Electricity - Generation by Fuel Type - GWh
Electricity Generation by Fuel Type - 2004
Coal 93.2%
Nuclear5.5%
Hydro0.4%
Pumped storage0.8%

Digest of South African Energy Statistics - 2006
42
Y earC o a l
M in esO il
R e fin eriesP u m p ed s to rag e L o sses
1992 2 ,349 11 ,206 1 ,826 12 ,0331993 2 ,414 12 ,653 1 ,345 12 ,7591994 2 ,526 12 ,630 1 ,517 14 ,0311995 2 ,566 13 ,232 1 ,274 11 ,5321996 2 ,732 13 ,423 2 ,220 15 ,2941997 2 ,848 12 ,908 2 ,608 16 ,0941998 2 ,836 12 ,832 2 ,420 16 ,5341999 2 ,725 13 ,283 2 ,590 16 ,8122000 2 ,761 13 ,331 2 ,591 17 ,0532001 2 ,803 11 ,580 2 ,357 16 ,2512002 2 ,815 11 ,571 2 ,479 13 ,8202003 2 ,690 11 ,386 3 ,005 14 ,1602004 2 ,788 12 ,289 3 ,822 5 ,268
S ource : E skom A nnua l R epo rt 2004S ource : N a tiona l E ne rgy B a lances
E lec tric ity U se b y th e E n erg y S ec to r - G W h
Electricity Use by the Energy Sector
0
5,000
10,000
15,000
20,000
25,000
30,000
35,000
40,000
1992
1993
1994
1995
1996
1997
1998
1999
2000
2001
2002
2003
2004
GW
h Losses
Pumped storage
Oil Refineries
Coal Mines

Digest of South African Energy Statistics - 2006
43
Sectoral Electricity Consumption
0
20,000
40,000
60,000
80,000
100,000
120,000
140,000
160,000
180,000
200,000
220,000
1992 1993 1994 1995 1996 1997 1998 1999 2000 2001 2002 2003 2004
GW
h
Residential
Commerce
Agriculture
Transport
Industry
Year Industry Transport Agriculture Commerce Residential1992 76,084 4,629 4,038 17,484 24,2531993 75,707 4,017 3,108 13,586 21,5421994 75,682 4,389 4,880 14,058 22,1151995 80,657 4,297 5,301 17,307 24,3691996 89,904 4,274 5,103 19,768 29,5521997 91,460 4,563 5,640 22,170 30,7221998 101,867 4,639 5,627 13,974 30,1631999 99,673 4,429 5,755 17,709 29,5112000 99,703 5,411 3,954 17,164 28,6802001 106,469 5,562 4,175 18,301 34,6232002 115,785 6,246 4,644 18,227 30,4182003 109,589 5,565 5,142 21,071 34,0742004 134,384 6,302 6,158 24,990 36,231
Source: National Energy Balance
Final Consumption of Electricity - GWh

Digest of South African Energy Statistics - 2006
44
Year Iron and steel ChemicalsNon-ferrous
metalsNon-metallic
mineralsTransport equipment Machinery
1992 11,402.0 3,179.0 6,147.0 986.0 4.0 95.01993 12,606.0 3,017.0 6,234.0 963.0 4.0 109.01994 14,604.0 3,150.0 5,945.0 1,051.0 6.0 100.01995 16,251.0 3,603.0 6,956.0 1,190.0 9.0 104.01996 15,630.0 2,524.0 13,046.0 1,143.0 9.0 115.01997 17,875.0 2,432.0 14,584.0 1,188.0 11.0 127.01998 18,865.0 2,629.8 14,769.3 1,155.0 15.1 36.91999 19,527.4 2,499.5 14,907.2 1,119.0 15.1 41.62000 20,913.4 2,640.4 15,037.7 1,153.7 69.3 53.22001 18,554.0 9,405.0 15,172.0 2,039.0 83.0 52.02002 20,331.0 9,744.0 15,441.0 2,277.0 88.0 44.02003 22,331.0 9,439.0 16,258.0 2,279.0 95.0 42.02004 23,271.0 9,889.0 17,953.0 2,195.0 85.0 43.0
Source: National Energy Balance
Electricity - Industrial Consumption - GWh
Year MiningFood &
Tobacco Paper & Pulp
Wood & wood
products Construction TextilesIndustry not
specified1992 33,962 375 939 491 20 372 18,1131993 32,026 369 870 486 11 389 18,6221994 32,668 411 843 505 15 414 15,9691995 33,176 454 975 534 14 475 16,9161996 34,831 503 969 590 16 491 20,0371997 30,390 539 1,029 596 17 514 22,1581998 29,204 578 1,039 623 20 373 32,5881999 28,877 581 1,089 592 35 414 29,9752000 29,038 639 1,494 412 34 376 27,8422001 31,691 672 1,594 261 32 488 26,4262002 32,204 673 1,557 289 115 523 32,4992003 30,793 715 1,463 271 133 522 25,2472004 32,828 720 1,513 290 52 525 45,024
Source: National Energy Balances
Electricity - Industrial Consumption - GWh
Digest of South African Energy Statistics - 2006
45
Notes
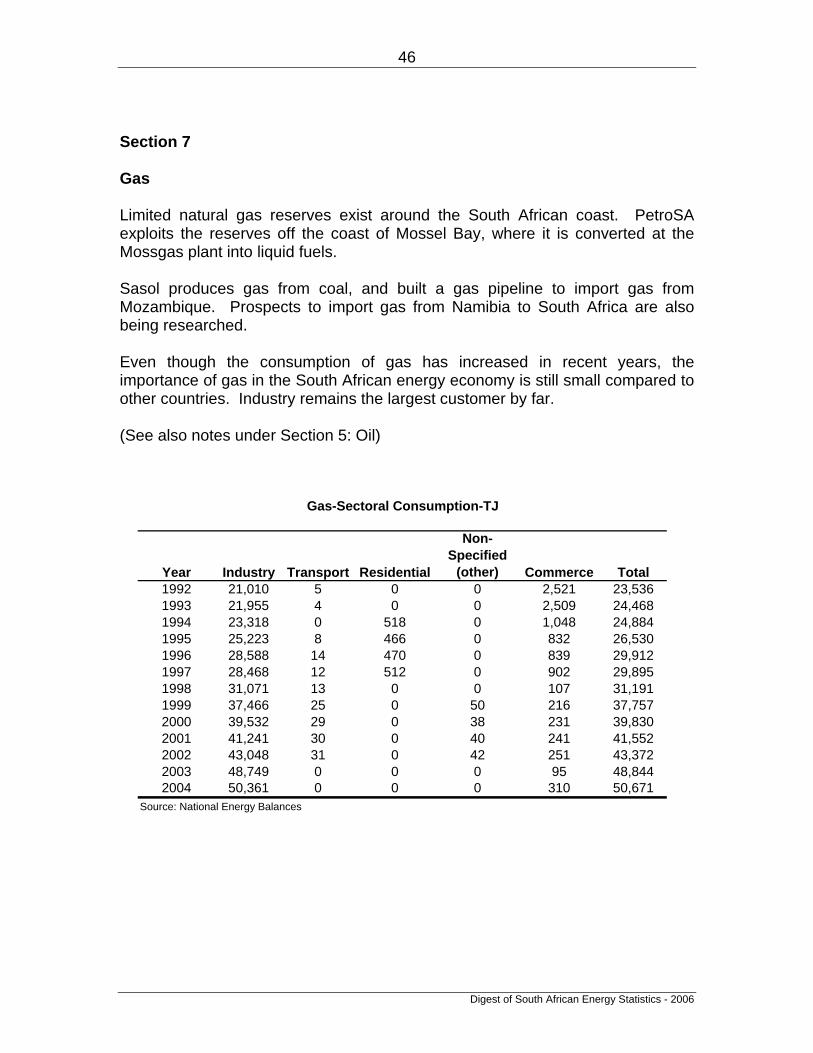
Digest of South African Energy Statistics - 2006
46
Section 7 Gas Limited natural gas reserves exist around the South African coast. PetroSA exploits the reserves off the coast of Mossel Bay, where it is converted at the Mossgas plant into liquid fuels. Sasol produces gas from coal, and built a gas pipeline to import gas from Mozambique. Prospects to import gas from Namibia to South Africa are also being researched. Even though the consumption of gas has increased in recent years, the importance of gas in the South African energy economy is still small compared to other countries. Industry remains the largest customer by far. (See also notes under Section 5: Oil)
Year Industry Transport Residential
Non-Specified
(other) Commerce Total1992 21,010 5 0 0 2,521 23,5361993 21,955 4 0 0 2,509 24,4681994 23,318 0 518 0 1,048 24,8841995 25,223 8 466 0 832 26,5301996 28,588 14 470 0 839 29,9121997 28,468 12 512 0 902 29,8951998 31,071 13 0 0 107 31,1911999 37,466 25 0 50 216 37,7572000 39,532 29 0 38 231 39,8302001 41,241 30 0 40 241 41,5522002 43,048 31 0 42 251 43,3722003 48,749 0 0 0 95 48,8442004 50,361 0 0 0 310 50,671
Source: National Energy Balances
Gas-Sectoral Consumption-TJ

Digest of South African Energy Statistics - 2006
47
Gas-Sectoral Consumption-2004
Commerce0.6%
Non-Specif ied (other)0.0%
Transport0.0%
Residential0.0%
Industry99.4%
Industry
Transport
Residential
Non-Specif ied(other)Commerce
Consumption of Gas
0
10,000
20,000
30,000
40,000
50,000
60,000
1992
1993
1994
1995
1996
1997
1998
1999
2000
2001
2002
2003
2004
TJ
Commerce
Non-Specif ied(other)Residential
Transport
Industry

Digest of South African Energy Statistics - 2006
48
YearIron and
Steel Chemical
Non-Ferrous Metals
Non- Metallic Minerals
Transport Equipment Machinery
1992 6,474 2,508 951 4,865 155 4,0541993 7,092 2,455 1,002 5,077 154 4,1531994 6,830 2,523 862 5,300 142 4,3271995 7,960 2,642 805 5,861 168 4,5731996 10,748 2,866 972 5,740 201 4,7341997 8,372 2,948 1,230 5,918 174 5,4141998 15,329 3,051 957 6,314 106 6041999 8,965 12,929 1,886 5,511 357 7522000 10,147 12,349 2,256 5,682 368 7892001 10,586 12,883 2,354 5,927 384 8242002 11,050 13,448 2,457 6,187 401 8602003 26,147 7,701 0 4,740 0 2,1842004 22,836 9,109 0 6,151 0 1,917
Source:National Energy Balances
Year Mining Food Paper Wood Textiles
Industries not
Specified1992 461 785 335 264 15 1431993 466 774 372 237 18 1541994 430 840 399 248 19 1,3971995 478 806 368 280 20 1,2631996 325 949 388 271 101 1,2931997 549 1,181 393 879 20 1,3911998 498 1,154 371 170 18 2,5011999 341 1,212 2,715 63 17 2,7192000 378 1,251 2,967 68 18 3,2572001 395 1,305 3,096 71 19 3,3982002 412 1,362 3,231 75 20 3,5472003 2,334 1,116 2,511 0 0 2,0152004 2,312 924 2,251 0 0 4,860
Source:National Energy Balances
Gas-Industrial Consumption TJ
Gas-Industry Consumption-TJ
Major Gas Consuming Industrial Sectors
0
5,000
10,000
15,000
20,000
25,000
30,000
35,000
40,000
45,000
1992
1993
1994
1995
1996
1997
1998
1999
2000
2001
2002
2003
2004
TJ
Machinery
TransportEquipment Non- MetallicMineralsNon-FerrousMetalsChemical
Iron and Steel

Digest of South African Energy Statistics - 2006
49
Notes

Digest of South African Energy Statistics - 2006
50
Section 8 Renewables Photovoltaic modules are used in clinics, schools, for lighting, water pumps, television and telecommunication widely in the country. New technology such as super capacitors, fly wheels, fuel cells and chemical batteries are likely to be introduced to reduce the storage costs significantly. A recent study indicates that the country has a high potential for renewable energy with up to 43 TWh of electricity that could be displaced by solar water heating. A study also indicates that the wind energy has a technical potential of 66 TWh to the electricity production. South Africa has 661 MW of domestic installed hydropower. Because of the scarcity of water, which is characterising the country, some hydro is imported from neighbouring states. Biomass is used directly for cooking and space heating mainly in the rural areas and indirectly for biological processes to produce liquid fuels and electricity generation. The data quality for some of these annual renewable energy consumptions is poor and the data presented below are estimates since the accuracy cannot always be verified. 1. Estimated Fuelwood Consumption (households) 52 889 GWh (a)
2. Commercially exploitable Bagasse, Wood & Sawmill Waste and Pulp: 65 010 GWh (b)
3. Wind Energy: 32 GWh 4. Solar Energy: 532 GWh TOTAL ESTIMATED ANNUAL CONSUMPTION: 118 463 GWh
(a) Where estimated fuel consumption is about 11 200 000 tons (190 400 TJ) (b) and commercially exploitable Bagasse, Wood and Sawmill Waste and Pulp comprise of 6588000 tons of Biomass Bagasse (46 139 TJ) and 23 496 tons equivalent to (187 893 TJ) of field residue, bagasse, softwood, hardwood, chips, dust, bark, black liquor and sludge.
There are other sources of energy, which are distributed either directly or indirectly all over the country such as landfill gas with a potential of 7.2 TWh of electricity generation, which is estimated, to grow to 10.8 TWh by 2040. Wave energy potential is estimated at 8 000 MW and 10 000 MW in winter and the potential yield to 70 TWh per year.
Digest of South African Energy Statistics - 2006
51
Notes

Digest of South African Energy Statistics - 2006
52
Section 9 Prices The price data given here have been extracted from a far more extensive DME price report.
Petrol-93 Diesel1992 141.75 137.001993 160.42 154.671994 167.42 154.801995 188.08 159.091996 194.42 187.671997 209.75 194.331998 250.50 181.251999 250.83 203.962000 326.00 280.402001 350.33 313.802002 392.00 347.512003 381.33 326.962004 429.92 372.58
Source: Petroleum Products Price Report
SA c\Litre Coast Pump PriceAverage Petrol and Diesel Prices
Coast Pump Price- Petrol and Diesel
0
50
100
150
200
250
300
350
400
450
500
1992
1993
1994
1995
1996
1997
1998
1999
2000
2001
2002
2003
2004
SA c
/litr
e
Petrol-93
Diesel

Digest of South African Energy Statistics - 2006
53
Coal Electricity HFO LPGSasol Gas Tarrif A
Sasol Gas Tarriff G
1992 2.27 25.44 10.19 32.23 10.71 28.221993 2.21 26.64 12.03 33.60 10.89 28.221994 2.33 28.67 12.15 36.46 11.91 30.861995 2.55 30.97 14.66 38.98 12.35 31.991996 2.69 31.39 17.03 41.33 13.46 34.881997 2.49 32.92 18.83 46.11 15.01 38.901998 3.71 34.14 17.11 48.55 19.85 46.471999 3.96 34.56 20.51 54.38 25.73 54.842000 4.03 36.75 33.46 72.29 38.60 76.222001 4.89 38.22 34.70 91.12 42.84 86.822002 5.45 41.61 44.96 100.14 56.95 111.012003 6.14 44.58 42.92 103.20 46.20 87.182004 5.10 44.56 39.67 114.26 40.26 83.18
Sources: Petroleum Products Price ReportMinerals Bureau Coal Price Report (Bituminous - Industries)Eskom Annual Reports
Price Comparison-Business Use- R/GJ
Price Comparison- Business Use
0.00
20.00
40.00
60.00
80.00
100.00
120.00
1992 1993 1994 1995 1996 1997 1998 1999 2000 2001 2002 2003 2004
R/G
J
Coal
Electricity
HFO
LPG
Sasol Gas Tarrif A
Sasol Gas Tarriff G

Digest of South African Energy Statistics - 2006
54
Dubai Brent1992 17.19 19.311993 14.91 17.001994 14.74 15.801995 16.11 17.031996 18.56 20.691997 18.17 19.131998 12.16 12.731999 17.19 17.872000 26.14 28.452001 22.92 24.462002 23.80 25.002003 26.80 28.842004 33.63 38.21
Source: Petroleum Products Price Report
Crude Oil-US$/bbl
Crude Oil Prices
0.00
5.00
10.00
15.00
20.00
25.00
30.00
35.00
40.00
45.00
1992
1993
1994
1995
1996
1997
1998
1999
2000
2001
2002
2003
2004
US$
/bbl Dubai
Brent

Digest of South African Energy Statistics - 2006
55
Notes

Digest of South African Energy Statistics - 2006
56
Section 10 Economic data
Year
Gross Domestic Product (at
constant 2000 market prices; Rm)
Consumer Price Index (2000 = 100)
Production Price Index (2000 = 100)
Exchange rate - R/$
Gold price - US$/oz
Gold price - R/oz
1993 755,009 61.20 61.60 3.27 359.70 1,176.731994 779,424 66.60 66.70 3.55 384.05 1,363.431995 803,710 72.40 73.00 3.63 384.17 1,393.481996 838,326 77.70 78.10 4.30 387.71 1,664.021997 860,516 84.40 83.60 4.61 331.11 1,523.481998 864,968 90.20 86.60 5.53 294.14 1,622.921999 885,365 94.90 91.60 6.11 278.92 1,702.712000 922,151 100.00 100.00 6.94 279.13 1,932.512001 947,373 105.70 108.40 8.60 271.08 2,338.182002 982,327 115.40 123.80 10.52 310.16 3,242.302003 1,011,556 122.10 125.90 7.56 363.65 2,739.972004 1,056,771 123.80 126.70 6.45 409.33 2,637.10
Sources: The South African Reserve Bank website - www.resbank.co.za & Stats SA website - www.statssa.gov.za

Digest of South African Energy Statistics - 2006
57
Notes

Digest of South African Energy Statistics - 2006
58
Section 11
Useful Addresses Department of Minerals and Energy Private Bag X59 Pretoria, 0001 Tel: (012) 317 8000 Eskom P O Box 1091 Johannesburg, 2001 Tel: (011) 800 8111 National Electricity Regulator P O Box 40343 Arcadia, 0007 (012) 401 4600 Central Energy Fund P O Box 786141 Sandton, 2199 Tel: (011) 880 9727 SAPIA P O Box 7082 Roggebaai, 8012 Tel: (021) 419 8054 PetroSA Private Bag X1 Waterfront, 8002 Tel: (021) 938 3644 Sasol Oil P O Box 4211 Randburg, 2125 Tel: (011) 889 7600 Sasol Gas P O Box 4211 Randburg, 2125 Tel: (011) 889 7600
Energy Research Centre University of Cape Town Private Bag Rondebosch, 7701 Tel: (021) 650 3230 CSIR P O Box 395 Pretoria, 0001 (012) 841 2911 Nuclear Energy Corporation of SA (NECSA) P O Box 582 Pretoria, 0001 Tel: (012) 305 4911 Council for Geoscience Private Bag X 112 Pretoria, 0001 Tel: (012) 841 1911 Chamber of Mines SA P O Box 61809 Marshalltown, 2107 Tel: (011) 498 7100 Institute for Energy Studies Rand Afrikaans University P O Box 524 Auckland Park, 2006 Tel: (011) 489 2547 South African National Energy Association Suite 121, Postnet RAU Private Bag X12 Melville 2109 Tel:(011)4892547

Digest of South African Energy Statistics - 2006
59
Section 12 CALORIFIC VALUES
Fuel Calorific Value Units Density
Electricity 3,6 MJ/kWh Natural Gas 41,0 MJ/m3 LPG (Liquefied Petroleum Gas) 26,7 MJ/l 0,541 Petrol 34,2 MJ/l 0,723 Avgas 33,9 MJ/l 0,730 Illuminating Paraffin 37,0 MJ/l 0,788 Power Paraffin 37,5 MJ/l 0,813 Jet Fuel 34,3 MJ/l 0,793 Diesel 38,1 MJ/l 0,839 HFO (Heavy Furnace Oil) 41,6 MJ/l 0,984 Coal (Eskom - average 1994) 20,1 MJ/kg Coal (General purpose) 24,3 MJ/kg Coal (Coking) 30,1 MJ/kg Coke 27,9 MJ/kg Coke oven gas 17,3 MJ/m3 Blast furnace gas 3,1 MJ/m3 Refinery gas (estimate) 20,0 MJ/m3 Bagasse (wet) 7,0 MJ/kg Bagasse fibre (dry) 14,0 MJ/kg Biomass (wood dry typical) 17,0 MJ/kg Coal gas (Sasol) 18,0 MJ/m3 Coal gas (Sasol - methane rich) 38,0 MJ/m3

Digest of South African Energy Statistics - 2006
60
Conversion Factors From \ To
J kWh toe Btu
1 J 1 0.278 x 10⁻⁶ 0.2388 x 10⁻⁶ 0.948 x 10⁻³ 1 kWh 3.6 x 10⁶ 1 0.86 x 10⁻⁶ 3.412 x 10³ 1 toe 42 x 109 11630 1 39.68 x 10⁶ 1 Btu 1.055 x 10³ 0.293 x 10⁻³ 0.252 x 10⁻⁹ 1 Note: toe = ton oil equivalent Prefixes Prefix Symbol
Power
Kilo k 103 Mega M 106 Giga G 109 Tera T 1012 Peta P 1015 Exa E 1018

Digest of South African Energy Statistics - 2006
61