diffusion and electric mobility of ions within - plant physiology
TRANSCRIPT

Plant Physiol. (1991) 97, 273-2790032-0889/91 /97/0273/07/$01 .00/0
Received for publication January 7, 1991Accepted April 6, 1991
Diffusion and Electric Mobility of Ions within IsolatedCuticles of Citrus aurantiuml
Steady-State and Equilibrium Values
Melvin T. Tyree*, Charles R. Wescott, and Christopher A. TaborNortheastern Forest Experiment Station, P.O. Box 968, Burlington, Vermont 05402 (M. T. T., C.R. W., C.A. T.); Botany
Department, University of Vermont, Burlington, Vermont 05405 (M. T. T.); Agricultural Biochemistry Department,University of Vermont, Burlington, Vermont 05405 (C.R. W.)
ABSTRACT
We report a new method for measuring cation and anionpermeability across cuticles of sour orange, Citrus aurantium,leaves. The method requires the measurement of two electricalparameters: the diffusion potential arising when the two sides ofthe cuticle are bathed in unequal concentrations of a Cl salt; andthe electrical conductance of the cuticle measured at a saltconcentration equal to the average of that used in the diffusion-potential measurement. The permeabilities of H+, Li+, Na+, K+,and Cs+ ranged from 2 x 10⁻⁸ to 0.6 x 10⁻⁸ meters per secondwhen cuticles were bathed in 2 moles per cubic meter Cl- salts.The permeability of Cl- was 3 x 10⁻⁹ meters per second. Thepermeability of Li+, Na+, and K+ was about five times less whenmeasured in 500 moles per cubic meter Cl- salts. We also reportan asymmetry in cuticle-conductance values depending on themagnitude and the direction of current flow. The asymmetrydisappears at low current-pulse magnitude and increases linearlywith the magnitude of the current pulse. This phenomenon isexplained in terms of transport-number effects in a bilayer modelof the cuticle. Conductance is not augmented by current carriedby exchangeable cations in cuticles; conductance is rate limitedby the outer waxy layer of the cuticle.
ion migration. In the most recent of those studies (12), weused diffusion-potential measurements exclusively to obtaindata from which we calculated ionic-permeability ratios rela-tive to K+, which we used as a reference ion. Here, we reporton experiments that combine two different electrical meas-urements, diffusion potentials and electrical conductance, anduse these data to calculate ionic permeabilities.
MATERIALS AND METHODS
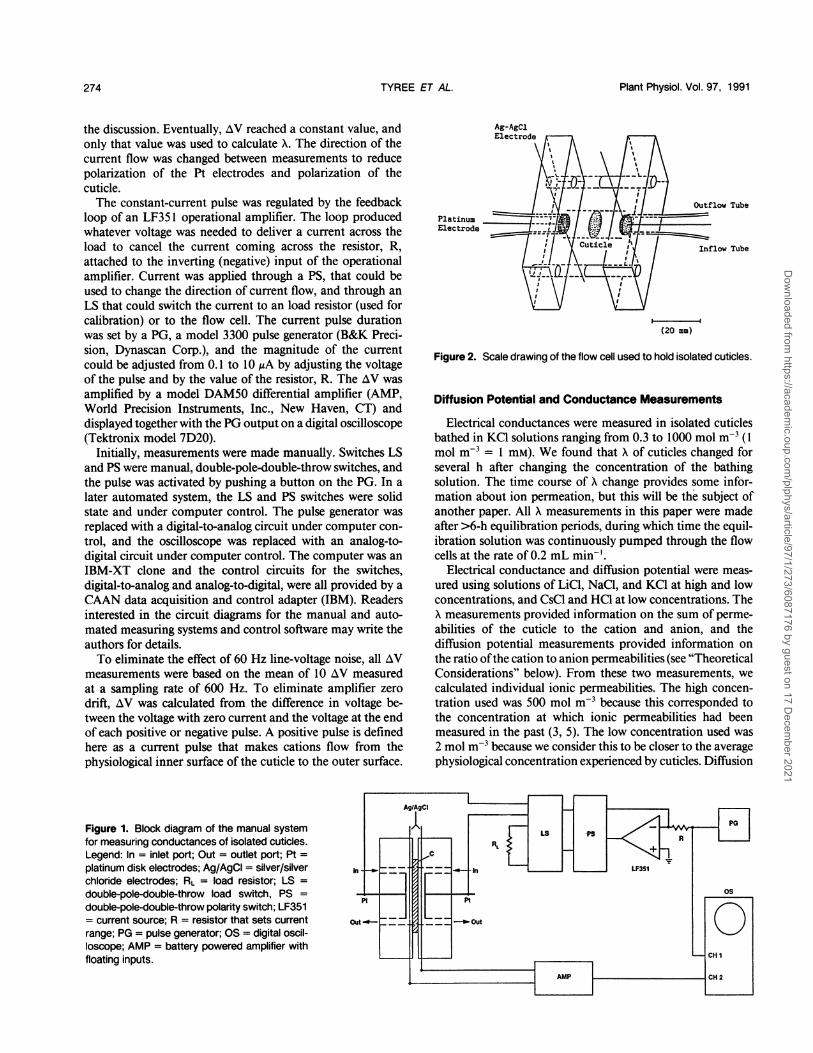
Cuticles ofsour orange, Citrus aurantium L., were preparedin a manner similar to that described earlier (11). Briefly,adaxial cuticles were isolated by enzymatic techniques (incu-bated in pectinase and cellulase in acetic acid at pH 4.5 andat 37°C) and mounted between the cylindrical wells of a flowcell similar to that used previously (1 1). The cylindrical wellhad a diameter of 6.4 mm, and two Pt disk electrodes wereadded (Fig. 1, left side, and Fig. 2). The disks were platinumblacked and mounted onto the back surface of each well.Holes were drilled to allow solution flow through the inletand outlet ports. A small hole was drilled parallel to the innerface of each half-cell to allow the insertion of a tight-fittingAg wire within 200 ,m of the cuticle. Exposed segments ofthe Ag wires within the wells were chlorinated.
As noted in an earlier paper (12), the objective of ourresearch program is to determine the effects of environmentalstress on tree growth and development. One component ofour current research is to develop a basic foundation forconducting research on the movement ofions through cuticlesso that we may develop a better understanding of the uptakeand leaching of nutrients from leaves of trees. Previously (1 1,12), we reported results of experiments in which diffusionpotentials were measured across isolated leaf cuticles thatwere bathed in known solutions of monovalent and divalentcations. We hypothesized two models (a charged-pore modeland a bilayer model) of the cuticle that accounted for theasymmetric character of cuticles and driving forces affecting
'This research was supported by funds from the U.S. Departmentof Agriculture, Forest Service, Northeastern Forest Experiment Sta-tion, and by grant numbers USDA 87-CRSR-2-302 1 and USDA 88-34 157-3748.
Equipment for Electrical Conductance Measurements
Electrical conductance was measured using a circuit shownin Figure 1. The Pt electrodes were used to apply a short pulseof constant current, I (of 50-200 ms duration), across thecuticle. The voltage drop, AV, across the cuticle that resultedfrom the current flow was measured with the Ag/AgCl elec-trodes. Cuticle conductance, X,2 was then calculated from X= I/AV. The AV increased with time after the start of thecurrent pulse because of the capacitance of the cuticle andmeasuring circuit and a transport-number effect explained in
2Abbreviations: X, conductance: a, area: C, concentration: D.diffusion coefficient: 1, current; F, Faraday constant; N, Avogadro'snumber; R, gas constant; T, Kelvin temperature: u, electric mobility:z, valence with sign; a, partition coefficient; 5, thickness of cuticlemembrane; A, equivalent conductance; PS, polarity switch; LS. loadswitch; PG. pulse generator.
273
Dow
nloaded from https://academ
ic.oup.com/plphys/article/97/1/273/6087176 by guest on 17 D
ecember 2021
Plant Physiol. Vol. 97, 1991
the discussion. Eventually, AV reached a constant value, andonly that value was used to calculate X. The direction of thecurrent flow was changed between measurements to reducepolarization of the Pt electrodes and polarization of thecuticle.The constant-current pulse was regulated by the feedback
loop of an LF35 1 operational amplifier. The loop producedwhatever voltage was needed to deliver a current across theload to cancel the current coming across the resistor, R,attached to the inverting (negative) input of the operationalamplifier. Current was applied through a PS, that could beused to change the direction of current flow, and through anLS that could switch the current to an load resistor (used forcalibration) or to the flow cell. The current pulse durationwas set by a PG, a model 3300 pulse generator (B&K Preci-sion, Dynascan Corp.), and the magnitude of the currentcould be adjusted from 0.1 to 10 ,A by adjusting the voltageof the pulse and by the value of the resistor, R. The AV wasamplified by a model DAM50 differential amplifier (AMP,World Precision Instruments, Inc., New Haven, CT) anddisplayed together with the PG output on a digital oscilloscope(Tektronix model 7D20).
Initially, measurements were made manually. Switches LSand PS were manual, double-pole-double-throw switches, andthe pulse was activated by pushing a button on the PG. In alater automated system, the LS and PS switches were solidstate and under computer control. The pulse generator wasreplaced with a digital-to-analog circuit under computer con-trol, and the oscilloscope was replaced with an analog-to-digital circuit under computer control. The computer was anIBM-XT clone and the control circuits for the switches,digital-to-analog and analog-to-digital, were all provided by aCAAN data acquisition and control adapter (IBM). Readersinterested in the circuit diagrams for the manual and auto-mated measuring systems and control software may write theauthors for details.To eliminate the effect of 60 Hz line-voltage noise, all AV
measurements were based on the mean of 10 AV measuredat a sampling rate of 600 Hz. To eliminate amplifier zerodrift, AV was calculated from the difference in voltage be-tween the voltage with zero current and the voltage at the endof each positive or negative pulse. A positive pulse is definedhere as a current pulse that makes cations flow from thephysiological inner surface of the cuticle to the outer surface.
Figure 1. Block diagram of the manual systemfor measuring conductances of isolated cuticles.Legend: In = inlet port; Out = outlet port; Pt =platinum disk electrodes; Ag/AgCl = silver/silverchloride electrodes; RL = load resistor; LS =
double-pole-double-throw load switch, PS =
double-pole-double-throw polarity switch; LF351= current source; R = resistor that sets currentrange; PG = pulse generator; OS = digital oscil-loscope; AMP = battery powered amplifier withfloating inputs.
in-
Out -
PlatinumElectrode
Outflow Tube
Inflow Tube
(20 mm)
Figure 2. Scale drawing of the flow cell used to hold isolated cuticles.
Diffusion Potential and Conductance Measurements
Electrical conductances were measured in isolated cuticlesbathed in KCI solutions ranging from 0.3 to 1000 mol m-3 (1mol m-3 = 1 mM). We found that X of cuticles changed forseveral h after changing the concentration of the bathingsolution. The time course of X change provides some infor-mation about ion permeation, but this will be the subject ofanother paper. All X measurements in this paper were madeafter >6-h equilibration periods, during which time the equil-ibration solution was continuously pumped through the flowcells at the rate of 0.2 mL min-'.
Electrical conductance and diffusion potential were meas-ured using solutions of LiCl, NaCl, and KCI at high and lowconcentrations, and CsCl and HCI at low concentrations. TheX measurements provided information on the sum of perme-abilities of the cuticle to the cation and anion, and thediffusion potential measurements provided information onthe ratio ofthe cation to anion permeabilities (see "TheoreticalConsiderations" below). From these two measurements, wecalculated individual ionic permeabilities. The high concen-tration used was 500 mol m-3 because this corresponded tothe concentration at which ionic permeabilities had beenmeasured in the past (3, 5). The low concentration used was2 mol m-3 because we consider this to be closer to the averagephysiological concentration experienced by cuticles. Diffusion
I~~I-C~~~~~~~~~~~~~~~~~~~~C
I t~~~~~~APCH21
274 TYREE ET AL.
Dow
nloaded from https://academ
ic.oup.com/plphys/article/97/1/273/6087176 by guest on 17 D
ecember 2021

ION DIFFUSION AND MOBILITY IN CUTICLES
potentials were measured at concentration ratios between thephysiological inside and outside of the cuticle (C'/C0) of 10and 0.1, with average concentrations of 500 and 2 mol m-3for the high and low concentrations, respectively. Diffusionpotentials were measured across the Ag/AgCl electrodes andwere computed as described (12).
Theoretical Considerations
The purpose of this section is to establish the theoreticalrelationship between cuticle conductance, X, and the saltconcentration inside it, and the relationship between X andthe ionic permeabilities.
Conductances, permeabilities, and diffusion coefficients areinterrelated (6). The equivalent conductance ofa salt solution,A, is equal to the specific conductance, K, divided by thesalt concentration, C'. Ksp is the conductance in Siemens(=mho) of a I m cube of solution and has SI units of S m-';C' has units of equiv m-3, so A is m2 S equiv-' in SI units.For a thin sheet of solution of thickness, 6, and area, a, themeasured conductance would be:
X = A C'a/6 (1)
This equation also can be written for each ion separately byusing subscripts to designate the cation and anion for X, A,and C'. In the remainder of this paper, it is more convenientto express concentrations in mol m-3, so we replaced C' withzi C,, where zi is the valence with sign of the ion and C1 is
the concentration in mol m-3. For a single ion, the precedingequation becomes:
Xi = Ai ZI C a/6 (la)
The X of a salt solutions equals the sum of the cation andanion conductances. A is not a constant; for example, in KCIsolutions it is about 24% smaller at 1 M concentration thanat 1 mM, but it will be approximated as a constant in thispaper. Treating A as constant is no more serious an error thantreating mobility or diffusion coefficient as constants becausethey are related quantities. In terms of ionic mobility, ui, Aiis;
From Equation le, we see that X measurements can be usedto compute P directly. Because X of a mono-mono-valent salt= X+ + A_ where X+ and X_ are the cationic and anionconductances, respectively, we have:
X = (P+ + P_) az2 F2CP/RT or(P+ + P_) = XRT/az 'F C' (2)
In a previous paper (11), we showed that the Goldmanequation for ionic flux adequately predicts the diffusion po-tential in isolated cuticles when concentration ratios change,but the average ionic concentration is kept constant. TheGoldman equation for each ion of a mono-mono-valent saltcan be written as:
J+ = -P+ (x/(l - ex))(C+ - C+ ex)J_ = -P- (-x/(l - e-x))(C¶- - Ct. e-X)
(3a)(3b)
where x = FE'°/RT and EB' is the diffusion potential. Duringthe measurement of E'O, the anion and cation fluxes are equal,J+ = JL. By setting the right sides of Equations 3a and 3bequal and solving for P+/P_, it can be shown after somesimplification that,
P+/P_ = (e' - CR)/(1 - eXCR) (4)where CR = Ci/Co.
Equations 2 and 4 constitute a system of two equations intwo unknowns. So the measurement of X and E'0 at the sameconcentration ought to yield values of P+ and P_.A rigorous treatment of ion transport through cuticles
should be based on the principles of irreversible thermody-namics (2, 13). It is impractical to do so at this time becausetechniques to measure all the parameters needed do not exist.In this regard, we are handicapped by the same limitations inmost membrane-physiological studies. We have confidencein the classical approach used above because we have shownthat the E'0 measurements in our system fit the predictionsresulting from the Goldman constant field assumption (1 1)under the experimental conditions used in this paper. Allphenomena observed below can be explained in terms ofclassical thermodynamic transport equations.
Ai = u zI F (lb)
where F = the Faraday constant and the subscript i refers tothe ionic species. The ionic mobility and diffusion coefficient,D, are related by:
ui = DiF/RT (lc)
where R = the gas constant and T = Kelvin temperature. Inmembrane systems, the permeability, P, is usually defined as:
Pi = D al/6 (Id)
where a is the partition coefficient and 6 is the thickness ofthe membrane (4).
In the context of the conductance of a cuticle, C would bethe concentration inside the cuticle and would be equal toaC' where Co is the concentration in the bathing medium.Combining Equations la through ld and using the meaningof a, we get:
Xi = Piaz iF C°/RT (le)
RESULTS
Cuticle conductance was found to be independent of theapplied current at high KCI concentrations (>300 mol m-3),but cuticle conductance was dependent on the magnitude ofthe applied current in the range of 0.1 to 1 ,A when con-ductances were measured at low KCI concentration. Con-ductance computed from the positive and negative pulsesdiverged symmetrically as current increased. Conductance onthe positive pulse always was more than on the negative pulseat high current, but conductances were nearly equal at lowcurrent. The mean of the conductances measured with posi-tive and negative pulses approximately equaled the limitingconductances at low current (Fig. 3A, B). Because the con-ductances can be measured more accurately at high than atlow current, most conductances reported in this paper are themean from the positive and negative pulses measured at highcurrent. We believe this is justified because the mean closelyapproximates the limiting conductance at low current. The
275
Dow
nloaded from https://academ
ic.oup.com/plphys/article/97/1/273/6087176 by guest on 17 D
ecember 2021

Plant Physiol. Vol. 97, 1991
En:3.
uc0
c0
1000
Al750 T1500-
250-
0 2 4 6 8 10Current, MA
8 - B ,7-6
5-4 -
3 l Il0.0 0.5 1.0 1.5 2.0 2.5
Current, ,uA
0.60.04 -C D
> 0.02
CP 0.00 0.0
-0.02- -0.
-0.04 d -0.60 100 200 300 0 200 400
Time, ms Time, ms
Figure 3. A, Cuticle conductance versus amplitude of current pulsefor a cuticle equilibrated in 500 mol m-3 KCI. Open and closed circlesare conductances computed from positive and negative pulses, re-spectively. Error bars are standard deviations. All conductances aregiven in Siemens (S = mho). B, Same as in A but for a cuticleequilibrated in 2 mol m-3 KCI. The line between the dots is the meanconductance from the positive and negative conductances. C, Timecourse of voltage drop across cuticle during a current pulse of 2 gAfor a cuticle equilibrated in 500 mol m-3 KCI. D, Same as C but forcurrent pulse of 0.5 ,A and cuticle equilibrated in 2 mol m-3 KCI.
mean conductance in Figure 3B increased slightly above thelimiting value at low current, but this may be a measurementerror because the current-pulse duration was not long enoughto reach a steady-state voltage on the negative pulse (Fig. 3D).The rise time for voltage to reach a constant value during aconstant current pulse was greater for a negative pulse thanfor a positive pulse, and greater at low concentration than athigh concentration (Fig. 3C, D). The duration of the currentpulses always was adjusted to allow enough time for thevoltage to a reach steady-state. This was usually possible withpulses <170 ms duration. In the discussion, we proposereasons for the asymmetry in conductance measurement.
Cuticle conductance was a function of the concentration ofKCI, C0, in the solution with which it was equilibrated (Fig.4). When log X was plotted versus log C°, an approximatelylinear relationship was found. Cuticle-to-cuticle variation inX at any given concentration typically varied over a range of10-fold. Some of this variation may be explained by cuticle-to-cuticle variation in thickness, but scanning EM micro-graphs revealed that all cuticles were between 1 and 2 ,umthick, and no correlation between cuticle thickness and con-ductance was evident. Because cuticles have a substantialcation exchange capacity (7-9), and because mobile cationsat the exchange sites should carry current, we had expectedcuticle X to reach a constant value as the concentration ofKC1 in the bathing solution reached a low value. This behaviorwas found in Nitella cell walls (10) (Fig. 4). In three of sevencuticles, a slight nonlinearity was found in the plot of X versusC" consistent with the behavior of Nitella cell walls, but thetrend was not evident in mean values of X (Fig. 5). However,cuticle X does decline less rapidly with declining Co than theconductance of KCI in water (Fig. 5, closed circles).
Table I contains a summary of diffusion potentials, con-ductances, and computed ionic permeabilities for severalmonovalent chloride salts at two concentrations. Note thatcation permeabilities, P+, are all about five times larger at 2than at 500 mol m-3. The permeabilities at high concentrationare 2 to 10 times higher than those reported for cuticlesisolated from apricot and Brussels sprouts. In apricot, the P+values of Li', Na+, and K+ range from 6 x 10-`0 to 4 x 10-'m s-', and it is 2 x 10-'° for Rb+ in Brussels sprouts. Amodified Bonferroni multiple t test done under Systems forElementary Statistical Analysis (SAS Institute Inc.) revealedthe following progression of cation permeabilities: (2)H+ >(2)Cs+ > (2)K+ > (2)Na+ = (2)Li+ > (500)K+ ~ (500)Li+ ~
(500)Na+, where (2) or (500) refers to the permeability at 2 or500 mol m-3, respectively, > means greater than with asignificance at 95% confidence, and ~ means that althoughthe observed mean is greater, it was not significant with 95%confidence.
DISCUSSION
Ions associated with ion exchange sites should retain somemobility; otherwise, they would not be "exchangeable." Basedon published ion exchange capacities for Citrus and Prunus,
1000
la.-C
KCI Concn, mol m-3
1000
EuU)E
8iU
0..5
100
10
1.01
0.1 I0.1 1.0 10 100 1000
KCI Concn, mol m-3
Figure 4. Top, Equilibrium cuticle conductance (S = Siemens) versusconcentration of KCI in the solution equilibrated with the cuticle.Different symbols are for different cuticles. The circles are represent-ative of four of seven cuticles and the triangles are representative ofthe remaining three cuticles. Lower, Equilibrium conductance of Ni-tella cell walls equilibrated in KCI solutions, recalculated from ref. 10.
276 TYREE ET AL.
Dow
nloaded from https://academ
ic.oup.com/plphys/article/97/1/273/6087176 by guest on 17 D
ecember 2021

ION DIFFUSION AND MOBILITY IN CUTICLES
1000
En
10 100
KCI Concn., mol m-3
1000
E
0E
100y
0
I Y
Figure 5. Equilibrium specific conductances of cuticles equilibratedin KCI solution concentrations given on the x axis. Data plotted withopen circles are means of seven cuticles and error bars are standarderrors of the means. Closed circles are the specific conductance ofKCI solutions plotted from a table in ref. 6.
we have estimated the average concentration of exchangeableions to be about 150 mole mr3 (7-9). If the exchangeablecations had an electric mobility comparable to the free KCIion pairs in the cuticle in equilibrium with the KCI in solution,then we would expect X to approach a constant limiting valueas the concentration of free KCI ion pairs falls below theconcentration of exchangeable cations as C° declines. A com-
parable case is X measured in Nitella cell walls bathed indifferent concentrations of KCI. The situation is simpler inNitella cell walls because KCI is dissolved in water betweenthe cellulose fibers rather than in a predominately hydropho-bic cuticle. In Nitella walls, the average concentration ofexchangeable ions is about 300 mol m-3 (10). Tyree (10)demonstrated that the activation energy for the electricallyconductive ions in cell walls is not much more than in freesolution. He calculated that the concentration of conductiveions must be 40 mol m-3 based on the limiting X measuredin dilute solutions (Fig. 4). So most of the counter ions in theion exchange sites must have been more tightly bound, re-
quiring a higher activation energy to break free and migrateunder an electric field.
Because we see no sign of a limiting X in cuticles for Co inthe range of 1 to 1000 mol m-3, we must consider otherpossible explanations: (a) The electric mobility of exchange-able cations is much less than that of free ions pairs. Theseexchangeable cations would still have to be mobile enough tobe exchangeable, but presumably have too high an activationenergy to contribute much to X. (b) The electric mobility ofexchangeable cations decreases with ionic strength of thebathing medium. (c) The cuticle is a bilayer, with most of theexchangeable cations on the side facing the epidermal cellsand few exchangeable cations on the waxy outer surface. Weassume X would be least in the waxy layer, and thus that X ofthe entire cuticle would be determined mostly by the charac-teristics of the waxy layer.We favor the third interpretation, the bilayer model, be-
cause it is consistent with one of the two models used toexplain polarity in ion diffusion potentials (1 1). A corollaryto this bilayer interpretation is that little of the current couldbe carried through charged pores (i.e. pores with ionizable
exchange sites) because then we would expect X to reachlimiting stable values as Co declines. This would not excludethe possibility of ion movement through polar pores (i.e.nonionizable sites with dipole moments), but a pore modellike that presented by Tyree et al. (1 1, Fig. 7) would be ruledout if the bilayer model is correct.The bilayer model also is consistent with the asymmetry in
conductances measured at low concentration. We believe thatthe increase in asymmetry with increased current (Fig. 3A, B)is related to the change in transport number at the interfacesbetween the outer waxy layer and the inner layer with ex-
changeable cations. The transport number is a measure of thefraction of the current carried by cations and anions in a
medium (water or cuticle layer). In water containing KCl, thetransport number for K+, t+, equals 0.5, and because t+ + t_= 1, it follows that half the current is carried by the anion,i.e. t_ = 0.5. In the inner layer ofthe cuticle, the concentrationof exchangeable cations is about 150 mol m-3, and becausethis is probably at least two orders of magnitude more thanthe Cl- concentration in this layer, it seems likely that t+ >0.99. The superscript c refers to the transport number in the,cuticle layer containing cation exchange sites. If we assume
the waxy outer layer contains no cation exchange site and ishydrophobic, then the concentrations of K+ and Cl- in thewaxy layer are likely to be approximately equal, and muchless than in the bathing medium. So let's assume that t+ =C = 0.5, where the superscript w refers to the waxy layer.Given these transport numbers, during a positive-currentpulse, cations will approach the interface of the w and c layersfrom the c layer faster than they are removed (Fig. 6). Simi-larly, the anions will approach the interface of the w and c
layers from the w layer faster than they are removed. Botheffects will tend to increase the concentration of KCI in thew layer. If the conductance of the w layer is proportional tothe concentration of KCI in the w layer, then the positiveconductance will rise during the positive pulse. The reverse
will occur during a negative-current pulse, i.e. the KCI in thew layer will fall and the conductance will decrease. We have
Table 1. Mean Absolute Diffusion Potential (E'0), MeanConductance, and Computed Permeabilities for Cation, P+, andAnion (Always Cl-), P_, in Isolated Citrus Cuticles
E'i and X were measured on the same cuticles; E'i was measuredwith concentration ratios C'/C' = 10 and 0.1 across the cuticle butwith a mean concentration equal to that used for the measurementof X (= CO in this table). All means are given as means ± SE for nsamples. S = Siemens (= mho).SALT CO n E'i Conductance P+ P
molm-3 mV AS ms- x10-9
HCI 5002 4 3.54 ± 1.14 5.55 ± 1.01 19.7 ± 3.54 3.10 ± 0.62
LiCI 500 5 13.2 ± 5.53 207 ± 46 1.09 ± 0.21 2.29 ± 0.612 7 3.21 ± 4.04 2.12 ± 0.31 5.68 ± 0.87 3.05 ± 0.70
NaCI 500 5 3.08 ± 3.57 251 ± 60 1.99 ± 0.40 2.14 ± 0.612 7 20.4 ± 3.2 2.82 ± 0.61 8.59 ± 2.19 3.69 ± 1.04
KCI 500 5 9.42 ± 7.11 293 ± 69 2.61 ± 0.56 2.98 ± 0.912 9 21.2 ± 3.8 3.89 ± 0.61 11.5 ± 1.8 4.49 ± 1.01
CsCI 5002 9 15.2 ± 4.0 4.28 ± 0.62 11.6 ± 2.0 6.27 ± 1.22
277
Dow
nloaded from https://academ
ic.oup.com/plphys/article/97/1/273/6087176 by guest on 17 D
ecember 2021

Plant Physiol. Vol. 97, 1991
Outside
0E
Bllayerw
0E
Insidec
0D 0.
Figure 6. Illustration of current flow carried by K+ and Cl- ions in
water (inside and outside solutions) and in the cuticle bilayer consist-
ing of wax layer (w) and cation exchange layer (c). The arrows show
the direction of ion flow; the length of an arrow is the transport
number (the fraction of current carried by each ion).
constructed mathematical simulation models for this trans-
port-number phenomenon and have confirmed that the mag-
nitude of the effect will increase in proportion to the current.
The transport-number effect will cause a decrease in KCIconcentration in the c layer at the same time that it increases
KCI concentration in the w layer. The magnitude of the
changes in concentration will be equal in both layers, but the
influence of the concentration changes on total cuticle con-
ductance will register most in the w layer because the change
in concentration is a bigger fraction of the initial concentra-
tion in the w layer, and because the electrical conductance is
likely to be much less in the w layer than in the c layer.
Qualitatively, this argument still holds even if t' > 0.5. All
that is necessary is thatt+ - t+ be less than t'. - t'. This will
ensure thatK+ reaches the w layer from the c layer at a faster
rate than K+ reaches the water from the w layer.
At highC° values, the initial concentration of KCI in the w
layer will be more (and probably proportional to the increase
in CO), but the change in concentration due to the transport-
number effect will be proportional only to the magnitude of
the applied current and the pulse width. Although we gener-
ally used a current times larger to measure X at1000 mol
m-3 than at mol m-3, the higher initial concentration of
KCI in the w layer in equilibrium with1000 mol m-3 is likely
to be greater than the change in concentration due to the
transport-number effect. So the percentage change in the
initial concentration would be less, and thus the asymmetry
in conductance would be less when X is measured at 1000
than at1 mol m-3 solution concentration.
Measurements of diffusion potentials and conductance can
be used to compute ion permeabilities. This approach works
equally well with bathing solutions of any concentration. In
the past, most determinations of P were made at high concen-
trations. For example, McFarlane and Berry (3) reported
values at 500 molMm3, which is a physiologically unreasonable
value. Our results show that cation P is five times larger at 2
than at 500 mol m-3. The explanation for the rise in P+ in
terms of Equation 2 is that X declines less rapidly than Co. In
terms of Equation Id, it probably reflects an increase in
partition coefficient, a, and diffusion coefficient, D, as Codeclines. In our view, this is likely to account for of the
increase in P+ as Co declines.It is important to have accurate values of P if we are to
assess the likely effect of nutrient leaching across leaf cuticles
and the nutrient balance of leaves during rain events. Scher-batskoy and Tyree (7) attempted this by measuring the timecourse of change in ion concentration in drops of artificialacidic precipitation applied to the adaxial surface of mapleleaves. They predicted a P+ for K+ and Ca2" in the range of 3to 5 x 10`' m s-'.This determination was imprecise becauseof a large standard deviation in their data and because theelectrical effect on the driving force on cation flux was nottaken into account (12). The computed P+ values also mayhave been too high if the change in concentration in the dropwas due in part to solubilization of dry particulate matter onthe cuticle surface. On the basis of a P+ value of 10-'0 m s-',it was predicted (7) that it would take about 10 d for half theions in the apoplast to leach out of a leaf during a continuousrain event. However, our values of P+ are 50 to 100 times thevalue cited and probably are more accurate (Table I). Ignoringthe effect of electrical potential on ion migration and usingthe values in TableI, we would predict a half-time for washoutof monovalent cations from the apoplast of Citrus leaves of0.1 to 0.2 d during a continuous rain event. But only rarelycan we ignore electrical effects (12).To illustrate how electrical effects can alter ion migration,
consider a simplified model system in which the leaf apoplastcontains only KCI. As KCI diffuses out while the leaf is bathedby distilled water during a continuous "rain" event, the dif-fusion potential generated would make the outside of the leafpositive with respect to the inside, and this would increase thedriving force on Cl- and decrease the force on K+ until J+ =J. Under these conditions, the diffusion coefficient for theKCI salt pair is equal to RTu+u_/F(u+ +u_) (6). From this,it follows that the permeability for the salt pair PKCI = P+P-/(P+ + P_), which approximately equals P_ when P_ << P+. Insome situations, P_ can be much less than P+ (11, 12),although not in this study, and will limit the rate of diffusionof KCI. If P_ for Cl- is about 10-0 m s-', then the half-timefor washout will be nearer to 10 d. In another scenario, wemight consider that the apoplast contains KA at a concentra-tion of 300 mol m-3, where A is an anion with zero permea-bility, i.e. the apoplast is a cation exchange resin filled withK+ as the counter ion. Then consider a "rain" event with NaBrain at approximately the same concentration as that of KA,where B is a soluble anion of zero permeability across thecuticle. In this situation, the diffusion potential might benearly zero, and Na+ on the outside would exchange forK+on the inside. Because Na+ andK+ permeabilities are nearlyequal, the half-time for leaching ofK+ would be 0.2 d or less.The real half-time for cation leaching from real leaves prob-ably will be between these two extremes, i.e. between 0.2 and2 d.A more realistic example might be a rain event in which
H+ is the dominant cation in the bathing solution. BecauseP+ forH+ is >P+ for all other cations (Table I), we mightexpect a rapid exchange diffusion ofH+ ions for other cationsin the apoplast with a short half-time(0.1 to 0.2 d?). Asubstantial diffusion potential is likely to arise in this case(12) that will speed up the influx ofH+ and slow down theefflux of other cations, but the rate-limiting constant will bedetermined by a permeability between that of the HI and theexchangeable cations.We have yet to confirm that the permeability of isolated
278 TYREE ET AL.
Dow
nloaded from https://academ
ic.oup.com/plphys/article/97/1/273/6087176 by guest on 17 D
ecember 2021

ION DIFFUSION AND MOBILITY IN CUTICLES
cuticles is the same as that of intact cuticles on leaves, butour calculations suggest that long rain events could leachsubstantial quantities of nutrients from the apoplast of Citrusleaves under some circumstances. Transcuticular nutrientleaching still may not adversely affect the nutrient balance ofleaves if the combined effects of ion pumps and of thepermeability barrier of plasmalemma membranes reduce therate of leaching from living cells below that predicted fromthe apoplast.
LITERATURE CITED
1. Crank J, Park GS (1968) Mathematics of Diffusion. AcademicPress, London, New York
2. Kedem 0, Katchalsky A (1963) Permeability of composite mem-branes. Part 3. Series array of elements. Trans Faraday Soc 59:1941-1953
3. McFarlane JC, Berry WL (1974) Cation penetration throughisolated leaf cuticles. Plant Physiol 53: 723-727
4. Nobel PE (1983) Biophysical Plant Physiology and Ecology. WHFreeman, New York
5. Reed DW, Tukey HB (1982) Permeability of Brussels sproutsand carnation cuticles from leaves developed in different tem-peratures and light intensities. In DF Cutler, KL Alvin, CE
Price, eds, The Plant Cuticle: Linnean Society of LondonInternational Symposium, London. Academic Press, London,pp 267-278
6. Robinson RA, Stokes RH (1970) Electrolyte Solutions. Butter-worths, London
7. Scherbatskoy TD, Tyree MT (1990) Kinetics of exchange of ionsbetween artificial precipitation and maple leaf surfaces. NewPhytol. 114: 703-712
8. Schonherr J, Bukovac MJ (1973) Ion exchange properties ofisolated tomato fruit cuticular membrane: exchange capacity,nature of fixed charges and cation selectivity. Planta 109: 73-93
9. Schonherr J, Huber R (1977) Plant cuticles are polyelectrolyteswith isoelectric points around three. Plant Physiol 59: 145-150
10. Tyree MT (1968) Determination of transport constants of iso-lated Nitella cell walls. Can J Bot 46: 317-327
11. Tyree MT, Scherbatskoy TD, Tabor CA (1990) Leaf cuticlesbehave as asymmetric membranes. Evidence from the meas-urement of diffusion potentials. Plant Physiol 92: 103-111
12. Tyree MT, Tabor CA, Wescott CR (1990) Movement of cationsthrough cuticles of Citrus aurantium and Acer saccharum.Diffusion potentials in mixed salt solutions. Plant Physiol 94:120-126
13. Woermann D (1976) Mass transport across membranes. In CRStocking, U Heber, eds, Encyclopedia of Plant Physiology, Vol3. Berlin, Springer-Verlag, pp 419-464
279
Dow
nloaded from https://academ
ic.oup.com/plphys/article/97/1/273/6087176 by guest on 17 D
ecember 2021