differing mechanisms of hepatic glucose overproduction in ...cnc.cj.uc.pt/beb/private/pdfs/rmn/jin...
TRANSCRIPT

E-00365-2004.R1
Differing Mechanisms of Hepatic Glucose Overproduction in
Triiodothyronine-Treated Rats versus Zucker Diabetic Fatty Rats by NMR Analysis of Plasma Glucose
Eunsook S. Jin1*, Shawn C. Burgess1, Matthew E. Merritt1, A. Dean Sherry1,2 and Craig R. Malloy1,3
From the: 1The Mary Nell and Ralph B. Rogers Magnetic Resonance Center, Dept. of Radiology, University of Texas Southwestern Medical Center, Dallas, TX 75235-9085;
2Department of Chemistry, University of Texas at Dallas, Richardson, TX 75083-0688;
3VA North Texas Health Care System, Dallas, TX 75216. *Corresponding author:
Dr. Eunsook Jin Mary Nell and Ralph B. Rogers Magnetic Resonance Center 5801 Forest Park Road Dallas, TX 75235-9085 Telephone: 214-648-5893 FAX: 214-648-5881 E-mail: [email protected]
Running title: Glucose overproduction in hyperthyroid and ZDF rats
Articles in PresS. Am J Physiol Endocrinol Metab (November 23, 2004). doi:10.1152/ajpendo.00365.2004
Copyright © 2004 by the American Physiological Society.

Jin et al. Glucose overproduction in hyperthyroid and ZDF rats page 2 ABSTRACT
The metabolic mechanism of hepatic glucose overproduction was investigated in 3,3’-5-triiodo-
L-thyronine(T3)-treated rats and Zucker diabetic fatty (ZDF) rats (fa/fa) after a 24 hr fast. 2H2O and [U-
13C3]propionate were administered i.p. and [3,4-13C2]glucose was administered as a primed infusion for 90
min under ketamine/xylazine anesthesia. 13C NMR analysis of monoacetone glucose derived from
plasma glucose indicated that hepatic glucose production was 2-fold higher in both T3-treated rats and
ZDF rats compared to controls yet the sources of glucose overproduction differed significantly in the two
models by 2H NMR analysis. In T3-treated rats, the hepatic glycogen content and hence the contribution
of glycogenolysis to glucose production was essentially zero; in this case, excess glucose production was
due to a dramatic increase in gluconeogenesis from TCA cycle intermediates. 13C NMR analysis also
revealed increased PEPCK flux (4×), increased pyruvate cycling flux (4×), and increased TCA flux (5×)
in T3-treated animals. ZDF rats had substantial glycogen stores after a 24 hr fast and consequently nearly
50% of plasma glucose originated from glycogenolysis; other fluxes related to the TCA cycle were not
different from controls. The differing mechanisms of excess glucose production in these models were
easily distinguished by integrated 2H and 13C NMR analysis of plasma glucose.
KEYWORDS: gluconeogenesis, glycogenolysis, type 2 diabetes, thyroid hormone, isotopes

Jin et al. Glucose overproduction in hyperthyroid and ZDF rats page 3
INTRODUCTION
Although the pathways contributing to glucose production are well established, less is known
about the effects of disease on hepatic glucose output in humans. Earlier studies examined selected
aspects of glucose production in the Zucker diabetic fatty (ZDF) rat (fa/fa) and the 3,3’-5-triiodo-L-
thyronine (T3)-treated rat. Studies in T3-treated animals focused on gluconeogenesis from the TCA cycle,
particularly flux through phosphoenol pyruvate carboxykinase (PEPCK) and cycling pathways associated
with phosphoenol pyruvate (PEP). PEP can undergo dephosphorylation to pyruvate by pyruvate kinase
(PK) rather than conversion to glucose, an apparent energy-wasting process. Rognstad (26) and Cohen et
al. (5) found that flux through PK was significantly higher in hepatocytes isolated from T3-treated rats.
Later, Petersen et al. showed that direct conversion of malate to pyruvate via the malic enzyme (ME) also
contributes to this futile cycle and cannot be distinguished from the OAA → PEP → pyruvate → OAA
cycle using isotope methods (22). Flux through these combined pathways, referred to as pyruvate
recycling (7) or simply pyruvate cycling (17), is increased in livers of T3-treated rats in vivo (23).
Most investigations of glucose production in ZDF rats have focused on glycogen metabolism.
Among patients with poorly-controlled type 2 diabetes mellitus (T2DM), gluconeogenesis has a causative
role in hepatic glucose over-production in the fasted state and glycogenolysis has been reported to be
similar or less than control human subjects (10, 18-19). A male ZDF rat is an animal model of obesity
and T2DM, yet studies of ZDF rats suggest that glycogenolysis may play an important role in
hyperglycemia in the fasted state. Hepatocytes from fasted ZDF rats have higher rates of glycogen
synthesis than hepatocytes from lean Zucker rats (20), and glycogen stores are preserved to a greater
extent in ZDF rats compared to lean animals during starvation (30). Consequently, glycogenolysis may
provide a source of glucose not available in lean animals after fasting.
These data suggest that metabolic fluxes associated with glucose production of T2DM and hyper-
thyroidism may differ substantially. However, only a subset of relevant pathways was examined in each
study, and the requirement of most methods for liver tissue restricts use of these methods in humans. 13C

Jin et al. Glucose overproduction in hyperthyroid and ZDF rats page 4 and 2H NMR offer a flexible, comprehensive and essentially non-invasive approach to analysis of
metabolic fluxes in vivo. One important advance was the ability to monitor glycogen stores in vivo by 13C
NMR which provides a direct measure of glycogenolysis (10,18, 25). Other methods to characterize
glucose production require only analysis of blood samples (15). Jin et al. recently introduced the use of
13C NMR coupled with [3,4-13C2]glucose to measure glucose turnover (14). This approach is convenient
because the characteristic 13C -13C spin-spin coupling in tracer carbons 3 and 4 is easily distinguished
from 13C enrichment in carbon positions 1, 2, 5 or 6 that arises from 13C label entering the TCA cycle
from labeled gluconeogenic precursors. Further, the presence of low levels of 13C enrichment in plasma
glucose does not interfere with analysis of deuterium exchange in the same experiment using 2H NMR.
Thus, this triple tracer method allows multiple aspects of systemic glucose production to be probed in a
single experiment.
The objective of this study was to measure fluxes in relevant pathways using only 13C and 2H
NMR of plasma glucose in two previously studied rat models of excess glucose production. We tested
the hypothesis that the distribution of 13C and 2H in plasma glucose would be sensitive to these two
disease states and that the sources of excess glucose production in these two models would differ.
Although glucose production was identical in both ZDF and T3-treated rats and significantly elevated
compared to normal controls, the metabolic networks supporting glucose production in T3-treated and
ZDF animals differed substantially. Since these measurements may be obtained from a single sample of
plasma glucose, extension of the technique to humans is straightforward.
MATERIALS AND METHODS
Materials
ZDF rats (fa/fa) were a generous gift from Dr. Roger H. Unger of the VA North Texas Health
Care System, Dallas, TX. [3,4-13C2]glucose (99%) was purchased from Omicron Biochemicals (South
Bend, IN). [U-13C3]propionate (99%), 2H2O (99.9%), and deuterated acetonitrile (99.8%) were obtained
from Cambridge Isotopes (Andover, MA). DSC-18 solid-phase extraction (SPE) gel was obtained from

Jin et al. Glucose overproduction in hyperthyroid and ZDF rats page 5 Supelco (St. Louis, MO). Protein assay reagents were purchased from Bio-Rad (Hercules, CA). Other
common chemicals were purchased from Sigma (St. Louis, MO).
Protocol
The study was approved by the Institutional Animal Care and Use Committee at the University of
Texas Southwestern Medical Center. Three different groups of rats were studied: male Sprague-Dawley
rats (220 ± 31g), T3-treated male Sprague-Dawley rats (236 ± 16 g after T3 treatment) and 19-20 week old
male ZDF rats (482 ± 68 g). T3-treated rats were given T3 in their drinking water for 5 days before
initiation of the experiment. One liter of drinking water was prepared by dissolving 2 mg of T3 into 200
µL of NaOH (50 mM) followed by dilution to 1 L. This solution was added to each liter of drinking
water. T3-treated rats lost 20.7 ± 8.4 g during 5 days of T3 treatment including the 24 hr fasting period.
All rats were fasted for 24 hr with free access to water after which the jugular vein was cannulated under
ketamine-xylazine anesthesia. Rats received an intraperitoneal injection (20 µL/g rat) containing [U-
13C3]propionate (5 mg/mL) dissolved in 2H2O. Immediately following this injection, each rat received a
bolus infusion of 3.5 mg [3,4-13C2]glucose (99%) followed by continuous infusion of [3,4-13C2]glucose
(4.0 mg/mL water) at a rate of 1.0 mL/hr for 90 min. At the conclusion of the 90 min infusion period,
blood was drawn from the descending aorta and the liver was freeze-clamped and stored at the –80°C
until processed.
Sample Processing for NMR Analysis
Blood was immediately centrifuged and plasma supernatant was deproteinized by adding cold
perchloric acid to a final concentration of 7% by volume. After neutralization with KOH and
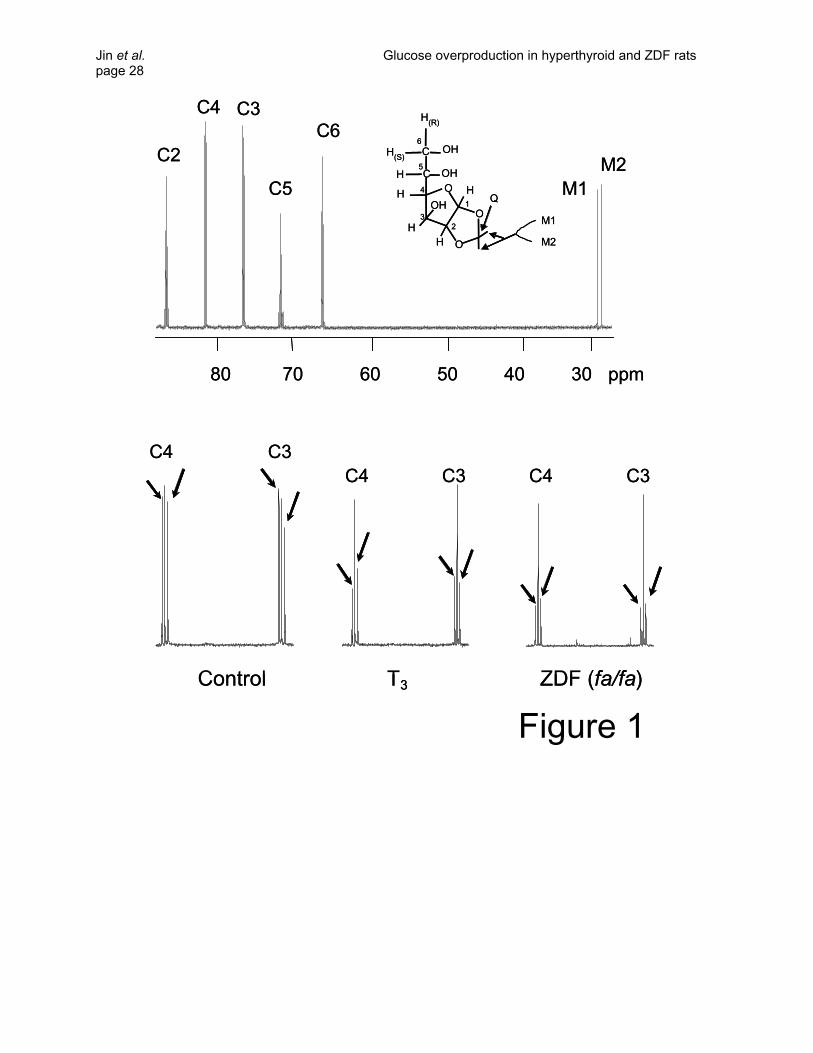
centrifugation, the supernatant was lyophilized. To convert plasma glucose into monoacetone glucose
(MAG, Figure 1), the dried residue was suspended in 3.0 mL of acetone containing 120 µL of
concentrated sulfuric acid. The mixture was stirred for 4 hr at room temperature to yield diacetone

Jin et al. Glucose overproduction in hyperthyroid and ZDF rats page 6 glucose. After filtering off particulates and adding 3 mL of water, the pH was adjusted to 2.0 by dropwise
addition of 1.5M Na2CO3. The mixture was stirred for 24 hr at room temperature to convert diacetone
glucose into MAG. The pH was then further increased to ~8.0 by dropwise addition of Na2CO3. Acetone
was evaporated under a vacuum and the sample was freeze-dried. MAG was extracted into 3 mL (5x) of
hot ethyl acetate, the solutions were combined and the ethyl acetate was removed by vacuum evaporation.
The resulting MAG was further purified by passage through a 3 mL DSC-18 cartridge using 5%
acetonitrile as eluant. The effluent was freeze-dried and stored dry prior to NMR analysis.
A 5-10 g portion of liver tissue was used for glycogen extraction and purification (21). Isolated
liver glycogen was dissolved in 5 mL of 10 mM sodium acetate solution (pH 4.8) and incubated with
amyloglucosidase (50 mg glycogen/20 units of amyloglucosidase) for 4 hr at 50 °C. After freeze-drying,
the glucose was converted to MAG as described above.
NMR Spectroscopy
MAG was dissolved in 90% acetonitrile-10% water. 2H NMR spectra were collected using a
Varian INOVA 14.1 T spectrometer (Varian Instruments, Palo Alto, CA) equipped with 3-mm broadband
probe with the observe coil tuned to 2H (92.1 MHz). Shimming was performed on selected 1H resonances
of MAG detected via the decoupler coil. Proton-decoupled 2H NMR spectra were acquired at 50 °C using
a 90° pulse and a repetition rate of 1 s. Typically 6,000-20,000 scans were acquired for plasma samples
and 60,000-70,000 scans for liver samples. Proton decoupling was performed using a standard WALTZ-
16 pulse sequence. 2H NMR spectra were analyzed by Bayesian Analysis (Varian Instruments, Palo Alto,
CA) and NUTS® PC-based NMR spectral analysis program (Acorn NMR Inc., Freemont, CA).
13C NMR spectra were collected using the same spectrometer and probe with the observe
coil tuned to 13C (150 MHz). Prior to 13C spectroscopy, the MAG samples were dried and
resuspended in deuterated acetonitrile. Proton-decoupled 13C NMR spectra were acquired at
25°C using a 52° observe pulse, 1.5-s acquisition time and no delay between pulses. Typically
Jin et al. Glucose overproduction in hyperthyroid and ZDF rats page 7 15,000 - 40,000 scans were required. 13C NMR spectra were analyzed using the curve-fitting
routine supplied with NUTS®. 2H2O enrichment in plasma of ZDF rats was determined as
described previously (16).
Glucose Turnover and Metabolic Fluxes
Glucose turnover was estimated from the dilution of infused [3,4-13C2]glucose using 13C NMR to
analyze MAG derived from plasma glucose at the end of the infusion protocol (14). Briefly, the fraction
of [3,4-13C2]glucose in plasma glucose was determined from the ratio of the areas of the doublet due to J3,4
in carbon 3 (at 75.3 ppm) and in carbon 4 (at 80.5 ppm) compared to the total area of the two methyl
resonances (at 26.1 and 26.7 ppm). Since the methyl resonances reflect natural abundance 13C, the
fraction of [3,4-13C2]glucose in MAG was evaluated based upon standard curves (14). Glucose
production was calculated from the known infusion rate (Ri), the fraction of infusate glucose that was
[3,4-13C2]glucose (Li), and the fraction of plasma glucose that was [3,4-13C2]glucose (Lp) at the end of the
infusion period:
v1 = glucose production = Ri ⋅ (Li - Lp) / Lp (1)
Flux from glycogen, glycerol, and PEP into plasma glucose was estimated from the deuterium enrichment
at positions 2, 5 and 6S as determined from the 2H NMR of MAG.
v2 = flux from glycogen = v1⋅(H2 – H5)/H2 (2)
v3 = flux from glycerol = 2⋅v1⋅(H5 – H6s)/H2 (3)
v4 = flux from PEP = 2⋅v1⋅H6s/H2 (4)
A 13C NMR isotopomer analysis based on the 13C-13C spin-coupled multiplets of C2 of MAG has been
reported previously which yields relative fluxes in the citric acid cycle as follows:
v4/v7 = (C2Q-C2D23)/C2D23 (5)
v5/v7 = (C2D12-C2Q)/C2D23 (6)
v6/v7 = (C2D12–C2D23)/C2D23 (7)
Jin et al. Glucose overproduction in hyperthyroid and ZDF rats page 8 where the variables C2Q, C2D12, and C2D23 are the areas of the quartet, doublet due to J12, doublet due
to J23, relative to the area of the C2 resonance. The assumptions in the metabolic model include 1) all
glucose originates from the liver, 2) hydrolytic conversion of glycogen to glucose via amylo-1,6-
glucosidase is negligible, 3) there is insignificant labeling of acetyl-CoA entering the TCA cycle from
either tracer [3,4-13C2]glucose or [U-13C3]propionate, 4) there is complete equilibration of all 13C enriched
four-carbon intermediates in the TCA cycle, and 5) steady-state metabolic conditions apply (17).
[3,4-13C2]glucose is an ideal tracer of glucose turnover when used in combination with [U-
13C3]propionate as a tracer of the TCA cycle. It is assumed that any metabolism of [3,4-13C2]glucose to
the level of a triose followed by resynthesis to glucose yields only [3-13C]glucose or [4-13C]glucose since
the absolute enrichment of the triose pool is low and de novo generation of [3,4-13C2]glucose is
negligible. Another important aspect of this glucose tracer is that any metabolism of [3,4-13C2]glucose to
pyruvate followed by carboxylation to OAA, continued metabolism in the TCA cycle, and resynthesis to
glucose can only produce [3-13C]glucose or [4-13C]glucose. This feature means that 13C enrichment
patterns in glucose carbons 1 and 2 (or 5 and 6) can only be derived from metabolism of [U-
13C3]propionate.
Each variable used to describe the metabolic results (v1 – v7) generally describes the combined
actions of multiple enzyme catalyzed reactions. For example, v2 indicates the rate of generation of
glucose-6-phosphate from glycogen, without implying measurement of flux in a specific reaction.
Similarly, v5 is used to describe the flux of carbon skeletons from the PEP / pyruvate pool through
carboxylation and regeneration of OAA. Flux from OAA to pyruvate to OAA can occur via the
combined effects of either malate dehydrogenase, the malic enzyme and pyruvate carboxylase, or
PEPCK, pyruvate kinase and pyruvate carboxylase. Hence, v5 simply designates the sum of fluxes
through both pathways. Pyruvate carboxylase is common to both pathways, so v5 is also a lower limit on
total flux through pyruvate carboxylase.
Metabolite Assays

Jin et al. Glucose overproduction in hyperthyroid and ZDF rats page 9
Plasma glucose was assayed enzymatically (2). Freeze-clamped livers were pulverized under
liquid nitrogen and a small portion (< 0.5 g) was extracted with perchloric acid (6%) and subsequently
used for glycogen and lactate assays (2). The remaining portion of each pulverized liver (~5g) was
suspended in 25 ml of 20 mM Tris-HCl (pH 7.4) buffer containing 0.25 M sucrose, 0.1mM dithiothreitol,
and 0.1mM EDTA, homogenized and centrifuged at 800 × g for 10 min to remove cell debris. The
supernatant was further centrifuged for at 8,500 × g for 15 min to separate a mitochondrial pellet. The
pellet was washed (3×) with the buffer and the pellet was resuspended in 1.5-ml buffer. This represented
the mitochondrial fraction while the supernatant represented the cytosolic fraction. Total protein in the
mitochondrial and cytosolic fractions were measured using Bio-Rad assay reagents (3). The activities of
ME and PK were determined on the cytosolic fraction (4, 11). Malate in cytosolic fraction was measured
enzymatically (2).
Statistical Analysis
The data are expressed as mean ± standard deviation. Comparisons between groups were
performed using one-way analysis of variance. A p value < 0.05 was considered significant.
RESULTS
Glucose Production by Dilution of [3,4-13C2]glucose
Plasma glucose was higher in ZDF rats after a 24 hr fast than in T3-treated rats and controls
(Table 1). Typical 13C NMR spectra of MAG from a T3-treated rat, a ZDF rat and a control rat are shown
in Figure 1. The doublets of [3,4-13C2]glucose were well resolved from the singlet and from other
multiplets of glucose isotopomers originated through gluconeogenic pathways from [U-13C3]propionate.
A comparison of the doublet component areas of the C3 (75.3 ppm) and C4 (80.5 ppm) resonances
relative to the natural abundance methyl resonances provided a direct readout of [3,4-13C2]glucose
enrichment in plasma. These were 3.77 ± 0.65%, 1.66 ± 0.38% and 0.82 ± 0.16 % for control, T3-treated,

Jin et al. Glucose overproduction in hyperthyroid and ZDF rats page 10 and ZDF rats, respectively. Given the known infusion rates of [3,4-13C2]glucose, this corresponds to
glucose production rates of 40.4, 94.5 and 86.5 µmol/kg/min, respectively (Table 2). This indicates that
hepatic glucose production was ~2-fold higher both in T3-treated rats and in ZDF rats compared to
controls.
Glycogen Stores and Sources of Plasma Glucose by 2H NMR
Liver glycogen was essentially depleted in control animals and in T3-treated rats after a 24 hr fast
but remained high (112.7 ± 9.3 µmol glucosyl unit/gww, Table 1) in ZDF rats after a similar period of
fasting. This was also reflected in the contribution of hepatic glycogen to plasma glucose as determined
by 2H NMR (Figure 2) where the H5/H2 was close to 1 in controls and T3-treated rats but only 0.53 ±
0.04 (see Figure 2c) in ZDF rats. This value indicates that approximately half of the plasma glucose in
ZDF rats is derived from glycogen with the remainder coming from either glycerol or the TCA cycle.
The difference between H5 and H6s was modest for all three groups with the fractional contribution of
glycerol to glucose ranging from 13 to 17% (Table 2). The H6s/H2 ratio, an index of the contribution of
PEP to glucose production, was ~80% in controls and T3-treated rats, but significantly lower, 40%, in
ZDF rats (Table 2).
The absolute rates of glucose formation from glycogen, PEP, and glycerol were determined by
multiplying the individual fractional contributions times the glucose production rates. These values are
summarized in Table 2. Glycogenolysis was ~41 µmol/kg/min in ZDF rats but negligible in controls and
T3-treated rats. Gluconeogenesis from glycerol was significantly higher in both T3-treated rats (p < 0.05)
and ZDF rats (p < 0.01) compared to controls while gluconeogenesis from PEP was ~2-fold higher in T3-
treated rats than controls and ZDF rats.
13C Labeling in Plasma Glucose

Jin et al. Glucose overproduction in hyperthyroid and ZDF rats page 11
Entry of [U-13C3]propionate into the TCA cycle via propionyl-CoA, methylmalonyl-CoA and
succinyl-CoA and subsequent turnover produces a mixture of 13C isotopomers in all intermediates and in
molecules in exchange with those intermediates. Since glucose is derived from OAA, one would
anticipate that MAG derived from plasma glucose would show extensive couplings in its 13C NMR
spectrum (Figure 3). To confirm that plasma glucose had achieved isotopic steady-state enrichment from
[U-13C3]propionate, an additional experiment was performed using 24-hr fasted Sprague-Dawley rats (n =
3, 251 ± 15 g). The same amount of [U-13C3]propionate/2H2O was injected intraperitoneally and blood
was drawn from the descending aorta at different time points (60 min, 120 min and 150 min). Plasma
glucose at each time point was converted into MAG and scanned by 13C NMR. As illustrated in the top
graph of Figure 3, the C2 multiplet ratios, Q/D23 and D12/D23, seen in the spectra of MAG were
relatively constant and similar to the values measured in spectra of MAG derived from control animals at
90 min. Over the entire study period (60 to 150 min), the D12/D23 and Q/D23 ratios varied no more than
5.3-5.6 and 2.5-2.7, respectively (Figure 3a). Conversely, the absolute 13C enrichment of carbon 2 of
plasma glucose as estimated from 1H NMR spectra of MAG (15) was 3.5 ± 0.1% at 60 min, 4.4 ± 0.3% at
90 min, 3.1 ± 0.4% at 120 min, and 2.3 ± 0.4% at 150 min. This indicates that while the total contribution
of [U-13C3]propionate to plasma glucose reaches a maximum at 90 min, the multiplet ratios which were
used to derived the metabolic fluxes reported here were indeed constant over this study period.
Figure 3 shows that the multiplet pattern of the MAG C2 resonance from a T3-treated rat differed
from that of a control and a ZDF rat. In particular, the doublet due to J23 is larger than that of quartet in
MAG from a T3-treated rat compared to control and ZDF animals. An analysis of the C2 multiplets using
equations 5-7 provides a measure of flux through PEPCK, pyruvate cycling and gluconeogenesis all
relative to citrate synthase flux. These data indicate that all three flux ratios (v4/v7, v5/v7, v6/v7) were
significantly smaller in T3-treated rats compared to ZDF or control rats (Table 2). However, upon
converting these flux ratios into absolute flux values via the metabolic network shown in Figure 4, a
somewhat different picture emerges. Specifically, absolute flux from PEP glucose (v4) was ~2-fold
greater, PEPCK flux (v6) and pyruvate cycling (v5) fluxes were ~4-fold greater, and TCA cycle flux (v7)

Jin et al. Glucose overproduction in hyperthyroid and ZDF rats page 12 was ~5-fold greater in T3-treated animals than either ZDF rats or controls while these same absolute
fluxes did not vary significantly between ZDF and control rats. It was also interesting that the total
mitochondrial protein content and the mitochondrial pellet volume in livers of T3-treated rats was ~2-fold
higher than in either ZDF or control rats (Table 1) consistent with an increased TCA cycle capacity in
these animals.
2H NMR Analysis of Liver Glycogen in Conscious ZDF Rats
The fact that glycogen stores in ZDF rats were preserved after a 24-hr fast (Table 1) suggests
reduced glycogenolysis coupled with perhaps increased gluconeogenesis. However, the distribution of 2H
in plasma glucose (Figure 2) indicates that substantial glycogenolysis does occur in livers of ZDF rats.
To evaluate this apparent discrepancy, additional experiments were performed with a similar group of 24-
hr fasted ZDF rats. The same amount of 2H2O/[U-13C3]propionate was injected intraperitoneally into the
conscious rats without measurement of glucose turnover. Animals were sacrificed at 90 minutes under
ketamine/isoflurane anesthesia, hepatic glycogen was isolated and converted to MAG, and 2H spectra
were collected (Figure 5). The 2H2O enrichment of plasma water in these ZDF rats was 2.8 ± 0.3%. If
liver glycogen synthesis was active during the 90-min period following 2H2O injection, a significant 2H
enrichment in glycogen would have been expected. Experimentally, the 2H enrichment in H2 of MAG
was ~0.27% showing that glycogen synthesis was indeed active in conscious ZDF rats in the fasted state.
Liver glycogen cycling was also substantial as confirmed by low H5/H2 ratio in Figure 5.
DISCUSSION
This study demonstrates that patterns of glucose production may be distinguished by a simple
NMR analysis of tracers in plasma glucose. The general features of abnormal glucose metabolism esta-
blished in prior invasive studies were confirmed using only plasma samples, including the preserved cap-
acity for glycogen release in ZDF animals and increased flux in the pyruvate cycling in T3-treated ani-
mals. To our knowledge, this is the first report detecting abnormal pyruvate cycling in the liver using only

Jin et al. Glucose overproduction in hyperthyroid and ZDF rats page 13 plasma samples, and it is the first demonstration that preserved glycogen stores in ZDF animals are asso-
ciated with excess glucose production from glycogen. The study also illustrates the advantages of judi-
cious selection of tracers. The distinct advantage of [3,4-13C2]glucose as a tracer of glucose turnover is
that it does not interfere with the simultaneous use of [U-13C3]propionate as a tracer of TCA cycle activity
to measure pyruvate cycling, or the use of 2H2O as a tracer to measure the relative contributions of gly-
cerol, glycogen and the TCA cycle to glucose production by 2H2O NMR. This approach may be easily
extended to humans and the comparable spectral quality obtained on samples of glucose collected from
rodents versus humans further supports the potential for the integration of stable isotopes and NMR
analysis into routine clinical exams.
Role of Glycogen in Excess Glucose Turnover in ZDF Rats
The role of hepatic glucose production in the hyperglycemia of T2DM is controversial. Recent
studies suggested that excess hepatic gluconeogenesis plays a causative role in hyperglycemia (10, 18-
19). While the current study involves only an animal model of T2DM, it illustrates the value of
simultaneous measurement of all sources of glucose. In fed ZDF rats, glycerol was reported to be a major
substrate for hepatic glucose production (29). While statistically significant increases in gluconeogenesis
from glycerol were confirmed in ZDF animals in this study, these changes were modest in the context of
total glucose production and the overall impact of this change was small (Figure 4).
The main observations were that the glycogen content was higher in ZDF animals after a 24-hr
fast compared to controls which correlated with the noninvasive 2H NMR analysis, and that increased
glycogenolysis rather than excess gluconeogenesis was the source of increased glucose production under
these conditions. Earlier reports demonstrated that the glycogen content is higher in obese ZDF animals
and, paradoxically, that glycogen stores are higher after a 6-day fast compared to a 2-4-day fast (30).
Earlier reports also indicated that hepatocytes from obese ZDF rats had a higher rate of glycogen
synthesis compared to hepatocytes from lean ZDF rats (20). However, others have reported impaired
glycogen synthesis in ZDF animals (1, 31). The mechanism of preserved glycogen stores in these

Jin et al. Glucose overproduction in hyperthyroid and ZDF rats page 14 animals could be the result of reduced glycogenolysis, increased glycogen synthesis, or combination of
both. The observation that the H2 of glycogen glucosyl units are enriched with 2H suggests continued
glycogen synthesis in fasted animals, yet a role for reduced glycogenolysis cannot be excluded. Since the
hyperglycemia of ZDF rats may be an important inhibitor of glycogenolysis (24), the mechanism of
preserved glycogen stores in these animals is unclear. However, there is no doubt (see the 2H NMR
spectra in Figure 2) that the preserved glycogen stores can be mobilized, at least during the conditions
used in the present experiments.
The activity of two key enzymes that may be involved with pyruvate cycling, PK and ME, were
increased significantly in ZDF animals (Table 1), as was the concentration of malate, the substrate for the
ME. Together these measurements might be interpreted as strong evidence for increased pyruvate cycling
which would fit nicely with a possible requirement for increased NADPH to support lipogenesis in ZDF
rats. In spite of these indirect measurements suggesting an increase in flux through pyruvate cycling, the
absolute pyruvate cycling flux as measured by NMR in ZDF animals (160 ± 52 µmol/kg/min) was
virtually identical to that measured for controls (154 ± 43 µmol/kg/min).
Excess Gluconeogenesis via the TCA Cycle in T3-Treated Rats
This study used a different approach to measure pyruvate cycling compared to prior studies in T3-
treated rats (5,22-23). Cohen et al. (5) provided [3-13C]alanine as a source of 13C enrichment in pyruvate,
the substrate of pyruvate carboxylase. The appearance of 13C in glucose position 2 occurs as a cones-
quence of equilibration of OAA with fumarate as well as forward flux through the TCA cycle and is
independent of pyruvate cycling activity. However, the appearance of 13C in alanine position 2 can only
occur as the result of pyruvate cycling, so the ratio of 13C enrichment in alanine C2 relative to glucose C2
served as an index of pyruvate cycling flux. Later, Petersen et al. (23) explicitly stated that pyruvate

Jin et al. Glucose overproduction in hyperthyroid and ZDF rats page 15 cycling relative to total output of carbon skeletons to the TCA cycle is equal to ([[2-13C]
alanine]/[alanine]) ÷ ([[2-13C] glucose]/[glucose]). The validity of the model was confirmed over a wide
range of metabolic conditions by using tcaSIM (13, footnote 1). Although the mathematical simplicity in
Petersen’s model is attractive, these flux measurements require excision of the liver to measure 13C
enrichment in hepatic alanine.
Hyperthyroidism causes increased hepatic glucose production and a dramatic alteration of hepatic
mitochondrial function, including increased oxygen consumption, protein content, and longer and more
numerous cristae (12, 27, 32). These prior observations are entirely consistent with an enhanced TCA
cycle flux as found here for T3-treated rats. One might anticipate that such a dramatic increase in TCA
cycle flux as found here for T3-treated rats might lead to proportional excess glucose production in these
animals. However, pyruvate cycling flux was also dramatically higher in T3-treated animals and this
levels much of the excess cataplerotic flux from the cycle (v6) by redirecting a larger percentage of those
carbons back into the TCA cycle. The net effect is that gluconeogenesis from PEP is only 120% higher in
T3-treated rats compared to ZDF or control animals even though TCA cycle flux (v7) and total
cataplerotic outflow (v6) are 380% and 250% higher, respectively, in T3-treated rats compared to ZDF or
control animals. These results suggest that pyruvate cycling may play a functional role in protecting
against overproduction of glucose production in liver by modulating gluconeogenesis from the TCA cycle
during alterations in mitochondrial activity.
This study compared metabolic fluxes in controls, T3-treated rats and ZDF rats after a 24-hr fast
and during ketamine-xylazine anesthesia. Both T3-treated rats and ZDF rats showed enhanced gluconeo-
genesis from glycerol compared to control animals. The distinguishing feature of T3-treated rats was
enhanced gluconeogenesis from the TCA cycle and excess pyruvate cycling compared to both ZDF and
controls. For ZDF rats, the characteristic metabolic pattern was excess glycogenolysis, possibly
stimulated by surgical stress or anesthesia (9). The important observation was that the distribution of 2H
in plasma glucose correctly reported the preserved glycogen stores. Based on the 2H labeling in glucosyl
Jin et al. Glucose overproduction in hyperthyroid and ZDF rats page 16 units of glycogen (Figure 5), it appears that glycogen synthesis continues in livers of ZDF rats even
during fasting.
It is also interesting that despite increased ME and PK activities and higher steady state levels of
malate in ZDF rats, the measured pyruvate cycling flux (v5) did not differ from control animals.
However, this observation should be interpreted with caution because it is based on fluxes normalized to
body mass. ZDF rats would have higher fluxes than the values in Table 2 if the values were reported per
rat. For example, the pyruvate cycling would be ~36 µmol/rat/min (154 µmol /kg/min × 0.236 kg) for
controls and ~77 µmol/rat/min (159.9 µmol /kg/min × 0.482 kg) for ZDF rats without normalization to
body mass. With that perspective, the measured activities of ME and PK are fully consistent with
measured pyruvate cycling fluxes in controls and ZDF rats. If we expand the unit into gluconeogenesis,
again ZDF rats would have higher gluconeogenesis than controls. Conversely, cytosolic malate levels
were no different in controls versus T3-treated animals and ME and PK activities differed only slightly,
yet pyruvate cycling flux was ~4-fold higher in T3-treated animals compared to controls. These
observations underscore the importance of combining flux measurements with assays of enzyme activity
or metabolite levels for highlighting metabolic phenotype differences.
Previously we reported that a primed 90-min infusion was sufficiently long to accurately measure
glucose turnover in rats by comparing the 90 min results with those after a primed 150-min infusion (14).
Ideally steady-state should be confirmed in turnover measurements by serial blood samples in each rat
over the infusion time course, but this was not practical in the current study due to the inherently low
sensitivity of NMR, especially 2H NMR. Previous NMR studies from other labs have also indicated that
steady state was achieved after primed 60-min infusion in rats (28). An earlier report found that steady
state in plasma glucose specific radioactivity during infusion of [3H]glucose was achieved very quickly
and was maintained throughout a 15 min to 120 min infusion period in ZDF rats (29). Based on these
previous observations, a 90-min infusion period was considered sufficient to reach steady state in the
present experiments for both control and ZDF rats.
Jin et al. Glucose overproduction in hyperthyroid and ZDF rats page 17
The constant ratios of D12/D23 and Q/D23 of C2 resonances from rats at different time points
(Figure 3) also indicates that isotopic steady state enrichment of plasma glucose from [U-13C3]propionate
was achieved at 90 min. Since [U-13C3]propionate was administered as a bolus, the absolute 13C
enrichment was not constant throughout the study period. However, it is important to underscore the fact
that analysis of glucose C2 (or MAG C2) depends only on the multiplet patterns detected in the 13C NMR
spectrum, not on the absolute 13C enrichment.
Glucose production was assumed to originate from the liver in these experiments even though one
cannot exclude production from other organs such as kidney. The role of the kidney in glucose
production during disease states is essentially unknown. Approximately 20% of glucose production is
considered to come from kidney in postabsorptive state of normal humans (6, 8). If gluconeogenesis from
the kidney (or small intestine) is significant in the current studies, the estimates of systemic production of
glucose from glycogen, gluconeogenesis from glycerol and gluconeogenesis from the TCA cycle would
remain unaltered. However, gluconeogenesis reported here as occurring in the liver would be decreased
in proportion to the flux through gluconeogenesis occurring elsewhere. The model used to interpret the
spectra, of course, is independent of the observation that 2H and 13C distribution in plasma glucose was
altered in these models of disease.
In summary, two animal models of excess systemic glucose turnover were chosen based on
earlier reports that suggested glucose production may be increased via different mechanisms. The
metabolic patterns observed in these animals using only stable tracer distribution in plasma glucose
corresponded well with those reported by more invasive methods. Obvious clinical applications are
suggested by these experiments. For example, T2DM is a heterogeneous disorder where the contributions
of excess gluconeogenesis from the TCA cycle, gluconeogenesis from glycerol, versus glycogenolysis to
glucose homeostasis remains controversial and the impact of drug therapy is poorly understood. In other
disorders, for example fatty liver, measurement of hepatic TCA cycle flux is critical to understanding the
balance between fat storage and fatty acid oxidation. This study increases confidence in this analysis
using only plasma samples of glucose.
Jin et al. Glucose overproduction in hyperthyroid and ZDF rats page 18
ACKNOWLEDGEMENTS
We thank Charles Storey and Angela Milde for outstanding technical support. This study was
supported in part by the National Science Foundation and grants RR-02584 and HL-34557 from the
National Institutes of Health.
Jin et al. Glucose overproduction in hyperthyroid and ZDF rats page 19
Footnote 1
tcaSIM is a shareware software package (http://www4.utsouthwestern.edu/rogersnmr) that
accepts operator-determined relative fluxes in the TCA cycle and gluconeogenesis as well as 13C
enrichment patterns in the input molecules. For example, the model accepts flux through
pyruvate kinase (PK), flux through pyruvate carboxylase (YPC) and flux through combined
anaplerotic reactions feeding succinyl-CoA (YS), all relative to TCA cycle flux. The package
calculates all 13C isotopomers of all relevant intermediates. To evaluate the model by Petersen et
al., a 3 – carbon gluconeogenic precursor pool (alanine + lactate) was assumed enriched in the 3
position. Unlabeled carbon skeletons were allowed to enter via the succinate pool (YS > 0).
Both pyruvate kinase flux (PK) and pyruvate carboxylase flux (YPC) were allowed to vary. The
fraction of alanine and glucose molecules enriched in C2 was calculated at steady state.
Petersen et al. (22) reported that pyruvate cycling relative to pyruvate carboxylase flux was
equal to ([[2-13C] alanine]/[alanine]) ÷ ([[2-13C] glucose]/[glucose]). In tcaSIM, this flux ratio is
PK/YPC. The ratio of 13C fractional enrichment in position 2 of alanine relative to 13C fractional
enrichment in glucose is ala2f/glc2f. Across a wide range of YS, PK and YPC, tcaSIM found
that ala2f/glc2f was equal to PK/YPC as predicted by Petersen et al. (22).

Jin et al. Glucose overproduction in hyperthyroid and ZDF rats page 20
REFERENCES 1. Aiston S, Peak M, and Agius L. Impaired glycogen synthesis in hepatocytes from Zucker fatty
fa/fa rats: the role of increased phophorylase activity. Diabetologia 43: 589-597, 2000.
2. Bergmeyer HU. Methods of Enzymatic Analysis (2nd ed). Vol. 3. New York: Academic Press
1974, p.1127-1131, 1196-1201, 1492-1495, 1585-1589.
3. Bradford MM. A rapid and sensitive method for the quantitation of microgram quantities of
protein utilizing the principle of protein-dye binding. Anal Biochem 72: 248-254, 1976.
4. Chang G-G, Huang T-M, Wang J-K, Lee H-J, Chou W-Y, and Meng C-L. Kinetic
mechanism of the cytosolic malic enzyme from human breast cancer cell line. Arch Biochem
Biophys 296: 468-473, 1992.
5. Cohen SM, Glynn P, and Shulman RG. 13C NMR study of gluconeogenesis from labeled
alanine in hepatocytes from euthyroid and hyperthyroid rats. Proc Natl Acad Sci USA 78: 60-64,
1981.
6. Ekberg K, Landau BR, Wajngot A, Chandramouli V, Efendic S, Brunengraber H, and
Wahren J. Contributions by kidney and liver to glucose production in the postabsorptive state
and after 60 h of fasting. Diabetes 48:292-298, 1999.
7. Freidmann B, Goodman Jr. EH, Saunders HL, Kostos V, and Weinhouse S. An estimation of
pyruvate recycling during gluconeogenesis in the perfused rat liver. Arch Biochem Biophys 143:
566-578, 1971
8. Gerich JE, Meyer C, Woerle HJ, and Stumvoll M. Renal gluconeogenesis: its importance in
human glucose homeostasis. Diabetes Care 24:382-391, 2001.
9. Hsu WH, and Hummel SK. Xylazine-induced hyperglycemia in cattle: a possible involvement
of α2-adrenergic receptors regulating insulin release. Endocrinology 109: 825-829, 1981.

Jin et al. Glucose overproduction in hyperthyroid and ZDF rats page 21 10. Hundal RS, Krssak M, Dufour S, Laurent D, Lebon V, Chandramouli V, Inzucchi SE,
Schumann WC, Petersen KF, Landau BR, and Shulman GI. Mechanism by which metformin
reduces glucose production in type 2 diabetes. Diabetes 49: 2063-2069, 2000.
11. Ichai C, El-Mir MY, Nogueira V, Piquet M-A, Chauvin C, Fontaine E, and Leverve XM.
Exogenous Mg-ATP induces a large inhibition of pyruvate kinase in intact rat hepatocytes.
J Biol Chem 276: 6398-6403, 2001.
12. Jakovcic S, Swift HH, Gross NJ, and Rabinowitz M. Biochemical and stereological analysis of
rat liver mitochondria in different thyroid states, J Cell Biol 77: 887-901, 1978.
13. Jeffrey FM, Rajagopal A, Malloy CR, and Sherry AD. 13C-NMR: a simple yet comprehensive
method for analysis of intermediary metabolism. Trends Biochem Sci 16:5-10, 1991.
14. Jin ES, Jones JG, Merritt M, Burgess SC, Malloy CR, and Sherry AD. Glucose production,
gluconeogenesis, and hepatic tricarboxylic acid cycle fluxes measured by nuclear magnetic
resonance analysis of a single glucose derivative. Anal Biochem 327: 149-155, 2004.
15. Jones JG, Carvalho RA, Franco B, Sherry AD, and Malloy CR. Measurement of hepatic
glucose output, Krebs cycle, and gluconeogenic fluxes by NMR analysis of a single plasma
glucose sample. Anal Biochem 263: 39-45, 1998.
16. Jones JG, Merritt M, and Malloy CR. Quantifying tracer levels of 2H2O enrichment from
microliter amounts of plasma and urine by 2H-NMR. Magn Reson Med 45: 156-158, 2001.
17. Jones JG, Naidoo R, Sherry AD, Jeffrey FM, Cottam GL, and Malloy CR. Measurement of
gluconeogenesis and pyruvate cycling in the rat liver: a simple analysis of glucose and glutamate
isotopomers during metabolism of [1,2,3-13C3]propionate. FEBS lett 412: 131-137, 1997.
18. Kunert O, Stingl H, Rosian E, Krssak M, Bernroider E, Seebacher W, Zangger K, Staehr P,
Chandramouli V, Landau BR, Nowotny P, Waldhausl W, Haslinger E, and Roden M.
Measurement of fractional whole-body gluconeogenesis in humans from blood samples using 2H
nuclear magnetic resonance spectroscopy. Diabetes 52: 2475-82, 2003.

Jin et al. Glucose overproduction in hyperthyroid and ZDF rats page 22 19. Magnusson I, Rothman DL, Katz LD, Shulman RG, and Shulman GI. Increased rate of
gluconeogenesis in type II diabetes mellitus. A 13C nuclear magnetic resonance study. J Clin
Invest 90: 1323-1327, 1992.
20. McCune SA, Durant PJ, Jenkins PA, and Harris RA. Comparative studies on fatty acid
synthesis, glycogen metabolism, and gluconeogenesis by hepatocytes isolated from lean and
obese Zucker rats. Metabolism 30: 1170-1178, 1981.
21. Moriwaki T, and Landau BR. Sources of the carbon atoms of liver glycogen formed by cortisol
administration to rats in vivo. Endocrinology 72: 134-145, 1963.
22. Petersen KF, Blair JB, and Shulman GI. Triiodothyronine treatment increases substrate cycling
between pyruvate carboxylase and malic enzyme in perfused rat liver. Metabolism 44: 1380-
1383, 1995.
23. Petersen KF, Cline GW, Blair JB, and Shulman GI. Substrate cycling between pyruvate and
oxaloacetate in awake normal and 3,3'-5-triiodo-L-thyronine-treated rats. Am J Physiol 267:
E273-E277, 1994.
24. Petersen KF, Laurent D, Rothman DL, Cline GW, and Shulman GI. Mechanism by which
glucose and insulin inhibit net hepatic glycogenolysis in humans. J Clin Invest 101: 1203-1209,
1998.
25. Petersen KF, Price T, Cline GW, Rothman DL, and Shulman GI. Contribution of net hepatic
glycogenolysis to glucose production during the early postprandial period. Am J Physiol 270:
E186-E191, 1996.
26. Rognstad R. Futile hydrogen cycling in liver cells from triiodothyronine treated rats.
Biochem Biophys Res Commun 78: 881-888, 1977.
27. Roodyn DB, Freeman KB, and Tata JR. The stimulation by treatment in vivo with tri-
iodothyronine of amino acids incorporation into protein by isolated rat-liver mitochondria.
Biochem J 94: 628-641, 1965.

Jin et al. Glucose overproduction in hyperthyroid and ZDF rats page 23 28. Saadatian M, Peroni O, Diraison F, and Beylot M. In vivo measurement of gluconeogenesis in
animals and humans with deuterated water: a simplified method. Diabetes Metab 26:202-209,
2000.
29. Terrettaz J. and Jeanrenaud B. Contribution of glycerol and alanine to basal hepatic
glucose production in the genetically obese (fa/fa) rat. Biochem J 270: 803-807, 1990.
30. Triscari J, Bryce GF, and Sullivan AC. Metabolic consequences of fasting in old lean and
obese Zucker rats. Metabolism 29: 377-385, 1980.
31. van de Werve G, and Jeanrenaud B. The onset of liver glycogen synthesis in fasted-refed lean
and genetically obese (fa/fa) rats. Diabetologia 30: 169-174, 1987.
32. Verhoeven AJ, Kamer P, Groen AK, and Tager JM. Effects of thyroid hormone on
mitochondrial oxidative phosphorylation. Biochem J 226: 183-192, 1985.

Jin et al. Glucose overproduction in hyperthyroid and ZDF rats page 24 Table 1. Biochemical analysis of plasma and liver tissue from control, ZDF and T3-treated rats.
Control ZDF (fa/fa) T3-treated
Plasma glucose (mM) 6.2 ± 1.0 17.6 ± 0.9* 8.7 ± 1.6* #
Liver glycogen (µmol glucosyl unit/gww) 1.8 ± 0.5 112.7± 9.3* 1.7 ± 0.2#
Liver lactate (µmol /gww) 1.0 ± 0.2 3.8 ± 0.4* 1.7 ± .2* #
Mitochodrial protein (mg/gww) 13.3 ± 2.9 10.7 ± 4.2 25.5 ± 4.7#
Cytosolic malate (µmol /gww) 0.6 ± 0.1 1.1 ± 0.5* 0.5 ± 0.3
Mitochondrial pellet volume (mL/gww) 0.19 ± 0.06 0.19 ± 0.07 0.35 ± 0.06* #
Malic enzyme activity (mU/mg protein) 2.2 ± 0.4 6.3 ± 2.9* 3.1 ± 0.4* #
Pyruvate kinase activity (mU/mg protein) 41.6 ± 6.1 85.5 ± 26.9* 29.8 ± 5.3* #
* Significantly different compared to control rats (p < 0.05).
# Significantly different compared to ZDF rats (p < 0.05).

Jin et al. Glucose overproduction in hyperthyroid and ZDF rats page 25 . Table 2. Relative and absolute fluxes (µmol/min/kg) through key reactions in glucose production.
Glucose production was measured by detection of [3,4-13C2]glucose by 13C NMR.
Relative metabolic fluxes were determined by 2H (H2, H5 and H6s) and 13C NMR (C2
resonance) analysis of MAG derived from plasma glucose of controls (n=6), T3-treated
rats (n=6), and ZDF rats (n=7). Abbreviations: CS, citrate synthase; PK, pyruvate kinase;
ME, malic enzyme; PEP, phosphoenol pyruvate; PEPCK, phosphoenol pyruvate
carboxykinase. Notations for fluxes, v1 – v7, are illustrated in Figure 4.
Control ZDF (fa/fa) T3-treated
Glucose production (v1, µmol/kg/min) 40.4 ± 2.9 86.5 ± 14.6* 94.5 ± 21.4*
Fractional sources of plasma glucose
Glycogen 0.03 ± 0.02 0.47 ± 0.04* 0.03 ± 0.05#
Glycerol 0.14 ± 0.04 0.13 ± 0.04 0.17 ± 0.06
PEP 0.83 ± 0.03 0.40 ± 0.04* 0.79 ± 0.08#
Fluxes relative to citrate synthase
gluconeogenesis/CS, v4/v7 1.46 ± 0.32 1.21 ± 0.27 0.60 ± 0.14* #
v5/v7 3.19 ± 0.44 2.68 ± 0.27* 2.46 ± 0.27*
v6/v7 4.65 ± 0.62 3.89 ± 0.45* 3.06 ± 0.38* #
Derived fluxes (µmol/kg/min)
Glycogenolysis, v2 1.0 ± 0.8 40.7 ± 8.7* 2.9 ± 4.0
Glycerol → glucose, v3 11.5 ± 3.5 22.2 ± 5.1* 34.2 ± 17.5*
PEP → glucose, v4 67.3 ± 5.6 69.3 ± 15.2 148.9 ± 31.9* #
PEP / PYR → OAA / MAL, v5 154.4 ± 43.4 159.9 ± 52.0 646.1 ± 203.6* #
OAA / MAL → PEP / PYR, v6 221.7 ± 47.6 229.2 ± 65.4 795.0 ± 232.6* #
OAA → citrate, v7 49.1 ± 16.8 60.0 ± 20.4 268.3 ± 106.0* #
* Significantly different compared to control rats (p < 0.05). # Significantly different compared to ZDF rats (p < 0.05).
Jin et al. Glucose overproduction in hyperthyroid and ZDF rats page 26
FIGURE LEGENDS
Figure 1. 13C NMR spectrum of MAG from plasma glucose. The chemical structure and expanded
spectrum of MAG from a control rat is shown in the top panel. The spectrum around
carbons 3 and 4 are further expanded and show typical results from a control rat, a T3-
treated rat, and a ZDF rat (bottom). Peak assignments for carbons 2 – 6 are shown plus
the two 13C natural abundance methyl resonances (M1 and M2). In the bottom panel,
arrows indicate doublets of carbon 3 and carbon 4 due to J34 in [3,4-13C2]glucose.
Figure 2. 2H NMR spectra of MAG derived from plasma glucose. Results from a control rat (a), a
T3-treated rat (b), and a ZDF rat (c) are shown. The relatively low enrichment in H5 of
glucose from a ZDF rat in panel c indicates that a significant fraction of plasma glucose
was derived from glycogenolysis.
Figure 3. (a) Time course of peak ratios (D12/D23 and Q/D23) of C2 resonances from 13C NMR
spectra of MAG derived from plasma glucose of Sprague-Dawley rats. Rats (24-hr
fasted) received an intraperitoneal injection of [U-13C3]propionate/2H2O and they were
sacrificed at different time points ranging from 60 min to 150 min. (b) C2 resonances
from 13C NMR spectra of MAG derived from plasma glucose of a control (top), a T3-
treated rat (middle), and a ZDF rat (bottom). Note the bigger individual peak of D23 than
that of Q in C2 resonance of a T3-treated rat. In the insets, D12, doublet from coupling of
carbon 1 with carbon 2; D23, doublet from coupling of carbon 2 with carbon 3; Q, doublet
of doublets, or quartet, arising from coupling of carbon 2 with both carbons 1 and 3; S,
singlet resonance.

Jin et al. Glucose overproduction in hyperthyroid and ZDF rats page 27
Figure 4. Fluxes in the metabolic network supporting glucose production; glycogenolysis,
gluconeogenesis from glycerol, and gluconeogenesis from PEP of controls (gray-filled),
ZDF rats (open), and T3-treated rats (black-filled). G-6-P, glucose 6-phosphate; F-6-P,
fructose 6-phosphate, FBP, fructose-1,6-bisphosphate; G3P, glyceradehyde 3-
phosphate; DHAP, dihydroxyacetone phosphate; PEP, phosphoenol pyruvate; OAA,
oxaloacetate; SUCC, succinyl-CoA; PYR, pyruvate; MAL, malate; FUM, fumarate. In the
presence of 2H2O, glucose released from the liver may be enriched at positions H2 (G-6-
P ↔ F-6-P), H5 (G-3-P ↔ DHAP), and H6s, (OAA ↔ MAL), depending upon the source
of gluconeogenic substrate.
Figure 5. 2H NMR spectrum of MAG derived from liver glycogen of a ZDF rat. In these studies the
animal was injected with 2H2O and [U-13C3]propionate. After 90 min, the animal was
anesthetized and killed to obtain hepatic glycogen. Seven hydrogens from MAG (derived
from glucose hydrolyzed from glycogen) and hydrogens of methyl groups (natural
abundance 2H) of MAG are shown. The 2H enrichment in position 2 was calculated from
the natural abundance 2H signal in the methyl groups of MAG (see Figure 1 for structure).
Jin et al. Glucose overproduction in hyperthyroid and ZDF rats page 28
H
H(S) C
C
H(R)
H
H
6
5
4
3 M1
M2
OH
OH
OHO
O
OH
H1
2
Q
C2
C4 C3
C5
C6
M1M2
80 70 60 50 40 30 ppm
ZDF (fa/fa)T3Control
C4 C3C4 C3 C4 C3
H
H(S) C
C
H(R)
H
H
6
5
4
3 M1
M2
OH
OH
OHO
O
OH
H1
2
Q
C2
C4 C3
C5
C6
M1M2
80 70 60 50 40 30 ppm
ZDF (fa/fa)T3Control
C4 C3C4 C3 C4 C3
Figure 1

Jin et al. Glucose overproduction in hyperthyroid and ZDF rats page 29
H2 H4 H5H1
H3H6R
H6S
a.
b.
c.
6.0 5.0 4.0 ppm
H2 H4 H5H1
H3H6R
H6S
a.
H2 H4 H5H1
H3H6R
H6S
a.
b.b.b.
c.c.
6.0 5.0 4.0 ppm
Figure 2

Jin et al. Glucose overproduction in hyperthyroid and ZDF rats page 30
a.
T3
D12
D23
D12
Q Q Q Q
Control
S
ZDF
85.8 ppm
b.
0
1
2
3
4
5
6
7
30 60 90 120 150
D 12/D 23
Q /D 23
0 60 90 120 150
Time (min)
Rat
io (D
12/D
23 o
r Q/D
23) 7
6543210
D23
a.
T3
D12
D23
D12
Q Q Q Q
Control
S
ZDF
85.8 ppm
b.
0
1
2
3
4
5
6
7
30 60 90 120 150
D 12/D 23
Q /D 23
0 60 90 120 150
Time (min)
Rat
io (D
12/D
23 o
r Q/D
23) 7
654321001
2
3
4
5
6
7
30 60 90 120 150
D 12/D 23
Q /D 23
0 60 90 120 150
Time (min)
Rat
io (D
12/D
23 o
r Q/D
23) 7
6543210
D23
Figure 3

Jin et al. Glucose overproduction in hyperthyroid and ZDF rats page 31
0
200
400
600
800
1000
1200
v1 v2 v3 v4 v5 v6 v7
µmol
·kg
-1·m
in-1
v4
v2 v3
v7
v1
G3P
glycogen
glucose
FBP
glycerol
DHAP
gluconeogenicsubstrates
(propionate, etc.)
G-6-P
F-6-P
FUM / SUCC
OAA / MALPEP / PYR
v5
v6
alanine,lactate
pyruvate
0
200
400
600
800
1000
1200
v1 v2 v3 v4 v5 v6 v7
µmol
·kg
-1·m
in-1
v4
v2 v3
v7
v1
G3P
glycogen
glucose
FBP
glycerol
DHAP
gluconeogenicsubstrates
(propionate, etc.)
G-6-P
F-6-P
FUM / SUCC
OAA / MALPEP / PYR
v5
v6
v5
v6
alanine,lactate
pyruvate
Figure 4

Jin et al. Glucose overproduction in hyperthyroid and ZDF rats page 32
H2 ~ 0.27% enriched
– CH 3– CH 3
(natural abundance)
6 5 4 1
H1H3
H4H5
H6rH6s
H2 ~ 0.27% enriched
– CH 3– CH 3
(natural abundance)
6 5 4 1
H1H3
H4H5
H6rH6s
H2 ~ 0.27% enriched
– CH 3– CH 3
(natural abundance)
6 5 4 1
H1H3
H4H5
H6rH6s
H2 ~ 0.27% enriched
– CH 3– CH 3
(natural abundance)
6 5 4 1
H1H3
H4H5
H6rH6s
ppm ppm ppm ppm
Figure 5